

Abstract

In this work, CdS nanoparticles were grown on top of a hematite (α-Fe2O3) film as photoanodes for the photoelectrochemical water splitting. Such type of composition was chosen to enhance the electrical conductivity and photoactivity of traditionally used bare hematite nanostructures. The fabricated thin film was probed by various physicochemical, electrochemical, and optical techniques, revealing high crystallinity of the prepared nanocomposite and the presence of two distinct phases with different band gaps. Furthermore, photoassisted water splitting tests exhibit a noteworthy photocurrent of 0.6 mA/cm2 and a relatively low onset potential of 0.4 V (vs reversible hydrogen electrode) for the composite electrode. The high photocurrent generation ability was attributed to the synergistic interplay between conduction and valence band (VB) levels of CdS and α-Fe2O3, which was further interpreted by J–V curves. Finally, electrochemical impedance spectroscopy investigation of the obtained films suggests that the photogenerated holes could be transferred from the VB of α-Fe2O3 to the electrolyte more efficiently in the hybrid nanostructure.
Introduction
The requirement of continuously growing energy demand can be compensated by means of utilizing solar energy. After continuous efforts, one of the major breakthroughs has been to harness solar photons to split water. The process commonly known as photoelectrochemical (PEC) water splitting is a compelling approach of harvesting solar energy into chemical energy stored as hydrogen in an environmentally friendly manner. For the advancement of such systems, semiconductor nanostructures have gained wide attention to develop cleaner energy conversion systems.1 It has been investigated that a material must confirm to a number of firm requirements for efficient photoassisted water splitting, which include (i) light absorption in visible region, (ii) efficient charge carrier separation and transportation, (iii) fast charge-transfer kinetics at the interface between liquid and solid, (iv) appropriate positions of the conduction and valence band (VB) energy levels with respect to required reaction potentials, and (v) respectable stability in aqueous solutions.1 Although such systems have been heavily investigated, a suitable candidate still does not exist, which can satisfy all of these conditions.2,3 Recent advances in nanoscience and electrochemistry have made significant strides toward developing a material capable of efficiently converting photons from sunlight into chemical fuels.4,5 In this concern, a number of semiconductors have been incorporated as photoelectrode materials for water splitting applications.6−8 Among them, hematite (α-Fe2O3) is one of the most suitable materials for photoanode,5,9−13 with an optical band gap of around 1.9–2.2 eV,14 for harvesting solar light, corresponding to a high theoretical STH (solar-to-hydrogen) conversion efficiency of 14–17%.15 However, practical STH conversion efficiencies of reported hematite photoanodes are considerably lower because of their very short excited-state lifetime (<10 ps),16 short hole diffusion length (≈2–4 nm),17 poor surface oxygen evolution reaction kinetics,18 and poor electrical conductivity (10–6 Ω–1 cm–1).19 In an attempt to alleviate these issues, various attempts have been made to develop unique nanostructures with hematite that are either doped or composited with materials of a similar band gap. CdS is a promising semiconductor with a band gap of about 2.4 eV; however, it suffers from photocorrosive effects in aqueous media. One of the ways to increase the stability of CdS is to couple it with a material of a similar band gap so as to create a homogeneous phase and facilitate fast charge transfer for catalyzing the water splitting reaction, thus increasing the photocurrent. For example, Wang et al. have decorated CdS nanoparticles with α-Fe2O3 and have found increased photocatalytic activity.20 Similarly, Zhu et al. have synthesized TiO2/CdS nanocomposites that have high activity toward methylene blue degradation under solar irradiation.21 Tang et al. have synthesized novel Fe2O3/CdS nanostructures for use in real-time PEC probing of Cu2+.22 However, to the best of our knowledge, no comprehensive study exists on the use of α-Fe2O3/CdS as a photoelectrode for water splitting, although there are a few studies on the use of composite heterojunction catalysts for the purpose of photoassisted degradation of organic compounds,23 which include p–n24 and n–n25 heterojunctions.
In the present work, a facile two-stage process has been utilized to deposit a thin film of α-Fe2O3/CdS composite over a fluorine-doped tin oxide (FTO)-coated glass electrode. Furthermore, the applicability of an as-designed thin film in PEC water splitting was extensively investigated by various techniques. Finally, several new insights on interfacial phenomenon and synergistic effects have been elucidated. To the best of our knowledge, we report for the first time the α-Fe2O3/CdS composite-based thin film as photoanodes for PEC water splitting. Moreover, the synergistic interplay between energy band levels of CdS and α-Fe2O3 has been demonstrated, which was supported and authenticated by J–V and impedance spectroscopic experiments.
Results and Discussion
The heterostructured α-Fe2O3/CdS thin film was deposited directly on an FTO glass substrate by a facile two-step method. In the first step, the hydrothermal reaction between FeCl3 and NaNO3 at 98 °C leaves a thin layer of α-Fe2O3 on the FTO glass substrate, and subsequent chemical bath sensitization by Cd(NO3)2 and Na2S solution in the second step forms α-Fe2O3/CdS assembly (Scheme 1). The as-synthesized α-Fe2O3/CdS thin film was characterized by various advanced characterization techniques such as ultraviolet–visible (UV–vis), scanning electron microscopy (SEM), transmission electron microscopy (TEM), atomic force microscopy (AFM), and so forth.
Scheme 1. Schematic Representation of Preparation of α-Fe2O3/CdS Thin Films.

Characterization of the α-Fe2O3/CdS Thin Film
Figure 1a–c shows the morphology of the as-obtained thin films, with pure α-Fe2O3 shown in Figure 1a and the α-Fe2O3/CdS composite depicted in Figure 1c. The α-Fe2O3/CdS thin film comprises a mesoporous hematite layer, on which “islands” of CdS nanoparticles are observed (Figure 1b). In the bare hematite thin film, only rodlike structures of 60–70 nm in width and ∼450 nm in length are observed. A similar structure, although more porous, with a reduced width of ∼40–50 nm is seen for the α-Fe2O3/CdS nanocomposite. The average width of these islands is estimated to be around 1.2 μm (Figure 1c). It can be concluded from the SEM observations that the sensitization process with CdS improves the active surface area of the as-prepared electrodes (also verified by AFM analysis, Figure S1 and Table S1).
Figure 1.

FESEM images of thin films: (a) α-Fe2O3 only, (b) α-Fe2O3/CdS, (c) nano-islands formed on top of the base layer for the nanocomposite, and (d,e) HRTEM images obtained at different magnifications.
High-resolution transmission electron microscopy (HRTEM) images of the composite film are seen in Figure 1d,e, whereas the TEM images are shown in Figure 2. Clusters of nanoparticles assembled on the substrate, with an outwardly rodlike architecture in the HRTEM images, which is in agreement with the SEM observations. Upon further magnification, small islands of bloblike structures are identified, which may be representative of agglomeration in the sample. Multiple such clusters are found, and upon further magnification, it is observed that fringes are seen with good distribution of nanoparticles. Moreover, the presence of randomly oriented fringes overlapping each other is indicative of polycrystalline nature of the composite material (Figure 2).27 The representative selected area electron diffraction (SAED) pattern as shown in the inset of Figure 2a shows multiple bright spots with prominent ringlike shape. The presence of bright spots in a concentric ringlike shape indicates a highly crystalline nature of the composite. However, because of the nature of the nanocomposite, there is an overlap between the planes of the constituents of the nanocomposite.27Figure 2b,d shows the magnified views of areas highlighted in Figure 2a,c. Finely oriented fringes are seen, and the interplanar spacings were determined to be 0.221 and 0.350 nm. The constituents of the nanocomposite are further confirmed by means of energy-dispersive spectrometry (EDS) measurement, which is shown in Figure S2. Furthermore, the film thickness is found to be between 400 and 500 nm by analyzing the height of a nanoparticle cluster in cross-sectional TEM images. High-angle annular dark-field (HAADF) images are shown in Figure 3. It is observed that all constituents are clearly visible and well-dispersed in the composite. CdS nanoparticles are dispersed evenly over the surface of the α-Fe2O3 nanostructures, thus forming an interfacial junction. The X-ray diffraction (XRD) data were indexed to the characteristic peaks, and based on indexing, four phases were identified in the sample: α-Fe2O3 (JCPDS 33-0664), cubic CdS (JCPDS 80-0019), hexagonal CdS (JCPDS 41-1049), and SnO2 (JCPDS 41-1445). A strong (110) diffraction is obtained compared with other planes for hematite, indicating that hematite nanostructures are oriented along the (110) direction on the FTO substrate. This result is largely consistent with the previous studies.28 On the other hand, one incidence of cubic CdS is encountered while the remaining diffraction peaks correspond to (004) and (204) planes (Figure 4).
Figure 2.

(a,c) TEM images of the α-Fe2O3/CdS nanocomposite at different magnifications. Inset of (a) shows the SAED pattern of the composite films. (b,d) Magnified views of the marked areas of (a,c, respectively) with labeled interplanar distances.
Figure 3.

(a–f) HAADF images and color mapping of elements present in the nanocomposite.
Figure 4.

XRD spectrum of as-obtained α-Fe2O3/CdS thin films on the FTO glass substrate.
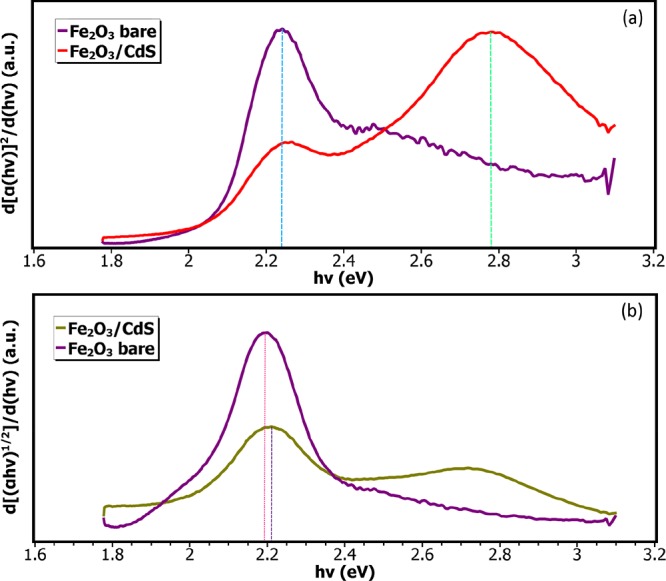
The absorption spectrum for pure α-Fe2O3 shows an absorption edge at about 580 nm (Figure 5), which corresponds roughly to a band gap of 2.2 eV, whereas CdS shows an absorption edge at around 442 nm, corresponding to a band gap of 2.7 eV. A representative band diagram based on commonly reported band gap values for α-Fe2O3 and CdS is shown in Figure 6, based on the contemporary literature20,29 as well as from the UV–vis results. It is to be noted that α-Fe2O3 is widely reported to be an indirect band gap semiconductor,30−32 whereas CdS is generally accepted to be a direct band gap semiconductor.33−35 Hence, any heterojunction or composite would be assumed to have both direct and indirect electronic transitions. To evaluate the presence of direct or indirect band gaps, Tauc plots for both direct and indirect band gaps were compared and computed using the following equation
where A is a proportionality constant, h is Planck’s constant, ν is the frequency, and Eg refers to the band gap of the material.
Figure 5.

UV–vis absorption spectra of bare α-Fe2O3 and α-Fe2O3/CdS thin films.
Figure 6.

Suggested band diagram at the interface of α-Fe2O3/CdS nanostructures.
The value of n depends on the type of transition. They are given as 2, 1/2, 3, and 3/2 corresponding to allowed direct, allowed indirect, disallowed direct, and disallowed indirect transitions, respectively. The Tauc plot derivatives for direct and indirect transitions are presented in Figure 7a,b. It is found that the composite material comprises both a direct and an indirect band gap as a result of synergistic effect between the two nanoparticle systems. On the basis of goodness of fit of derivative of the Tauc plot and linearity of the plot itself, it is concluded that the composite material comprises both a direct and an indirect band gap corresponding to CdS and α-Fe2O3 at 2.78 and 2.18 eV, respectively, which are in good agreement with the values reported previously.30−36 Moreover, it is expected that the combination of direct and indirect transitions will help increase the photoactivity and hence the photocurrent of the PEC device. Additionally, no absolute changes were observed in the indirect band gap of the nanocomposite film with respect to the pure hematite films. Thus, it can be concluded that the addition of CdS does not create intermediate levels in the hematite crystal structure, albeit it adds its own energy levels because of the formation of heterojunction.
Figure 7.
Tauc plot derivative for (a) direct band gap transitions and (b) indirect band gap transitions.
Current Density–Voltage Characterization of a PEC Cell
Current density–voltage measurements were carried out in a PEC cell comprising an Ag/AgCl reference electrode, a platinum counter electrode, and an α-Fe2O3/CdS working electrode with 1 M NaOH + 0.1 M Na2S chosen as the working electrolyte to minimize the possibility of hole–electron recombinations at surface trap states.37 The photocurrent density obtained under incident light of 1000 W/m2 incident solar radiation is given in Figure 8. The photocurrent for the bare hematite sample is negligible, as has been verified independently in various other reports.28 However, the nanocomposite α-Fe2O3/CdS shows a photocurrent of 0.6 mA/cm2 at −0.08 V versus Ag/AgCl, corresponding to a voltage of 0.92 V versus reversible hydrogen electrode (RHE) . This value of potential is lower than the theoretical bias voltage required for water splitting, which is otherwise reported earlier by Abe et al.38 and confirms that the reaction is one of the solar energy conversions.39 Moreover, the onset potential for photocurrent is around −0.6 V versus Ag/AgCl or 0.4 V versus RHE. This relatively fast onset may be attributed to faster water oxidation kinetics because of the synergistic effect of CdS and α-Fe2O3 nanostructures40 and is one of the lowest reported onset potentials in photoelectrodes comprising α-Fe2O3 as one of the constituents,41,42 barring very few reports on hematite-based photoanodes43,44 and a few on photoelectrodes based on other materials.38,39,45 The relative performance of the α-Fe2O3/CdS electrodes may be attributed to an increase in absorption in the visible light range and the presence of fast charge separation kinetics at the interface of the two materials because of proper conduction band (CB) and VB alignment between the two phases in the electrode.46 A comparison of the current–voltage characteristics and onset potential of our work with the contemporary literature has been made, as shown in Table 1.
Figure 8.

J–V curves of α-Fe2O3/CdS and bare α-Fe2O3 under solar illumination.
Table 1. Comparison of Photocurrent and Onset Potential with Contemporary Literaturea,b,c.
| material for active electrode | preparation method | substrate | electrolyte | maximum photocurrent density | onset potential vs RHE (V) | reference |
|---|---|---|---|---|---|---|
| WO3/α-Fe2O3 | sputter deposition (high vacuum, argon atmosphere)* | FTO | 0.5 M Na2SO4 | 0.84 mA/cm2 (at 1.4 V vs RHE) | 0.43 | (41) |
| Pt-doped α-Fe2O3 | electrodeposition* | FTO | 1 M NaOH | 1.43 mA/cm2 (at 1.4 V vs RHE) | 1.0 | (43) |
| Fe2O3/Ti:ZnFe2O4 (heterojunction) | hydrothermal | FTO | 1 M NaOH | 0.2 mA/cm2 (at 1.4 V vs RHE) | 0.9 | (65) |
| Ti-doped α-Fe2O3 | hydrothermal + drop cast | FTO | 1 M NaOH | 1.2 mA/cm2 (at 1.23 V vs RHE) | 0.95 | (66) |
| Ti-doped α-Fe2O3 | thermal evaporation | FTO | 1 M KOH | 0.585 mA/cm2 (at 1.4 V vs RHE) | ∼0.85 | (67) |
| Co-doped α-Fe2O3/MgFe2O4 (heterojunction) | hydrothermal + wet impregnation | FTO | 1 M NaOH | 1.28 mA/cm2 (at 1.4 V vs RHE) | 0.43 | (68) |
| SrTiO3/Fe2O3 (heterojunction) | spin coating | FTO | 0.2 M Na2SO4 | 52.7 μA/cm2 (at 0.94 V vs RHE) | (69) | |
| Si-doped α-Fe2O3 | APCVD | FTO | 1 M NaOH | 1.45 mA/cm2 (at 1.23 V vs RHE) | 0.8 | (70) |
| α-Fe2O3/graphene/BiV1–xMoxO4 core/shell (heterojunction) | hydrothermal/exfoliation + spin coating | Ti | 0.01 M Na2SO4 | 1.97 mA/cm2 (at 1.6 V vs RHE) | 0.27 | (71) |
| Zn-doped α-Fe2O3 (p-type) | electrodeposition | FTO | 1 M NaOH | 40.4 μA/cm2 (at 0.5 V vs RHE) | 1.3 | (72) |
| Si-doped α-Fe2O3 | electrodeposition + microwave annealing | FTO | 1 M NaOH | 0.45 mA/cm2 (at 1.55 V vs RHE) | 0.85 | (73) |
| α-Fe2O3/CdS | hydrothermal + dipcoating | FTO | 1 MNaOH + 0.1 MNa2S | 0.6mA/cm2(at 0.92 V vs RHE) | 0.4 | present work |
* = uses high-temperature annealing (700 °C) in the experimental procedures, which may result in improved photocurrents because of Sn diffusion from the substrate into α-Fe2O3.5
Conversion to RHE scale performed wherever necessary.
APCVD = atmospheric pressure chemical vapor deposition.
The same J–V experiments were repeated for the α-Fe2O3/CdS electrodes in an electrolyte containing 1 M NaOH in the absence of Na2S, and it was found that the presence of Na2S has a positive effect of cathodically shifting the onset potential by about 200 mV and the peak potential by around 80 mV, as is evident in Figure S3, which shows a comparison of current density–voltage curves obtained with only 1 M NaOH and with 1 M NaOH + 0.1 M Na2S as the electrolyte. However, the photocurrent remains unaffected, indicating that there is no influence of the presence of Na2S in the electrolyte on the maximum attainable catalytic activity at the potential range in which photocurrent is observed in our experiment.47,48 The lowered onset potential in the presence of Na2S is attributed to the reduction of hole–electron recombination in the presence of Na2S.37,47
To understand the semiconductor characteristics of the composite electrode, Mott–Schottky analysis was performed and the results are presented in Figure 9. It is found that the flat band potential is around 0.02 V versus Ag/AgCl, which is anomalous and may be related to charging of the surface states on the electrode material.18 The slope of the Mott–Schottky plot is negative, which generally indicates p-type conductivity of the semiconductor.49 However, this is sometimes erroneous and is attributed to the formation of a very thin surface charge layer caused by ionic diffusion, as discovered by Macaluso’s group in the case of ZnO films grown on the InP substrate.50 The dominant n-type conductivity of the composite is strengthened by mainly anodic photocurrents as is observed in the J–V curves presented earlier.51 Furthermore, a flat region at higher positive bias voltage indicates the presence of increased charge carriers at the interface,52 as a result of surface-state charging,53 which supports the earlier statement of possible formation of a surface charge layer.
Figure 9.

Mott–Schottky plot for the α-Fe2O3/CdS electrode.
The hypothetical half-cell STH (HC-STH) conversion efficiency was calculated for the three-electrode system utilized for the PEC measurements using the following formula as suggested by Hisatomi et al.54
Substituting for the values of EO2/H2O (which is 1.23 V) and ERHE (0.87 V), wherein we get a photocurrent of 0.58 mA/cm2, and assuming Psun = 100 mW/cm2, we thus get HC-STH in percentage as 0.20% at 0.87 V versus RHE for the α-Fe2O3/CdS system (Figure 10). Although no studies currently exist on the HC-STH values of α-Fe2O3/CdS composite electrode-based PEC systems, the value of HC-STH is comparable with at least one other study.55
Figure 10.

HC-STH for α-Fe2O3/CdS electrodes in a PEC system comprising 1 M NaOH + 0.1 M Na2S electrolyte and a 100 mW/cm2 solar illumination source. The electrode was lit for at least 1 min before readings were taken to ensure stability.
EIS Analysis of the PEC Cell
The electrochemical impedance spectroscopy (EIS) of the as-prepared α-Fe2O3/CdS nanocomposite films is shown in Figure 11 under dark and under illumination along with the EIS spectrum for bare α-Fe2O3 electrode provided for comparison. The ac response of the PEC cell was modeled based on a serial-layer model of two-component ceramics, which was first implemented for solar water splitting by Shen et al.56 The obtained EIS data are presented as a Nyquist plot comprising two semicircles and modeled as per a simple resistor–capacitor (RC)-element-based circuit shown in the inset of Figure 11. According to the model proposed by Shen et al.,56 the smaller time constant (t = RC) represents the space charge layer inside of the semiconductor, whereas the larger time constant represents interfacial processes at the electrode–electrolyte interface.
Figure 11.

Comparison of EIS of obtained films of α-Fe2O3 and α-Fe2O3/CdS with and without solar illumination. (a) Full range with boxed region in high frequency range. (Inset) Equivalent circuit utilized for fitting EIS data. (b) Magnification of high frequency portion of (a).
The circuit diagram as shown in the inset of Figure 11 is represented by the following equation
where RSC and CSC represent the contributions from the space charge region of the semiconductor, whereas Rint and Cint represent the contributions due to processes at the electrode–electrolyte interface.
The values of fitting parameters of EIS data are shown in Table 2, fitted as per the circuit diagram shown in Figure 11. The value of Rser includes contributions from connecting wires as well as the resistance of the FTO glass substrate. On the basis of the EIS fitting results, it is seen that the interfacial resistance decreases under illumination as compared to under dark for the composite electrode. Furthermore, both the interfacial and the space charge resistances are decreased for the α-Fe2O3/CdS composite electrode, compared with the bare α-Fe2O3 electrode, further made clear by closely examining the high frequency portion of the impedance spectra (Figure 11b). This can be explained by the formation of heterojunction at the interface of CdS and α-Fe2O3. Because the VB of CdS is lower than that of α-Fe2O3, any electrons generated at the CB of CdS would be transferred to the CB of α-Fe2O3. This leads to an increase in carrier concentration upon photoexcitation, which increases the photoconductivity of the composite. The decrease in interfacial resistance may be attributed to improved ionic conductivity because of the addition of CdS.57,58 An increase in capacitance is observed for both components because the electromagnetic field created by the motion of charge carriers creates a capacitance at the surface of the α-Fe2O3/CdS nanostructures.59
Table 2. EIS Fitting Parameters as per Equivalent Circuit.
| parameters | α-Fe2O3/CdS (in dark) | α-Fe2O3/CdS (in light) | α-Fe2O3 (bare) |
|---|---|---|---|
| Rser (Ω) | 23.838 | 23.733 | 22.184 |
| RSC (Ω) | 20.8243 | 20.70 | 54.401 |
| CSC (F) | 8.241 × 10⁻⁷ | 9.036 × 10⁻⁷ | 6.8423 × 10⁻⁷ |
| Rint (Ω) | 216.457 | 156.127 | 423.148 |
| Cint (F) | 8.6705 × 10⁻⁵ | 1.05311 × 10⁻⁴ | 3.9565 × 10⁻⁵ |
The rationale for selecting two RC elements in the circuit is justified by the Bode plots of real and imaginary parts of complex impedance (Figure 12), which clearly display two peaks corresponding to two time constants in the electrical impedance behavior of the PEC system. Furthermore, the Bode plots reconfirm the observations made through the Nyquist plot, wherein the difference between the two plateaus observed in Figure 12a is directly proportional to the diameter of the complex plane semicircle in the Nyquist plot.60 Furthermore, Figure 12a confirms that the polarization resistance is lower for α-Fe2O3/CdS heterostructures in comparison with bare α-Fe2O3 electrode and is further lowered by illumination.61,62 The polarization resistance is directly correlated with charge-transfer and space charge resistance by various studies.63,64
Figure 12.

Bode plots of (a) real and (b) imaginary parts of complex impedance versus frequency for α-Fe2O3 and α-Fe2O3/CdS electrodes (with and without illumination).
The results obtained here in the EIS analysis are thus consistent with the increase in photocurrent, the reduction in charge transfer and interfacial resistance, and enhanced properties because of the synergistic effect, which is also seen in the current–voltage curve, presented earlier.
Conclusions
In summary, the α-Fe2O3/CdS heterostructure was fabricated on the FTO glass substrate using a facile two-stage method with only one step of heat treatment to improve upon some of the shortcomings of the base materials. The resultant composite is highly crystalline and stable under standard testing conditions for PEC water splitting. A photocurrent of 0.6 mA/cm2 at 0.92 V versus RHE is observed with HC-STH efficiency of 0.20%. Moreover, the heterojunction has a very low onset potential of 0.4 V versus RHE, which makes it attractive for systems, wherein water splitting can be initiated with a minimum electrical input. UV–vis and EIS results support improved absorption and charge-transfer kinetics as a result of the formed heterojunction. Interesting anomalies are noted in the Mott–Schottky plot as anomalous behavior is noted with respect to the conduction mechanism of the semiconductor, which may be related to the formation of a charged layer on the surface. Significant photocurrent at low applied bias implies greater efficiency for the solar water splitting process and lower use of conventional energy owing to low applied bias and paves the way for minimally energy-intensive methods to produce chemical fuels. The photocurrent and efficiency may be further enhanced by the optimization of nanostructure and the maximization of active surface area by appropriate changes to the synthesis parameters.
Experimental Section
Chemicals
All chemicals were procured from Merck and used in experiments as received. Deionized water (DI water, 18.2 MΩ cm) was used in all experiments. FTO-coated glass substrates (sheet resistance: 8 Ω/cm2) were purchased from Sigma-Aldrich and were used without any further modification.
Morphological, Structural, and Optical Characterizations
Surface morphology was determined using a Supra55 Zeiss field-emission scanning electron microscope (FESEM). TEM and HAADF images were recorded on a Tecnai-120 kV system. AFM analysis was carried out on a Nanosurf EasyScan 2 instrument. The structural characterization was done by employing a Rigaku SmartLab X-ray diffractometer using monochromated Cu Kα radiation (λ = 1.54 Å). The optical absorption measurements were carried out using UV–vis spectrometer in transmission mode (PerkinElmer, LAMBDA-35) in the wavelength range of 320–800 nm.
PEC Measurements and Electrochemical Analysis
PEC measurements were carried out in Autolab electrochemical workstation (PGSTAT 204 using NOVA software version 1.10) in a three-electrode configuration using α-Fe2O3/CdS nanostructured films on the FTO glass substrate as a working electrode, a Pt counter electrode, and an Ag/AgCl reference electrode (Scheme 2). An aqueous solution of 1 M NaOH with added 0.1 M Na2S (pH = 13) was used as the electrolyte to reduce the possibility of recombination at surface trap states.37 These electrodes were mounted onto a specially designed cell, and the active area of the electrode was fixed at 1 cm2. The simulated sunlight was provided by a xenon lamp with an intensity of 1000 W/m2 under AM 1.5G spectrum. The contact was made through the FTO, and the photocurrent was thus measured. Current–voltage (I–V) curves were swept at 10 mV/s from −0.8 to 0.8 V versus Ag/AgCl (corresponding to a voltage range of 0.2–1.8 V versus RHE, as per conversion formula provided in Supporting Information). Mott–Schottky measurements were performed using impedance measurements in the dark sweeping from −0.8 to 0.8 V versus Ag/AgCl with 50 mV increments at 1590.5 Hz. The Nyquist plots were created from EIS measurements under illumination at −0.4 V versus Ag/AgCl, which correspond to around 0.6 V versus RHE using a s range of 1–100 000 Hz. The potential of the Ag/AgCl reference electrode was found to be +480 mV with respect to the ferrocyanide/ferrocenium couple.
Scheme 2. Simplified Experimental Setup for the Measurement of Photocurrent, Mott–Schottky, and EIS Experiments.

Synthesis of Hematite (α-Fe2O3) by a Hydrothermal Method and Subsequent Growth of CdS
The nanostructured hematite thin film was deposited directly on an FTO glass substrate using a modified hydrothermal method.26 An aqueous solution (25 mL) containing FeCl3 (0.15 M) and NaNO3 (1 M) was sealed into a Teflon-lined vessel, along with ethanol (1.25 mL). The vessel was put into an autoclave and heated for 3 h at 98 °C. After the reaction, the yellowish films of β-FeOOH formed on the FTO substrates were carefully rinsed with DI water and transferred to a furnace. These samples were subsequently annealed in ambient air at 550 °C for 1 h, resulting in a reddish brown film of α-Fe2O3 converted from β-FeOOH (yellow). Subsequently, the samples were treated to CdS sensitization using a chemical bath method.22 Briefly, the as-prepared FTO substrates with the α-Fe2O3 thin film were dipped into 0.05 M Cd(NO3)2 ethanol solution for 1 min, rinsed with ethanol, then dipped into 0.05 M Na2S methanol solution for 1 min, and rinsed with methanol. Finally, the samples were washed with DI water and dried at room temperature overnight.
Acknowledgments
S.M.M. acknowledges SERB-DST, New Delhi, and IIT Indore for funding support and Sophisticated Instrumentation Centre (SIC), IIT Indore, for the characterization facilities. The authors gratefully acknowledge Advanced Imaging Centre, IIT Kanpur, for facilitating TEM images and Chemistry Division, Bhabha Atomic Research Centre, Mumbai, for providing AFM images. K.N. and M.S. thank MHRD, New Delhi, for providing fellowship.
Supporting Information Available
The Supporting Information is available free of charge on the ACS Publications website at DOI: 10.1021/acsomega.7b00624.
AFM analysis results, EDS results, J–V curve comparison between 1 M NaOH and 1 M NaOH + 0.1 M Na2S electrolytes, and Nernst equation for conversion between Ag/AgCl and RHE potentials (PDF)
The authors declare no competing financial interest.
Supplementary Material
References
- Walter M. G.; Warren E. L.; McKone J. R.; Boettcher S. W.; Mi Q.; Santori E. A.; Lewis M. S. Solar Water Splitting Cells. Chem. Rev. 2010, 110, 6446–6473. 10.1021/cr1002326. [DOI] [PubMed] [Google Scholar]
- Bolts J. M.; Wrighton M. S. Correlation of Photocurrent-Voltage Curves with Flat-Band Potential for Stable photoelectrodes for the Photoelectrolysis of water. J. Phys. Chem. 1976, 80, 2641–2645. 10.1021/j100565a004. [DOI] [Google Scholar]
- Butler M. A.; Ginley D. S. Principles of Photoelectrochemical, Solar Energy Conversion. J. Mater. Sci. 1980, 15, 1–19. 10.1007/bf00552421. [DOI] [Google Scholar]
- Lin Y.; Yuan G.; Liu R.; Zhou S.; Sheehan S. W.; Wang D. Semiconductor Nanostructure-based Photoelectrochemical Water Splitting: A Brief Review. Chem. Phys. Lett. 2011, 507, 209–215. 10.1016/j.cplett.2011.03.074. [DOI] [Google Scholar]
- Ling Y.; Li Y. Review of Sn-Doped Hematite Nanostructures for Photoelectrochemical Water Splitting. Part. Part. Syst. Charact. 2014, 31, 1113–1121. 10.1002/ppsc.201400051. [DOI] [PubMed] [Google Scholar]
- Chen S.; Thind S. S.; Chen A. Nanostructured Materials for Water Splitting - State of the Art and Future Needs: A Mini-Review. Electrochem. Commun. 2016, 63, 10–17. 10.1016/j.elecom.2015.12.003. [DOI] [Google Scholar]
- Fujishima A.; Honda K. Electrochemical Photolysis of Water at a Semiconductor Electrode. Nature 1972, 238, 37–38. 10.1038/238037a0. [DOI] [PubMed] [Google Scholar]
- Chen X.; Zhang Z.; Chi L.; Nair A. K.; Shangguan W.; Jiang Z. Recent Advances in Visible-Light-Driven Photoelectrochemical Water Splitting: Catalyst Nanostructures and Reaction Systems. Nano-Micro Lett. 2016, 8, 1–12. 10.1007/s40820-015-0063-3. [DOI] [PMC free article] [PubMed] [Google Scholar]
- Wang G.; Ling Y.; Wheeler D. A.; George K. E. N.; Horsley K.; Heske C.; Zhang J. Z.; Li Y. Facile Synthesis of Highly Photoactive α-Fe2O3-Based Films for Water Oxidation. Nano Lett. 2011, 11, 3503–3509. 10.1021/nl202316j. [DOI] [PubMed] [Google Scholar]
- Ling Y.; Wang G.; Reddy J.; Wang C.; Zhang J. Z.; Li Y. The Influence of Oxygen Content on the Thermal Activation of Hematite Nanowires. Angew. Chem., Int. Ed. 2012, 124, 4150–4155. 10.1002/ange.201107467. [DOI] [PubMed] [Google Scholar]
- Lin Y.; Zhou S.; Sheehan S. W.; Wang D. Nanonet-Based Hematite Heteronanostructures for Efficient Solar Water Splitting. J. Am. Chem. Soc. 2011, 133, 2398–2401. 10.1021/ja110741z. [DOI] [PubMed] [Google Scholar]
- Lin Y.; Yuan G.; Sheehan S.; Zhou S.; Wang D. Hematite-based Solar Water splitting: Challenges and Opportunities. Energy Environ. Sci. 2011, 4, 4862–4869. 10.1039/c1ee01850g. [DOI] [Google Scholar]
- Li L.; Yu Y.; Meng F.; Tan Y.; Hamers R. J.; Jin S. Facile Solution Synthesis of α-FeF3·3H2O Nanowires and Their Conversion to α-Fe2O3 Nanowires for Photoelectrochemical Application. Nano Lett. 2012, 12, 724–731. 10.1021/nl2036854. [DOI] [PubMed] [Google Scholar]
- Bjoerksten U.; Moser J.; Graetzel M. Photoelectrochemical Studies on Nanocrystalline Hematite Films. Chem. Mater. 1994, 6, 858–863. 10.1021/cm00042a026. [DOI] [Google Scholar]
- Wang L.; Zhou X.; Nguyen N. T.; Schmuki P. Plasmon-Enhanced Photoelectrochemical Water Splitting Using Au Nanoparticles Decorated on Hematite Nanoflake Arrays. ChemSusChem 2015, 8, 618–622. 10.1002/cssc.201403013. [DOI] [PubMed] [Google Scholar]
- Cherepy N. J.; Liston D. B.; Lovejoy J. A.; Deng H.; Zhang J. Z. Ultrafast Studies of Photoexcited Electron Dynamics in γ- and α-Fe2O3 Semiconductor Nanoparticles. J. Phys. Chem. B 1998, 102, 770–776. 10.1021/jp973149e. [DOI] [Google Scholar]
- Kennedy J. H.; Anderman M.; Shinar R. Photoactivity of Polycrystalline α- Fe2O3 Electrodes Doped with Group IVA Elements. J. Electrochem. Soc. 1981, 128, 2371–2373. 10.1149/1.2127253. [DOI] [Google Scholar]
- Klahr B.; Gimenez S.; Fabregat-Santiago F.; Hamann T.; Bisquert J. Water Oxidation at Hematite Photoelectrodes: The Role of Surface States. J. Am. Chem. Soc. 2012, 134, 4294–4302. 10.1021/ja210755h. [DOI] [PubMed] [Google Scholar]
- Sivula K.; Le Formal F.; Grätzel M. Solar Water Splitting: Progress Using Hematite (α-Fe2O3) Photoelectrodes. ChemSusChem 2011, 4, 432–449. 10.1002/cssc.201000416. [DOI] [PubMed] [Google Scholar]
- Wang L.; Wei H.; Fan Y.; Gu X.; Zhan J. One-Dimensional CdS/α-Fe2O3 and CdS/Fe3O4 Heterostructures: Epitaxial and Nonepitaxial Growth and Photocatalytic Activity. J. Phys. Chem. C 2009, 113, 14119–14125. 10.1021/jp902866b. [DOI] [Google Scholar]
- Zhu J.; Yang D.; Geng J.; Chen D.; Jiang Z. Synthesis and characterization of bamboo-like CdS/TiO2 nanotubes composites with enhanced visible-light photocatalytic activity. J. Nanopart. Res. 2008, 10, 729–736. 10.1007/s11051-007-9301-z. [DOI] [Google Scholar]
- Tang J.; Li J.; Zhang Y.; Kong B.; Yiliguma; Wang Y.; Quan Y.; Cheng H.; Al-Enizi A. M.; Gong X.; Zheng G. Mesoporous Fe2O3–CdS Heterostructures for Real-Time Photoelectrochemical Dynamic Probing of Cu2+. Anal. Chem. 2015, 87, 6703–6708. 10.1021/acs.analchem.5b00844. [DOI] [PubMed] [Google Scholar]
- Guo Y.; Huang H.; He Y.; Tian N.; Zhang T.; Chu P. K.; An Q.; Zhang Y. In situ crystallization for fabrication of a core–satellite structured BiOBr–CdS heterostructure with excellent visible light-responsive photoreactivity. Nanoscale 2015, 7, 11702–11711. 10.1039/c5nr02246k. [DOI] [PubMed] [Google Scholar]
- Huang H.; Xiao K.; He Y.; Zhang T.; Dong F.; Du X.; Zhang Y. In situ assembly of BIOI@Bi12O17Cl2 p–n junction: charge induced unique front-lateral surfaces coupling heterostructure with high exposure of BIOI {001} active facets for robust and nonselective photocatalysis. Appl. Catal., B 2016, 199, 75–86. 10.1016/j.apcatb.2016.06.020. [DOI] [Google Scholar]
- Tian N.; Huang H.; Liu C.; Dong F.; Zhang T.; Du X.; Yu S.; Zhang Y. In situ co-pyrolysis fabrication of CeO2/g-C3N4 n-n type heterojunction for synchronously promoting photo-induced oxidation and reduction properties. J. Mater. Chem. A 2015, 3, 17120–17129. 10.1039/c5ta03669k. [DOI] [Google Scholar]
- Vayssieres L.; Beermann N.; Lindquist S.-E.; Hagfeldt A. Controlled Aqueous Chemical Growth of Oriented Three-Dimensional Crystalline Nanorod Arrays: Application to Iron(III) Oxides. Chem. Mater. 2001, 13, 233–235. 10.1021/cm001202x. [DOI] [Google Scholar]
- Deshpande A.; Shah P.; Gholap R. S.; Gupta N. M. Interfacial and Physico-Chemical Properties of Polymer-supported CdS-ZnS Nanocomposites and Their Role in the Visible-light Mediated Photocatalytic Splitting of Water. J. Colloid Interface Sci. 2009, 333, 263–268. 10.1016/j.jcis.2009.01.037. [DOI] [PubMed] [Google Scholar]
- Ling Y.; Wang G.; Wheeler D. A.; Zhang J. Z.; Li Y. Sn-doped Hematite Nanostructures for Photoelectrochemical Water Splitting. Nano Lett. 2011, 11, 2119–2125. 10.1021/nl200708y. [DOI] [PubMed] [Google Scholar]
- Zhang S.; Xu W.; Zeng M.; Li J.; Xu J.; Wang X. Hierarchially grown CdS/α-Fe2O3 heterojunction nanocomposites with enhanced visible-light driven photocatalytic performance. Dalton Trans. 2013, 42, 13417–13424. 10.1039/c3dt51492g. [DOI] [PubMed] [Google Scholar]
- Zhong D. K.; Cornuz M.; Sivula K.; Grätzel M.; Gamelin D. R. Photo-assisted Electrodeposition of Cobalt–Phosphate (Co–Pi) Catalyst on Hematite Photoanodes for Solar Water Oxidation. Energy Environ. Sci. 2011, 4, 1759–1764. 10.1039/c1ee01034d. [DOI] [Google Scholar]
- Morrish R.; Rahman M.; MacElroy J. M. D.; Wolden C. A. Activation of Hematite Nanorod Arrays for Photoelectrochemical Water Splitting. ChemSusChem 2011, 4, 474–479. 10.1002/cssc.201100066. [DOI] [PubMed] [Google Scholar]
- Gilbert B.; Frandsen C.; Maxey E. R.; Sherman D. M. Band-gap Measurements of Bulk and Nanoscale Hematite by Soft X-ray Spectroscopy. Phys. Rev. B: Condens. Matter Mater. Phys. 2009, 79, 035108. 10.1103/physrevb.79.035108. [DOI] [Google Scholar]
- Sahay P. P.; Nath R. K.; Tewari S. Optical Properties of Thermally Evaporated CdS Thin Films. Cryst. Res. Technol. 2007, 42, 275–280. 10.1002/crat.200610812. [DOI] [Google Scholar]
- Moualkia H.; Hariech S.; Aida M. S. Structural and Optical Properties of CdS Thin Films Grown by Chemical Bath Deposition. Thin Solid Films 2009, 518, 1259–1262. 10.1016/j.tsf.2009.04.067. [DOI] [Google Scholar]
- Rossetti R.; Ellison J. L.; Hull R.; Gibson J. M.; Brus L. E. Size Effects in the Excited Electronic States of Small Colloidal CdS Crystallites. J. Chem. Phys. 1984, 80, 4464–4469. 10.1063/1.447228. [DOI] [Google Scholar]
- Singh V.; Sharma P. K.; Chauhan P. Synthesis of CdS Nanoparticles With Enhanced Optical Properties. Mater. Charact. 2011, 62, 43–52. 10.1016/j.matchar.2010.10.009. [DOI] [Google Scholar]
- Miller E. A.; Richmond G. L. Photocorrosion of n-GaAs and Passivation by Na2S: A Comparison of the (100), (110) and (111)B Faces. J. Phys. Chem. B 1997, 101, 2669–2677. 10.1021/jp962852k. [DOI] [Google Scholar]
- Abe T.; Fukui K.; Kawai Y.; Nagai K.; Kato H. A Water Splitting System Using an Organo-photocathode and Titanium Dioxide Photoanode Capable of Bias-free H2 and O2 Evolution. Chem. Commun. 2016, 52, 7735–7737. 10.1039/c6cc01225f. [DOI] [PubMed] [Google Scholar]
- Niishiro R.; Takano Y.; Jia Q.; Yamaguchi M.; Iwase A.; Kuang Y.; Minegishi T.; Yamada T.; Domen K.; Kudo A. A CoOx-modified SnNb2O6 Photoelectrode for Highly Efficient Oxygen Evolution from Water. Chem. Commun. 2017, 53, 629–632. 10.1039/c6cc08262a. [DOI] [PubMed] [Google Scholar]
- Tilley S. D.; Cornuz M.; Sivula K.; Grätzel M. Light-Induced Water Splitting with Hematite: Improved Nanostructure and Iridium Oxide Catalysis. Angew. Chem., Int. Ed. 2010, 49, 6405–6408. 10.1002/anie.201003110. [DOI] [PubMed] [Google Scholar]
- Zhao P.; Kronawitter C. X.; Yang X.; Fu J.; Koel B. E. WO3–α-Fe2O3 Composite Photoelectrodes with Low Onset Potential for Solar Water Oxidation. Phys. Chem. Chem. Phys. 2014, 16, 1327–1332. 10.1039/c3cp53324g. [DOI] [PubMed] [Google Scholar]
- Zandi O.; Hamann T. W. Enhanced Water Splitting Efficiency Through Selective Surface State Removal. J. Phys. Chem. Lett. 2014, 5, 1522–1526. 10.1021/jz500535a. [DOI] [PubMed] [Google Scholar]
- Hu Y.-S.; Kleiman-Shwarsctein A.; Forman A. J.; Hazen D.; Park J.-N.; McFarland E. W. Pt-Doped α-Fe2O3 Thin Films Active for Photoelectrochemical Water Splitting. Chem. Mater. 2008, 20, 3803–3805. 10.1021/cm800144q. [DOI] [Google Scholar]
- Jang J. S.; Yoon K. Y.; Xiao X.; Fan F.-R. F.; Bard A. J. Development of a Potential Fe2O3-Based Photocatalyst Thin Film for Water Oxidation by Scanning Electrochemical Microscopy: Effects of Ag-Fe2O3 Nanocomposite and Sn Doping. Chem. Mater. 2009, 21, 4803–4810. 10.1021/cm901056c. [DOI] [Google Scholar]
- Liu Q.; He J.; Yao T.; Sun Z.; Cheng W.; He S.; Xie Y.; Peng Y.; Cheng H.; Sun Y.; Jiang Y.; Hu F.; Xie Z.; Yan W.; Pan Z.; Wu Z.; Wei S. Aligned Fe2TiO5-containing Nanotube Arrays with Low Onset Potential for Visible-light Water Oxidation. Nat. Commun. 2014, 5, 5122. 10.1038/ncomms6122. [DOI] [PubMed] [Google Scholar]
- Scanlon D. O.; Dunnill C. W.; Buckeridge J.; Shevlin S. A.; Logsdail A. J.; Woodley S. M.; Catlow C. R. A.; Powell M. J.; Palgrave R. G.; Parkin I. P.; Watson G. W.; Keal T. W.; Sherwood P.; Walsh A.; Sokol A. A. Band Alignment of Rutile and Anatase TiO2. Nat. Mater. 2013, 12, 798–801. 10.1038/nmat3697. [DOI] [PubMed] [Google Scholar]
- Bedoya-Lora F.; Hankin A.; Kelsall G. H. Photo-electrochemical Hydrogen Sulfide Splitting using SnIV-doped Hematite Photo-anodes. Electrochem. Commun. 2016, 68, 19–22. 10.1016/j.elecom.2016.04.010. [DOI] [Google Scholar]
- Hwang D. W.; Kim J.; Park T. J.; Lee J. S. Mg-doped WO3 as a Novel Photocatalyst for Visible Light-induced Water Splitting. Catal. Lett. 2002, 80, 53–57. 10.1023/a:1015322625989. [DOI] [Google Scholar]
- Yang M. Z.; Luo J. L.; Yang Q.; Qiao L. J.; Qin Z. Q.; Norton P. R. Effects of Hydrogen on Semiconductivity of Passive Films and Corrosion Behavior of 310 Stainless Steel. J. Electrochem. Soc. 1999, 146, 2107–2112. 10.1149/1.1391899. [DOI] [Google Scholar]
- Macaluso R.; Mosca M.; Calì C.; Di Franco F.; Santamaria M.; Di Quarto F.; Reverchon J.-L. Erroneous p-type Assignment by Hall Effect Measurements in Annealed ZnO Films Grown on InP Substrate. J. Appl. Phys. 2013, 113, 164508. 10.1063/1.4803080. [DOI] [Google Scholar]
- Fujii K.; Ohkawa K. Photoelectrochemical Properties of p-Type GaN in Comparison with n-Type GaN. Jpn. J. Appl. Phys. 2005, 44, L909–L911. 10.1143/jjap.44.l909. [DOI] [Google Scholar]
- Igalson M.; Bodegård M.; Stolt L. Reversible Changes of the Fill Factor in the ZnO/CdS/Cu (In,Ga)Se2 Solar Cells. Sol. Energy Mater. Sol. Cells 2003, 80, 195–207. 10.1016/j.solmat.2003.06.006. [DOI] [Google Scholar]
- Cooper G.; Turner J. A.; Parkinson B. A.; Nozik A. J. Hot Carrier Injection of Photogenerated Electrons at Indium Phosphide–electrolyte Interfaces. J. Appl. Phys. 1983, 54, 6463–6473. 10.1063/1.331928. [DOI] [Google Scholar]
- Hisatomi T.; Kubota J.; Domen K. Recent Advances in Semiconductors for Photocatalytic and Photoelectrochemical Water Splitting. Chem. Soc. Rev. 2014, 43, 7520–7535. 10.1039/c3cs60378d. [DOI] [PubMed] [Google Scholar]
- Higashi T.; Shinohara Y.; Ohnishi A.; Liu J.; Ueda K.; Okamura S.; Hisatomi T.; Katayama M.; Nishiyama H.; Yamada T.; Minegishi T.; Domen K. Sunlight-Driven Overall Water Splitting by the Combination of Surface-Modified La5Ti2Cu0.9Ag0.1S5O7 and BaTaO2N Photoelectrodes. ChemPhotoChem 2016, 1, 167–172. 10.1002/cptc.201600015. [DOI] [Google Scholar]
- Shen W.-M.; Tomkiewicz M.; Cahen D. Impedance Study of Surface Optimization of n-CuInSe2 in Photoelectrochemical Solar Cells. J. Electrochem. Soc. 1986, 133, 112–116. 10.1149/1.2108503. [DOI] [Google Scholar]
- Murray E. P.; Sever M. J.; Barnett S. A. Electrochemical Performance of (La, Sr)(Co, Fe)O3-(Ce, Gd)O3 composite electrodes. Solid State Ionics 2002, 148, 27–34. 10.1016/s0167-2738(02)00102-9. [DOI] [Google Scholar]
- Singh P. K.; Kumar P.; Seth T.; Rhee H.-W.; Bhattacharya B. Preparation, Characterization and Application of Nano CdS Doped with Alum Composite Electrolyte. J. Phys. Chem. Solids 2012, 73, 1159–1163. 10.1016/j.jpcs.2012.05.008. [DOI] [Google Scholar]
- Shi X.-L.; Cao M.-S.; Yuan J.; Zhao Q.-L.; Kang Y.-Q.; Fang X.-Y.; Chen Y.-J. Nonlinear Resonant and High Dielectric loss Behavior of CdS/α-Fe2O3 Heterostructure Nanocomposites. Appl. Phys. Lett. 2008, 93, 183118. 10.1063/1.3023074. [DOI] [Google Scholar]
- Sato H.; Takahashi D.; Nishina T.; Uchida I. Electrochemical Characterization of Thin-film LiCoO2 Electrodes in Propylene Carbonate Solutions. J. Power Sources 1997, 68, 540–544. 10.1016/s0378-7753(96)02589-x. [DOI] [Google Scholar]
- Lee S.-I.; Choi M.-B.; Dasari H. P.; Hong J.; Kim H.; Son J.-W.; Lee J.-H.; Kim B.-K.; Je H.-J.; Yoon K. J. Role of Ceria-Zirconia Solid Solution with High Oxygen Storage Capacity in Cermet Anodes of Solid Oxide Fuel Cells. J. Electrochem. Soc. 2014, 161, F883–F888. 10.1149/2.0581409jes. [DOI] [Google Scholar]
- Orazem M. E.; Pébère N.; Tribollet B. Enhanced Graphical Representation of Electrochemical Impedance Data. J. Electrochem. Soc. 2006, 153, B129–B136. 10.1149/1.2168377. [DOI] [Google Scholar]
- He Z.; Mansfeld F. Exploring the Use of Electrochemical Impedance Spectroscopy (EIS) in Microbial Fuel Cell Studies. Energy Environ. Sci. 2009, 2, 215–219. 10.1039/b814914c. [DOI] [Google Scholar]
- Nelson G. J.; Cassenti B. N.; Peracchio A. A.; Chiu W. K. S. Two-dimensional Charge Transfer and Space Charge Effects in Extended Surface Solid Oxide Fuel Cell Electrodes. J. Power Sources 2012, 205, 48–56. 10.1016/j.jpowsour.2012.01.009. [DOI] [Google Scholar]
- Miao C.; Ji S.; Xu G.; Liu G.; Zhang L.; Ye C. Micro-Nano-Structured Fe2O3:Ti/ZnFe2O4 Heterojunction Films for Water Oxidation. ACS Appl. Mater. Interfaces 2012, 4, 4428–4433. 10.1021/am3011466. [DOI] [PubMed] [Google Scholar]
- Miao C.; Shi T.; Xu G.; Ji S.; Ye C. Photocurrent Enhancement for Ti-Doped Fe2O3 Thin Film Photoanodes by an In Situ Solid-State Reaction Method. ACS Appl. Mater. Interfaces 2013, 5, 1310–1316. 10.1021/am302575p. [DOI] [PubMed] [Google Scholar]
- Hahn N. T.; Mullins C. B. Photoelectrochemical Performance of Nanostructured Ti- and Sn-Doped α-Fe2O3 Photoanodes. Chem. Mater. 2010, 22, 6474–6482. 10.1021/cm1026078. [DOI] [Google Scholar]
- Hou Y.; Zuo F.; Dagg A.; Feng P. A Three-Dimensional Branched Cobalt-Doped α-Fe2O3 Nanorod/MgFe2O4 Heterojunction Array as a Flexible Photoanode for Efficient Photoelectrochemical Water Oxidation. Angew. Chem. 2013, 125, 1286–1290. 10.1002/ange.201207578. [DOI] [PubMed] [Google Scholar]
- Wang Y.; Yu T.; Chen X.; Zhang H.; Ouyang S.; Li Z.; Ye J.; Zou Z. Enhancement of Photoelectric Conversion Properties of SrTiO3/α-Fe2O3 Heterojunction Photoanode. J. Phys. D: Appl. Phys. 2007, 40, 3925–3930. 10.1088/0022-3727/40/13/003. [DOI] [Google Scholar]
- Cesar I.; Kay A.; Martinez J. A. G.; Grätzel M. Translucent Thin Film Fe2O3 Photoanodes for Efficient Water Splitting by Sunlight: Nanostructure-Directing Effect of Si-Doping. J. Am. Chem. Soc. 2006, 128, 4582–4583. 10.1021/ja060292p. [DOI] [PubMed] [Google Scholar]
- Hou Y.; Zuo F.; Dagg A.; Feng P. Visible Light-Driven α-Fe2O3 Nanorod/Graphene/BiV1–xMoxO4 Core/Shell Heterojunction Array for Efficient Photoelectrochemical Water Splitting. Nano Lett. 2012, 12, 6464–6473. 10.1021/nl303961c. [DOI] [PubMed] [Google Scholar]
- Qi X.; She G.; Wang M.; Mu L.; Shi W. Electrochemical Synthesis of p-type Zn-doped α-Fe2O3 Nanotube Arrays for Photoelectrochemical Water Splitting. Chem. Commun. 2013, 49, 5742–5744. 10.1039/c3cc40599k. [DOI] [PubMed] [Google Scholar]
- Saremi-Yarahmadi S.; Vaidhyanathan B.; Wijayantha K. G. U. Microwave-assisted Low Temperature Fabrication of Nanostructured α-Fe2O3 Electrodes for Solar-driven Hydrogen Generation. Int. J. Hydrogen Energy 2010, 35, 10155–10165. 10.1016/j.ijhydene.2010.08.004. [DOI] [Google Scholar]
Associated Data
This section collects any data citations, data availability statements, or supplementary materials included in this article.