Abstract
Our current study is to identify clinical significance of minichromosome maintenance (MCM) gene expression in Lung Adenocarcinoma (LUAD) using genome-wide RNA sequencing (RNA-seq) dataset and bioinformatics analysis tools. The biological function and potential process for function of the MCM1-10 were identified by multiple bioinformatics analysis tools. Clinical significance and molecular mechanism of the MCM1-10 were investigated by the RNA-seq dataset of LUAD from The Cancer Genome Atlas. Functional assessment substantiated involvement of MCM1-10 in cell cycle progression and DNA replication, and co-expressed with each other. We also observed that the MCM1-10 were dysregulation in LUAD tumor tissues, and may be have diagnostic implications in LUAD. Prognosis analysis in TCGA and KM plotter cohorts suggest that high abundance of MCM5, MCM8 and MCM4 notably correlated to poor LUAD overall survival. Mechanistic exploration of MCM4, MCM5, and MCM8 by gene set enrichment analysis suggests that these genes may influence the LUAD prognosis by regulating the cell cycle, DNA replication and other multiple biological processes and pathways. In comclusion, our study suggests that MCM1-10 can serve as diagnostic biomarkers for LUAD patients. Of them, MCM4, MCM5, and MCM8 may act as potential prognostic indicators for LUAD.
Introduction
Worldwide, Lung cancer is known to have the highest rate of morbidity and mortality worldwide. Current statistics predict 2.1 million new cases and 1.8 million deaths in 2018. One of the areas with the highest incidence is East Asia (China, Japan and South Korea have an incidence of more than 40 / 100,000) [1].The most prevalent kind of lung cancer (about 80%) is non-small cell lung cancer (NSCLC). It can be divided into adenocarcinoma, squamous cell lung cancer and other variety, among which adenocarcinoma is the most common, accounting for more than 50%[2,3].In recent years, despite the continuous progress and development in diagnosis and treatment regimen, the prognosis is still poor, especially for patients with lung adenocarcinoma; the survival rate over a period of 5 years is only 4% - 17%[3–5]. Therefore, it is necessary to actively explore effective tumor biomarkers to predict patients' prognosis and improve survival rate.
Minichromosome maintenance (MCM) genes perform an important function in cell cycle and replication of our genome. This family of genes includes ten members: SRF (as know as MCM1), MCM2, MCM3, MCM4, MCM5, MCM6, MCM7, MCM8, MCM9 and MCM10[6,7].Extensive research have substantiated that they are significantly involved in multiple cancers, and can be regarded as diagnostic and prognostic biomarker[8–12]. However, detailed analysis of the clinical significance of MCM1-10 in LUAD has not been reported, and still needs further exploration. The TCGA database involves large-scale genome sequences to map genomic variants of all human cancers. These sequences are systematically analyzed to find different small mutations of carcinogenic and tumor suppressor genes and understanding the mechanism of cancer cell development. On the above basis new diagnostic and therapeutic methods can be obtained and outlined as the entire new "prevention strategy for cancer"[13].
Our current study aims to investigate the clinical significance and prospective molecular mechanism(s) of MCM1-10 in LUAD using genome-wide RNA sequencing (RNA-seq) dataset and metagenomics analysis tools.
Methodology
Data obtained
TCGA database was used as the source for RNA-seq information as well as corresponding clinical parameters of LUAD patients (https://portal.gdc.cancer.gov/,accessed September 06, 2018). To validate the results obtained from the TCGA database, LUAD patients in Kaplan Meier plotter (K-M plotter, http://kmplot.com/analysis/,accessed September 06, 2018)[14]were used as the validation cohort. Since all dataset used in the present study were obtained from open access database, hence, additional ethics committee approval was not necessary.
Bioinformatics analysis
MCM genes were functionally evaluated using the Database for Annotation, Visualization and Integrated Discovery version 6.8 (DAVID v6.8, https://david.ncifcrf.gov/home.jsp, accessed September 06, 2018) [15,16].We considered p value < 0.05 to be statistically significant. GeneMANIA (http://www.genemania.org/, accessed September 06, 2018) [17]and Search Tool for the Retrieval of Interacting Genes/Proteins (STRING, https://string-db.org/, accessed September 06, 2018) were used to explore gene-gene and protein-protein interactions of MCM1-10 respectively[18–20].
Co-expression and diagnostic value investigation
Distribution of MCM1-10 between LUAD tumor and matched normal lung tissues were assessed by independent sample t-test. We used Pearson’s correlation coefficient for evaluating the co-expression relationship among the proteins. Corrplot package of R platform was used for graphical representation of the data. The distribution analysis of MCM1-10 between normal lung and cancer tissues were carried out by Metabolic gEne RApid Visualizer (MERAV, http://merav.wi.mit.edu/, accessed September 8, 2018) [21]. We used SPSS software to obtain Receiver operating characteristic (ROC) curve to predict the diagnostic values of the MCM1-10 in patients with LUAD.
Survival analysis
We clustered patients into high and low expression pools based on median values of each MCM gene. We investigated the cooperative effect of MCM genes on survival analysis by taking into consideration those which were significantly associated with LUAD OS. We employed time-dependent ROC curve to assess the precision of the MCM genes in LUAD prognosis prediction. It was constructed using the survival ROC package of R platform[22]. Association between prognostic MCM genes and clinical status in LUAD OS was determined through nomogram and joint effect survival analysis.
Gene set enrichment analysis
We used gene set enrichment analysis (GSEA, http://software.broadinstitute.org/gsea/index.jsp, accessed September 16, 2018)[23] for finding out probable molecular mechanism(s) underlying the role of prognostic MCM genes in LUAD prognosis. The potential mechanisms were explored in the Molecular Signatures Database (MSigDB)[24] of c2 (c2.all.v6.2. symbols) and c5 (c5.all.v6.2.symbols). The significant results of GSEA were identified using the following statistical cutoff values: a nominal P-value <0.05 and false discovery rate (FDR) <0.25.
Statistical analysis
Benjamini–Hochberg algorithm was used to factor for FDR in the GSEA[25]. We used Kaplan-Meier method with log-rank test to plot univariate survival analysis for clinical parameters and MCM genes. These clinicopathological features were found to be significantly involved with LUAD OS (P < 0.05). We subjected the factors to multivariate Cox proportional hazards regression model for adjustment and the hazard ratios (HRs) and 95% confidence intervals (CIs) were used to evaluate the proportional risk in different LUAD patients. SPSS software, version 24.0 (IBM Corporation, Armonk, NY, USA) and R 3.3.1 were used to evaluate the statistical analyses. P-value <0.05 was considered to be statistically significant.
Results
Data source
Our present findings included information from 515 patients having 535 LUAD tumor and 59 adjacent normal lung tissues. A total of 500 LUAD patients with complete prognosis information and RNA-seq data were involved for further survival analysis. We observed significant association between TNM gradation of the tumor and median survival time (MST; P<0.0001;).
Bioinformatics analysis
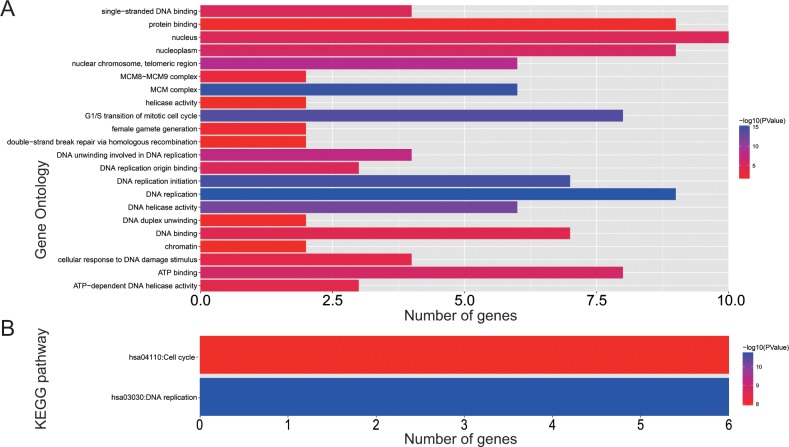
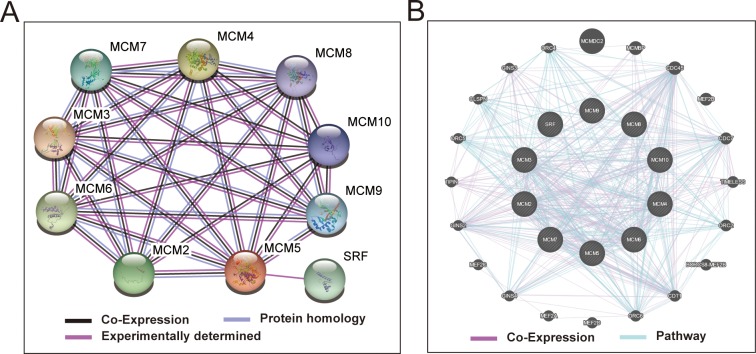
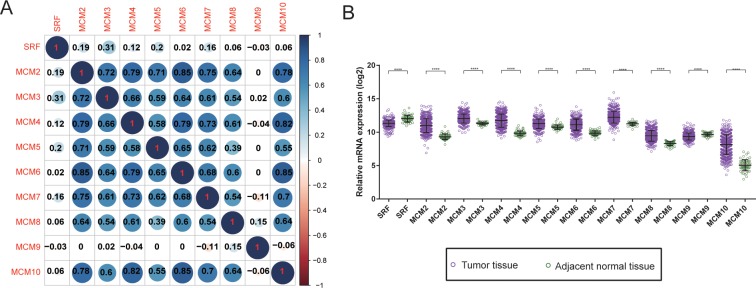
Biological processes investigation by gene ontology (GO) term enrichment analysis using DAVID v6.8 suggested that these MCM genes were significantly associated with cell cycle progression through G1/S, DNA damage response and DNA replication related biological events namely DNA unwinding involved in DNA replication, replication origin binding, initiation of replication, helicase activity, and DNA duplex unwinding (Fig 1A). Moreover, pathway enrichment through Kyoto Encyclopedia of Genes and Genomes (KEGG) using DAVID v6.8 substantiated that these MCM genes were involved in DNA replication and cell cycle functions (Fig 1B). Gene-gene as well as protein-protein communication networks established that MCM1-10 exhibit strong homology in their sequences and are co-expressed, which were further corroborated by GeneMANIA and STRING (Fig 2A and 2B), respectively. The co-expression relationship of MCM1-10 has also been verified in the LUAD tumor tissues, we observed that these MCM genes also significantly positive co-expressed with each other except MCM9 (Fig 3A).
Fig 1. GO term and KEGG analysis of MCM1–10 genes.
(A) GO term enrichments of MCM1–10 genes. (B) KEGG enrichments of MCM1–10 genes.
Fig 2. Protein-protein and gene-gene interaction networks of MCM1–10 genes.
(A) Protein–protein interaction networks; (B) GeneMANIA interaction networks.
Fig 3. Co-expression heat map and gene expression distribution of MCM genes in TCGA cohort.
(A) co-expression heat map of MCM genes in TCGA; (B) gene expression distribution of MCM genes in TCGA.
Differential levels of MCM genes between LUAD tumor and matched normal tissues
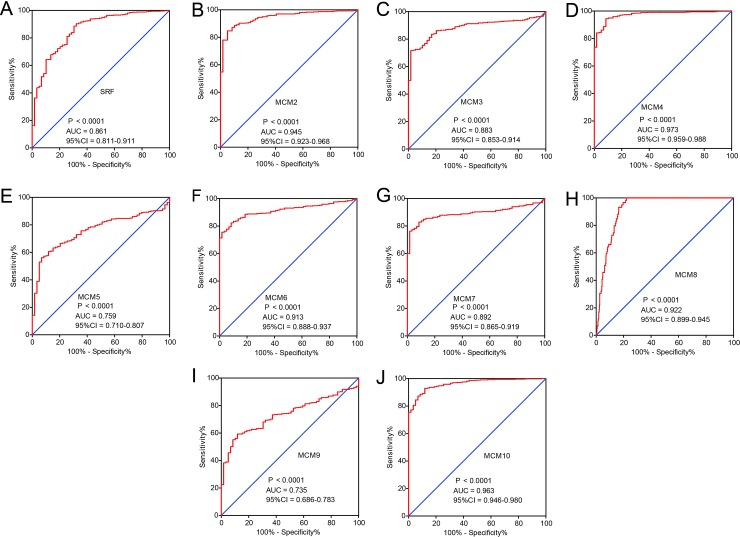
A comparison of the distribution of MCM genes between tumor and adjacent normal lung tissues showed MCM2-8 and MCM10 to be significantly up-regulated in LUAD tumor tissues in TCGA cohorts, whereas the SRF and MCM9 were significantly down-regulated in the same (Fig 3B). Distribution of MCM gene expression between lung tumor and adjacent normal tissues using MERAV showed the same trend (S1A–S1I Fig). ROC analysis helped to investigate the potential clinical implication of MCM1-10 in differentiating LUAD tumor and matchedt normal lung tissues. The ROC analysis in TCGA LUAD cohort observed all the MCM family members to have high accuracy in distinguishing between LUAD tumors from matched normal lung tissues (the area under the curve [AUC] of the ROC for MCM1-10 rank from 0.735 to 0.973, Fig 4A–4J).
Fig 4. The ROC curves of MCM gens in distinguish LUAD tumor tissue and adjacent normal tissues in TCGA cohort.
ROC curves of MCM1 (A), MCM2 (B), MCM3 (C), MCM4(D), MCM5 (E), MCM6 (F) MCM7 (G) MCM8 (H) MCM9 (I)and MCM10 (J).
Survival analysis of MCM genes
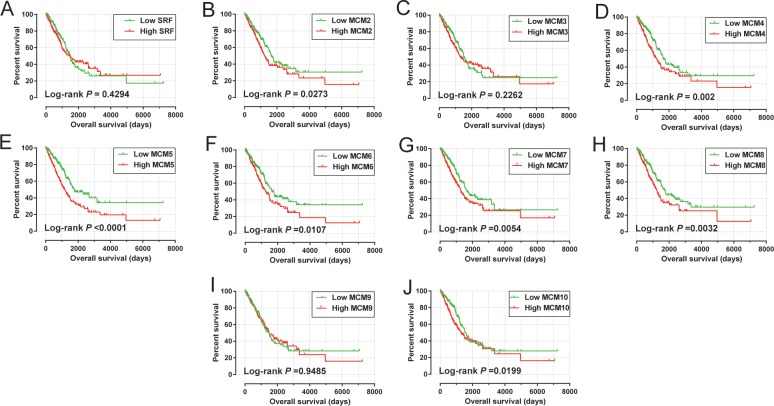
Multivariate Cox proportional hazards regression model suggest that elevated levels of MCM4 (adjusted P = 0.044, adjusted HR = 1.362, 95%CI = 1.008–1.842, Table 1, Fig 5A–5J), MCM5 (adjusted P = 0.003, adjusted HR = 1.579, 95%CI = 1.163–2.143, Table 1, Fig 5A–5J) as well as MCM8 (adjusted P = 0.030, adjusted HR = 1.391, 95%CI = 1.003–1.873, Table 1, Fig 5A–5J) significantly increased risk of death for patients with LUAD. Prognostic values of MCM4, MCM5 and MCM8 in the KM plotter website further indicated that high expression of these MCM genes were associated with poor LUAD OS (Fig 6A–6C).
Table 1. Prognostic values of MCM genes expression in LUAD cohort of TCGA.
| Genes | Expression level | Event/Total | MST | Crude HR(95%CI) | Crude P | Adjusted HR(95%CI) | Adjusted P& |
|---|---|---|---|---|---|---|---|
| SRF | Low | 88/250 | 1498 | 1 | 1 | ||
| High | 94/250 | 1421 | 1.125(0.840–1.505) | 0.43 | 1.091(0.812–1.467) | 0.563 | |
| MCM2 | Low | 80/250 | 1653 | 1 | 1 | ||
| High | 102/250 | 1258 | 1.390(1.036–1.864) | 0.028 | 1.196(0.887–1.613) | 0.24 | |
| MCM3 | Low | 84/250 | 1501 | 1 | 1 | ||
| High | 98/250 | 1293 | 1.197(0.894–1.603) | 0.227 | 1.178(0.877–1.583) | 0.276 | |
| MCM4 | Low | 77/250 | 1653 | 1 | 1 | ||
| High | 105/250 | 1229 | 1.585(1.180–2.128) | 0.002 | 1.362(1.008–1.842) | 0.044 | |
| MCM5 | Low | 69/250 | 1790 | 1 | 1 | ||
| High | 113/250 | 1171 | 1.842(1.365–2.486) | < 0.0001 | 1.579(1.163–2.143) | 0.003 | |
| MCM6 | Low | 77/250 | 1653 | 1 | 1 | ||
| High | 105/250 | 1288 | 1.464(1.090–1.966) | 0.011 | 1.294(0.960-.745) | 0.091 | |
| MCM7 | Low | 75/250 | 1622 | 1 | 1 | ||
| High | 107/250 | 1265 | 1.516(1.128–2.038) | 0.006 | 1.226(0.904–1.664) | 0.191 | |
| MCM8 | Low | 83/250 | 1725 | 1 | 1 | ||
| High | 99/250 | 1235 | 1.552(1.156–2.085) | 0.003 | 1.391(1.003–1.873) | 0.030 | |
| MCM9 | Low | 95/250 | 1498 | 1 | 1 | ||
| High | 87/250 | 1499 | 0.990(0.740–1.325) | 0.948 | 1.089(0.810–1.464) | 0.573 | |
| MCM10 | Low | 79/250 | 1600 | 1 | 1 | ||
| High | 103/250 | 1288 | 1.414(1.055–1.897) | 0.021 | 1.237(0.917–1.669) | 0.163 |
Notes: &Adjusted for tumor stage. MST, median survival time; HR, hazard ratio; CI, confidence interval; NA, not available; MCM, minichromosome maintenance; TCGA, The Cancer Genome Atlas.
Fig 5. Kaplan–Meier survival curves for MCM gens in TCGA cohort (https://portal.gdc.cancer.gov/).
OS stratified by MCM1 (A), MCM2 (B), MCM3 (C), MCM4(D), MCM5 (E), MCM6 (F) MCM7 (G) MCM8 (H) MCM9 (I)and MCM10 (J).
Fig 6.
The mRNA expression of MCM4 (A), MCM5 (B), and MCM8 (C) were significantly associated with LUAD OS in patients from the Kaplan Meier plotter web site (http://kmplot.com/analysis/index.php?p=service&cancer=lung).
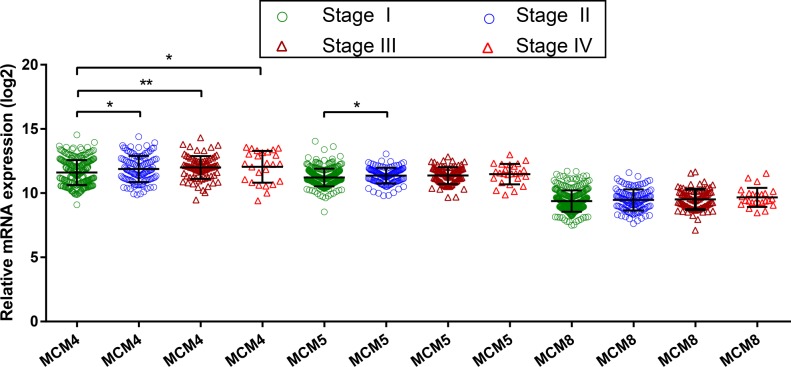
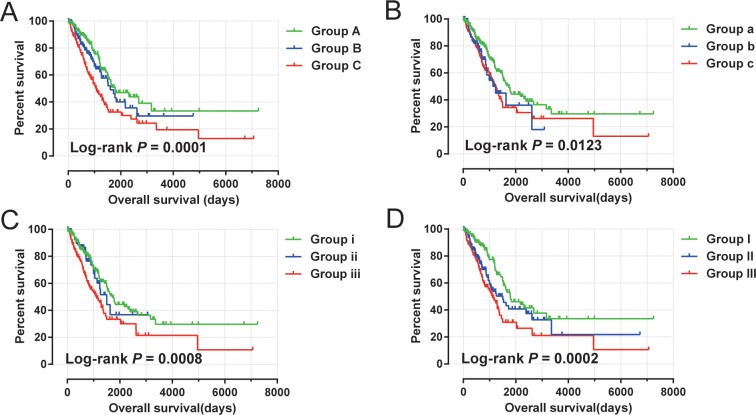
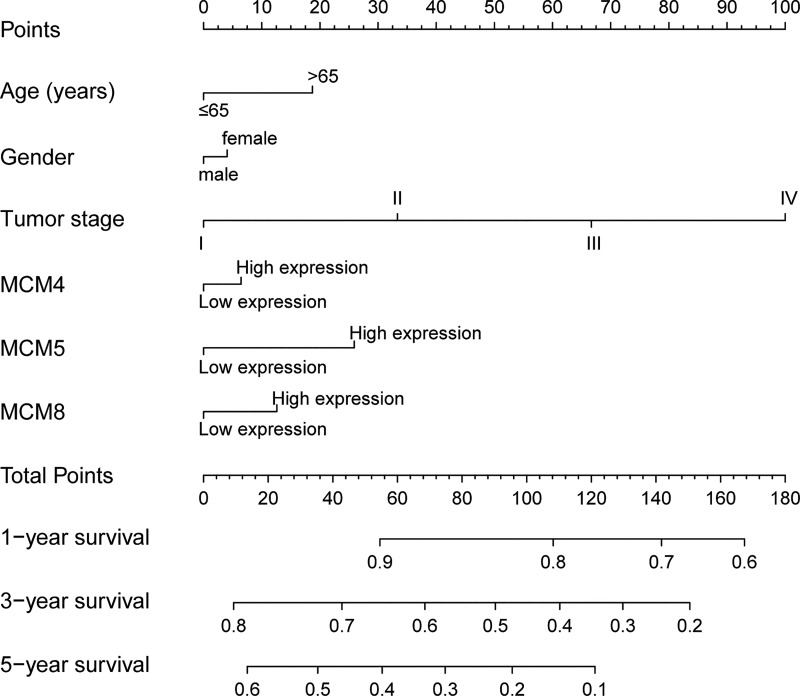
Time-dependent ROC analysis (using survival ROC package of R) helped to assess accuracy of MCM gene in LUAD prognosis prediction. We observed that MCM4 and MCM5 have some predictive value in predicting the prognosis of LUAD (Fig 7A–7C). In addition, we also evaluated MCM4, MCM5 and MCM8 in LUAD progression, and demonstrated significant upregulation of MCM4 and MCM5 in advanced stage of LUAD (Fig 8). Furthermore, we also explored the joint effect survival analysis among MCM4, MCM5 and MCM8 genes (Table 2), and found the combination of high expressions of these genes significantly predicted a worse OS than the combination of low MCM expressions. The difference was also significantly pronounced than single high MCM expression group (Table 3, Fig 9A–9D). The nomogram also suggested that the MCM4, MCM5 and MCM8 genes could be used as prognostic indicators for LUAD (Fig 10).
Fig 7.
ROC curve for predicting survival in LUAD patients by the risk score MCM4 (A),MCM5 (B), and MCM8 (C).
Fig 8. Gene expression distribution of MCM genes in TCGA.
Table 2. Grouping information of joint survival analysis.
| Genes | Group | Combination |
|---|---|---|
| MCM4+MCM5 | ||
| Group A | low MCM4 + low MCM5 | |
| Group B | high MCM4 +low MCM5; low MCM4 +high MCM5 | |
| Group C | high MCM4 + high MCM5 | |
| MCM4+MCM8 | ||
| Group a | low MCM4 + low MCM8 | |
| Group b | high MCM4 +low MCM8; low MCM4 +high MCM8 | |
| Group c | high MCM4 + high MCM8 | |
| MCM5+MCM8 | ||
| Group i | low MCM5 + low MCM8 | |
| Group ii | high MCM5 +low MCM8; low MCM5 +high MCM8 | |
| Group iii | high MCM5 + high MCM8 | |
| MCM4+MCM5+MCM8 | ||
| Group I | low MCM4 + low MCM5 + low MCM8 | |
| Group II | high MCM4 + low MCM5 + low MCM8; low MCM4 + high MCM5 + low MCM8; low MCM4 + low MCM5 + high MCM8; high MCM4 + high MCM5 + low MCM8; low MCM4 + high MCM5 + high MCM8; high MCM4 + low MCM5 + high MCM8 |
|
| Group III | high MCM4 + high MCM5 + high MCM8 |
Notes: MCM, minichromosome maintenance.
Table 3. Joint effects survival analysis of clinical factors and the DEMs’ signature risk score with OS in LUAD patients.
| Gene combination | Groups | Event/Total | MST | Crude HR(95%CI) | Crude P | Adjusted HR(95%CI) | Adjusted P& |
|---|---|---|---|---|---|---|---|
| MCM4+MCM5 | |||||||
| Group A | 50/180 | 1790 | 1 | 1 | |||
| Group B | 46/140 | 1600 | 1.341(0.898–2.003) | 1.151 | 1.203(0.797–1.816) | 0.378 | |
| Group C | 86/180 | 1073 | 2.069(1.459–2.935) | <0.0001 | 1.680(1.175–2.402) | 0.004 | |
| MCM4+MCM8 | |||||||
| Group a | 83/250 | 1725 | 1 | 1 | |||
| Group b | 25/74 | 1235 | 1.475(0.940–2.316) | 0.091 | 1.52(0.968–2.388) | 0.069 | |
| Group c | 74/176 | 1258 | 1.580(1.152–2.166) | 0.005 | 1.351(0.981–1.860) | 0.066 | |
| MCM5+MCM8 | |||||||
| Group i | 83/250 | 1725 | 1 | 1 | |||
| Group ii | 24/84 | 1501 | 1.094(0.692–1.728) | 0.7 | 1.071(0.677–1.694) | 0.77 | |
| Group iii | 75/166 | 1115 | 1.788(1.306–2.449) | <0.0001 | 1.541(1.120–2.120) | 0.008 | |
| MCM4+MCM5+MCM8 | |||||||
| Group I | 52/176 | 1790 | 1 | 1 | |||
| Group II | 69/195 | 1501 | 1.617(1.126–2.322) | 0.009 | 1.541(1.065–2.230) | 0.022 | |
| Group III | 61/129 | 1115 | 2.152(1.483–3.122) | <0.0001 | 1.766(1.206–2.585) | 0.003 |
Notes: &Adjusted for tumor stage. MST, median survival time; HR, hazard ratio; CI, confidence interval; NA, not available;MCM, minichromosome maintenance; LUAD, lung adenocarcinoma.
Fig 9. Kaplan–Meier survival curve for joint effects analysis of MCM4, MCM5 and MCM8 genes in LUAD patients.
(A) Joint effects analysis of MCM4 and MCM5;(B) Joint effects analysis of MCM4 and MCM8; (C) Joint effects analysis of MCM5 and MCM8;(D) Joint effects analysis of MCM4, MCM5 and MCM8.
Fig 10. Nomogram for predicting the 1-,3- and 5-year event (death) with risk score and clinical information.
GSEA
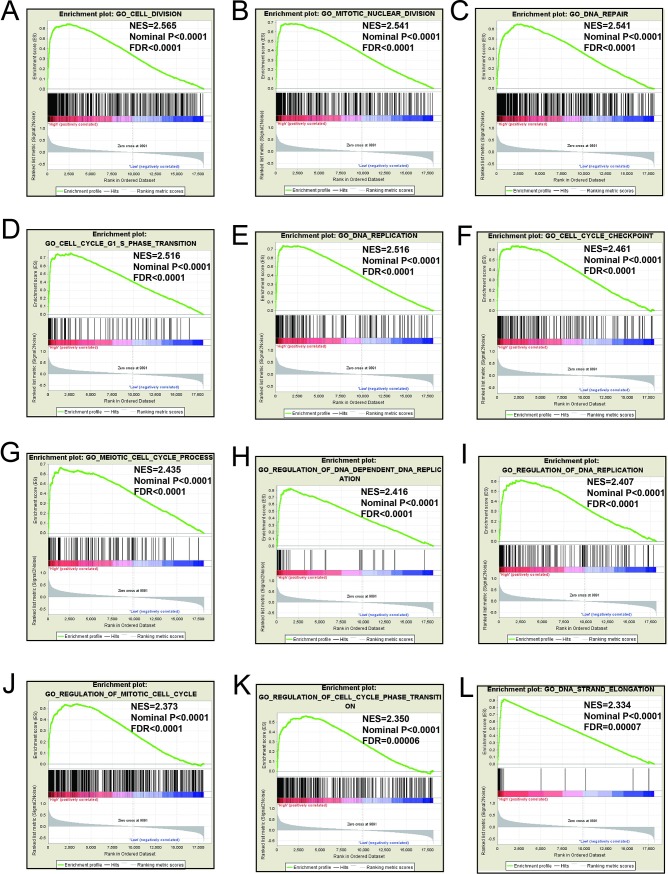
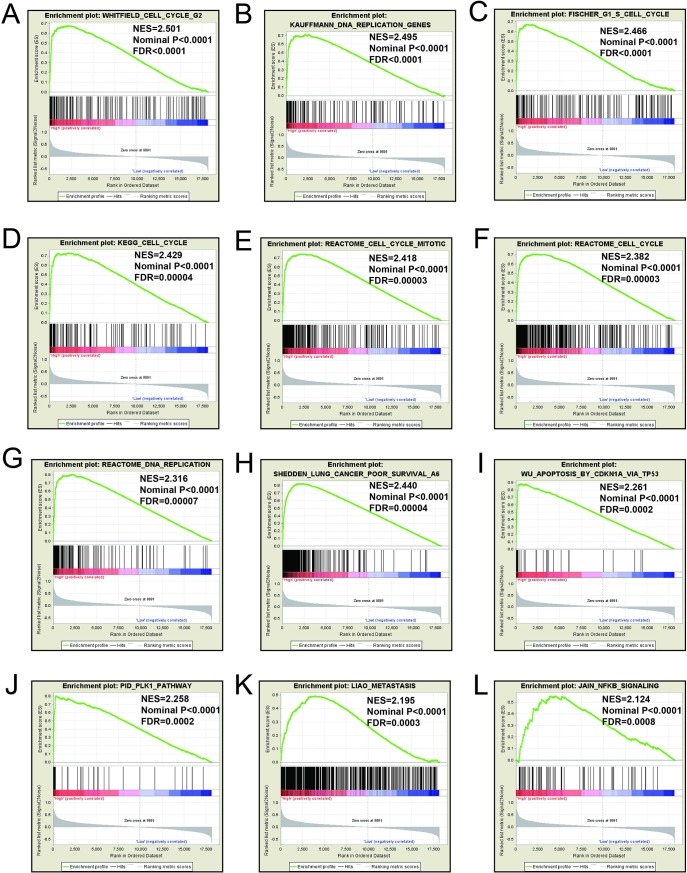
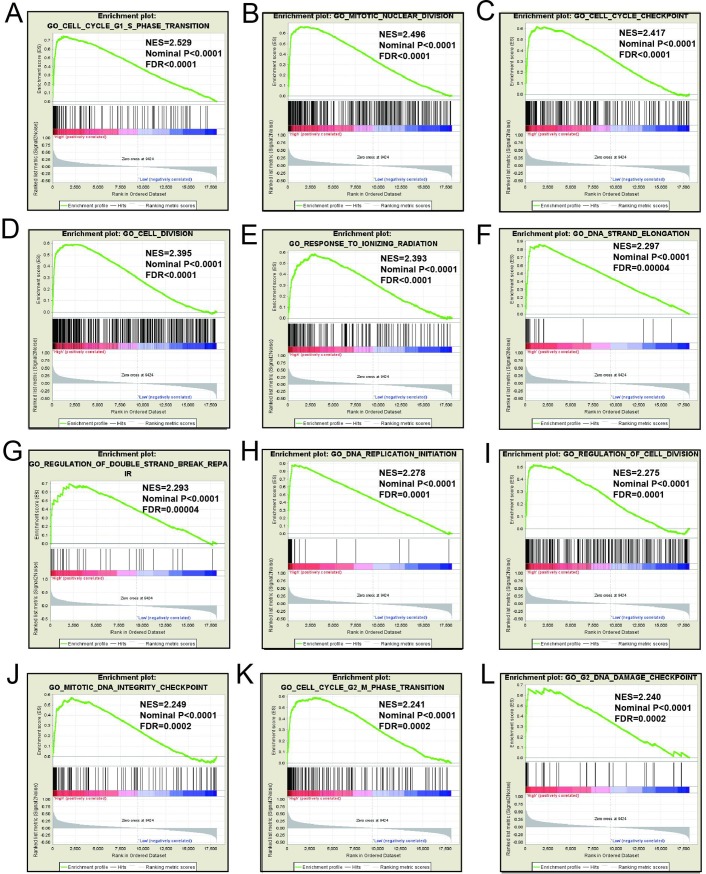
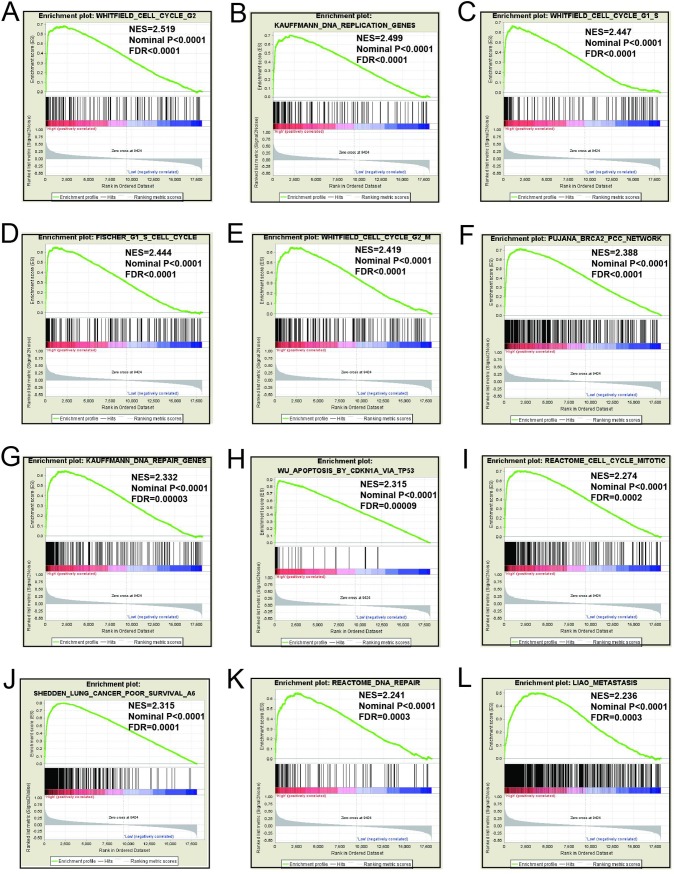
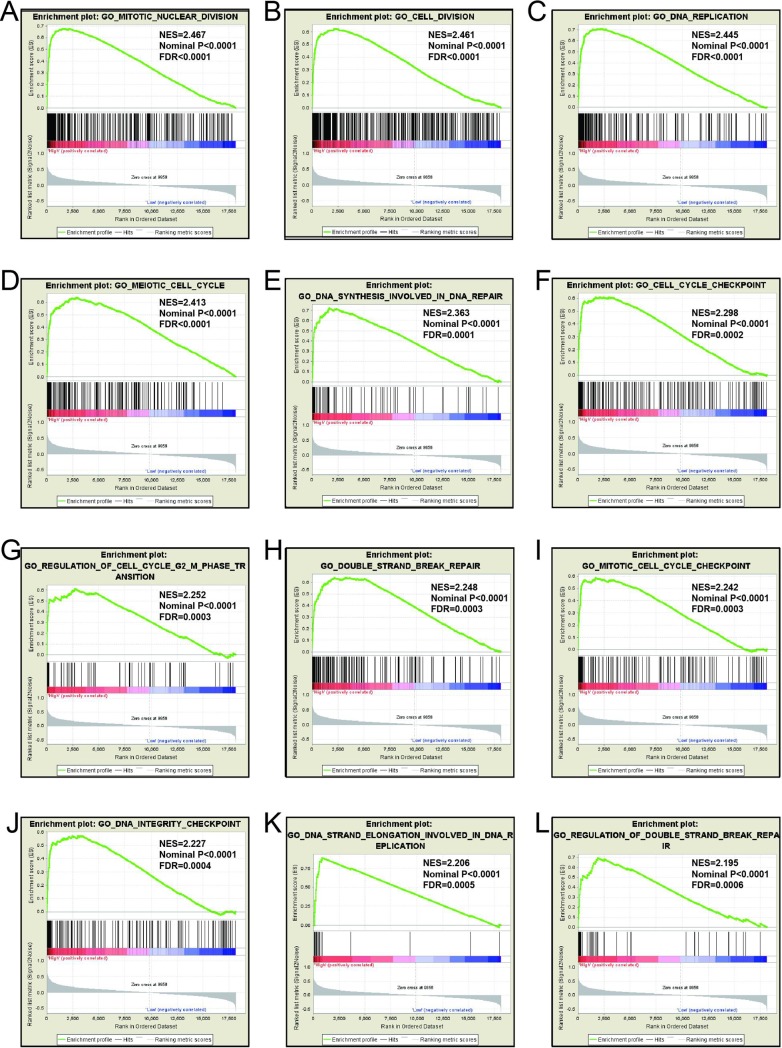
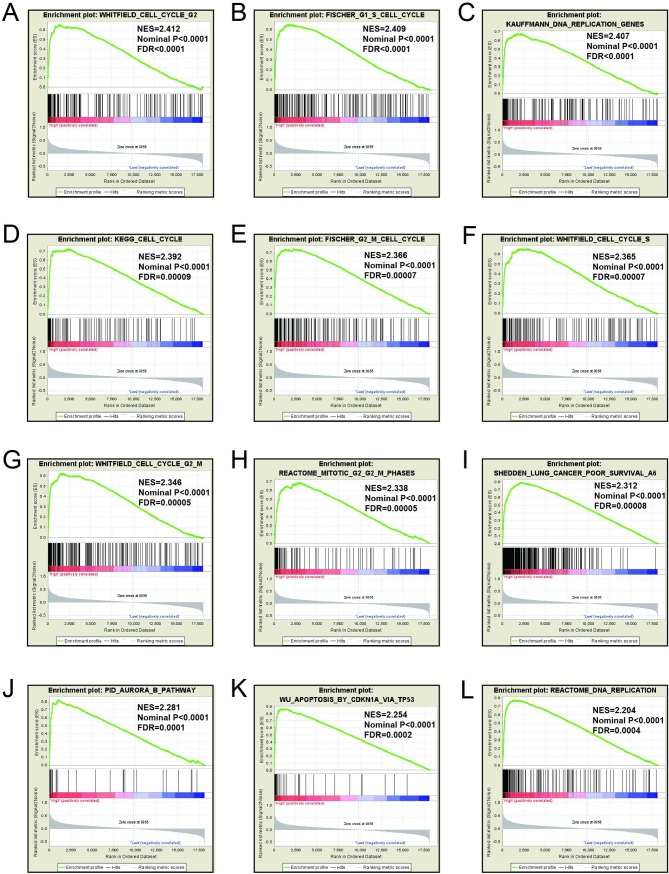
Mechanistic exploration of MCM4, MCM5, and MCM8 by GSEA showed that these genes may influence the LUAD prognosis by regulating cell cycle and DNA replication related biological events, cell and mitotic nuclear division, apoptosis by CDKN1A via TP53, as well as various other biological processes and pathways (Fig 11A–11L; Fig 12A–12L; Fig 13A–13L; Fig 14A–14L; Fig 15A–15L; Fig 16A–16L). Furthermore, the C2 enrichment also indicated that these genes to be relevantly involved with poor survival statistics of lung cancer (Fig 12H, Fig 14J, Fig 16I). C5 enrichment of MCM4 suggest that except for cell cycle and DNA replication, high MCM4 expression can also influence DNA repair (Fig 11), whereas the C2 enrichment suggested high MCM4 to regulate PLK1 pathway, metastasis, and NF-KB pathway (Fig 12). C5 enrichment of MCM5 indicate that high MCM5 expression also regulates the DNA damage checkpoint (Fig 13), wherein the C2 enrichment was suggestive that high MCM5 takes part in AURORA pathway, metastasis, and DNA repair (Fig 14). C5 enrichment of MCM8 indicate that high MCM8 expression modulates the DNA double strand break repair function (Fig 13), whereas the C2 enrichment speaks of MCM8 to be associated with AURORA pathway (Fig 14).
Fig 11. GSEA results of c5 reference gene sets for high MCM4 expression groups.
(A)Cell division(B)Nuclear division(C)DNA repair(D)Cell cycle G1 S phase transition(E)DNA replication(F)Cell cycle checkpoint(G)Meiotic cell cycle process(H)Regulation of DNA dependent(I)Regulation of DNA replication(J)Regulation of mitotic cell cycle(K)Regulation of cell cycle phase transition(L)DNA strand elongation.
Fig 12. GSEA results of c2 reference gene sets for high MCM4 expression groups.
(A)WHITFIELD cell cycle G2(B)KAUFFMANN DNA replication genes(C)FISCHER G1 S cell cycle(D)KEGG cell cycle(E)REACTOME cell cycle mitotic(F)Reactome cell cycle(G)REACTOME DNA replicatrion (H)SHEDDEN LUNG CANCER poor survival (I)Apoptosis by CDKN1A VIA TP53 (J)PID PLK1 pathway (K)LIAO metastasis (L)JIAN NFKB signaling.
Fig 13. GSEA results of c5 reference gene sets for high MCM5 expression groups.
(A) Cell cycle G1 S phase transition (B)Nuclear division(C) Cell cycle checkpoint (D) Cell division (E)Response to ionizing radiation(F)DNA strand elongation(G)Regulation of double strand break repair(H)DNA replication initiation(I) Regulation of cell division (J)Mitotic DNA integrity checkpoint (K) Cell cycle G2 M phase transition (L) G2 DNA demage checkpoint.
Fig 14. GSEA results of c2 reference gene sets for high MCM5 expression groups.
(A)WHITFIELD cell cycle G2(B)KAUFFMANN DNA replication genes(C) WHITFIELD cell cycle G1 S(D) FISCHER G1 S cell cycle (E)WHITFIELD cell cycle G2 M(F)PUJANA BRCA2 pcc network(G) KAUFFMANN DNA repair genes(H)WU Apoptosis by CDKN1A VIA TP53 (I) REACTOME cell cycle mitotic(J) SHEDDEN LUNG CANCER poor survival(K) REACTOME DNA repair (L)LIAO metastasis.
Fig 15. GSEA results of c5 reference gene sets for high MCM8 expression groups.
(A) Meiotic nuclear division(B)Cell division(C)DNA replication(D)Meiotic Cell cycle(E)DNA synthesis involved in DNA repair(F)Cell cycle checkpoint(G)Regulation of cell cycle G2 M phase transition(H)Double strand break repair(I)Meiotic cell cycle checkpoint (J)DNA ingegrity checkpoint (K) DNA strand elongation (L)Regulation of double strand break repair.
Fig 16. GSEA results of c2 reference gene sets for high MCM8 expression groups.
(A)WHITFIELD cell cycle G2(B) FISCHER G1 S cell cycle (C) KAUFFMANN DNA replication genes(D)KEGG cell cycle(E) FISCHER G2 M cell cycle (F) WHITFIELD cell cycle S (G) WHITFIELD cell cycle G2 M(H) REACTOME mitotic G2 M phases(I) SHEDDEN LUNG CANCER poor survival A6 (J)PID AURORA B pathway (K) Apoptosis by CDKN1A VIA TP53 (L) REACTOME DNA replication.
Discussion
The MCM protein family, which is encoded by MCM genes, is a highly conserved family with closely related members. It is composed of six subunits, including MCM2, MCM3, MCM4 (CDC21), MCM5 (CDC46), MCM6 (Mis5) and MCM7 (CDC47), and exhibit the helicase activity of replicating DNA.[26]MCM8, MCM9, MCM1 and MCM10 are also found in multicellular organisms and play crucial functions in DNA replication.[7,27]Our bioinformatics analysis also demonstrated that MCM1-10 is involved in cell cycle and replication of DNA. Co-expression analysis substantiated that production of MCM1-10 were strongly co-regulated both in genetics and proteomic levels, as well as in LUAD tumor tissues.
Numerous studies have observed dysregulation of MCM1–10 in multiple cancers, and serve as potential diagnostic biomarkers. Previous reports showed increased expression of MCM2 in colorectal cancer (CRC) tissues could be adopted as diagnostic biomarker.[28]The MCM3 immune-histochemical staining can be adopted as biomarker for oral squamous cell carcinoma early detection.[29] MCM4 has been opined to participate in the tumorigenesis of esophageal cancer.[30,31]Different cancers like pancreaticobiliary malignancy (PBC), [32,33]esophageal cancer [11]and cervical cancer (CC)[34] have been studied in the light of MCM5 as a diagnostic marker. MCM6 may serve as potential biomarkers in patients with hepatocellular carcinoma(HCC)[22]. In addition, MCM7 has been helpful in early detection of gastric cancer (GC) [35], and altered diagnosis between malignant mesothelioma (MMCS) and reactive mesothelial cells (MCS)[36]. Deregulation of MCM2–7 can be potential biomarkers in meningioma tumor tissues[37].Consistent with the previous findings, our present work observed deregulations of MCM1–10 genes in LUAD cancer tissues which can be serve as potential diagnostic biomarkers.
In current study, we identified and verified MCM4, MCM5, and MCM8 levels to be significantly correlated to LUAD OS in TCGA and KM plotter cohorts. High expression of these genes significantly involved in LUADs poor clinical outcome. Joint effects survival analysis suggested that the combined high expressions of MCM significantly predicted a worse OS than the combination of both low MCM expressions. Similar to the results of previous studies, there are several reports that high MCM genes were involved with poor OS in multiple cancers. Multiple reports have substantiated that the elevated MCM2 production was associated with a poor prognosis in GC patients,[38,39] lung cancer (LC),[40] and urothelial bladder carcinomas (BUCS).[41]High MCM3 was significantly associated with OS in patients with astrocytoma.[42] It was previously observed that the high MCM4 expression predicts detrimental prognosis in patients with esophageal adenocarcinoma (EAC).[31] Study suggested that MCM4 profiling could potentially be used to predict response to treatment and prognosis in laryngeal squamous cell carcinoma (SCC)[43].Upregulation of MCM5 was also observed in LC and CC, and patients with high MCM 5 expression faced increased morbidity.[44,45] Previous studies observed that the elevated status of MCM6 was proportional to unfavorable prognosis in patients with non-small cell lung carcinoma(NSCLC),[46]mantle cell lymphoma(MCL),[47]and endometrioid endometrial adenocarcinoma(EEA)[48]in both the protein and mRNA level.MCM7 expression identified by immune-histochemical staining also observed the similar results in NSCLC.[49,50]These previous studies proved that the MCM7 gene can serve as a prognostic biomarker, and high amounts of the protein in these tumors show significant correlation with an unfavorable OS thus making MCM7 a significant prognostic biomarker. Literature review also suggests prognostic values of MCM1-10 in LUAD, and indicates that MCM genes may be considered to be oncogenes in multiple cancer types. At present, there are few studies on MCM8.Study has shown that MCM2, 4, 8 and 10 overexpression is associated with shorter overall survival for PC. Further multivariate analysis showed that MCM8 is an independent prognostic factor. However, our results still need further in vivo and in vitro experimental verifications.
GSEA for different expression levels of MCM4, MCM5 and MCM8 indicated that significant correlation of the genes with lung cancer progression and survival. Potential molecular mechanisms of MCM4, MCM5 and MCM8 in LUAD prognosis may involve different biological functions of the cell cycle, DNA replication, DNA repair, NF-kB, apoptosis via TP53 and AURORA B pathway. As we all know, MCM genes are pivotal for DNA replication and cell cycle process.[7]Study showed that enhanced NF-κB expression as a prognostic predictor is positively correlated with poor survival outcome of NSCLC patients.[51]MCM4 may affect the prognosis of lung cancer via NF-κB pathway.[52] Aurora kinase B regulates cell mitosis by adjusting the chromosomal passenger complex. MCM genes may regulate cell mitosis via AURORA B pathway.[53]However, this conjecture should be further validated.
The present study comes with its own limitations which require explanation. The RNA-seq dataset and clinical parameters included in our work were downloaded from TCGA website, and these data were imperfect and incomplete. Therefore, a perfect multivariate Cox proportional hazards regression model analysis which considered all LUAD relative prognostic clinical parameters was beyond the scope of the study. Second, since our current study only focusses on LUAD, the diagnostic and prognostic values in the lung cancer remains to be further explored and the molecular mechanism is yet to be further confirmed.
In spite of the above limitations, our study has implicated MCM4, MCM5 and MCM8 in prognosis of patients with LUAD, and also unraveled their molecular mechanism(s) in LUAD through GSEA. In addition, we also observed the dysregulation of MCM genes also can function as potential diagnostic biomarkers in patients with LUAD. Once these results are verified in the sample proteome, these MCM genes may have underlying clinical values in LUAD. However, our findings still need to be verified in another prospective study with larger cohort and design.
Conclusions
In current study, we found that MCM1-10 have underlying diagnostic values in individuals suffering from LUAD. MCM4, MCM5 and MCM8 may be considered as potential prognostic biomarkers in patients with LUAD as observed from survival analysis results. Combination of MCM4, MCM5 and MCM8 could also be adopted as independent indicators for LUAD OS prediction as observed through joint effects survival analysis. The potential molecular mechanism of MCM4, MCM5 and MCM8 in LUAD prognosis may correlate to cell cycle, DNA repair and DNA replication associated biological functions and signaling pathways. However, these prospective molecular mechanisms and clinical significance still need in vivo, in vitro experiments and clinical trial validations.
Supporting information
MERAV boxplots for MCM genes expression in normal lung tissue and lung cancer tissue: MCM1 (A), MCM2 (B), MCM3 (C), MCM4(D), MCM5 (E), MCM6 (F) MCM7 (G) MCM8 (H) MCM9 (I)and MCM10 (J).
(TIF)
Acknowledgments
The researchers acknowledge the contributors of TCGA (https://portal.gdc.cancer.gov/exploration?filters=%7B%22op%22%3A%22and%22%2C%22content%22%3A%5B%7B%22op%22%3A%22in%22%2C%22content%22%3A%7B%22field%22%3A%22cases.primary_site%22%2C%22value%22%3A%5B%22Bronchus%20and%20lung%22%5D%7D%7D%5D%7D) database for sharing the LUAD dataset with open access.
Data Availability
The data used to support the findings of this study are included within the article. All raw RNA‑seq dataset of LUAD, which include into current study, can be downloaded from TCGA Data Portal (https://portal.gdc.cancer.gov/exploration?filters=%7B%22op%22%3A%22and%22%2C%22content%22%3A%5B%7B%22op%22%3A%22in%22%2C%22content%22%3A%7B%22field%22%3A%22cases.primary_site%22%2C%22value%22%3A%5B%22Bronchus%20and%20lung%22%5D%7D%7D%5D%7D).
Funding Statement
This work was supported by grants from the National Natural Science Foundation of China (grant nos. 81460460, 81360405 and 81760542), the Foundation of Sharing Project Based on Tumor Precise Radiotherapy (grant no. ZY18076006) and the Research Foundation of the Science and Technology Department of Guangxi Province, China (grant nos. 2016GXNSFAA380252).
References
- 1.Bray F, Ferlay J, Soerjomataram I, Siegel RL, Torre LA, et al. (2018) Global cancer statistics 2018: GLOBOCAN estimates of incidence and mortality worldwide for 36 cancers in 185 countries. CA Cancer J Clin 68: 394–424. 10.3322/caac.21492 [DOI] [PubMed] [Google Scholar]
- 2.Goldstraw P, Ball D, Jett JR, Le Chevalier T, Lim E, et al. (2011) Non-small-cell lung cancer. Lancet 378: 1727–1740. 10.1016/S0140-6736(10)62101-0 [DOI] [PubMed] [Google Scholar]
- 3.Cancer Genome Atlas Research N (2014) Comprehensive molecular profiling of lung adenocarcinoma. Nature 511: 543–550. 10.1038/nature13385 [DOI] [PMC free article] [PubMed] [Google Scholar]
- 4.Herbst RS, Heymach JV, Lippman SM (2008) Lung cancer. N Engl J Med 359: 1367–1380. 10.1056/NEJMra0802714 [DOI] [PMC free article] [PubMed] [Google Scholar]
- 5.Moore W, Talati R, Bhattacharji P, Bilfinger T (2015) Five-year survival after cryoablation of stage I non-small cell lung cancer in medically inoperable patients. J Vasc Interv Radiol 26: 312–319. 10.1016/j.jvir.2014.12.006 [DOI] [PubMed] [Google Scholar]
- 6.Jenkinson ER, Chong JP (2006) Minichromosome maintenance helicase activity is controlled by N- and C-terminal motifs and requires the ATPase domain helix-2 insert. Proc Natl Acad Sci U S A 103: 7613–7618. 10.1073/pnas.0509297103 [DOI] [PMC free article] [PubMed] [Google Scholar]
- 7.Kearsey SE, Labib K (1998) MCM proteins: evolution, properties, and role in DNA replication. Biochim Biophys Acta 1398: 113–136. 10.1016/s0167-4781(98)00033-5 [DOI] [PubMed] [Google Scholar]
- 8.Ramnath N, Hernandez FJ, Tan DF, Huberman JA, Natarajan N, et al. (2001) MCM2 is an independent predictor of survival in patients with non-small-cell lung cancer. J Clin Oncol 19: 4259–4266. 10.1200/JCO.2001.19.22.4259 [DOI] [PubMed] [Google Scholar]
- 9.Gonzalez MA, Pinder SE, Callagy G, Vowler SL, Morris LS, et al. (2003) Minichromosome maintenance protein 2 is a strong independent prognostic marker in breast cancer. J Clin Oncol 21: 4306–4313. 10.1200/JCO.2003.04.121 [DOI] [PubMed] [Google Scholar]
- 10.Zhong H, Chen B, Neves H, Xing J, Ye Y, et al. (2017) Expression of minichromosome maintenance genes in renal cell carcinoma. Cancer Manag Res 9: 637–647. 10.2147/CMAR.S146528 [DOI] [PMC free article] [PubMed] [Google Scholar]
- 11.Williams GH, Swinn R, Prevost AT, De Clive-Lowe P, Halsall I, et al. (2004) Diagnosis of oesophageal cancer by detection of minichromosome maintenance 5 protein in gastric aspirates. Br J Cancer 91: 714–719. 10.1038/sj.bjc.6602028 [DOI] [PMC free article] [PubMed] [Google Scholar]
- 12.Dudderidge TJ, Kelly JD, Wollenschlaeger A, Okoturo O, Prevost T, et al. (2010) Diagnosis of prostate cancer by detection of minichromosome maintenance 5 protein in urine sediments. Br J Cancer 103: 701–707. 10.1038/sj.bjc.6605785 [DOI] [PMC free article] [PubMed] [Google Scholar]
- 13.Cancer Genome Atlas Research N, Weinstein JN, Collisson EA, Mills GB, Shaw KR, et al. (2013) The Cancer Genome Atlas Pan-Cancer analysis project. Nat Genet 45: 1113–1120. 10.1038/ng.2764 [DOI] [PMC free article] [PubMed] [Google Scholar]
- 14.Gyorffy B, Surowiak P, Budczies J, Lanczky A (2013) Online survival analysis software to assess the prognostic value of biomarkers using transcriptomic data in non-small-cell lung cancer. PLoS One 8: e82241 10.1371/journal.pone.0082241 [DOI] [PMC free article] [PubMed] [Google Scholar]
- 15.Huang da W, Sherman BT, Lempicki RA (2009) Systematic and integrative analysis of large gene lists using DAVID bioinformatics resources. Nat Protoc 4: 44–57. 10.1038/nprot.2008.211 [DOI] [PubMed] [Google Scholar]
- 16.Huang da W, Sherman BT, Lempicki RA (2009) Bioinformatics enrichment tools: paths toward the comprehensive functional analysis of large gene lists. Nucleic Acids Res 37: 1–13. 10.1093/nar/gkn923 [DOI] [PMC free article] [PubMed] [Google Scholar]
- 17.Warde-Farley D, Donaldson SL, Comes O, Zuberi K, Badrawi R, et al. (2010) The GeneMANIA prediction server: biological network integration for gene prioritization and predicting gene function. Nucleic Acids Res 38: W214–220. 10.1093/nar/gkq537 [DOI] [PMC free article] [PubMed] [Google Scholar]
- 18.Szklarczyk D, Franceschini A, Wyder S, Forslund K, Heller D, et al. (2015) STRING v10: protein-protein interaction networks, integrated over the tree of life. Nucleic Acids Res 43: D447–452. 10.1093/nar/gku1003 [DOI] [PMC free article] [PubMed] [Google Scholar]
- 19.von Mering C, Huynen M, Jaeggi D, Schmidt S, Bork P, et al. (2003) STRING: a database of predicted functional associations between proteins. Nucleic Acids Res 31: 258–261. 10.1093/nar/gkg034 [DOI] [PMC free article] [PubMed] [Google Scholar]
- 20.Szklarczyk D, Morris JH, Cook H, Kuhn M, Wyder S, et al. (2017) The STRING database in 2017: quality-controlled protein-protein association networks, made broadly accessible. Nucleic Acids Res 45: D362–D368. 10.1093/nar/gkw937 [DOI] [PMC free article] [PubMed] [Google Scholar]
- 21.Shaul YD, Yuan B, Thiru P, Nutter-Upham A, McCallum S, et al. (2016) MERAV: a tool for comparing gene expression across human tissues and cell types. Nucleic Acids Res 44: D560–566. 10.1093/nar/gkv1337 [DOI] [PMC free article] [PubMed] [Google Scholar]
- 22.Liao X, Liu X, Yang C, Wang X, Yu T, et al. (2018) Distinct Diagnostic and Prognostic Values of Minichromosome Maintenance Gene Expression in Patients with Hepatocellular Carcinoma. J Cancer 9: 2357–2373. 10.7150/jca.25221 [DOI] [PMC free article] [PubMed] [Google Scholar]
- 23.Subramanian A, Tamayo P, Mootha VK, Mukherjee S, Ebert BL, et al. (2005) Gene set enrichment analysis: a knowledge-based approach for interpreting genome-wide expression profiles. Proc Natl Acad Sci U S A 102: 15545–15550. 10.1073/pnas.0506580102 [DOI] [PMC free article] [PubMed] [Google Scholar]
- 24.Liberzon A, Subramanian A, Pinchback R, Thorvaldsdottir H, Tamayo P, et al. (2011) Molecular signatures database (MSigDB) 3.0. Bioinformatics 27: 1739–1740. 10.1093/bioinformatics/btr260 [DOI] [PMC free article] [PubMed] [Google Scholar]
- 25.Reiner A, Yekutieli D, Benjamini Y (2003) Identifying differentially expressed genes using false discovery rate controlling procedures. Bioinformatics 19: 368–375. 10.1093/bioinformatics/btf877 [DOI] [PubMed] [Google Scholar]
- 26.Labib K, Tercero JA, Diffley JF (2000) Uninterrupted MCM2-7 function required for DNA replication fork progression. Science 288: 1643–1647. 10.1126/science.288.5471.1643 [DOI] [PubMed] [Google Scholar]
- 27.Tye BK (1999) MCM proteins in DNA replication. Annu Rev Biochem 68: 649–686. 10.1146/annurev.biochem.68.1.649 [DOI] [PubMed] [Google Scholar]
- 28.Davies RJ, Freeman A, Morris LS, Bingham S, Dilworth S, et al. (2002) Analysis of minichromosome maintenance proteins as a novel method for detection of colorectal cancer in stool. Lancet 359: 1917–1919. 10.1016/S0140-6736(02)08739-1 [DOI] [PubMed] [Google Scholar]
- 29.Rezazadeh F, Ebrahimi R, Andisheh-Tadbir A, Ashraf MJ, Khademi B (2017) Evaluation of the Ki-67 and MCM3 Expression in Cytologic Smear of Oral Squamous Cell Carcinoma. J Dent (Shiraz) 18: 207–211. [PMC free article] [PubMed] [Google Scholar]
- 30.Huang XP, Zhang X, Su XD, Ma GW, Zhao JM, et al. (2007) [Expression and significance of MCM4 in esophageal cancer]. Ai Zheng 26: 96–99. [PubMed] [Google Scholar]
- 31.Choy B, LaLonde A, Que J, Wu T, Zhou Z (2016) MCM4 and MCM7, potential novel proliferation markers, significantly correlated with Ki-67, Bmi1, and cyclin E expression in esophageal adenocarcinoma, squamous cell carcinoma, and precancerous lesions. Hum Pathol 57: 126–135. 10.1016/j.humpath.2016.07.013 [DOI] [PMC free article] [PubMed] [Google Scholar]
- 32.Ayaru L, Stoeber K, Webster GJ, Hatfield AR, Wollenschlaeger A, et al. (2008) Diagnosis of pancreaticobiliary malignancy by detection of minichromosome maintenance protein 5 in bile aspirates. Br J Cancer 98: 1548–1554. 10.1038/sj.bjc.6604342 [DOI] [PMC free article] [PubMed] [Google Scholar]
- 33.Keane MG, Huggett MT, Chapman MH, Johnson GJ, Webster GJ, et al. (2017) Diagnosis of pancreaticobiliary malignancy by detection of minichromosome maintenance protein 5 in biliary brush cytology. Br J Cancer 116: 349–355. 10.1038/bjc.2016.447 [DOI] [PMC free article] [PubMed] [Google Scholar]
- 34.Mukherjee G, Muralidhar B, Bafna UD, Laskey RA, Coleman N (2007) MCM immunocytochemistry as a first line cervical screening test in developing countries: a prospective cohort study in a regional cancer centre in India. Br J Cancer 96: 1107–1111. 10.1038/sj.bjc.6603679 [DOI] [PMC free article] [PubMed] [Google Scholar]
- 35.Yang JY, Li D, Zhang Y, Guan BX, Gao P, et al. (2018) The Expression of MCM7 is a Useful Biomarker in the Early Diagnostic of Gastric Cancer. Pathol Oncol Res 24: 367–372. 10.1007/s12253-017-0251-1 [DOI] [PubMed] [Google Scholar]
- 36.Kimura F, Okayasu I, Kakinuma H, Satoh Y, Kuwao S, et al. (2013) Differential diagnosis of reactive mesothelial cells and malignant mesothelioma cells using the cell proliferation markers minichromosome maintenance protein 7, geminin, topoisomerase II alpha and Ki-67. Acta Cytol 57: 384–390. 10.1159/000350262 [DOI] [PubMed] [Google Scholar]
- 37.Saydam O, Senol O, Schaaij-Visser TB, Pham TV, Piersma SR, et al. (2010) Comparative protein profiling reveals minichromosome maintenance (MCM) proteins as novel potential tumor markers for meningiomas. J Proteome Res 9: 485–494. 10.1021/pr900834h [DOI] [PMC free article] [PubMed] [Google Scholar]
- 38.Liu M, Li JS, Tian DP, Huang B, Rosqvist S, et al. (2013) MCM2 expression levels predict diagnosis and prognosis in gastric cardiac cancer. Histol Histopathol 28: 481–492. 10.14670/HH-28.481 [DOI] [PubMed] [Google Scholar]
- 39.Czyzewska J, Guzinska-Ustymowicz K, Pryczynicz A, Kemona A, Bandurski R (2009) Immunohistochemical evaluation of Ki-67, PCNA and MCM2 proteins proliferation index (PI) in advanced gastric cancer. Folia Histochem Cytobiol 47: 289–296. 10.2478/v10042-009-0042-y [DOI] [PubMed] [Google Scholar]
- 40.Yang J, Ramnath N, Moysich KB, Asch HL, Swede H, et al. (2006) Prognostic significance of MCM2, Ki-67 and gelsolin in non-small cell lung cancer. BMC Cancer 6: 203 10.1186/1471-2407-6-203 [DOI] [PMC free article] [PubMed] [Google Scholar]
- 41.Korkolopoulou P, Givalos N, Saetta A, Goudopoulou A, Gakiopoulou H, et al. (2005) Minichromosome maintenance proteins 2 and 5 expression in muscle-invasive urothelial cancer: a multivariate survival study including proliferation markers and cell cycle regulators. Hum Pathol 36: 899–907. 10.1016/j.humpath.2005.06.008 [DOI] [PubMed] [Google Scholar]
- 42.Soling A, Sackewitz M, Volkmar M, Schaarschmidt D, Jacob R, et al. (2005) Minichromosome maintenance protein 3 elicits a cancer-restricted immune response in patients with brain malignancies and is a strong independent predictor of survival in patients with anaplastic astrocytoma. Clin Cancer Res 11: 249–258. [PubMed] [Google Scholar]
- 43.Han J, Lian M, Fang J, Liu H, Wang R, et al. (2017) Minichromosome maintenance (MCM) protein 4 overexpression is a potential prognostic marker for laryngeal squamous cell carcinoma. J BUON 22: 1272–1277. [PubMed] [Google Scholar]
- 44.Liu YZ, Wang BS, Jiang YY, Cao J, Hao JJ, et al. (2017) MCMs expression in lung cancer: implication of prognostic significance. J Cancer 8: 3641–3647. 10.7150/jca.20777 [DOI] [PMC free article] [PubMed] [Google Scholar]
- 45.Wang D, Li Q, Li Y, Wang H (2018) The role of MCM5 expression in cervical cancer: Correlation with progression and prognosis. Biomed Pharmacother 98: 165–172. 10.1016/j.biopha.2017.12.006 [DOI] [PubMed] [Google Scholar]
- 46.Vigouroux C, Casse JM, Battaglia-Hsu SF, Brochin L, Luc A, et al. (2015) Methyl(R217)HuR and MCM6 are inversely correlated and are prognostic markers in non small cell lung carcinoma. Lung Cancer 89: 189–196. 10.1016/j.lungcan.2015.05.008 [DOI] [PubMed] [Google Scholar]
- 47.Schrader C, Janssen D, Klapper W, Siebmann JU, Meusers P, et al. (2005) Minichromosome maintenance protein 6, a proliferation marker superior to Ki-67 and independent predictor of survival in patients with mantle cell lymphoma. Br J Cancer 93: 939–945. 10.1038/sj.bjc.6602795 [DOI] [PMC free article] [PubMed] [Google Scholar]
- 48.Hotton J, Agopiantz M, Leroux A, Charra-Brunaud C, Marie B, et al. (2018) Minichromosome maintenance complex component 6 (MCM6) expression correlates with histological grade and survival in endometrioid endometrial adenocarcinoma. Virchows Arch 472: 623–633. 10.1007/s00428-017-2278-9 [DOI] [PubMed] [Google Scholar]
- 49.Toyokawa G, Masuda K, Daigo Y, Cho HS, Yoshimatsu M, et al. (2011) Minichromosome Maintenance Protein 7 is a potential therapeutic target in human cancer and a novel prognostic marker of non-small cell lung cancer. Mol Cancer 10: 65 10.1186/1476-4598-10-65 [DOI] [PMC free article] [PubMed] [Google Scholar]
- 50.Liu YZ, Jiang YY, Hao JJ, Lu SS, Zhang TT, et al. (2012) Prognostic significance of MCM7 expression in the bronchial brushings of patients with non-small cell lung cancer (NSCLC). Lung Cancer 77: 176–182. 10.1016/j.lungcan.2012.03.001 [DOI] [PubMed] [Google Scholar]
- 51.Zhang Z, Ma J, Li N, Sun N, Wang C (2006) Expression of nuclear factor-kappaB and its clinical significance in nonsmall-cell lung cancer. Ann Thorac Surg 82: 243–248. 10.1016/j.athoracsur.2006.01.049 [DOI] [PubMed] [Google Scholar]
- 52.Yu J, Wang L, Zhang T, Shen H, Dong W, et al. (2015) Co-expression of beta-arrestin1 and NF-small ka, CyrillicB is associated with cancer progression and poor prognosis in lung adenocarcinoma. Tumour Biol 36: 6551–6558. 10.1007/s13277-015-3349-7 [DOI] [PubMed] [Google Scholar]
- 53.Bolanos-Garcia VM (2005) Aurora kinases. Int J Biochem Cell Biol 37: 1572–1577. 10.1016/j.biocel.2005.02.021 [DOI] [PubMed] [Google Scholar]
Associated Data
This section collects any data citations, data availability statements, or supplementary materials included in this article.
Supplementary Materials
MERAV boxplots for MCM genes expression in normal lung tissue and lung cancer tissue: MCM1 (A), MCM2 (B), MCM3 (C), MCM4(D), MCM5 (E), MCM6 (F) MCM7 (G) MCM8 (H) MCM9 (I)and MCM10 (J).
(TIF)
Data Availability Statement
The data used to support the findings of this study are included within the article. All raw RNA‑seq dataset of LUAD, which include into current study, can be downloaded from TCGA Data Portal (https://portal.gdc.cancer.gov/exploration?filters=%7B%22op%22%3A%22and%22%2C%22content%22%3A%5B%7B%22op%22%3A%22in%22%2C%22content%22%3A%7B%22field%22%3A%22cases.primary_site%22%2C%22value%22%3A%5B%22Bronchus%20and%20lung%22%5D%7D%7D%5D%7D).


