

Abstract
Cellulose nanocrystal (CNC)-reinforced poly(lactic acid) (PLA) nanocomposites were prepared by twin-screw extrusion followed by injection-molding using a masterbatch approach. Noncovalent modification of CNCs was performed with two different poly(l-lactide) (PLLA)-based surfactants to improve the filler/matrix compatibility. They both have a PLLA block that is expected to improve the compatibility with the PLA matrix and differ by the polar head. It consists of either a poly(ethylene glycol) (PEG) block (PEG-b-PLLA) or an imidazolium group (Im-PLLA), that is able to interact with the surface of the CNCs. The morphological, structural, thermal, rheological, and mechanical properties of the nanocomposites were investigated. The different modes of interaction of the polar head of the surfactant lead to different properties. However, the global decrease in the molecular weight of PLA, induced by the short PLLA blocks from the surfactants and the possible degradation during melt processing, results in a plasticization effect and impacts the crystallization of the matrix.
1. Introduction
Polymer nanocomposites consisting of natural or synthetic polymers reinforced with nanoscale particles have established themselves as a promising class of materials. The nanoscale dispersion of the filler in the polymer matrix leads to the generation of a tremendous amount of interfacial contacts between both the parent components. If an efficient stress transfer can be met at the interface, it results in materials with improved mechanical properties and has huge potential applications in different areas of technology.
Aiming to obtain materials with a more environmentally friendly life cycle, the emergence of bionanocomposites has gained great interest during the last years, using renewable and biodegradable nanofillers such as polysaccharide-based nanoparticles.1−3 Among these particles, cellulose nanocrystals (CNCs) have emerged as a principal candidate to be considered as nanofillers for the preparation of such nanocomposites. These nanoparticles exhibit some remarkable properties such as high surface area, low density, and high mechanical strength and stiffness (modulus in the range of 130–200 GPa).3 Interestingly, they come from abundant sources and also present properties such as renewability and biodegradability and have no toxicity.4 Moreover, the cost of the raw material is less, and in the last few years, several facilities producing CNCs in large scale have been announced.5
It is well-established that CNCs can positively influence the macroscopic properties of polymers.1−3 The potential of this nanomaterial has been proven for special functional nanomaterials,6 but improvement of the mechanical properties is the most common objective targeted when preparing CNC-reinforced nanocomposites.7−9 However, the full reinforcing potential is limited by certain preparation conditions, for example, casting/evaporation from a liquid medium that allows the efficient formation of a rigid percolating network.10,11 Despite its efficiency, this processing method is time-consuming and solvent-dependent.12−15 The application of industrial-scale processing methods (e.g., extrusion and injection-molding) is still under investigation. These methods are faster and solvent-free but can cause thermal and physical degradation of the nanoparticles during processing.16−18 Furthermore, continuous shear is imposed on the sample during melt processing, hindering the possible formation of a percolating nanoparticle network and demanding a higher volume fraction to reach similar properties than cast/evaporated materials.19 Aside from these shearing issues, the direct mixing of neat hydrophilic CNCs into melt polymer matrices, in most cases being hydrophobic ones, remains inefficient.
Indeed, the right combination of a similar surface chemistry and an adequate shear rate is needed to reach a satisfactory level of particle dispersion within the polymeric matrix.20,21 As a consequence, the surface chemical modification of CNCs with small appends or polymeric grafts has been extensively used to tune their surface chemistry and enhance the dispersion of the filler in a broad variety of polymers. Successful improvement of filler-polymer compatibility and dispersion level has been reported. Unfortunately, this methodology is quite difficult to scale up.22,23 Interestingly, the use of masterbatches was recently investigated as a new way to avoid CNC aggregation during the drying stage before extrusion.24,25 Nevertheless, the reinforcing effect is often lower than expected and difficult to dissociate from the CNC-induced crystallization phenomenon when using a semicrystalline polymeric matrix. Alternative to covalent grafting of functional groups or long chains to the CNC surface, the use of surfactants arises as a more practical option. In addition, adsorption of the molecular surfactant can be strengthened through electrostatic interactions (CNCs usually present a negative surface charge resulting from the sulfuric acid hydrolysis step).26
In the present study, we used noncovalent modification of CNCs involving surfactants bearing a poly(l-lactide) (PLLA) block. This tail is expected to interact with poly(lactic acid) (PLA) that will be used as the matrix to prepare nanocomposites. Two different PLLA-based surfactants were prepared, which differ by their polar heads. It consists of either a poly(ethylene glycol) (PEG) block (PEG-b-PLLA) or an imidazolium group (Im-PLLA) that is able to interact in different ways with the surface of the CNCs. The interaction of Im-PLLA and PEG-b-PLLA with CNCs was characterized, and both surfactants were used as compatibilizing agents in the preparation of CNC–PLA composites. The dispersion of the nanoparticles was studied by microscopic observations, and the final properties of the nanocomposites were investigated using mechanical and rheological tests.
2. Results and Discussion
The PEG-b-PLLA diblock copolymer and the Im-PLLA surfactant were prepared by the ring-opening polymerization of lactide initiated either from a PEG chain length of 2000 g·mol–1 or from 1-(11-hydroxy-undecyl)-3-methylimidazolium bromide (Im), using 1,8-diazabicyclo[5,4,0]undec-7-ene (DBU) as the metal-free catalyst, as shown in Figure 1. Synthesis conditions were reproduced from two referenced works, for PEG-b-PLLA27 and for Im-PLLA,28 and the DBU/alcohol (macro)initiator ratio of 0.25/1 was selected to carry out the reactions.
Figure 1.
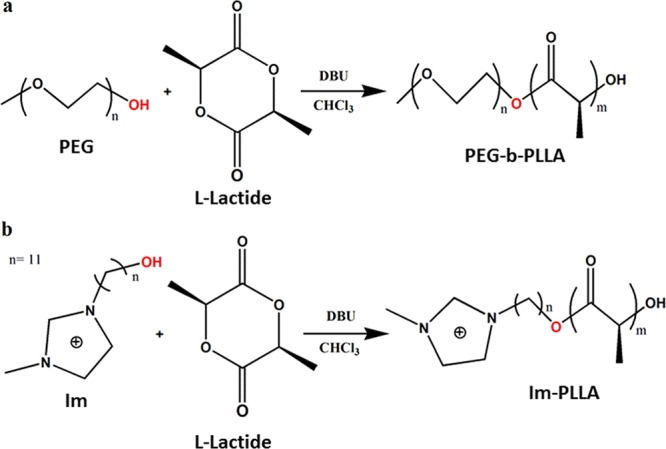
Synthesis of (a) PEG-b-PLLA and (b) Im-PLLA surfactants through ring-opening polymerization.
The molecular characterizations were determined using size exclusion chromatography (SEC) and proton nuclear magnetic resonance (1H NMR) (Figure S1) techniques, and the relative data are reported in Table 1. A good control of both theoretical and experimental parameters in relation to the 1H NMR results is achieved except for Im-PLLA, where a high dispersity D̵ is noticed. However, the optimization of this reaction does not concern the aim of this work.
Table 1. Molecular Parameters for PEG-b-PLLA and Im-PLLA Surfactants.
| sample | Mn(th) (g/mol) | Mn(PS) (g/mol)a | Mn(exp) (g/mol)b | D̵a |
|---|---|---|---|---|
| PEG-b-PLLA | 6000 | 10 000 | 5600 | 1.8 |
| Im-PLLA | 4000 | 1300 | 2700 | 3.7 |
Determined using SEC in CHCl3.
Determined using 1H NMR.
One of the most critical steps in the preparation of nanocomposites by extrusion is to obtain an adequate dispersion of the nanoparticles within the matrix and to limit the thermal degradation. Herein, we used PLA as the matrix, and the masterbatch was prepared in the presence of the compatibilizing agent, that is, PEG-b-PLLA or Im-PLLA, and different CNC contents. The final composition and codification of the samples after melt processing can be found in Table 2.
Table 2. Final Composition of PLA-Based Nanocomposites after Extrusion/Injection-Molding.
| sample | CNC (%) | PEG-b-PLLA (%) | Im-PLLA (%) | PLLA (%) |
|---|---|---|---|---|
| PLA | 100 | |||
| PLA5CNC | 5 | 95 | ||
| PEG-b-PLLA | 100 | |||
| Im-PLLA | 100 | |||
| PLAIm-PLLA | 10 | 90 | ||
| PLAIm-PLLA+5CNC | 5 | 10 | 85 | |
| PLAIm-PLLA+10CNC | 10 | 10 | 80 | |
| PLAIm-PLLA+20CNC | 20 | 10 | 70 | |
| PLAPEG-b-PLLA | 10 | 90 | ||
| PLAPEG-b-PLLA+5CNC | 5 | 10 | 85 | |
| PLAPEG-b-PLLA+10CNC | 10 | 10 | 80 | |
| PLAPEG-b-PLLA+20CNC | 20 | 10 | 70 |
The visual appearance of the ensuing injection-molded disks can be found in Figure 2a. It can be observed that in the presence of compatibilizing agents, the obtained materials do not show any visible sign of strong aggregation or thermal and physical sample degradation, despite high-temperature processing conditions and extrusion/injection-molding cycles. These phenomena usually result in the presence of visible dots or color alteration of the sample.
Figure 2.

Disks prepared by injection-molding of extruded samples of (a) PLA and the surfactant (the value on the right side of the disk is related to the CNC content) and (b) PLA and 5 wt % uncompatibilized CNCs.
This scenario was observed for the reference sample, as shown in Figure 2b. This sample was prepared without a compatibilizer and contained only PLA and 5% CNCs, which were directly mixed and melt-processed. Compared with samples from Figure 2a, this sample is darker, a clear sign of CNC degradation, and less transparent, possibly because of CNC aggregation. This remarkable difference in the final visual aspect of the produced disks suggests that using the masterbatch approach combined with the compatibilizing agent can greatly improve the thermal resistance and quality of CNC dispersion within the matrix during extrusion.
A quantitative analysis of the transparency of the samples was obtained using ultraviolet–visible (UV–vis) spectroscopy. Figure 3 shows that the initial values of transmittance obtained for PLA, PLAIm-PLLA, and PLAPEG-b-PLLA are in the range founded by Müller et al. for PLA films.29 As reported by these authors, the presence of additives leads to a decrease in the light transmittance. Addition of PEG-b-PLLA to PLA increases the transmittance, whereas addition of Im-PLLA slightly reduces it. As shown in Figure 3, the addition of CNCs induces a global and systematic reduction in the disk transparency. This evolution is weak for PLAIm-PLLA-based systems but more marked for PLAPEG-b-PLLA. This reduction can be attributed to the increased crystallinity of the sample because nanoparticles can act as nucleating agents for the polymeric matrix and, at the same time, scatter the light in the material.
Figure 3.
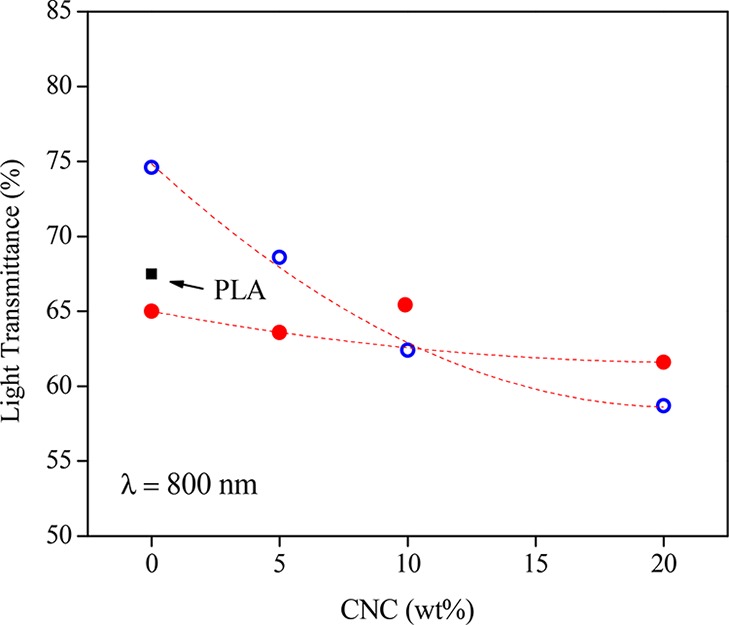
Light transmittance for PLA (■), PLAPEG-b-PLLA (○), and PLAIm-PLLA (●) as a function of CNC content at 800 nm.
The use of thermogravimetric analysis (TGA) experiments can also confirm the resistance of the pristine materials to thermal degradation. The curves in Figure 4 show the thermal stability of neat PLA and compatibilized nanocomposite films reinforced with 5 wt % CNCs.
Figure 4.

(a) TGA and (b) differential thermogravimetric (dTG) curves for pristine PLA (black) and compatibilized nanocomposites (using Im-PLLA or PEG-g-PLLA) reinforced with 5 wt % CNCs (PLAIm-PLLA+5CNC (blue) and PLAPEG-b-PLLA+5CNC (red)).
The thermal degradation of CNCs and CNC-reinforced nanocomposites is a delicate issue. The use of H2SO4 in the hydrolysis of cellulose causes the insertion of sulfate groups to the surface of the isolated nanoparticles. Several examples of early thermal degradation can be found in the literature, which can be attributed to the presence of these sulfate groups.30,31 In the present work, all samples display good thermal stability, with starting degradation temperatures above 200 °C. However, it is worth noting that TGA experiments were performed under nitrogen, and that nanocomposite processing was carried out under air. Nevertheless, it was shown that CNC-reinforced PLA had a similar thermal stability under air and inert nitrogen atmosphere, regardless of the surface functionalization of CNCs or their dispersion in the matrix.32 It makes these materials suitable for processing by extrusion, normally performed around 180 °C for the PLA matrix. The pristine PLA sample displays a single degradation step that occurs in the range of 300–350 °C, with a low residual mass. The profile observed in the curves suggests that different degradation mechanisms take place for composite samples.
The presence of CNCs and humidity in the nanocomposites results in multiple-stage degradation. The nanocomposite film compatibilized with PEG-b-PLLA shows a clear first degradation step at around 235 °C, which is probably related to the degradation of cellulose.31,33 The second degradation step is related to PLA chains and has its maximum at around 360 °C, suggesting a higher thermal stability compared with that of pristine PLA. The char residue is similar to neat PLA. For the nanocomposite film compatibilized with Im-PLLA, an initial mass loss ending at 145 °C is observed, which can be ascribed to the evaporation of moisture, suggesting a higher hydrophilic character. This sample does not show any sign of further separated degradation steps for CNCs, surfactants, and PLA, probably because the thermal degradation of Im-PLLA and CNCs are in the same range because of the early degradation of the surfactant compared with the pristine PLA.28 Moreover, it can suggest a good affinity and strong interaction between CNCs and the surfactant. A higher char residue is observed for the PLAIm-PLLA sample. All TGA data are shown in Table 3.
Table 3. Thermal Stability Data Obtained from Thermogravimetric Experiments.
| sample | degradation stages | 1st stage | 2nd stage | residual mass at 600 °C |
|---|---|---|---|---|
| PLA | 1 | 250–360 | 2.2 | |
| PLAIm-PLLA+5CNC | 2 | 180–380 | 5.8 | |
| PLAPEG-b-PLLA+5CNC | 2 | 230–270 | 280–440 | 2.3 |
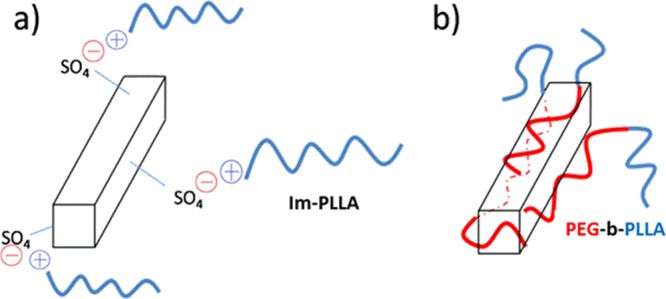
Because of the presence of two different compatibilizing agents and the ensuing different surface CNC properties, the interactions between the filler and the polymeric matrix should differ. The coating of CNCs with the PEG homopolymer to increase the compatibility between CNCs and hydrophobic polymers was already investigated, and successful improvement of the filler dispersion was reported.34 Here, the macromolecular surfactants contain an additional PLLA block that should provide a higher interaction with the polymer matrix. In that sense, each block can offer strong van der Waals interactions with each phase of the nanocomposite. In the case of Im-PLLA chains, besides the PLLA block and its interaction with the polymer matrix, the ionic liquid extremity possesses a positive charge that is able to interact with the negative charges borne by the CNC surface. A schematic representation of the different expected interactions is shown in Figure 5.
Figure 5.
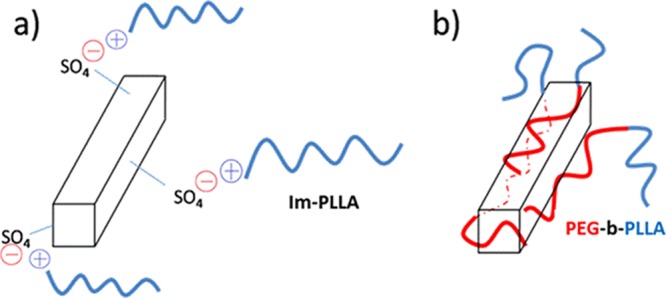
Schematic representation of the different interactions between CNCs and (a) Im-PLLA and (b) PEG-b-PLLA.
Figure 6 depicts the representative scanning electron microscopy (SEM) images of the cross-sectional areas of PLA (Figure 6a), PLAIm-PLLA (Figure 6c), PLAPEG-b-PLLA (Figure 6e), and nanocomposites reinforced with 5 wt % uncompatibilized CNCs (Figure 6b) and 10 wt % CNCs compatibilized with Im-PLLA (Figure 6d) or PEG-b-PLLA (Figure 6f). The surfaces of the cross-sections of the unfilled materials are quite uniform with the broken filamentous polymer (Figure 6a,c,e). When adding 5 wt % uncompatibilized CNCs (Figure 6b), well-distinguishable micrometric CNC aggregates can be observed. Additionally, there are visible voids in the PLA matrix proximal to the aggregates. For compatibilized nanocomposites, the surface is similar to that of unfilled materials, and no aggregates can be observed; these are strong lines of evidence of improved CNC dispersion and filler/matrix adhesion. Micrographs with different magnifications can be viewed in Figure S2.
Figure 6.

Typical SEM images of the tensile fracture cross-section of (a) PLA, (b) PLA5CNC, (c) PLAIm-PLLA, (d) PLAIm-PLLA+10CNC, (e) PLAPEG-b-PLLA, and (f) PLAPEG-b-PLLA+10CNC.
The impact of the different interaction mechanisms between the surfactant and the CNC surface on the mechanical properties of the final nanomaterials was therefore investigated by rheological measurements performed at 180 °C, that is, in the melt state of the polymeric matrix. The corresponding data can be found in Table 4. The addition of 10 wt % low viscosity surfactant (consequence of their lower molecular weight) obviously decreases the viscosity of the PLA matrix. At this temperature, both Im-PLLA and PEG-b-PLLA chains are melted and present a very low viscosity value. Therefore, the surfactant can act as a plasticizer for the system, decreasing the global viscosity and modulus values. However, most probably, the addition of the surfactant to PLA results in the aggregation of their polar parts (kind of micelles).
Table 4. Rheological Data Obtained from Small Amplitude Oscillatory Shear (SAOS) Experiments: Complex Viscosity (η*), Storage Shear Modulus (G′), Loss Shear Modulus (G″), Peclet Number (Pe), and Tangent of the Loss Angle (tan δ).
| sample | η*a (Pa·s) | G′b (Pa) | G″b (Pa) | Pea | tan δb |
|---|---|---|---|---|---|
| PLA | 221 | 1.7 | 214 | 131 | |
| PEG-b-PLLA | <0.01 | ||||
| Im-PLLA | <0.01 | ||||
| PLAIm-PLLA | 108 | 0.43 | 108 | 181 | |
| PLAPEG-b-PLLA | 139 | 0.60 | 133 | 147 | |
| PLAIm-PLLA+5CNC | 9.1 | 1.3 | 7.9 | 0.48 | 6.46 |
| PLAPEG-b-PLLA+5CNC | 55.1 | 4.7 | 48.7 | 2.9 | 10.4 |
| PLAIm-PLLA+10CNC | 610 | 71.2 | 48.1 | 32 | 0.66 |
| PLAPEG-b-PLLA+10CNC | 77.9 | 5.3 | 74.3 | 4.1 | 14.4 |
| PLAIm-PLLA+20CNC | 710 | 89.3 | 73.2 | 37 | 0.81 |
| PLAPEG-b-PLLA+20CNC | 95.0 | 12.2 | 78.6 | 5.0 | 6.46 |
Values estimated at 0.1 rad·s–1.
Values estimated at 1 rad·s–1.
For traditional systems, filler addition tends to increase the viscosity of the sample, according to the equation presented by Einstein.35 However, some nanocomposites seem to break up this rule. Understanding why nanoparticles can induce an increase or decrease of viscosity according to their dimensions and volume fraction was recently investigated.36 Here, the addition of 5 wt % CNCs causes first a viscosity drop (Table 4), followed by an increase for higher CNC contents (10 and 20 wt %). The same behavior was reported for samples prepared with Im-PLLA and PEG-b-PLLA surfactants. When adding 5 wt % CNCs, the polar parts of the surfactant molecules interact with the CNC surface but the relatively high amount of low-molecular-weight surfactant, more than necessary to coat the surface of the cellulosic nanoparticles, leaves dispersed molecules, instead of micelles, that could contribute more efficiently to the plasticization of PLA compared with unfilled PLAIm-PLLA and PLAPEG-b-PLLA.
For samples containing Im-PLLA (Figure 7a), it is observed that the addition of higher CNC contents clearly increases not only the viscosity but also the G′ value. The samples containing 10 and 20 wt % CNCs (open triangles and open diamonds, respectively) seem to reach a rheological percolation regime (i.e., the pulsation-dependence of G′ evolution is lower than ω0.5),37 whereas the sample with a lower nanoparticle content (open squares) displays a behavior similar to the neat PLAIm-PLLA sample (open circles) but with a lower viscosity and storage modulus.
Figure 7.
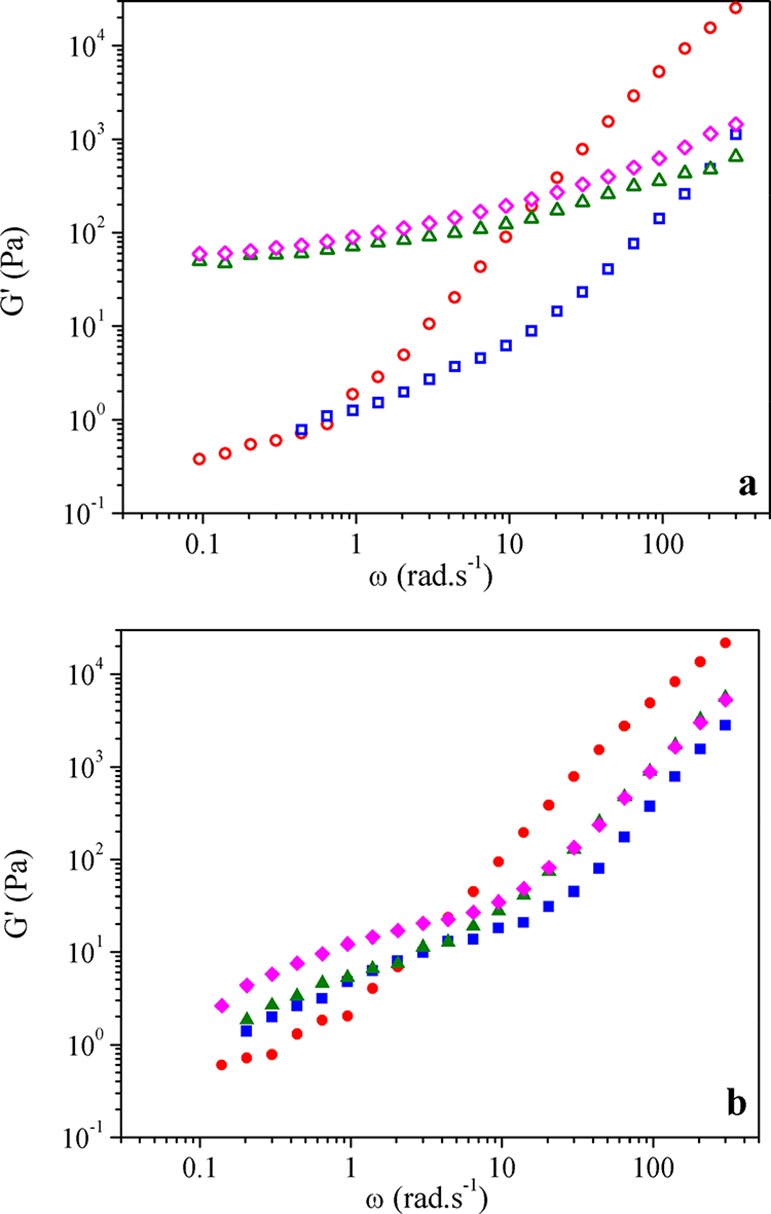
SAOS experiments for (a) PLAIm-PLLA and (b) PLAPEG-b-PLLA nanocomposites containing 0 (●, ○), 5 (■, □), 10 (▲, △), and 20 (◆, ◇) wt % CNCs.
It is worth noting that particle percolation was reached for a relatively high volume fraction of particles. Besides the influence of shear that causes particle alignment, extrusion is expected to possibly break them, leading to particle size reduction.19,38 Taking this into consideration, the percolation definition adopted here refers to a rheological percolation regime that is not equivalent to the percolation network obtained for CNC nanocomposites prepared by casting/evaporation methods.
On the other hand, the system containing the PEG-b-PLLA copolymer presents a completely different behavior (Figure 7b). The viscosity value of the nanocomposites is systematically lower than that for neat PLAPEG-b-PLLA (filled circles) regardless of the CNC content. For this system, the addition of CNCs also causes an increase in the storage modulus value for all samples in the low-frequency range, but its magnitude is considerably lower than that for PLAIm-PLLA highly loaded materials. Similar conclusions can be obtained by observing the comparative relaxation spectra of the samples (Figure S3).
We believe that this unexpected discrepancy between the storage modulus values for both systems based on the same polymer matrix and volume fraction of nanofillers can be explained by the presence of different adsorption mechanisms on the CNC surface. According to Baeza et al.,39 storage modulus (G′) curves with a logarithmic shape (or weak power law) can be explained by the presence of polymer segments adsorbed on the nanoparticle surface. These adsorption energies can present an exponential spectrum of desorption times necessary for these segments to move. The authors also argue that this weak slope of G′ × ω curve is characteristic of a particle network, independent of the molecular weight. It agrees well with the PLAIm-PLLA system and the expected effect of charge adsorption of the surfactant on the CNC surface. Moreover, the behavior is independent of the molecular weight, resulting in a similar shape and G′ values for PLAIm-PLLA+10CNC and PLAIm-PLLA+20CNC in the lower frequency ranges, despite some discrepancy for higher frequencies. The absence of charge for the PEG-b-PLLA copolymer confers the system rheological profile with a classic curve shape because the copolymer chains are not “frozen” due to strong interactions with the filler.
The higher frequency region of the G′ × ω curves (i.e., 100–300 rad·s–1) reflects the relaxation times of the polymeric chains present in the sample, usually related to their length. It can be observed that samples containing CNCs, PEG-b-PLLA, and Im-PLLA display lower values of G′ in this frequency range compared with the pristine PLA sample. It can indicate a reduction in the molecular weight for the nanocomposite samples induced by extrusion/injection-molding processing, which can corroborate with the initial viscosity drop after the addition of the surfactants, as shown in Table 5. Najafi et al.40 suggest that the presence of OH groups on the surface of the nanoparticles can bring new interactions with the carboxylic groups present in some polymers, causing thermal degradation.
Table 5. DSC Data Derived from Cooling and Second Heating DSC Curves: Glass Transition Temperature (Tg), Cold Crystallization Temperature (Tc) and Associated Heat of Crystallization (ΔHc), Melting Point (Tm) and Associated Heat of Fusion (ΔHm), and Degree of Crystallinity (χ).
| sample | Tg (°C) | Tc (°C) | ΔHc (J·g–1) | Tm (°C) | ΔHm (J·g–1) | χ (%)a |
|---|---|---|---|---|---|---|
| PLA | 61.5 | 111.9 | 32.8 | 171.9 | 32.7 | 35.2 |
| PLAIm-PLLA | 56.4 | 93.1 | 17.4 | 169.0 | 40.8 | 48.7 |
| PLAPEG-b-PLLA | 58.6 | 97.4 | 27.2 | 170.3 | 41.9 | 50.1 |
| PLAIm-PLLA+5CNC | 56.3 | 94.9 | 16.3 | 167.9 | 43.5 | 55.0 |
| PLAPEG-b-PLLA+5CNC | 59.9 | 99.2 | 27.7 | 170.3 | 42.6 | 53.9 |
| PLAIm-PLLA+10CNC | 58.9 | 98.8 | 22.5 | 168.3 | 39.9 | 53.6 |
| PLAPEG-b-PLLA+10CNC | 60.5 | 89.9 | 15.4 | 169.2 | 44.6 | 59.9 |
| PLAIm-PLLA+20CNC | 56.0 | 91.5 | 17.4 | 167.7 | 52.4 | 80.5 |
| PLAPEG-b-PLLA+20CNC | 56.7 | 92.2 | 28.5 | 168.6 | 61.5 | 94.5 |
Degree of crystallinity of PLA, χ = ΔHm/[(1 – ø) × ΔH°] × 100, where ø is the mass fraction of elements other than PLA (e.g., CNCs and the surfactant) and ΔH° is the melting enthalpy for a 100% crystalline PLA (93 J·g–1).45
Because of expected weaker adhesion between the filler and the matrix, this plasticization effect seems to be much more significant for the PLAPEG-b-PLLA samples. Figure 8 shows the pulsation-dependence of G′ (filled symbols) and G″ (open symbols) for neat PLA (triangles) and highly filled PLAIm-PLLA+20CNC (squares) and PLAPEG-b-PLLA+20CNC (circles) samples. It is observed that PLA and PLAPEG-b-PLLA+20CNC samples present a liquidlike behavior, with G″ > G′ over the whole studied frequency range. Contrarily, the PLAIm-PLLA+20CNC sample displays a liquid–solid transition around 2 rad·s–1. A liquid behavior is normally expected for a neat polymer matrix, but it is quite surprising for highly filled nanocomposites. It suggests that PEG-b-PLLA causes a plasticization of the system. On the contrary, Im-PLLA is probably more strongly attached to the CNC surface, and these surfactant chains are not completely free to slip along the polymer matrix chains. This is well-illustrated by the G′ values determined at 1 rad·s–1. The storage modulus value for pristine PLA was found to be 1.1 Pa, much lower than the values found for samples containing CNCs. From Figure 8, we can see that PLAPEG-b-PLLA and PLAIm-PLLA reinforced with 20 wt % CNCs exhibit values (at 1 rad·s–1) of 9.5 and 80 Pa, respectively.
Figure 8.
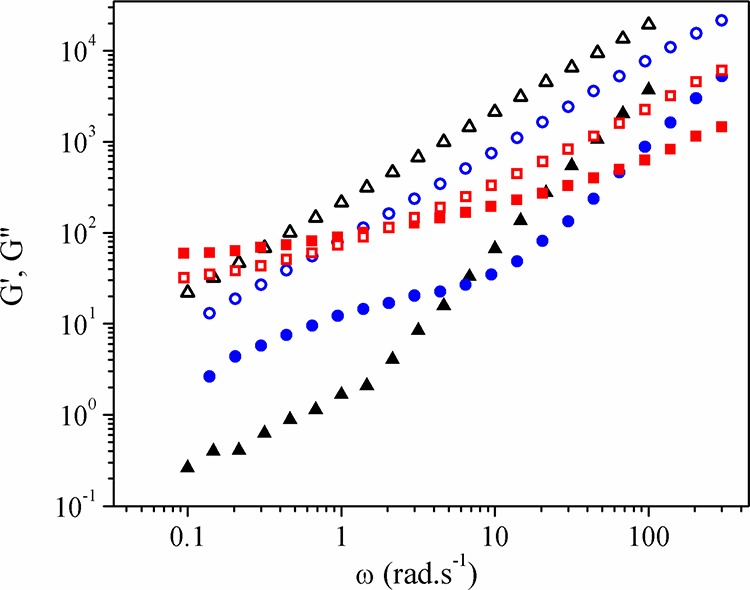
SAOS curves showing the pulsation dependence of the storage modulus (G′, filled symbols) and loss modulus (G″, open symbols) for PLA (▲, △), PLAIm-PLLA+20CNC (■, □), and PLAPEG-b-PLLA+20CNC (●, ○).
A more quantitative determination of the polymer viscoelastic behavior can be accessed by the evaluation of the tangent of the loss angle value (tan δ = G″/G′) or damping. Considering tan δ values, the sample behaves as a viscoelastic liquid when it presents values higher than one and as a viscoelastic solid when it presents values lower than one. Figure 9 shows the tan δ(ω) curves for all of the studied samples. Clearly, three groups of samples can be observed. The unfilled polymer systems (PLA, PLAIm-PLLA, and PLAPEG-b-PLLA indicated by crosses, open circles, and filled circles, respectively) display the highest tan δ values and therefore the most prominent liquid behavior. Addition of 5 wt % CNCs compatibilized with Im-PLLA (open squares) induces a reduction in the tan δ value but still characteristic of a dominant liquid behavior. The same behavior was reported for CNCs compatibilized with PEG-b-PLLA regardless of the CNC content (filled symbols). The samples containing Im-PLLA and higher CNC contents (with a possible percolating CNC network) (open triangles and open diamonds) present tan δ values lower than one (i.e., viscoelastic solid behavior), which corroborates the previous results. The transition from tan δ > 1 to tan δ < 1 for these samples occurs at around 2–3 rad·s–1, the transition point. Other works in the literature also found such different behaviors for samples with the same composition. Unlike these previous works, we did not vary the processing conditions41 or the nature of the PLA matrix,42 modifying just the nature of the compatibilizing agent. The tan δ values estimated at 1 rad·s–1 are collected in Table 4.
Figure 9.
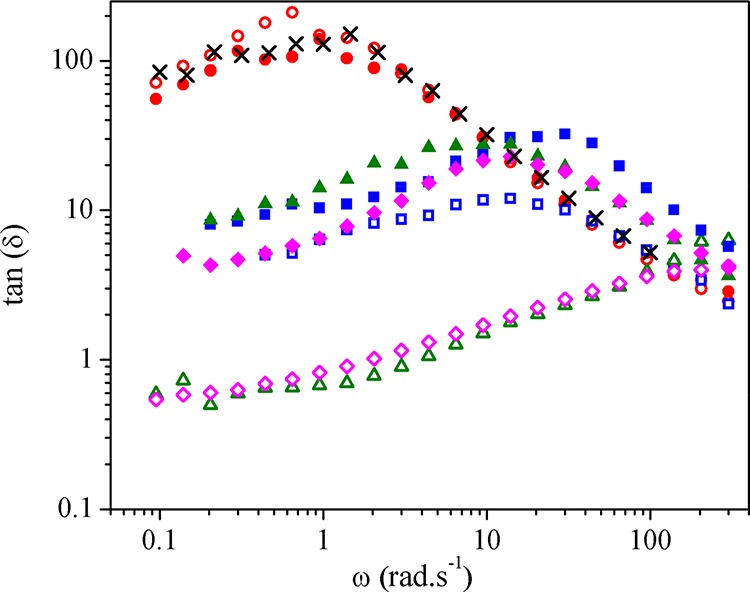
tan δ curves for PLA (×), PLAIm-PLLA (○), PLAPEG-b-PLLA (●), and nanocomposites reinforced with 5 (□, ■), 10 (△, ▲), and 20 wt % CNCs (◇, ◆). Open symbols correspond to Im-PLLA systems, and filled symbols correspond to PEG-b-PLLA systems.
Rheological measurements strongly depend on the quality of the filler dispersion because of the effects of hydrodynamic forces, Brownian motion, and colloidal stresses. The presence of the particles modifies the hydrodynamic forces by disturbing the liquid flow medium, increasing its resistance to flow. Brownian forces result from random movements of the particles within the liquid, causing their diffusion and disrupting the possible particle organization caused by external forces. In concentrated systems, colloidal forces take place because of the decrease in the particle–particle distance, leading them to interact. These three forces individually contribute to the rheological response of the system. It makes parameters such as particle aspect ratio, volume fraction, viscosity, and shear rate to contribute to the obtained results.
The relationship between the hydrodynamic (represented by Reynolds number) and Brownian forces (Schmidt number) for a system containing cylindrical particles is given by the Peclet number (Pe) defined by eq 1.
| 1 |
where kB is the Boltzmann constant, γ̇ is the shear rate, L is the cylinder length, d is the cylinder diameter, η is the viscosity, and T is the temperature (K). A previous study discussed the influence of the particles and the matrix viscosity for nanocomposites based on long carbon nanotubes that lead to huge Pe numbers because of very small Reynolds number and limited contribution of nanotubes to the Brownian motion.38
Kamal and Khoshkava43 used this relationship to define a PLA/CNC system in terms of the dispersion state; they state that for an ideally dispersed system, the Pe number should be 52. Pe values were calculated at an arbitrary shear rate of 0.1 s–1 and are reported in Table 4. CNCs used in our study have different dimensions and aspect ratios around 28 (CNCs with L/d equal to 11 were used in ref (43)), and the calculated Pe values are lower but suggest a better dispersion of the nanoparticles in the presence of Im-PLLA compared with PEG-b-PLLA. However, it is worth noting that the systems described above were limited to two-component systems. Here, the presence of copolymers certainly influences the properties of the system and (eq 1) could present deviations. Hence, applying this equation can be useful for simple comparisons, but it is necessary to keep its limitations in mind.
Thermal properties of injected nanocomposite disks were also investigated using differential scanning calorimetry (DSC). Despite injection-molding processing, Table 5 shows that the glass transition temperature (Tg) and the melting temperature (Tm) values found for the pristine PLA sample are very similar to those reported.44 Because these properties are related to the molecular weight of the polymer, it suggests that severe thermal degradation does not take place during processing of the pristine material. The simple addition of PEG-b-PLLA or Im-PLLA to the matrix reduces the Tg value up to 5 °C, which can be attributed to the plasticization effect and global reduction of the average molecular weight of the sample or a more severe shortening of PLA chains during processing. This result agrees with the rheological measurements. The addition of the surfactant to the PLA matrix also induces a significant decrease in the cold crystallization temperature of PLA (Table 5), but the degree of crystallinity determined during the second heating cycle is increased. However, it is worth noting that the determination of the degree of crystallinity excluded the surfactant, even if it is expected to participate in crystallization. Brüster et al.45 reported an increase in the cold crystallization temperature induced by the degradation of PLA chains and the ensuing chain scission. Tm values are slightly shifted to lower temperatures when adding the surfactants. Commercial PLA can be found as l-lactide, d-lactide, or dl-lactide isomeric form. The first two forms are considered as semicrystalline polymers, unlike the last one that is considered as amorphous.42 Here, we used the l-lactide form. It can explain the initial crystallinity of the PLA sample, with a melting enthalpy of 32.7 J·g–1, which corresponds to a degree of crystallinity of 35.2%.
The presence of CNCs does not seem to cause a pronounced effect on the thermal properties of the matrix (Table 5). However, for nanocomposite materials, a clear increase in the degree of crystallinity is reported because of the well-known nucleating role of CNCs, which was evidenced for different polymers including PLA.46−49 Nevertheless, as previously mentioned, the crystallinity of nanocomposites was calculated based only on the mass of pristine PLA in the system. Therefore, we made the assumption that PLLA blocks from the surfactants did not participate in crystallization, which can induce deviation of the obtained values. It is also observed that PEG-b-PLLA seems to be more efficient to increase the crystallinity of the matrix. This observation is in good agreement with the stronger evolution of the light transmittance of the film with the CNC content (Figure 3).
Figure 10 shows the DSC curves for all studied samples. During the experiments, it was not possible to observe the thermal transitions for pure PEG-b-PLLA and Im-PLLA samples. However, all samples containing these agents present a small exothermic peak around 155 °C. We believe that it can be attributed to a small crystallization of these short chains that is probably followed by its melting in the same temperature range as for PLA chains.
Figure 10.

DSC curves for (a) PLA, PLAPEG-b-PLLA, PLAIm-PLLA samples, and nanocomposites based on (b) PLAIm-PLLA or (c) PLAPEG-b-PLLA. Endothermic peak down.
Infrared spectroscopy analysis was also performed for some injection-molded samples. The results, presented in Figure S4, show that all samples present very similar characteristics despite the presence of PEG-b-PLLA or Im-PLLA. Similarly to the spectra obtained for the surfactants, the most intense peaks are related to the PLA structure. The peaks of C=O (1730 cm–1) and C–O (around 1080 cm–1) dominate the spectrum.
The similarity of Fourier transform infrared (FTIR) curves for PLA materials before and after melt processing was already described by Brüster et al.45 The authors proposed a degradation mechanism for PLA and plasticized PLA materials based on chain shortening that cannot be observed using this technique. Besides, the suggestion that PLA can be more resistant to thermal degradation than plasticized PLA cannot be observed using FTIR.
Besides rheological and modulus measurements at high temperatures, the samples were evaluated by stress/strain tests aiming to study the effect of the surfactant and CNC addition on the mechanical properties of the samples at room temperature (i.e., in the solid state). A remark should be made about the difficulty to handle the CNC-reinforced injection-molded samples. These samples were remarkably brittle and difficult to analyze because of the formation of cracks generated by the jaws of the equipment. Consequently, it was decided to focus the analysis on highly filled samples. The results are reported in Table 6.
Table 6. Results from Tensile Tests: Young’s Modulus (E), Elongation at Break (εB), and Strength (σB).
| sample | E (GPa) | εB (%) | σB (MPa) |
|---|---|---|---|
| PLA | 2.0 ± 0.2 | 3.5 ± 0.4 | 40.0 ± 7.1 |
| PLAPEG-b-PLLA | 1.7 ± 0.1 | 2.6 ± 0.6 | 33.2 ± 5.4 |
| PLAIm-PLLA | 1.9 ± 0.2 | 2.4 ± 0.5 | 31.7 ± 9.5 |
| PLAPEG-b-PLLA+20CNC | 2.2 ± 0.2 | 1.9 ± 0.3 | 33.0 ± 8.1 |
| PLAIm-PLLA+20CNC | 2.2 ± 0.5 | 1.6 ± 0.4 | 14.8 ± 4.1 |
PLA is usually described as a tough polymer that can show various mechanical properties depending on its commercial grade. Parameters such as Young’s modulus can be found varying between 0.9 and 4 GPa. Several studies investigated the effect of processing conditions and the addition of nanofillers to PLA, and in general reported just moderate modification in the modulus values. Pillin et al.50 showed limited impact of successive melt processing of PLA on its mechanical properties. They tend to remain stable after three or four cycles of injection, with a reduction of only 6% in the Young’s modulus value after seven recycling cycles, with some fluctuations in the values in the series. Our results show that the addition of both surfactants to the PLA matrix causes a decrease in the Young’s modulus and strength values. It can be attributed to the global reduction in the average molecular weight of the sample because the surfactants have low Mw values acting as plasticizers. The effect of PLA plasticization using PEG has been abundantly investigated, and a decrease in the modulus and strength with an increase in the elongation at break is generally reported.51 In our case, even the elongation at break decreases when adding the surfactants.
The addition of CNCs did not show any significant improvement in the mechanical properties, except a small increase in the modulus value, similar to that obtained by Camarero-Espinosa et al.52 The natural stiffness of PLA and the brittleness generated by the filler most probably mask any effect caused by the stronger interaction between Im-PLLA and CNC nanoparticles.
3. Conclusions
This work intended to prepare compatibilizing agents consisting of a diblock (PEG-b-PLLA) copolymer and an ionic liquid-PLA (Im-PLLA) polymer to improve the dispersion of CNCs in a hydrophobic matrix. The structural characterization of the compatibilizing agents showed that PEG-b-PLLA and Im-PLLA were successfully synthesized. Their use during melt extrusion and injection-molding of CNC-reinforced PLA nanocomposites clearly increased the dispersion of the nanoparticles within the matrix but different adsorption mechanisms on the CNC surface resulted in different rheological and mechanical properties. The positive charge of Im-PLLA seems to create ionic interactions between the ionic liquid block and CNCs. Besides good dispersion, it also leads to the formation of a rheological percolating network of particles for higher filler contents, providing higher values of storage modulus than that for PEG-b-PLLA-based samples. However, thermal and rheological experiments also suggest a global decrease in the average molecular weight of the matrix because of the presence of the surfactant and possible shortening of PLA chains during melt processing, resulting in a plasticization effect of the matrix. This phenomenon competes with the expected reinforcing effect of CNCs at room temperature. PLA is a rigid polymer whose properties are not strongly affected by the decrease in the molecular weight (e.g., Young’s modulus), but secondary effects such as crystallization can cause the sample to become more brittle and difficult to handle.
4. Experimental Section
4.1. Materials
Pure ramie fibers were obtained from Stucken Melchers GmbH & Co. (Germany). l-Lactide was supplied by Purac (The Netherlands) and recrystallized from dry toluene. Poly(ethylene glycol) monomethyl ether (PEGME) (Mn = 2000 g·mol–1, with a polydispersity index D̵ of 1.05) was provided by Fluka Chemika. DBU as a metal-free catalyst was purchased from Aldrich and distilled over barium oxide before use. Chloroform was dried using a MBRAUN Solvent Purification System (model MB-SPS 800) equipped with alumina drying columns. Heptane was purchased from VWR used as received. Acetic acid was purchased from ChemLab. 1-Methylimidazole (99%, Merck) and 11-bromoundecanol (Aldrich, 98%) were used as received. A commercially available extrusion-grade PLA (NatureWorks 4032D) designed especially for the production of biaxially oriented films was used as received (Mn = 133 500 ± 5000 g·mol–1, D̵ = 1.94 ± 0.06 as determined from SEC, and 1.4 ± 0.2% d-isomer content as determined by the supplier).
4.2. Preparation of CNCs
CNCs were isolated from ramie fibers according to the procedure described elsewhere.53 Purified ramie fibers were cut into small pieces and treated with 4% NaOH solution at 80 °C for 2 h. After washing until neutrality, the fibers were subjected to acid hydrolysis with sulfuric acid solution (65 wt %) at 55 °C for 30 min under strong mechanical stirring. The obtained suspension was filtered through a sintered glass funnel no. 1 and washed with water through a sequence of centrifugation cycles. The resultant suspension was then dialyzed against deionized water until neutrality and concentrated to 4 wt %. The obtained nanoparticles displayed the expected rodlike shape, with an average length around 200 nm and an average width of 7 nm, as characterized using atomic force microscopy (AFM).53 Their crystallinity index was determined by X-ray diffraction (XRD) experiments using the Segal method, and a value of 85% was obtained (Figure S5).
4.3. Preparation of PLLA-Based Surfactants
The preparation of both surfactants was done according to previous studies for Im-PLLA28,54 and for PEG-b-PLLA.27 Details are reported in the Supporting Information.
4.4. Masterbatch Preparation
To improve the dispersion of CNCs into the polymer matrix during extrusion, a masterbatch consisting of CNCs and the desired PLLA-based surfactant was prepared. First, the suspension of nanoparticles was exchanged from water to acetone and in sequence to dimethylformamide (DMF) through successive centrifugation cycles (10 000 rpm at 10 °C during 15 min). Then, the suspension of CNCs in the organic solvent was sonicated for 6 min and kept at 4 °C. The preparation of masterbatches was made by the addition of the surfactant into the CNC suspension. After polymer dissolution and homogenization by magnetic stirring, the suspension was homogenized through sonication for 10 min. The suspension was cast in a glass plate and dried under air circulation at 100 °C for 2 h.
4.5. Nanocomposite Processing
The dilution of the masterbatch in the PLA matrix was performed by extrusion. The desired mass of masterbatch was extruded with the PLA powder in a twin-screw DSM microcompounder at 170 °C and 150 rpm for 5 min. The material was collected and stored in a desiccator. In sequence, the extruded samples were injected in disk form (diameter 25 mm and thickness 1.5 mm) using a HAAKE MiniJet II equipment at 170 °C and a 200 bar pressure.
4.6. Characterization Techniques
XRD analyses were performed on a powder diffractometer (Siemens D 5000) using Cu Kα radiation at room temperature in the range of 2θ = 10–50° at a scanning rate of 2°·min–1. The crystallinity index value was calculated by the Segal method.
1H NMR analyses were performed using CDCl3 as the solvent, with tetramethylsilane (TMS) as an internal standard. The data were recorded at room temperature with a Bruker AMX-500 spectrometer operating at 500 MHz, equipped with a broadband observe (BBO) probe. The spectra were obtained over 32 scans.
SEC was performed in chloroform (flow rate of 1 mL·min–1 at 30 °C) with an Agilent 1200 series chromatograph equipped with a PL-DG802 degasser, an isocatric HPLC pump (flow rate = 1 mL·min–1), a marathon autosampler (loop volume = 100 μL and solution concn = 1 mg·mL–1), a refractive index detector, and three columns (a PL gel 5 μm guard and PL gel Mixed-D 5 μm columns).
Infrared spectra were recorded on an FTIR PerkinElmer Spectrum One spectrometer. Solid samples were analyzed using spectral width ranging from 600 to 4000 cm–1 with a 4 cm–1 resolution and an accumulation of 32 scans. All analyses were carried out in the attenuated total reflection (ATR) mode at room temperature. FTIR measurements were performed for the synthesized surfactants and injected films after rheological tests.
Quantitative information about light transmittance of the injected disks was obtained with an UV–vis Shimadzu UV 2401-PC spectrophotometer at a wavelength of 800 nm.
TGA experiments of the two surfactants, masterbatch and pristine PLA, were performed under N2 atmosphere with a heating rate of 10 °C·min–1 using a PerkinElmer TGA-6 equipment.
SEM was used to investigate the morphology of the nanocomposite films using a FEI (MED) Quanta 200 instrument. Tensile fracture samples were coated with gold and glued to the sample holder for cross-sectional observation.
DSC analyses were carried out with a TA DSC Q100 equipment, where the sample (weight of 10 ± 2 mg) was sealed in an aluminum pan and analyzed as follows. During the first cycle, a heating rate of 40 °C·min–1 from ambient temperature to 185 °C was applied, and it was followed by a 2 min isotherm to ensure material melting. A subsequent cooling step (20 °C·min–1) from melt to ambient temperature and second heating up to 185 °C with a heating rate of 10 °C·min–1 were applied. The DSC data were analyzed for the cooling and second heating scans.
The rheological behavior of the materials was characterized with an ARG2 equipment from TA Instruments. SAOS tests were performed with plate–plate (25 mm) geometry to study the polymer and the nanocomposites in oscillatory modes under air atmosphere in the range of 0.1–300 rad·s–1. The amplitude sweep tests show a strained linear region around 10% for all samples. Experimental data were obtained by using a 1% strain.
The tensile tests were performed using an Instron 4501 machine with a load cell of 5 kN capacity. The specimens were injection-molded under the same conditions described for disks, and ASTM D638-10 samples were obtained. All experiments were carried out at 25 °C with a cross-head speed of 10 mm·min–1.
Acknowledgments
The authors acknowledge the financial support of the Programme d’Actions Integres franco-belge Tournesol (grant 34226QH). LGP2 is part of the LabEx Tec 21 (Investissements d’Avenir—grant agreement no. ANR-11-LABX-0030) and of the PolyNat Carnot Institut (Investissements d’Avenir—grant agreement no. ANR-11-CARN-030-01). The research in Mons is supported by the Science Policy Office of the Belgian Federal Government (PAI 7/5) and the European Commission/Walloon Region (FEDER—BIORGEL RF—VALICELL project). J.-M.R. and F.P. are FRS-FNRS researchers.
Supporting Information Available
The Supporting Information is available free of charge on the ACS Publications website at DOI: 10.1021/acsomega.7b00387.
Preparation of PLA-based surfactants; 1H NMR spectra for PEG-b-PLLA and Im-PLLA surfactants; SEM images for nanocomposites; relaxation spectra for all samples; FTIR curves for PLA, PLAPEG-b-PLLA, and PLAIm-PLLA after rheological tests; and X-ray diffraction pattern for CNC extracted from ramie fibers (PDF)
Author Contributions
Marcos Mariano and Florence Pilate contributed equally to this work.
The authors declare no competing financial interest.
Supplementary Material
References
- Klemm D.; Kramer F.; Moritz S.; Lindström T.; Ankerfors M.; Gray D.; Dorris A. Nanocelluloses: A new family of nature-based materials. Angew. Chem., Int. Ed. 2011, 50, 5438–5466. 10.1002/anie.201001273. [DOI] [PubMed] [Google Scholar]
- Mariano M.; El Kissi N.; Dufresne A. Cellulose nanocrystals and related nanocomposites: Review of some properties and challenges. J. Polym. Sci., Part B: Polym. Phys. 2014, 52, 791–806. 10.1002/polb.23490. [DOI] [Google Scholar]
- Dufresne A.Nanocellulose: From Nature to High Performance Tailored Materials; Walter de Gruyter GmbH: Berlin, 2012; p 460. [Google Scholar]
- Roman M. Toxicity of cellulose nanocrystals: A review. Ind. Biotechnol. 2015, 11, 25–33. 10.1089/ind.2014.0024. [DOI] [Google Scholar]
- Miller J.Nanocellulose, State of the Industry. http://www.tappinano.org/media/1114/cellulose-nanomaterials-production-state-of-the-industry-dec-2015.pdf (consulted Jan 20, 2017).
- Lin N.; Huang J.; Dufresne A. Preparation, properties and applications of polysaccharide nanocrystals in advanced functional nanomaterials: A review. Nanoscale 2012, 4, 3274–3294. 10.1039/c2nr30260h. [DOI] [PubMed] [Google Scholar]
- Samir M. A. S. A.; Alloin F.; Dufresne A. Review of recent research into cellulosic whiskers, their properties and their application in nanocomposite field. Biomacromolecules 2005, 6, 612–626. 10.1021/bm0493685. [DOI] [PubMed] [Google Scholar]
- Eichhorn S. J.; Dufresne A.; Aranguren M.; Marcovich N. E.; Capadona J. R.; Rowan S. J.; Weder C.; Thielemans W.; Roman M.; Renneckar S.; Gindl W.; Veigel S.; Keckes J.; Yano H.; Abe K.; Nogi M.; Nakagaito A. N.; Mangalam A.; Simonsen J.; Benight A. S.; Bismarck A.; Berglund L. A.; Peijs T. Review: current international research into cellulose nanofibres and nanocomposites. J. Mater. Sci. 2010, 45, 1–33. 10.1007/s10853-009-3874-0. [DOI] [Google Scholar]
- Moon R. J.; Martini A.; Nairn J.; Simonsen J.; Youngblood J. Cellulose nanomaterials review: structure, properties and nanocomposites. Chem. Soc. Rev. 2011, 40, 3941–3994. 10.1039/c0cs00108b. [DOI] [PubMed] [Google Scholar]
- Favier V.; Canova G. R.; Cavaillé J. Y.; Chanzy H.; Dufresne A.; Gauthier C. Nanocomposite materials from latex and cellulose whiskers. Polym. Adv. Technol. 1995, 6, 351–355. 10.1002/pat.1995.220060514. [DOI] [Google Scholar]
- Annamalai P. K.; Dagnon K. L.; Monemian S.; Foster E. J.; Rowan S. J.; Weder C. Water-responsive mechanically adaptive nanocomposites based on styrene–butadiene rubber and cellulose nanocrystals—Processing matters. ACS Appl. Mater. Interfaces 2014, 6, 967–976. 10.1021/am404382x. [DOI] [PubMed] [Google Scholar]
- Capadona J. R.; Van Den Berg O.; Capadona L. A.; Schroeter M.; Rowan S. J.; Tyler D. J.; Weder C. A versatile approach for the processing of polymer nanocomposites with self-assembled nanofibre templates. Nat. Nanotechnol. 2007, 2, 765–769. 10.1038/nnano.2007.379. [DOI] [PubMed] [Google Scholar]
- Wang D.; Yu J.; Zhang J.; He J.; Zhang J. Transparent bionanocomposites with improved properties from poly(propylene carbonate) (PPC) and cellulose nanowhiskers (CNWs). Compos. Sci. Technol. 2013, 85, 83–89. 10.1016/j.compscitech.2013.06.004. [DOI] [Google Scholar]
- Neto W. P. F.; Mariano M.; da Silva I. S. V.; Silvério H. A.; Putaux J.-L.; Otaguro H.; Pasquini D.; Dufresne A. Mechanical properties of natural rubber nanocomposites reinforced with high aspect ratio cellulose nanocrystals isolated from soy hulls. Carbohydr. Polym. 2016, 153, 143–152. 10.1016/j.carbpol.2016.07.073. [DOI] [PubMed] [Google Scholar]
- Dhar P.; Tarafder D.; Kumar A.; Katiyar V. Effect of cellulose nanocrystal polymorphs on mechanical, barrier and thermal properties of poly(lactic acid) based bionanocomposites. RSC Adv. 2015, 5, 60426–60440. 10.1039/c5ra06840a. [DOI] [Google Scholar]
- de Menezes A. J.; Siqueira G.; Curvelo A. A. S.; Dufresne A. Extrusion and characterization of functionalized cellulose whiskers reinforced polyethylene nanocomposites. Polymer 2009, 50, 4552–4563. 10.1016/j.polymer.2009.07.038. [DOI] [Google Scholar]
- Sapkota J.; Kumar S.; Weder C.; Foster E. J. Influence of processing conditions on properties of poly(vinyl acetate)/cellulose nanocrystal nanocomposites. Macromol. Mater. Eng. 2015, 300, 562–571. 10.1002/mame.201400313. [DOI] [Google Scholar]
- Jiang L.; Morelius E.; Zhang J.; Wolcott M.; Holbery J. Study of the poly(3-hydroxybutyrate-co-3-hydroxyvalerate)/cellulose nanowhisker composites prepared by solution casting and melt processing. J. Compos. Mater. 2008, 42, 2629–2645. 10.1177/0021998308096327. [DOI] [Google Scholar]
- Alloin F.; D’Aprea A.; Dufresne A.; El Kissi N.; Bossard F. Poly(oxyethylene) and ramie whiskers based nanocomposites: influence of processing: extrusion and casting/evaporation. Cellulose 2011, 18, 957–973. 10.1007/s10570-011-9543-x. [DOI] [Google Scholar]
- Wang K.; Liang S.; Du R.; Zhang Q.; Fu Q. The interplay of thermodynamics and shear on the dispersion of polymer nanocomposite. Polymer 2004, 45, 7953–7960. 10.1016/j.polymer.2004.09.053. [DOI] [Google Scholar]
- Khoshkava V.; Kamal M. R. Effect of surface energy on dispersion and mechanical properties of polymer/nanocrystalline cellulose nanocomposites. Biomacromolecules 2013, 14, 3155–3163. 10.1021/bm400784j. [DOI] [PubMed] [Google Scholar]
- Raquez J.-M.; Murena Y.; Goffin A.-L.; Habibi Y.; Ruelle B.; DeBuyl F.; Dubois P. Surface-modification of cellulose nanowhiskers and their use as nanoreinforcers into polylactide: A sustainably-integrated approach. Compos. Sci. Technol. 2012, 72, 544–549. 10.1016/j.compscitech.2011.11.017. [DOI] [Google Scholar]
- Habibi Y. Key advances in the chemical modification of nanocelluloses. Chem. Soc. Rev. 2014, 43, 1519–1542. 10.1039/c3cs60204d. [DOI] [PubMed] [Google Scholar]
- Nicharat A.; Sapkota J.; Foster E. J. Pre-mixing and masterbatch approaches for reinforcing poly(vinyl acetate) with cellulose based fillers. Ind. Crops Prod. 2016, 93, 244–250. 10.1016/j.indcrop.2016.02.061. [DOI] [Google Scholar]
- Mariano M.; El Kissi N.; Dufresne A. Melt processing of cellulose nanocrystal reinforced polycarbonate from a masterbatch process. Eur. Polym. J. 2015, 69, 208–223. 10.1016/j.eurpolymj.2015.06.007. [DOI] [Google Scholar]
- Nagalakshmaiah M.; El Kissi N.; Dufresne A. Ionic compatibilization of cellulose nanocrystals with quaternary ammonium salt and their melt extrusion with polypropylene. ACS Appl. Mater. Interfaces 2016, 8, 8755–8764. 10.1021/acsami.6b01650. [DOI] [PubMed] [Google Scholar]
- Meyer F.; Raquez J.-M.; Verge P.; de Arenaza I. M.; Coto B.; Van Der Voort P.; Meaurio E.; Dervaux B.; Sarasua J.-R.; Du Prez F.; Dubois P. Poly(ethylene oxide)-b-poly(L-lactide) diblock copolymer/carbon nanotube-Based nanocomposites: LiCl as supramolecular structure-directing agent. Biomacromolecules 2011, 12, 4086–4094. 10.1021/bm201149g. [DOI] [PubMed] [Google Scholar]
- Dervaux B.; Meyer F.; Raquez J.-M.; Olivier A.; Du Prez F. E.; Dubois P. Imidazolium end-functionalized ATRP polymers as directing agents for CNT dispersion and confinement. Macromol. Chem. Phys. 2012, 213, 1259–1265. 10.1002/macp.201200103. [DOI] [Google Scholar]
- Müller P.; Imre B.; Bere J.; Móczó J.; Pukánszky B. Physical ageing and molecular mobility in PLA blends and composites. J. Therm. Anal. Calorim. 2015, 122, 1423–1433. 10.1007/s10973-015-4831-6. [DOI] [Google Scholar]
- Roman M.; Winter W. T. Effect of sulfate groups from sulfuric acid hydrolysis on the thermal degradation behavior of bacterial cellulose. Biomacromolecules 2004, 5, 1671–1677. 10.1021/bm034519+. [DOI] [PubMed] [Google Scholar]
- Wang N.; Ding E.; Cheng R. Thermal degradation behaviors of spherical cellulose nanocrystals with sulfate groups. Polymer 2007, 48, 3486–3493. 10.1016/j.polymer.2007.03.062. [DOI] [Google Scholar]
- Spinella S.; Re G. L.; Liu B.; Dorgan J.; Habibi Y.; Leclère P.; Raquez J.-M.; Dubois P.; Gross R. A. Polylactide/cellulose nanocrystal nanocomposites: efficient routes for nanofiber modification and effects of nanofiber chemistry on PLA reinforcement. Polymer 2015, 65, 9–17. 10.1016/j.polymer.2015.02.048. [DOI] [Google Scholar]
- Mariano M.; Cercená R.; Soldi V. Thermal characterization of cellulose nanocrystals isolated from sisal fibers using acid hydrolysis. Ind. Crops Prod. 2016, 94, 454–462. 10.1016/j.indcrop.2016.09.011. [DOI] [Google Scholar]
- Lin N.; Dufresne A. Physical and/or chemical compatibilization of extruded cellulose nanocrystal reinforced polystyrene nanocomposites. Macromolecules 2013, 46, 5570–5583. 10.1021/ma4010154. [DOI] [Google Scholar]
- Mardles E. W. J. Viscosity of suspensions and the Einstein equation. Nature 1940, 145, 970. 10.1038/145970a0. [DOI] [Google Scholar]
- Mangal R.; Srivastava S.; Archer L. A. Phase stability and dynamics of entangled polymer-nanoparticle composites. Nat. Commun. 2015, 6, 7198. 10.1038/ncomms8198. [DOI] [PMC free article] [PubMed] [Google Scholar]
- Hassanabadi H. M.; Wilhelm M.; Rodrigue D. A rheological criterion to determine the percolation threshold in polymer nano-composites. Rheol. Acta 2014, 53, 869–882. 10.1007/s00397-014-0804-0. [DOI] [Google Scholar]
- Kharchenko S. B.; Douglas J. F.; Obrzut J.; Grulke E. A.; Migler K. B. Flow-induced properties of nanotube-filled polymer materials. Nat. Mater. 2004, 3, 564–568. 10.1038/nmat1183. [DOI] [PubMed] [Google Scholar]
- Baeza G. P.; Dessi C.; Costanzo S.; Zhao D.; Gong S.; Alegria A.; Colby R. H.; Rubinstein M.; Vlassopoulos D.; Kumar S. K. Network dynamics in nanofilled polymers. Nat. Commun. 2016, 7, 11368. 10.1038/ncomms11368. [DOI] [PMC free article] [PubMed] [Google Scholar]
- Najafi N.; Heuzey M. C.; Carreau P. J.; Wood-Adams P. M. Control of thermal degradation of polylactide (PLA)-clay nanocomposites using chain extenders. Polym. Degrad. Stab. 2012, 97, 554–565. 10.1016/j.polymdegradstab.2012.01.016. [DOI] [Google Scholar]
- Pogodina N. V.; Cerclé C.; Avérous L.; Thomann R.; Bouquey M.; Muller R. Processing and characterization of biodegradable polymer nanocomposites: detection of dispersion state. Rheol. Acta 2008, 47, 543–553. 10.1007/s00397-007-0243-2. [DOI] [Google Scholar]
- Ahmed J.; Varshney S. K.; Janvier F. Rheological and thermal properties of stereocomplexed polylactide films. J. Therm. Anal. Calorim. 2013, 115, 2053–2061. 10.1007/s10973-013-3234-9. [DOI] [Google Scholar]
- Kamal M. R.; Khoshkava V. Effect of cellulose nanocrystals (CNC) on rheological and mechanical properties and crystallization behavior of PLA/CNC nanocomposites. Carbohydr. Polym. 2015, 123, 105–114. 10.1016/j.carbpol.2015.01.012. [DOI] [PubMed] [Google Scholar]
- Garlotta D. A Literature review of poly(lactic acid). J. Polym. Environ. 2001, 9, 63–84. 10.1023/A:1020200822435. [DOI] [Google Scholar]
- Brüster B.; Addiego F.; Hassouna F.; Ruch D.; Raquez J.-M.; Dubois P. Thermo-mechanical degradation of plasticized poly(lactide) after multiple reprocessing to simulate recycling: Multi-scale analysis and underlying mechanisms. Polym. Degrad. Stab. 2016, 131, 132–144. 10.1016/j.polymdegradstab.2016.07.017. [DOI] [Google Scholar]
- Pei A.; Zhou Q.; Berglund L. Functionalized cellulose nanocrystals as biobased nucleation agents in poly(l-lactide) (PLLA)—Crystallization and mechanical property effects. Compos. Sci. Technol. 2010, 70, 815–821. 10.1016/j.compscitech.2010.01.018. [DOI] [Google Scholar]
- Sanchez-Garcia M. D.; Lagaron J. M. On the use of plant cellulose nanowhiskers to enhance the barrier properties of polylactic acid. Cellulose 2010, 17, 987–1004. 10.1007/s10570-010-9430-x. [DOI] [Google Scholar]
- Goffin A.-L.; Raquez J.-M.; Duquesne E.; Siqueira G.; Habibi Y.; Dufresne A.; Dubois P. From interfacial ring-opening polymerization to melt processing of cellulose nanowhisker-filled polylactide-based nanocomposites. Biomacromolecules 2011, 12, 2456–2465. 10.1021/bm200581h. [DOI] [PubMed] [Google Scholar]
- Fortunati E.; Armentano I.; Zhou Q.; Iannoni A.; Saino E.; Visai L.; Berglund L. A.; Kenny J. M. Multifunctional bionanocomposite films of poly(lactic acid), cellulose nanocrystals and silver nanoparticles. Carbohydr. Polym. 2012, 87, 1596–1605. 10.1016/j.carbpol.2011.09.066. [DOI] [Google Scholar]
- Pillin I.; Montrelay N.; Bourmaud A.; Grohens Y. Effect of thermo-mechanical cycles on the physico-chemical properties of poly(lactic acid). Polym. Degrad. Stab. 2008, 93, 321–328. 10.1016/j.polymdegradstab.2007.12.005. [DOI] [Google Scholar]
- Mohapatra A. K.; Mohanty S.; Nayak S. K. Properties and characterization of biodegradable poly(lactic acid) (PLA)/poly(ethylene glycol) (PEG) and PLA/PEG/organoclay: A study of crystallization kinetics, rheology, and compostability. J. Thermoplast. Compos. Mater. 2016, 29, 443–463. 10.1177/0892705713518812. [DOI] [Google Scholar]
- Camarero-Espinosa S.; Boday D. J.; Weder C.; Foster E. J. Cellulose nanocrystal driven crystallization of poly(d,l-lactide) and improvement of the thermomechanical properties. J. Appl. Polym. Sci. 2015, 132, 41607. 10.1002/app.41607. [DOI] [Google Scholar]
- Khelifa F.; Habibi Y.; Benard F.; Dubois P. Effect of cellulosic nanowhiskers on the performances of epoxidized acrylic copolymers. J. Mater. Chem. 2012, 22, 20520. 10.1039/c2jm33917j. [DOI] [Google Scholar]
- Shaplov A. S.; Goujon L.; Vidal F.; Lozinskaya E. I.; Meyer F.; Malyshkina I. A.; Chevrot C.; Teyssié D.; Odinets I. L.; Vygodskii Y. S. Ionic IPNs as novel candidates for highly conductive solid polymer electrolytes. J. Polym. Sci., Part A: Polym. Chem. 2009, 47, 4245–4266. 10.1002/pola.23478. [DOI] [Google Scholar]
Associated Data
This section collects any data citations, data availability statements, or supplementary materials included in this article.