Abstract
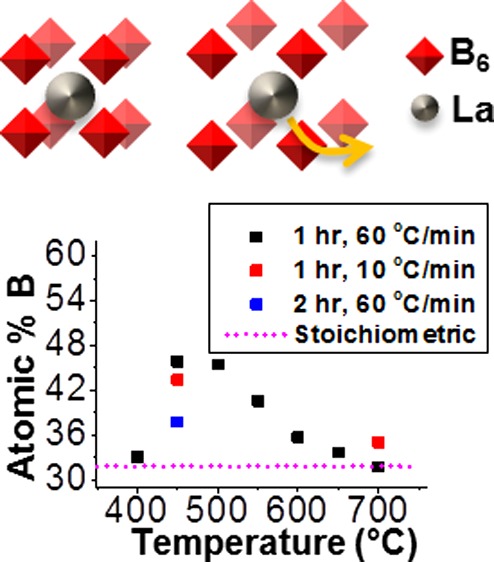
Lanthanum hexaboride (LaB6) is notable for its thermionic emission and mechanical strength and is being explored for its potential applications in IR-absorbing photovoltaic cells and thermally insulating window coatings. Previous studies have not investigated how the properties of LaB6 change on the nanoscale. Despite interest in the tunable plasmonic properties of nanocrystalline LaB6, studies have been limited due to challenges in the synthesis of phase-pure, size-controlled, high-purity nanocrystals without high temperatures or pressures. Here, we report, for the first time, the ability to control particle size and boron content through reaction temperature and heating ramp rate, which allows the effects of size and defects on the vibrational modes of the nanocrystals to be studied independently. Understanding these effects is important to develop methods to fully control the properties of nanocrystalline LaB6, such as IR absorbance. In contrast to previous studies on stoichiometric LaB6 nanocrystals, we report here that boron content and lanthanum vacancies have a greater influence on their vibrational properties than their particle size.
Introduction
Previous studies have shown that lanthanum hexaboride (LaB6) nanocrystals have tunable plasmonic properties that allow for strong absorption in the IR region.1 These particles are cheaper and easier to synthesize than gold nanorods or nanoshells, which exhibit similar behaviors.2,3 Recent work has also suggested that LaB6 nanocrystals may be solubilized with the incorporation of a ligand, which may make them more readily accessible to be used in films for various studies.3 These properties lend LaB6 nanocrystals to a variety of potential applications, such as thermally insulating window coatings,4−6 biomedical imaging,2 and heat sensing.7 As a bulk material, LaB6 is mechanically strong and is a common thermionic emitter used for cathodes in tools like transmission electron microscopes.8
The majority of previous studies have focused on bulk metal hexaborides, paying little attention to nanoscale behaviors. Many materials display novel properties in the nanoscale that they do not display in the bulk. For example, macroscopic platinum is one of the least reactive metals but platinum nanocrystals or nanocubes are known catalysts,7,9−11 speeding up oxidation in catalytic converters, nitric acid production, as well as other widespread industrial processes.12 Gold nanocrystals behave in a similar manner, becoming catalytic at the nanoscale and absorbing in different optical ranges compared to those of bulk gold in aqueous solution, with size-dependent colors ranging from red to purple.13−15
Because of past difficulties in synthesizing LaB6 nanocrystals, studies of this material on the nanoscale have been relatively scarce. Traditional methods require very high temperatures even to synthesize bulk samples, and the nature of this pulverization process unfortunately introduces unavoidable impurities. We have recently described the synthesis of LaB6 nanocrystals at 360 °C using lanthanum(III) chloride and sodium borohydride (NaBH4) and shown that the size of the nanocrystal changes the vibrational energies of the hexaboride cluster.3 Intriguingly, the size of the anion of the lanthanum salt (chlorine or iodine) reagent involved in this lower-temperature synthesis had an even larger impact on the vibrational energies than the nanocrystal size.16 Neither of these phenomena has been thoroughly quantified.
LaB6 nanocrystals have a highly symmetric structure, and yet numerous studies indicate that the vibrational energies are very complex, influenced by factors like size and crystalline defects and even by the anion of the reaction.17 No previous study has separated the influence of size and crystalline defects on the vibrational modes of the crystal structure. In this study, we have delineated the relationship of the nanocrystal structure with the particle size and defects in the crystal structure with Raman and IR spectroscopies. LaB6 nanocrystals were synthesized over a wide range of temperatures in a 1 in. tube furnace. We varied the nanocrystal size and crystal defects through reaction time and heating ramp rate. As a result, we were able to separate the influence of particle size and crystal defects on the vibrational modes of the system. Systemically, we show for the first time that boron content and lanthanum vacancies have a larger influence on the system than particle size and, furthermore, that significant evidence exists supporting that the boron cage structure behaves like a net, allowing for ion capture in some situations.
Results and Discussion
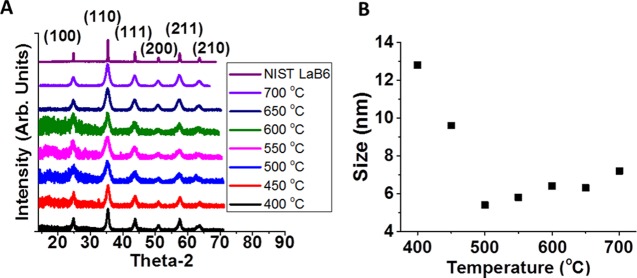
X-ray diffraction (XRD) analysis confirmed the successful synthesis of LaB6 when varying 1 h reaction temperatures from 400 to 700 °C using a 60 °C/min heating ramp rate (Figure 1A). Particle sizes were estimated from the diffraction patterns using the Scherrer equation via JADE,18 with sizes ranging from approximately 5 to 13 nm depending on the reaction temperature. In the reactions, there is a linear increase in particle size from 500 to 700 °C and a linear decrease in size from 400 to 500 °C (Figure 1B). The high heating ramp rate (60 °C/min) together with the relatively short reaction time at 400 and 450 °C accounts for the larger-than-expected particles. The fast heating resulted in uneven nucleation, causing larger particles to develop early in the reaction, which cannibalized the smaller particles that formed as the reaction progressed. This is a well-documented process known as Ostwald ripening.19,20
Figure 1.
(A) XRD patterns of the National Institute of Standards and Technology (NIST) LaB6 standard (“bulk” size) and LaB6 nanocrystals synthesized from 400 to 700 °C, with a heating ramp rate of 60 °C/min, and (B) calculated sizes of LaB6 nanocrystals synthesized at various temperatures.
We previously reported the synthesis of 2–5 nm LaB6 nanocrystals synthesized at 360 °C on a Schlenk line, with a much lower heating ramp rate of 10 °C/min.16 Given that this relatively low ramp rate produced much smaller nanocrystals than we obtained in the 60 °C/min tube furnace reactions, we performed the same 1 h LaB6 reaction at 450 °C using the lower heating ramp rate of 10 °C/min. This slower heating produced smaller nanocrystals, which fit within the linear relationship of reaction temperature to nanocrystal size (Figure 2). We also synthesized LaB6 at 700 °C and the 10 °C/min heating ramp rate and found very little change in particle size compared to that at the 60 °C/min reaction and this high temperature.
Figure 2.
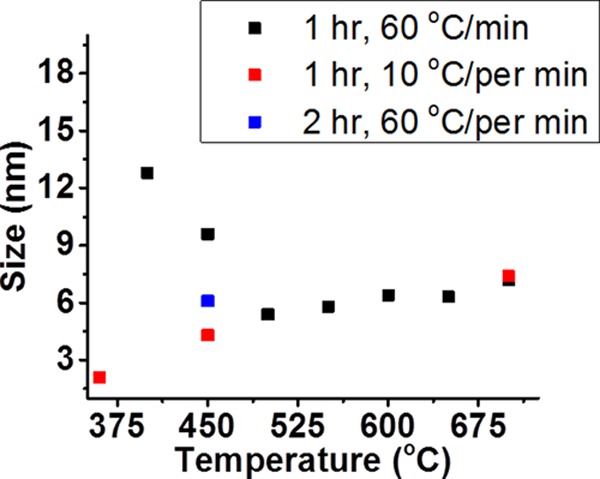
Sizes of LaB6 nanocrystals synthesized with varying reaction temperatures, heating ramp rates, and reaction times. Ramp rate refers to how quickly the tube furnace was heated from ambient temperature to the reaction temperature, whereas reaction time refers to the time between reaching the desired temperature and stopping the reaction. (The data point at 360 °C was previously reported for a Schlenk line synthesis and is included for comparison.4)
In our previous report, we found that it is possible to synthesize larger nanocrystals simply by increasing the reaction time from 1 to 2 h.16 We synthesized LaB6 in a tube furnace at 450 °C with a reaction time of 2 h and a heating ramp rate of 60 °C/min and found the opposite effect, where the 2 h reaction produced smaller particles (approximately 6 vs 9.5 nm; Figure 2). This supports our earlier conclusion that Ostwald ripening has a major influence on particle size when the reaction is quickly heated. At lower temperatures, the reaction is more sensitive to the ramp rate and can generate nanocrystals with unexpected sizes due to the unreacted precursor, which leads to unrestrained Ostwald ripening. Below 400 °C, the 60 °C/min heating ramp rate is too high and does not allow for a complete reaction within 1 h.
Elemental analysis was performed using energy-dispersive X-ray (EDX) spectroscopy, and the results are plotted in Figure 3. For the sake of consistency, all elemental analysis results in this study are reported as %B. The pink horizontal dotted line in the figure shows the atomic percentage of boron in stoichiometric LaB6, where the ratio of La to B is exactly 1:6. For nearly all reaction temperatures, there was a higher level of boron and a lower level of La than those of a stoichiometric sample, suggesting that any defect in the crystal structure is a result of lanthanum vacancies. This is consistent with previous studies that found 2–3% lanthanum vacancies in bulk LaB6 crystals prepared with stoichiometric precursor ratios.21,22 Additionally, shifts as small as 1% in the weight percentage of lanthanum in the bulk crystal were responsible for the color change from purple to blue. In this study, two sets of samples have the same size with different atomic percentages of boron (7.4 nm nanocrystals with a %B difference of 3.2% and 6.2 nm nanocrystals with a %B difference of 4.5%). Shifts in the %B of this magnitude are significant. Additionally, the same size of the two sets of nanocrystal samples eliminates the complication that decreasing nanocrystal size introduces. As nanocrystal size decreases, the surface-area-to-volume ratio increases. This increases the %B content of the nanocrystal without any additional lanthanum vacancies due to the B3 structures present on the surface.
Figure 3.
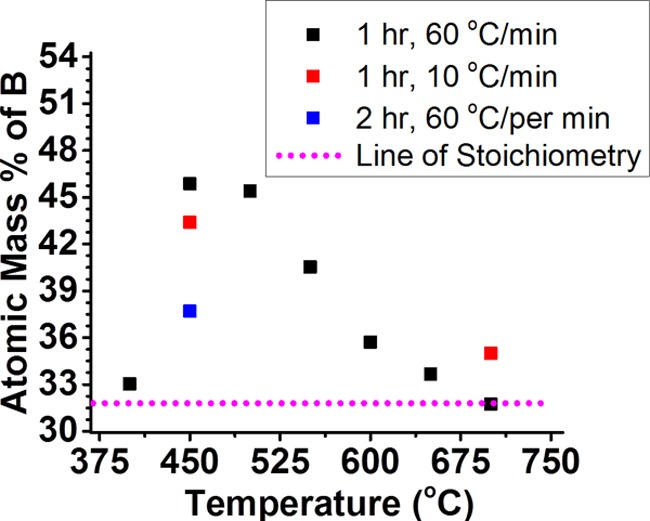
Atomic mass percentage of B vs reaction temperature, with a pink horizontal dotted line representing the atomic mass percentage of B in stoichiometric LaB6 (31.8% B).
Interestingly, the lanthanum vacancies do not have a linear relationship with the reaction temperature. For a typical 1 h reaction heated at a rate of 60 °C/min, the %B resembles a pulse shape, with a peak at 450 °C. Lanthanum vacancies of particles synthesized using the lower 10 °C/min heating rate decreased at 450 °C while increasing at 700 °C, an intriguing result. Generally, lower ramp rates have been shown to decrease defects in nanocrystals, such as silicon23,24 and zinc oxide.25 One explanation for the lower ramp rate increasing the lanthanum vacancies in LaB6 at 700 °C is that the cage structure of the boron lattice expands during heating and contracts during cooling, like a net, depending on the energy of the system, which allows the La3+ cations to either incorporate or escape. This expanding and contracting cage-like structure was suggested in our previous report, where thermogravimetric analysis and XRD results demonstrated the possibility of removing anions trapped within the LaB6 structure.16 At a lower temperature, the cage would be “tighter” compared to that at a higher temperature, with a wider cage allowing the release of lanthanum atoms and their reincorporation into the precursor salt, LaCl3. Physical boron structures displaying cage-like structure are not unprecedented but are recent. For instance, B40 was reported in 2014 and described as having a fullerene’s cage-like structure,26 suggesting that other large boron cage structures could exist as well. By conducting Raman and Fourier transform infrared (FTIR) spectroscopy analyses, we provide further evidence for this expanding and contracting cage structure interpretation, which will be discussed in detail below. As the boron atoms of the unit cell are pushed closer together or pulled further apart, their vibrational energies change and display new behaviors compared to those of the bulk material, which are reflected in their Raman and IR spectra.16
Both the %B and the nanocrystal size change significantly at 450 °C when the ramp rate is changed, which is likely due to the melting point (400 °C) of NaBH4. The reaction just starts at 400 °C, whereas 450 °C is a more stable temperature, where the particles have had more time to nucleate during the ramping process. With a ramp rate of 60 °C/min, a reaction run at 450 °C will have been at a temperature of 400 °C for slightly less than a minute (50 s exactly), whereas at 10 °C/min, the same 450 °C reaction would have been at or above 400 °C for 50 min.
XRD Characterization
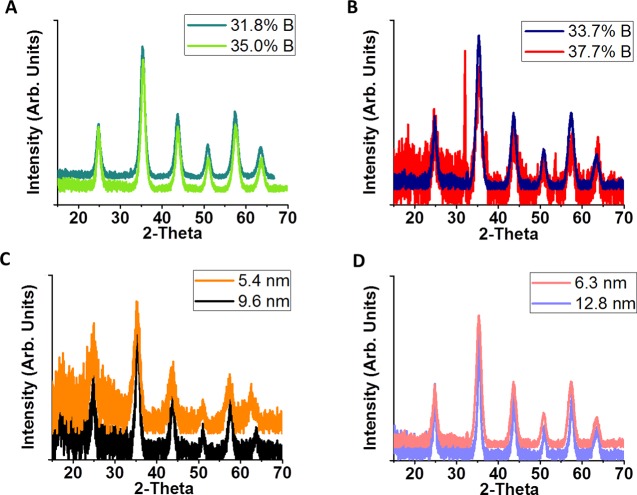
Our results show that lanthanum vacancies do not shift XRD patterns in any appreciable way. LaB6 nanocrystals with size of approximately 7.3 nm (synthesized at 700 °C, with a 60 or 10 °C/min ramp rate) and B content of 35.0 and 31.8% were compared, and no shift in diffraction data was noted (Figure 4A). LaB6 nanocrystals with size of approximately 6.2 nm (synthesized at 650 °C for 1 h, with a 60 °C/min ramp rate, and at 450 °C for 2 h, with a 60 °C/min ramp rate) and B content of 33.5 and 38% (Figure 4B) also showed no notable change in the diffraction peaks. There is occasionally an extraneous peak present at 32°, which is visible in Figure 4B. This peak is due to the presence of residual sodium in the sample that was not successfully removed during the processing phase.
Figure 4.
XRD patterns of LaB6: (A) 7.4 nm particles with differing %B content, (B) 6.2 nm particles with differing %B content; (C) 46% B content with differing particle size, (D) 34% B content with differing particle size.
In contrast to this result, LaB6 nanocrystals with identical boron content but varying particle size have notable shifts in the diffraction data. In LaB6 nanocrystals with 46% B (synthesized for 1 h at 500 and 450 °C, with a 60 °C/min ramp rate) and sizes of 5.4 and 9.6 nm (Figure 4C) as well as nanocrystals with 34% B and 6.3 and 12.8 nm particle sizes, there is an obvious XRD shift. In both cases, where %B is constant, there is a consistent shift to lower 2-Theta values with decreasing particle size. This suggests that smaller particles have a more compressed crystal structure. This result also suggests that the defects in the system do not appreciably change the overall crystal structure lattice spacing.
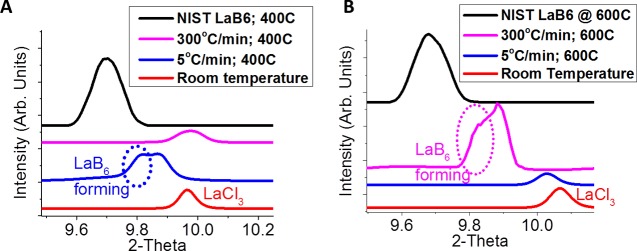
In situ measurements of the LaB6 reaction are currently ongoing at the Advanced Light Source. Although it is not possible to correlate in situ diffraction results with the actual boron content of the final product, the data highlight the importance of controlling the ramp rate and temperature when synthesizing LaB6. As seen in Figure 5A, a very high heating rate (300 °C/min) for a 400 °C reaction does not produce LaB6, but a much lower heating rate (5 °C/min) clearly allows the formation of crystalline LaB6 particles. These results complement the discussion above with regard to the melting point of NaBH4. When the reaction is run at 400 °C, the reactants need time to interact and a slow heating rate is required to allow particles to nucleate. Holding the reaction at 400 °C then allows the particles to grow larger. When the reaction is run up to 600 °C (Figure 5B), the small nucleated particles that form at a low ramp rate are not given enough time to grow at the needed lower temperature and crystalline LaB6 is not observed. Interestingly, a high ramp rate (300 °C/min) for the 600 °C reaction clearly results in LaB6 formation. It is possible that there is a different reaction mechanism at play, given this is beyond the decomposition temperature or NaBH4 or this may be because of how nucleation changes when the reaction happens so quickly. Full details of the in situ reaction results will be reported in our next study.
Figure 5.
(110) Diffraction peaks of LaB6 collected for in situ reactions run for 30 min at (A) 400 °C and (B) 600 °C with 5 and 300 °C/min ramp rates.
Raman Characterization
Although defects (lanthanum vacancies) in LaB6 do not significantly influence the diffraction patterns as much as particle size, defects within the lattice have a strong influence on the vibrational properties of the system that are observable through Raman spectroscopy. Common defects, such as particle vacancies or interstitial defects, shift all of the atoms in the crystal structure slightly, which can be observed by changes in the Raman vibrational modes. Figure 6 illustrates the Raman-active vibrations for LaB6. In LaB6, the vibration modes corresponding to the bending (T2g) and stretching (Eg and A1g) of the octahedron boron cluster are Raman active. The vibration of the lanthanide metal within the boron cage (the “rattling mode”) and the movement of lanthanum with respect to the boron cage (“acoustic” or T1u) are also Raman active.
Figure 6.
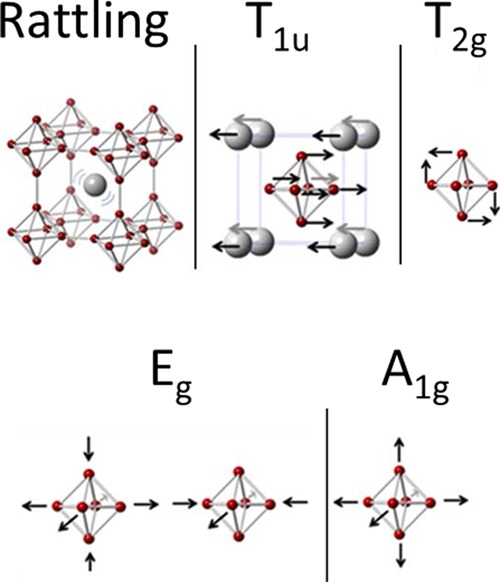
Raman-active vibrational modes of LaB6; “rattling” mode, T1u vibration (displaying one unit cell), bending vibration of T2g, and stretching vibrations of Eg and A1g.
We compared the Raman spectra of LaB6 nanocrystals of the same size but differing vacancies as well as nanocrystals of differing sizes and the same vacancy. In LaB6 nanocrystals with 34% B and a 6.5 nm difference in size (6.3–12.8 nm), there is an average blueshift of 4.7 cm–1 in the Raman spectra with increasing particle size, with the exception of the rattling mode, which does not shift (Figure 7A). In our previous study, we demonstrated that the rattling mode shifts when the nanocrystal size is less than 5.4 nm, most likely due to volumetric constriction as the cage space shrinks;16 therefore, it is not surprising that there is no shift in this mode, as both the nanocrystals are larger than 5.4 nm. Additionally, in that same study, we found that the majority of Raman shifts for all modes are present in nanocrystals between 5.4 and 2.5 nm in size, with an average peak shift of 19.4 cm–1, with little to no peak shift between the bulk crystal and 5.4 nm nanocrystals. However, it is important to note that this study did not control for lanthanum vacancies. Larger nanocrystals are generally more stable because, as the surface-area-to-volume ratio becomes smaller, the relative contribution of the high-surface-energy terms is minimized. In contrast, LaB6 nanocrystals with 46% B and a 4.2 nm difference in size (5.4–9.6 nm) show no change in the T1u and T2g modes of the Raman spectra, a redshift of the A1g stretching mode of 8.0 cm–1, and blueshifts of the rattling and Eg modes of 3.9 and 2.7 cm–1, respectively (Figure 7B). Although the LaB6 nanocrystals with 46% B may have more lanthanum vacancies, this differing result is likely due to complications involved with changing particle size. In smaller nanocrystals, surface effects influence Raman spectra more strongly than in larger particles. It has been reported that the (111) surface of LaB6 is terminated with B3 groups,16,27 so the excess of B on these smaller samples may be more a result of the increased B3-containing surface than that of vacancies within the system. Small changes in nanocrystal size cause the surface area to grow considerably because the surface area is proportional to the square of the nanocrystal radius. The 5.4 nm particles are more strongly influenced by the B3 groups on the surface than the 6.3 nm particles, explaining why the Raman shifts between the 6.3 and 12.8 nm particles are easily understood while they are more complex between the 5.4 and 9.6 nm particles.
Figure 7.
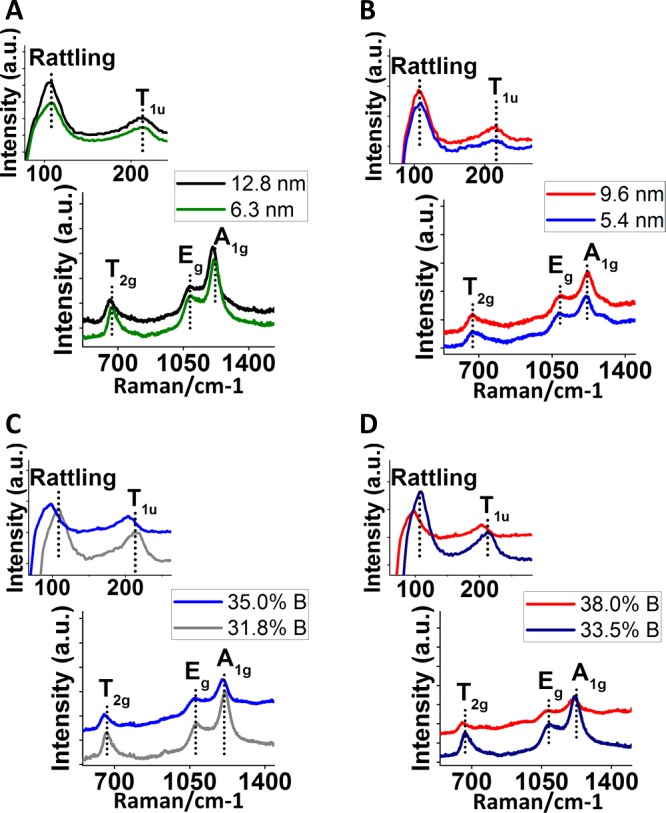
Raman spectra of samples with differing vacancy values and nanocrystal sizes, including T2g, Eg, A1g, and rattling and T1u (inset) vibrations for (A) 34% B content with differing particle size, (B) 46% B content with differing particle size, (C) 7.4 nm particles with differing %B content, and (D) 6.2 nm particles with differing %B content.
Finally, increasing the %B content by 3.2% (from 31.8 to 35%) in 7.3 nm particles results in a blueshift of all Raman-active peaks by about 10.9 cm–1 (Figure 7C). Increasing the B content by 4.5% (from 33.5 to 38%) in smaller (6.2 nm) particles gives the same result, where all Raman-active peaks blue-shift by about 9.9 cm–1 (Figure 7D). These samples show a clear pattern of increased %B content blue-shifting the Raman energies of all modes because they are of the same size, eliminating complications introduced by different surface areas. The missing lanthanum atoms in the nanocrystal boron cage structure lower the overall energy of the system.
FTIR Characterization
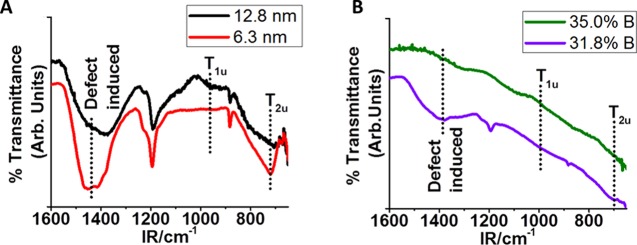
The FTIR spectra largely demonstrated the same trends as the Raman spectra; it is important to note that increasing the %B content demonstrated a straightforward pattern of blue-shifting the FTIR spectra and that nanocrystals larger than 5.4 nm are less affected by surface area B3 structures, demonstrating simple blueshifts. LaB6 samples with 34% B that increase in size by 6.5 nm (6.3–12.8 nm) show an average blueshift of 41.7 cm–1 (Figure 8A). Considering that this growth represents a fourfold increase in the surface area of the nanocrystal and thus a significantly shrinking surface-area-to-volume ratio, the surface effects of the B3 surface groups, which should decrease the overall energy of the system, do not appear to be especially substantial for this size range.
Figure 8.
FTIR spectra of samples with (A) 34% B with differing nanocrystal size and (B) 7.4 nm nanocrystals with differing %B.
Increasing lanthanum vacancies also tends to blue-shift the FTIR spectra. Increasing the boron content by 3.2% (31.8–35.0%) in 7.4 nm LaB6 particles shifts the T2g peak to lower energy, extending beyond the detection limit of the FTIR (Figure 7D). The average measureable IR peak shift in nanocrystals of varying boron content was 113 cm–1, which is significantly higher than the influence of size alone. The plasmonic properties are affected by the distribution and overall density of electric charge in the crystal system. It is possible that some boron atoms replace some of the lanthanum vacancies or even incorporate throughout the lattice, given boron’s small atomic radius, both of which would alter the plasmonic character of the nanocrystal without necessarily changing the particle size. The particle size is generally more straightforward to control; however, changing the composition and symmetry of the system would likely cause more dramatic shifts in the plasmon absorbance. Lanthanum vacancies lower the overall energy of the system, which is consistent with the Raman spectra. Additionally, as these particles are of the same size, there is no influence from surface effects, and the different boron content must be due to lanthanum vacancies. This lends more evidence to the interpretation that lanthanum atoms are escaping from the boron cage lattice at some point during synthesis and lowering the energy of the system.
Conclusions
Understanding how to tune the vibrational properties of LaB6 is crucial for the fine manipulation of optical properties. This study is the first, to our knowledge, on the independent influence of boron content and nanocrystal size on the vibrational properties of LaB6 nanocrystals. We have shown that the nanocrystal size of LaB6 has a strong dependence on the heating ramp rate at temperatures below 500 °C and that the particle size and the boron content can be controlled by changing the heating ramp rate (60 vs 10 °C/min) as well as the reaction time and temperature. XRD patterns show no visible change with changing boron content, whereas increasing nanocrystal size shifts XRD spectra to higher 2-Theta values, suggesting that the crystal structure is being stretched with increased size.
Studying the influence of particle size on vibrational energies was more complicated. In general, increasing the particle size blue-shifted the Raman and FTIR spectra. It is apparent that the boron-terminated surface of tiny nanocrystals, lanthanum vacancies, and excess interstitial boron affects the vibrational properties to different degrees. More vacancies lower the energy, whereas a higher surface-area-to-volume ratio increases the energy. The study of the exact behavior of the LaB6 nanocrystal surface is ongoing and will be reported in a future publication. In particles of the same size, both the Raman and FTIR spectra consistently shift to lower energy with increasing boron content. The excess boron must largely be due to lanthanum vacancies because the particle sizes are the same, which means that additional B3 surface structures could not be responsible for the boron content disparity. Even though lanthanum is not energetically favorable, it is still incorporated within the cage structure, suggesting that other atoms could potentially be trapped as well and explaining the results of previous studies that found that the anion (Cl– or I–) of the lanthanum salt precursor seemed to be incorporated into the cage structure.16 Improving our understanding of the boron cage structure of LaB6 could open the door to studying ion-trapping applications, better heat sensors and biomedical imaging particles, and possibly entirely new materials on the basis of forcibly doping the cage structure with novel elements.
Experimental Methods
Starting materials were stored in an argon glovebox and used as received. Anhydrous lanthanum chloride (LaCl3) of 99.9% purity was purchased from Strem Chemicals. Reagent-grade NaBH4 was purchased from EMD Millipore Corporation. Methanol, 0.5 M hydrochloric acid (HCl), and deionized (DI) water were used in air for processing the samples after synthesis. The samples were synthesized under a flow of argon over a range of temperatures in a Lindberg tube furnace with a 1 in. diameter quartz tube. Small ceramic furnace boats approximately 2 in. long and 1 cm wide held the sample within the furnace tube. LaB6 samples were analyzed by powder X-ray diffraction technique on a Bruker D8 Discover operated at 35 kV/40 mA using Co Kα radiation. A LaB6 NIST standard was used as a bulk sample. Data on Raman spectra were collected on a Horiba Jobin Yvon LabRAM ARAMIS automated scanning confocal Raman microscope at the excitation of 532 nm. Elemental analysis was performed by EDX spectroscopy on a Zeiss Gemini Ultra-55 scanning electron microscope, and FTIR spectroscopy was performed on a PerkinElmer Spectrum One equipped with HATR assembly.
Nanocrystalline LaB6 was synthesized via the following method: first, LaCl3 and NaBH4 powders (1:6 molar ratio) were ground together with a mortar and pestle in a glovebox under argon with a slight excess of NaBH4, to ensure there is enough boron present to make contact with the salt. Approximately 1 g of the mixed powder was placed in a ceramic furnace boat and transferred into a 1 in. Lindberg tube furnace, then heated at a given temperature (between 360 and 700 °C) under an argon flow rate of 0.4 slm using the desired heating ramp rate (60 or 10 °C/min), held at the reaction temperature for 1 or 2 h, and then cooled to room temperature. The samples were then treated with methanol until bubbling ceased, to remove excess NaBH4, and centrifuged at 10 000 rpm for 10 min. The obtained black solid was treated with 15 mL of 0.5 M HCl until bubbling ceased (typically overnight, but up to 4 days, depending on the reaction temperature), to convert any residual sodium metal to sodium chloride, and then centrifuged at 10 000 rpm for 10 min. Finally, the samples were washed with three 20 mL portions of DI water to remove sodium chloride.
Acknowledgments
This study was completed at The Molecular Foundry, Lawrence Berkeley National Laboratory, a user facility supported by the Office of Science, Office of Basic Energy Sciences, of the U.S. Department of Energy (DOE) under Contract No. DE-AC02-05CH11231. It was supported in part by the DOE Office of Science, Office of Workforce Development for Teachers and Scientists (WDTS), under the Science Undergraduate Laboratory Internship (SULI) program. The Advanced Light Source beamline 12.2.2 is supported by the the Director, Office of Science, Office of Basic Energy Sciences, of the U.S. Department of Energy under Contract No. DE-AC02-05CH11231.
Supporting Information Available
The Supporting Information is available free of charge on the ACS Publications website at DOI: 10.1021/acsomega.7b00263.
Additional reaction details; illustration of B3-terminated surface on LaB6; FTIR and Raman spectroscopies, SEM, and in situ XRD of LaB6 reaction progression (PDF)
The authors declare no competing financial interest.
Supplementary Material
References
- Schelm S.; Smith G. B.; Garrett P. D.; Fisher W. K. Tuning the surface-plasmon resonance in nanoparticles for glazing applications. J. Appl. Phys. 2005, 97, 124314 10.1063/1.1924873. [DOI] [Google Scholar]
- Chen C.; Chen D. Preparation of LaB6 nanoparticles as a novel and effective near-infrared photothermal conversion material. Chem. Eng. J. 2012, 180, 337–342. 10.1016/j.cej.2011.11.035. [DOI] [Google Scholar]
- Mattox T. M.; Agrawal A.; Milliron D. J. Low Temperature Synthesis and Surface Plasmon Resonance of Colloidal Lanthanum Hexaboride (LaB6) Nanocrystals. Chem. Mater. 2015, 27, 6620–6624. 10.1021/acs.chemmater.5b02297. [DOI] [Google Scholar]
- Llordés A.; Garcia G.; Gazquez J.; Milliron D. J. Tunable near-infrared and visible-light transmittance in nanocrystal-in-glass composites. 2013, 500, 323–326. Nature 2013, 500, 323–326. 10.1038/nature12398. [DOI] [PubMed] [Google Scholar]
- Machida K.; Adachi K. Particle shape inhomogeneity and plasmon-band broadening of solar-control LaB6 nanoparticles. J. Appl. Phys. 2015, 118, 013103 10.1063/1.4923049. [DOI] [Google Scholar]
- Takeda H.; Kuno H.; Adachi K. Solar Control Dispersions and Coatings with Rare-Earth Hexaboride Nanoparticles. J. Am. Ceram. Soc. 2008, 91, 2897–2902. 10.1111/j.1551-2916.2008.02512.x. [DOI] [Google Scholar]
- Jiang F.; Leong Y.; Saunders M.; Martyniuk M.; Faraone L.; Keating A.; Dell J. Uniform Dispersion of Lanthanum Hexaboride Nanoparticles in a Silica Thin Film: Synthesis and Optical Properties. ACS Appl. Mater. Interfaces 2012, 4, 5833–5838. 10.1021/am301481j. [DOI] [PubMed] [Google Scholar]
- Lafferty J. M. Boride Cathodes. J. Appl. Phys. 1951, 22, 299–309. 10.1063/1.1699946. [DOI] [Google Scholar]
- Zhang C.; Hwang S. Y.; Peng Z. Size-dependent oxygen reduction property of octahedral Pt-Ni nanoparticle electrocatalysts. J. Mater. Chem. A. 2014, 2, 19778. 10.1039/C4TA04728A. [DOI] [Google Scholar]
- Duaon T.; Choi J.; Le A.; Yoon S. Morphology Control of Pt Counter Electrodes Using a Pt Precursor Solution with H2PtCl6 • xH2O for Highly Efficient Dye-Sensitized Solar Cells. J. Electrochem. Soc. 2014, 4, H166–H171. 10.1149/2.020404jes. [DOI] [Google Scholar]
- Peng Z.; Kisielowski C.; Bell A. Surfactant-free preparation of supported platinum nanoparticles. Chem. Commun. 2012, 48, 1854–1856. 10.1039/c2cc16962b. [DOI] [PubMed] [Google Scholar]
- Yu T.; Kim D. Y.; Zhang H.; Xia Y. Platinum Concave Nanocubes with High-Index Facets and Their Enhanced Activity for Oxygen Reduction Reaction. Angew. Chem., Int. Ed. 2011, 50, 2773–2777. 10.1002/anie.201007859. [DOI] [PubMed] [Google Scholar]
- Campbell C. T.; Sharp J.; Yao Y. X.; Karp E.; Silbaugh T. Insights into catalysis by gold nanoparticles and their support effects through surface science studies of model catalysts. Faraday Discuss. 2011, 152, 227–239. 10.1039/c1fd00033k. [DOI] [PubMed] [Google Scholar]
- Quinten M.; Kreibig U. Optical Properties of Aggregates of Small Metal Particles. Surf. Sci. 1986, 172, 557–577. 10.1016/0039-6028(86)90501-7. [DOI] [Google Scholar]
- Warner M. G.; Reed S. M.; Hutchison J. E. Small, Water-Soluble, Ligand-Stabilized Gold Nanoparticles Synthesized by Interfacial Ligand Exchange Reactions. Chem. Mater. 2000, 12, 3316–3320. 10.1021/cm0003875. [DOI] [Google Scholar]
- Mattox T. M.; Chockkalingam S.; Roh I.; Urban J. J. Evolution of Vibrational Properties in Lanthanum Hexaboride Nanocrystals. J. Phys. Chem. C 2016, 120, 5188–5195. 10.1021/acs.jpcc.5b12680. [DOI] [Google Scholar]
- Ishii M.; Aono M.; Muanaka S.; Kawai S. Raman spectra of metallic and semiconducting metal hexaborides (MB6). Solid State Commun. 1976, 20, 437–440. 10.1016/0038-1098(76)90544-5. [DOI] [Google Scholar]
- Jade version 9.6, Materials Data Inc., Livermore, CA, Copyright 2014.
- Ostwald W. Z. Blocking of Ostwald ripening allowing long-term stabilization. Phys. Chem. 1901, 37, 385. [Google Scholar]
- Grätz H. Ostwald Ripening: New Relations Between Particle Growth and Particle Size Distribution. Scr. Mater. 1997, 37, 9–16. 10.1016/S1359-6462(97)00068-7. [DOI] [Google Scholar]
- Yahia Z.; Turrell S.; Mercurio J.-P.; Turrell G. Spectroscopic investigation of lattice vacancies in hexaborides. J. Raman Spectrosc. 1993, 24, 207–212. 10.1002/jrs.1250240405. [DOI] [Google Scholar]
- McKelvy M. J.; Eyring L.; Storms E. K. Analytical and Structural Analysis of the Lanthanum-Deficient Lanthanum Hexaboride. J. Phys. Chem. 1984, 88, 1785–1790. 10.1021/j150653a024. [DOI] [Google Scholar]
- Simpson P. J.; Knights A. P.; Chicoine M.; Dudeck K.; Moutanabbir O.; Ruffell S.; Schiettekatte F.; Terreault B. Thermal evolution of defects produced by implantation of H, D. and He in Silicon. Appl. Surf. Sci. 2008, 255, 63–67. 10.1016/j.apsusc.2008.05.171. [DOI] [Google Scholar]
- a Ruffell S.; Simpson P. J.; Knights A. P. The effect of the annealing ramp rate on the formation of voids in silicon. J. Phys.: Condens. Matter 2007, 19, 466202 10.1088/0953-8984/19/46/466202. [DOI] [Google Scholar]; b Jones K. S.; Crane S. P.; Ross C. E.; Malmborg T.; Downey D.; Arevalo E. In The Role of Pre-anneal Conditions on the Microstructure of Ge-Implanted Si after High Temperature Milli-second Flash Annealing, Proceedings of the 14th International Conference on Ion Implantation Technology, 2002; pp 76–78.
- Lim K.; Hamid M. A. A.; Shamsudin R.; Al-Hardan N. H.; Mansor I.; Chiu W. Temperature-Driven Structural and Morphological Evolution of Zinc Oxide Nano-Coalesced Microstructures and Its Defect-Related Photoluminescence Properties. Materials 2016, 9, 300. 10.3390/ma9040300. [DOI] [PMC free article] [PubMed] [Google Scholar]
- Zhai H.-J.; Zhao Y.-F.; Li W.-L.; Chen Q.; Bai H.; Hu H.-S.; Piazza Z. A.; Tian W.-J.; Lu H.-G.; Wu Y.-B.; Mu Y.-W.; Wei G.-F.; Liu Z.-P.; Li J.; Li S.-D.; Wang L.-S. Observation of an all-boron fullerene. Nat. Chem. 2014, 6, 727–737. 10.1038/nchem.1999. [DOI] [PubMed] [Google Scholar]
- Yorisaki T.; Tillekaratne A.; Ge Q.; Oshima C.; Otani S.; Trenary M. Probing the Properties of the (1 1 1) and (1 0 0) Surfaces of LaB6 Through Infrared Spectroscopy of Adsorbed CO. Surf. Sci. 2009, 603, 3011–3020. 10.1016/j.susc.2009.08.005. [DOI] [Google Scholar]
Associated Data
This section collects any data citations, data availability statements, or supplementary materials included in this article.


