

Abstract
A bisthiocarbonohydrazone-based chemosensor molecule (R1) containing a tetrahydro-8-hydroxyquinolizine-9-carboxaldehyde moiety has been synthesized and characterized as a new ratiometric fluorescent probe for picric acid (PA). The ratiometric probe R1 is a highly selective and sensitive colorimetric chemosensor for PA. The association between the chemosensor and PA and the ratiometric performance enabled by the key role of excited state intramolecular proton transfer in the detection process are demonstrated. Selectivity experiments proved that R1 has excellent selectivity to PA over other nitroaromatic chemicals. Importantly, the ratiometric probe exhibited a noteworthy change in both colorimetric and emission color, and this key feature enables R1 to be employed for detection of PA by simple visual inspection in silica-gel-coated thin-layer chromatography plates. Probe R1 has been shown to detect PA up to 3.2 nM at pH 7.4. Microstructural features of R1 and its PA complex have been measured by a field emission scanning electron microscope, and it clearly proves that their morphological features differ dramatically both in shape and size. Density function theory and time-dependent density function theory calculations were performed to establish the sensing mechanism and the electronic properties of probe R1. Furthermore, we have demonstrated the utility of probe R1 for the detection of PA in live Vero cells for ratiometric fluorescence imaging.
Introduction
Selective, sensitive, and prompt detection of explosives has received substantial attention in recent years because of the well-organized terror attacks all over the world and their implications in homeland protection, global demining, and environmental welfare.1−4 Nitro compounds constitute the bulk of many common explosive mixtures. Nitroaromatics are extensively used in industry for various purposes from synthesis of dyes, polymers, and plastics to pesticides and pharmaceuticals.5,6 They are also used as byproducts of fuel combustion in vehicles and power plants.7 2,4,6-Trinitrophenol, better known as picric acid (PA), has been exhaustively utilized by military powers as a high explosive ever since Hermann Sprengel proved in 1871 that it could be detonated. It is reported that the explosive nature of PA is even greater than that of TNT.8,9 Owing to its water-soluble nature, PA has proven to be exceptionally hazardous to all life forms. Repercussions from eye contact and inhalation can be dangerous. Lung disorders, asphyxiation, and even death are not unlikely consequences of exposure to high concentrations of PA, caused by infiltration of the chemical into the environment. In view of these facts, the development of simple and cost-effective techniques for detecting and purging environmental PA has become extremely important. Fluorescence signaling is a preferred technique among various methods used for detection of nitroderivatives because of its high sensitivity and selectivity.10−12 In addition, a fluorescence turn-on signal for sensing applications is generally considered to be superior to a turn-off signal.11,13 Literature studies revealed that reports of research findings for selective detection of PA through fluorescence turn-on signals are scarce.14,15 Furthermore, most of the reported PA-sensitive fluorescent sensors reveal only fluorescence intensity-based optical signal changes that are linked to many factors such as sensor concentration, environment, and excitation intensity. In comparison, ratiometric measurements based on the intensity ratios at two wavelengths come with the advantages of self-calibration of two emission bands and enhanced dynamic range of fluorescence measurement.16,17 To the best of our knowledge, only one instance of ratiometric detection of PA in environmental and battlefield samples has been documented so far.18 Thus, it is of immense interest to develop new ratiometric probes targeted toward PA sensing that can be safely applied in biological systems. It is important to note that our new thiobiscarbohydrazide imine of aminosalicylaldehyde probe (R1) is the first ratiometric fluorescent probe that is useful for fluorescence detection of PA in environmental and biological settings.
In this work, we describe a very efficient PA sensor bis-Schiff-base derived from very weak luminescent-substituted aminosalicylaldehyde.19 We show that the sensing mechanism of R1 involves excited intramolecular proton transfer (ESIPT) followed by supramolecular association. Sensor R1 is a versatile performer in that it can detect PA in solution (including aqueous medium, which is a highly desirable property) and in the solid state. The sensor is also successful at detecting trace amounts of PA ratiometrically in live cells. The utility of the probe lies in its easy synthetic procedure and high sensitivity compared with other reported PA sensors (see Table S5).
Results and Discussion
A solution of 2,3,6,7-tetrahydro-8-hydroxy-1H,5H-benzo[ij]quinolizine-9-carboxaldehyde (2 equiv) in ethanol (2.5 mL) was added slowly to a solution of thiocarbohydrazide (1 equiv) in water (0.5 mL). Initially, this results in turbidity, but at the end of the complete addition, the solution becomes clear. The reaction mixture was refluxed with stirring for 24 h. A precipitate formed, which was cooled, filtered, and washed with ethanol and then with ether. It was air-dried to give powder of 8-hydroxybenzoquinolizine-conjugated bisthiocarbonohydrazones product (Scheme 1).
Scheme 1. Preparation of R1.

Compound R1 was characterized by 1H NMR, 13C NMR, mass, and elemental analyses. The 1H NMR spectrum of compound R1 showed one singlet at 11.48 ppm for the amide (−NH) proton (2H), one singlet at 8.62 ppm for the imine −CH proton (2H), one singlet at 8.23 ppm for the only aromatic proton present in R1 (2H), one singlet at 6.72 ppm for the phenolic OH proton (2H), and three multiplets at 3.12–1.83 ppm for nonaromatic protons (8H, 8H, 8H) (see Figure S1). The mass spectrum of compound R1 showed a parent ion peak at m/z 505.2341 (M + 1)+ (see Figure S2). These spectroscopic data validate the structure of R1.
To understand the selective and sensitive niroaromatic chemical (NAC) sensing behavior of probe R1, absorption and fluorescence titrations were carried out. The free probe R1 [0.1 μM, DMSO/H2O (2:8; v/v), HEPES pH 7.4] displayed two major absorption bands at 230 and 367 nm, which are attributed to the π–π* transition of the azomethine (C=N) species and the presence of keto species owing to the keto–enol tautomerization of the imino–phenolic core, respectively. The solution of probe R1 exhibits a light yellow color because of the low π–π* transition of the chromophore. Upon titration of probe R1 with PA (1.0 μM) solution, the red-shifted absorbance of the ∼292 and 500 nm bands increases and that of the 230 and 367 nm bands decreases (Figure 1a). The color of the solution of probe R1 was changed from yellow to red, which could be easily observed by the naked eye (inset: Figure 1a). Thus, the spectral changes and three well-defined isosbestic points at 262, 308, and 453 nm were observed, indicating the formation of a new species upon treatment of probe R1 with PA, whereas the other NACs exhibit no significant change in the absorption spectra (Figure 1b).
Figure 1.

(a) Absorption titration curve of R1 [0.1 μM, DMSO/H2O, 1:4 (v/v), HEPES buffer at pH 7.4] with PA (0–2 equiv). Inset shows the color change before (yellow) and after (red) the addition of PA to R1. (b) Change in absorbance intensity of R1 in the presence of different analytes.
The formation of these hydrogen bonds affects the electronic properties of the chromophore, which are responsible for the color change with a subsequent new charge-transfer interaction between the protonated species and electron-deficient picrate anion.20 The strong binding affinity of PA allowed the Job’s plot method (see Figure S8) to be used in the determination of the binding stoichiometry, which was found to be a 1:2 probe-to-picrate anion complexation.
After obtaining good results in absorption titration, we carried out fluorescence titration and found that the sensor exhibited a ratiometric fluorescent response to PA. The free probe R1 (0.1 μM) displayed an intense fluorescence emission at 496 nm when excited at 367 nm in pH 7.4 HEPES buffer (DMSO/H2O: 1:4, v/v). However, as shown in Figure 2a, the addition of PA (1.0 μM) elicited a drastic decrease in emission at 496 nm and simultaneous appearance of a new emission band at 454 nm, attributed to the local emission (Scheme 2).
Figure 2.

(a) Emission spectra of R1 (λex = 367 nm) [0.1 μM, DMSO/H2O, 1:4 (v/v), HEPES buffer at pH 7.4] with PA (0–2 equiv). Inset shows fluorescent color change before (intense green) and after (low intense blue) the addition of PA to R1. (b) Change in fluorescence intensity ratio (F454/F496) of R1 [0.1 μM, DMSO/H2O, 1:4 (v/v), HEPES buffer at pH 7.4] with respect to concentration of PA (1.0 μM).
Scheme 2. Probable Mode of Binding of PA with R1.

Thus, the probe offered a significant ratiometric fluorescent response (I454/I496) to PA (Figure 2b), and this property can render the probe concentration immune to photobleaching or other environmental effects.21 As displayed in Figure 1a, probe R1 exhibited a remarkable emission shift (42 nm), and the fluorescence intensity ratios of probe R1 at 454 and 496 nm (F454/F496) showed a drastic change from 0.09 in the absence of PA to 0.65 in the presence of PA (2.0 equiv) (Figure 2b), a 7.5-fold variation in the emission ratio. The ratio of emission intensity has an excellent linear relationship with PA from 0 to 0.2 μM. A statistically applicable linear relationship was observed between the fluorescence enhancement and the concentration of the analyte that underlines the applicability of the probe for PA sensing. From the calibration curves, the limit of detection (LOD) was calculated using the formula LOD = 3σ/S (S/N = 3), where σ is the relative standard deviation and S is the slope of the calibration curve.22 It was found that the LOD of probe R1 is 3.2 nM (see Figure S9), which is quite lower than that of previously reported literature.23−31 We also created a Job’s plot using the fluorescence method and found a 1:2 interaction between PA and receptor R1 (Figure 3c).
Figure 3.

(a) Naked-eye fluorescence change of R1 in the presence of different analytes [(1) TNT, (2) PA, (3) NB, (4) 4-NP, (5) 1,3-DNB, (6) 2,4-DNP, (7) 2,4 DNT, (8) 3,4-DNT, (9) NBA, (10) NM]. (b) Change in fluorescence intensity of R1 (at 496 nm, λex = 367 nm) with different analytes. (c) Job’s plot of R1 (100 μM) with PA (100 μM).
Govindaraju et al.32 used the probe as a fluorescence quencher for the detection of Cu2+. In this context, we also found that the fluorescence intensity of the probe is gradually quenched upon the addition of Cu2+ (see Figure S16). However, other metal ions did not show any considerable change in fluorescence intensity up to 5.0 equiv (see Figure S17). Hence, the probe was unable to detect PA in the presence of Cu2+ (see Figure S18). However, the focus of our work is the ratiometric response of the probe toward PA, which is entirely different from the fluorescence quenching elicited by copper.
The intense fluorescence displayed by the free probe is believed to be due to ESIPT. The species responsible for ratiometric emission are the phototautomer excited enol (T*) and keto (N*) forms, which result from an ESIPT (T* ⇌ N*) process (Scheme 3). Molecules in which acidic and basic moieties lie in close proximity often exhibit ESIPT; in our system, proton migration from salicyl −OH to the Schiff base nitrogen in the excited state generates keto–enol and imine–amine tautomers, which have been well documented in the literature.33−35 With increasing concentration of PA, the fluorescence intensity of the probe gradually decreases at 496 nm with an increasing spectral emission shift at 454 nm, as shown in Figure 2a. Upon photoexcitation of probe R1 in the presence of PA, the salicyl −OH of the probe transforms to basic amine N–H and undergoes strong H-bonding with the nitro group of PA, leading to inhibition of the ESIPT process, which causes the fluorescence to switch off, and probe R1 shows only local fluorescence emission at 454 nm.
Scheme 3. ESIPT Mode of R1.

The change in fluorescence properties of R1 depends on the nature of the analytes—whether they are aromatic or aliphatic as well as number of nitro groups present. First, the fluorescence quenching ability of a nitroalkane such as nitromethane is lower than that of the nitroaromatic compounds (see Table S3). Also, the ratiometric behavior of R1 toward nitroalkenes is lower than corresponding nitroaromatics (see Table S4). This indicates that the interaction between nitroaromatic compounds and the fluorophore of probe R1 causes fluorescence quenching more easily. These results are similar to those previously reported.36−39 Second, nitroaromatics having more electron-deficient groups are the most efficient quenchers among aromatic analytes.24 For example, the fluorescence quenching is more intensive when there are more nitro groups on the aromatic ring (see Table S3). Furthermore, the hydrogen bond interaction between PA with the basic amine NH of probe R1 may also be favorable for enhancing the energy transfer ability to quench40 the fluorescence of probe R1. Therefore, PA has the best quenching effect of all, which also suggests that the basic amine type NH has a good selectivity for PA. This hydrogen bonding interaction inhibited the ESIPT process, which is responsible for the ratiometric fluorescence. The emission behavior of R1 did not vary with the addition of 5 equiv of trifluoroacetic acid, which has the same pKa as PA (see Figure S14). This result suggests that the ratiometric behavior is not due to simple protonation but due to protonation followed by hydrogen bonding interaction between R1 and PA.
To establish the ESIPT mode of the probe, we synthesized a model compound (MR1), which is the O-methylated derivative of compound R1 (Scheme S1). Compound MR1 is nonfluorescent in DMSO and exhibits no significant change in fluorescence intensity upon the addition of 5 equiv of PA (Figures S21 and S22). First, the compound is nonfluorescent due to inhibition of the ESIPT process. Second, as MR1 does not show any change in fluorescence intensity in the presence of excess PA, it is proved that the interaction between sensor and analyte is reliant upon the presence of the phenolic −OH group.
To check the selective detection of PA over other NACs, we carried out fluorescence titration experiments of probe R1 in the presence of various nitroaromatics such as PA, 4-nitrophenol (4-NP), 2,4-dinitrophenol (2,4-DNP), TNT, 2,4-dinitrotoluene (2,4-DNT), 3,4-dinitrotoluene (3,4-DNT), 4-nitrobenzoic acid (4-NBA), 4-nitrotoluene (4-NT), 1,3-dinitrobenzene (1,3-DNB), nitrobenzene (NB), and nitromethane (NM).
In this regard, solutions of probe R1 (0.1 × 10⁻⁶ M, pH 7.4 HEPES buffer, DMSO/H2O: 1:4, v/v) were mixed separately with a fixed amount of NAC (10 equiv) except for PA and left for 30 min to occupy all available interaction sites on R1. Fluorescence spectra of the respective solutions showed negligible changes in spectral features, as evident from Figure 4a (black bar), whereas incremental additions of PA to the aforementioned solutions (R1 + NACs) showed a continual quenching of fluorescence intensity at 496 nm (∼80–85%) (Figure 4b, green bar).
Figure 4.

(a) Change in fluorescence intensity of R1 (at 496 nm, λex = 367 nm) [0.1 μM, DMSO/H2O, 1:4 (v/v), HEPES buffer at pH 7.4] in the presence of 10.0 equiv of different analytes (black bar) and the addition of PA (1.0 μM) to it (green bar). (b) Change in the fluorescence intensity ratio (F454/F496) of R1 (at 496 nm, λex = 367 nm) [0.1 μM, DMSO/H2O, 1:4 (v/v), HEPES buffer at pH 7.4] in the presence of 10.0 equiv of different analytes (blue bar) and addition of PA (1.0 μM) to it (brown bar).
We also carried out the same experiment to check the ratiometric behavior of the probe, and no significant effect of other nitroaromatics toward the sensitivity of PA was observed (Figure 4b). Hence, of all of these nitro explosives, notably only PA exhibited a significant change in emission intensity and hence selectivity.
The corresponding room light and visual fluorescent color change experiments have been carried out to look at the behavior of R1 in the presence of various NACs. Under UV light irradiation, the solution of R1 is deep green, whereas in the presence of PA, it shows a nonfluorescent color that is otherwise not present in the other NACs studied (Figure 3a). Therefore, PA can easily be differentiated by a visual color change from the other NACs. At a response time of <1 min, probe R1 shows prompt fluorimetric response to PA addition (see Figure S10), which implies that it is quite handy for quick detection of PA in aqueous media.
The fluorescence response of probe R1 to PA at different pH values was also investigated. Different buffer solutions of pH values ranging from 1 to 13 were prepared by mixing sodium hydroxide solution and hydrochloric acid in HEPES buffer. Then, we continued to investigate the effect of pH on the fluorescence intensity of probe R1 in the absence or presence of PA. In the absence of PA, almost no apparent changes in fluorescence intensity were observed in the free probe R1 over a wide pH range of 3–13 (Figure S11). In addition, the fluorescence responses of the probe toward PA were almost pH-independent over a wide pH range of 3–13.
Fluorescence quenching titrations were carried out to determine the quenching constant of R1 with PA at 496 nm, and the quenching efficiency and sensitivity were evaluated by calculating the Stern–Volmer quenching constant (KSV),41 calculated by the Stern–Volmer (SV) equation: I0/I = 1 + KSV[PA], where KSV is the quenching constant (M–1), I0 and I are the fluorescence intensities of complexes before and after the addition of PA, and [PA] is the molar concentration of PA.
The SV plots showed two distinct regions: linear variation at a lower concentration of PA is mainly due to static quenching (Figure 5b), whereas deviation from linearity occurred on increasing the amount of PA (Figure 5a), presumably due to dynamic quenching via energy transfer between R1 and PA through H-bonding or due to the self-absorbance of PA. The value of the quenching constant KSV has been estimated to be KSV = 4.37 × 10⁴ M–1. This high value of the quenching constant points to the very good quenching ability of PA toward R1. The above value is remarkable compared with those of most efficient molecular fluorophores.
Figure 5.

(a) Stern–Volmer plot of R1 using PA as a quencher. (b) Stern–Volmer plot at lower concentration of PA.
The sensing event can also be studied from an electrostatic viewpoint. The highly acidic character of the phenolic moiety in PA, which facilitates its easy interaction with the basic amine group of probe R1 generating protonated species, is in fact due to the strong electron-withdrawing effect of the three NO2 substituents. Sun et al. reported such an electrostatic interaction where the amine group of bovine serum albumin selectively interacts with the picrate ion.42 To confirm the electrostatic interaction between probe R1 and the picrate ion, an aqueous sodium nitrate salt solution (1.0 M) of significantly higher concentration was added to the probe followed by studying its fluorescence activity toward PA.
Interestingly, in the presence of a concentrated salt, the fluorescence quenching toward PA at 496 nm was found to be very weak (60%) (Figure 6b) compared with that in the absence of salt addition (85%) (Table S1). Nevertheless, a higher concentration of PA (20 equiv) was required for the completion of the interaction (Figure 6a). Here, the salt screening effect of a concentrated NaNO3 solution is at work.43 The higher the concentration of added salt compared to the concentration of the analyte, the more the hindrance posed to the electrostatic association of the analyte with the probe. Besides, at higher concentrations of salt, the metal cation (Na+) may form a soluble salt with the picrate ion, rendering it unavailable for interaction with the probe, which directly influences its fluorescence properties.
Figure 6.

(a) Fluorescence spectra of R1 (0.1 μM) in the presence of NaNO3 (1.0 M) and PA (1.0 μM). (b) Percent quenching at different time intervals.
Furthermore, to know about the possible interactions of R1 towards PA, 1H NMR spectroscopic titrations were carried out in DMSO-d6. The 1H NMR spectrum of R1 displayed characteristic aldimine and thiocarbonohydrazide protons (Ha and Hb) at δ 8.62 and 11.48 ppm, respectively, with other aliphatic and aromatic protons in their respective positions (Figure 7). In the 1H NMR titration experiments, increasing additions of PA (1.0–3.0 equiv) to a solution of R1 resulted in significant downfield shifts for the peaks corresponding to the phenolic hydroxy proton and thiocarbonohydrazone protons because the electron densities of these protons involved in H-bonds are decreased and the corresponding signals undergo extensive broadening. At the same time, a new singlet appears at δ 8.75 ppm, which may be associated with the aromatic protons of PA (vide free PA, δ 9.20 ppm).
Figure 7.

1H NMR chart (DMSO, 400 MHz, DMSO-d6, 0.5 mL) of R1 (5 mg) in the presence of PA.
On the other hand, a newly generated broad singlet at δ 12.23 ppm is leading to the protonation of the tertiary amine nitrogen of probe R1. These results suggested that strong hydrogen bonding interactions are a crucial driving force for the fluorescence quenching process. To know the proper binding interaction of R1 with PA, we carried out mass spectra analysis, which shows a peak at 963.2274 (M + H+) that is consistent with the theoretical value of 962.2276 for 1:2 binding of R1 and PA (see Figures S4 and S5).
To investigate the electronic structure and the electronic transitions of chemosensor R1 and its PA complex, density function theory (DFT) geometry optimizations followed by time-dependent density function theory (TDDFT) calculations at the B3LYP/6-31G(d) level44−46 of the Gaussian 09W software package were carried out. The geometry optimizations for R1 and its PA complex [R1·2PA] (Figure 8) were carried out in a cascade fashion, starting from semiempirical PM2 followed by ab initio HF to DFT B3LYP by using various basis sets, viz., PM2 → HF/STO-3G → HF/3-21G → HF/6-31G → B3LYP/6-31G(d,p). For optimization of the complex, a starting model was generated by taking the DFT optimized probe R1 and placing the PA well in the carbonohydrazone N–H as hydrogen bond donor moieties at a noninteracting distance.
Figure 8.

Energy minimization structure of (a) R1 and (b) R1·2PA.
This model was then optimized initially using the HF/3-21G level of calculations, and the output structure from this was taken as an input for DFT calculations performed using the B3LYP/6-31+G(d,p) level for the complex. The optimized structure and graphical representations of highest occupied (HOMOs) and lowest unoccupied molecular orbitals (LUMOs) of R1 and its PA complex are shown in Figure 9. For chemosensor R1, FMOs are largely overlapping and distributed in the entire arylamine and thiocarbanohydrazone backbone. Thus, the intramolecular charge transfer (ICT) character of the sensor is only modest. By sharp contrast, for the PA complex [R1·2PA] spatial separation of FMOs is noticeable: the HOMOs are mainly located along the electron-richer thiocarbanohydrazone moiety, whereas the LUMOs chiefly reside along the most electron-deficient PA moieties. This orbital distribution suggested that the hydrogen bonding of the probe should influence the HOMO and LUMO unevenly and thus constitute the basis of an optical response of the complex. Furthermore, the HOMO–LUMO energy gap of complex [R1·2PA] becomes much smaller relative to its probe R1. The energy gaps between the HOMO and LUMO in probe R1 and its complex were 74.6 and 64.4 kcal mol–1, respectively (Figure 8).
Figure 9.

HOMO–LUMO distribution of R1 and R1·2PA.
TDDFT calculations were performed to explain the electronic properties of the probe and its PA complex in their ground and excited states. The vertical transitions, that is, the calculated λmax, main orbital transition, and oscillator strength (f) are listed in Table S1. The vertical transitions calculated by TDDFT were found to have good agreement with the experimental data. The studies suggest that the vertical transitions for probe L are observed at ∼435, ∼316, and ∼266 nm belonging to the HOMO → LUMO (f = 1.9733, 98.8%), HOMO – 2 → LUMO + 1 (f = 0.3910, 93.4%), and HOMO → LUMO + 2 (f = 0.1956, 97.3%) energy states, respectively, and absorption bands at ∼463, ∼391, and ∼365 nm belonging to the HOMO → LUMO + 4 (f = 0.6682, 93.0%), HOMO → LUMO + 5 (f = 0.1867, 92.8%), and HOMO – 2 → LUMO (f = 0.2739) energy states, respectively, for [R1·2PA]. The main contributing transition for red-shifted absorptions is HOMO → LUMO + 4 (∼93%) for the PA complex, which corresponds to the lowest energy state that arises due to ICT (Table S2).
Next, we sought to understand how the microscopic structural features of probe R1 change due to self-aggregation and also to see whether such structures are intact or form newer types in the presence of PA. Probe R1 exhibits a microrod-like morphology that is well spread all over the mica surface, as studied by field emission scanning electron microscopy (FESEM) (Figure 10a,b). However, in the presence of PA, this microrod-like morphology changes and the assembly of microparticles took place, resulting in a microspherical architecture as noticed by their decreased size along with nonuniform surface smoothness. It is interesting to perceive that the microrod-like particles protruded from the surface of the microspheres (Figure 10c,d). The microscopy data supports the induced supramolecular self-aggregation in probe R1 upon interaction followed by complexation by PA to a greater extent as compared with their particle size. It could also be explained based on hydrogen bonding interaction and π-stacking interaction at the time of molecular recognition.
Figure 10.

FESEM of R1 at (a) low and (b) higher magnification. FESEM of R1 + PA at (c) low and (d) higher magnification.
During the preparation of explosive materials, rocket fuels, fireworks, and so forth, nitroaromatic compounds may contaminate the human body. PA is not very hazardous in aqueous solution, but when dry, it acts as a powerful explosive. Dry PA has considerable affinity toward skin and acts as an effective skin sensitizer. Therefore, detection of these explosive nitroaromatics is very important in the vapor and solid states. Thus, we prepared test strips by dip-coating solutions of R1 in H2O/CH3CN (8:2; v/v) on thin-layer chromatography (TLC) plates followed by drying the strips under vacuum to test the remaining contamination in contact and vapor modes.
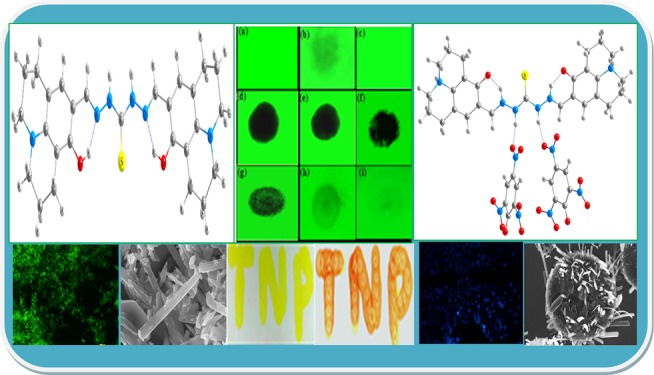
For solid-state detection of PA, a 10 μM (H2O/CH3CN (8:2; v/v)) solution of R1 was adsorbed on TLC plates and then dried. To investigate the sensitivity of PA toward the paper strips, we prepared different concentrations of PA (10–9 to 10–4 M) and applied them on the strips. As shown in Figure 11(IId–i), dark spots result due to spotting different concentrations of PA. The results suggest that an efficient quenching of fluorescence intensity was observed even in the solid state. Most importantly, even a nanomolar concentration (1.0 × 10⁻⁹ M) of PA can be detected by this test strip method. Quenching of fluorescence intensity of different strips is shown in Figure S15a. In this experiment, we achieved 39% quenching efficiency, indicating that R1 is very sensitive toward PA in the solid state as well (see Figure S15b).
Figure 11.

(I) (a) Virgin test strip (only R1). (b) Quenching in fluorescence area in the presence of PA vapor. (c) Test strip “b” after washing with water. (II) Spotting different concentrations of PA on fluorescent TLC plates: (d) 10–4, (e) 10–5, (f) 10–6, (g) 10–7, (h) 10–8, and (i) 10–9 M. (III) Naked-eye color change: (i) R1 only (1.0 × 10⁻⁶ M), (ii) 1.0 μM PA, (iii) 1.5 μM PA, (iv) 2.5 μM PA, and (v) naked-eye color on logo “TNP” made by R1 only (left) and after spotting of PA on the logo (right).
Owing to its sensitivity, in previously reported literature, only the fluorescence method was utilized to detect PA on test strips by simple spotting.25−29 Here, our compound R1 could detect PA not only by fluorescence spotting but also by naked-eye color changes. As shown in Figure 11(IIIv), the color of the spotted logo changed from yellow (only R1, 10.0 μM) to red just after the spotting of the solution of PA (0.1 μM). We could also detect a concentration-dependent naked-eye color change of the test strip upon increasing the amount of PA [Figure 11(IIIi–v)]. Hence, we could detect trace amounts of PA by visualizing the naked-eye color changes on TLC strips.
After obtaining a good sensitivity of the probe for PA in the solid state, we then checked its sensitivity in the vapor phase. To do this, we placed the fluorescence TLC strip of R1 on the mouth of the glass vial containing solid PA for 30 min at room temperature. Figure 11(Ib) shows that fluorescence quenching occurred throughout the TLC strip, indicating the adsorption of PA vapor on the solid surface.
The fluorescence spectra of the quenched areas of test strips of R1 were recorded (Figure 12a) using a front-face technique and were compared with the emission of the respective test strips only adsorbed with R1 (Figure 11(Ia)). After 30 min of adsorption, we found that nearly 22% quenching had occurred (Figure 12b). Next, we washed the TLC plate with water and found that quenched fluorescence was regained (Figure 11(Ic)). This indicates that adsorbed PA was removed from the test strip, demonstrating the reusability of the strip.
Figure 12.

(a) Change in fluorescence spectra of R1 on exposure to PA vapor at different time intervals. (b) Percent quenching in fluorescence intensity of R1 on exposure to PA vapor at different time intervals.
Wet PA, an odorless, yellow solution or wet slurry of yellow crystals, tends to lose moisture rapidly and becomes shock-, friction-, and heat-sensitive and hence prone to decomposition that may cause environmental pollution and even explosion. Hence, detection of PA as a toxic pollutant is very much essential not only from organic solvents but also from natural surface water resources where several interfering agents are present.
We collected several surface water samples from different areas of West Bengal, India (see Supporting Information for complete details) and tested the efficacy of our sensor in detecting PA in these diverse aqueous media. In this context, we prepared 10 μM solutions of PA in different water samples and observed the change in emission of R1. In every case, considerable fluorescence (at 496 nm) quenching was noticed (Figure 13).
Figure 13.

Sensing of PA from surface water specimen by using fluorescence quenching of R1.
Most importantly, R1 shows ratiometric behavior with the addition of PA in different water samples. Thus, we plotted a graph of F454/F496 with respect to PA present in different water samples and found the probe to be operating well in all cases (see Figure S13). These results suggest that irrespective of the source of water, ratiometric fluorescence behavior of R1 is manifested in the presence of PA. These results definitely establish the capability of R1 as a widespread fluorescent sensor of PA, an organic nitroaromatic explosive and mutagenic water toxin.
We also tested the sensing ability of R1 by spiking a soil sample with PA followed by its extraction from the soil matrix. An impressive 91% PA retrieval was achieved with our sensor, R1 (see Figure S20).
As we said earlier, PA is a dangerous water pollutant.47,48 Therefore, it can affect tissues and organs of the mammalian system. Thus, there is an obvious need for easy and quick in vitro detection of PA in natural water bodies. In developing countries such as India, the main source of drinking water is ground water, which is also the habitat for several living organisms. Owing to industrialization, unwanted pollutants are constantly mixed with the surface and ground water, making ground water susceptible to contamination with different toxic substances and pollutants. It thus becomes important to develop a method for the detection of PA in living cells grown in ground water. In this context, we collected a ground water specimen from Shalimar, an industrial area of West Bengal, India, and let Vero cells grow in the aqueous medium. From fluorescence titration of R1 with PA, as observed in the previous sections, a ratiometric behavior of the emission spectra was evident. For biological application of the probe, herein, the Vero cells were incubated with probe for 1 h and were observed under a fluorescence microscope.
A strong green fluorescence was observed with the green filter upon excitation with blue light. Additionally, when the cells were observed under the blue filter, no fluorescence was observed (Figure 14).
Figure 14.

Fluorescence microscopic observation of Vero cells under green and blue filters. No fluorescence was observed in the control; however, only green fluorescence was observed after the addition of probe R1. After the addition of PA, green fluorescence was quenched, and blue fluorescence was enhanced. Scale bar, 100 μm.
The cells were subsequently treated with PA and incubated for a further 1 h. After the PA treatment, effective quenching in fluorescence intensity under the green filter was found with a concomitant increase in intensity under blue-filter fluorescence (Figure 14). These results reveal that after the treatment of PA green fluorescence intensity is quenched, and blue fluorescence intensity is enhanced. This spectral behavior was also found in fluorescence titration. Therefore, it is evident that the live cell imaging results and fluorescence titration results corroborate each other. These data indicate that probe R1 can detect PA ratiometrically in living cells as well and therefore can be applied for the detection of PA in live cells grown in environmental ground waters.
Conclusion
In summary, a new chemosensor based on thiocarbonohydrazone (R1) has been synthesized and characterized as a ratiometric fluorescent probe for PA. Probe R1, whose sensing activity was observed in HEPES buffer medium, was found to be sensitive and selective toward PA among different NACs. The selectivity and sensitivity were established based on fluorescence, absorption, 1H NMR spectroscopy, HR-MS mass spectrometry, and visual fluorescent color changes. It is highly sensitive to PA with a low detection limit (DL) of 3.2 nM, and the KSV value is 4.37 × 10⁴ M–1. Visual detection was not restricted to the solution phase; thin layer chromatography plates or solution-coated paper strips were employed as solid-phase sensing systems. It may be noted that a silica gel plate coated with our probe R1 could identify PA vapor at a concentration as low as 0.5% within a few minutes at room temperature. This is the first report of a simple, portable method for detecting PA through a visual color change on TLC plates. The PA binding characteristics of R1 have been investigated by DFT and TDDFT calculations, which were carried out to demonstrate the electronic properties of R1 and the corresponding H-bonded PA complex. To know the supramolecular microstructural features of R1 and the R1–PA complex, FESEM studies were carried out in which the microrod-like morphology of R1 resulted in the assembling of microparticles in the complex. The suitability of R1 for ratiometric fluorescence imaging of PA in living cells was proved by the strong green fluorescent images observed in Vero cells incubated with probe R1 alone and weak blue fluorescence observed in the same cells in the presence of PA.
Experimental Section
Materials and Methods
All materials were bought from commercial suppliers and were used without further purification. 1H and 13C NMR spectra were recorded on a Bruker 400 MHz instrument. For NMR spectra, DMSO-d6 was used as a solvent using TMS as an internal standard. Chemical shifts are expressed in δ ppm units, and 1H–1H and 1H–C coupling constants are in hertz. Mass spectra were carried out using a Waters QTOF Micro YA 263 mass spectrometer. Fluorescence spectra were recorded on a Perkin-Elmer model LS 55 spectrophotometer. UV spectra were recorded on a JASCO V-530 spectrophotometer. Elemental analysis of the compounds was carried out on a Perkin-Elmer 2400 series CHNS/O analyzer. Column chromatography was carried out by using Silica Gel 60 (60–120 mesh).
General Method of UV–vis and Fluorescence Titration
For UV–vis and fluorescence titrations, stock solution of probe R1 was prepared (c = 0.1 μM) in H2O/DMSO (4:1, v/v) solution (100 mM HEPES buffer, pH 7.4). A solution of the different guest analytes of concentration 1.0 μM was also prepared in H2O/DMSO (4:1, v/v) solution (100 mM HEPES buffer, pH 7.4). The solution of probe R1 was ready by appropriate dilution technique. The spectra of these solutions were recorded by means of UV–vis and fluorescence methods. All solvents were purchased from local suppliers and were used after distillation.
Procedure for the Preparation of Fluorescence Test Strips
The fluorescent test strips were prepared by dip coating a TLC plate in the solution of R1 in H2O/CH3CN (4:1) followed by drying these strips in vacuum.
Procedure for Vapor-Phase Detection of Picric Acid
For the detection of PA in vapor phase by fluorescent paper strips, we placed the paper strip over the mouth of the vial containing crystals of PA for 10 min. The area exposed to the vapors of PA displays quenching in fluorescence visible to the naked eye. The fluorescence spectra of the quenched areas of test strips of R1 were recorded and compared with the emission of respective test strips only adsorbed with R1.
Calculation of Detection Limit
To calculate the detection limit, 0.1 μM concentration of R1 and 1.0 μM concentration of PA were prepared. Fluorescence titration was carried out by gradual addition of PA to the solution of R1. Fluorescence titration showed a linear response up to 2 equiv of PA. Then, LOD was calculated by the following equation.
| 1 |
where K = 2 or 3 (we take 3 in this case); Sb1 is the standard deviation of the blank solution; and S is the slope of the calibration curve.
Cell Culture
Monkey kidney epithelial cells, Vero, were cultured in Dulbecco’s modified Eagle’s medium (DMEM) (Gibco, NY) supplemented with 10% fetal bovine serum (Gibco, NY), antibiotic–antimycotic solution (100 U/mL penicillin, 100 μg/mL streptomycin, and 250 ng/mL amphotericin B) (Himedia, India), and 3.7 g/L bicarbonate and maintained in a humidified atmosphere with 5% CO2 at 37 °C.
Probe R1 Treatment
Cells were seeded in a 24-well plate and allowed to grow overnight at 37 °C. The attached cells were therefore exposed to probe R1 for 1 h. PA was added to the well and incubated for another 1 h. One well was set as a negative control, without any treatment, and another well was set as a positive control where only probe R1 was added. Cells of control and test groups were fixed with 4% paraformaldehyde solution. Fluorescence microscopy was carried out under a Nikon inverted microscope (Nikon eclipse Tí U, Japan) equipped with 20× (S Plan Fluor) objective. Cells were excited at 340–380 and 465–495 nm, and fluorescence detection was carried out through 435–485 and 515–555 nm band-pass filters.
Acknowledgments
We acknowledge DAE-BRNS [project no. 36(1)/14/12/2016-BRNS/36012] for financial support. S.S.A. and S.M. thank the UGC-MANF and UGC, New Delhi, for a fellowship. R.S. acknowledges RGNF-SC-UGC, Govt. of India, for supporting the fellowship. A.G. thanks IIEST, Shibpur for a fellowship.
Supporting Information Available
The Supporting Information is available free of charge on the ACS Publications website at DOI: 10.1021/acsomega.6b00288.
1H NMR, 13C NMR, and mass spectra characterizing R1 and its PA complex, detection limit calculation, pH response of R1 in the presence and absence of PA, detailed DFT calculations and relevant tables, and a comparison between previously reported PA sensors and our sensor (PDF)
Author Contributions
The manuscript was written through contributions of all authors. All authors have given approval to the final version of the manuscript.
The authors declare no competing financial interest.
Supplementary Material
References
- Thomas S. W. III; Joly G. D.; Swager T. M. Chem. Rev. 2007, 107, 1339–1386. 10.1021/cr0501339. [DOI] [PubMed] [Google Scholar]
- Germain M. E.; Knapp M. J. Chem. Soc. Rev. 2009, 38, 2543–2555. 10.1039/b809631g. [DOI] [PubMed] [Google Scholar]
- Salinas Y.; Martínez-Máñez R.; Marcos M. D.; Sancenón F.; Costero A. M.; Parra M.; Gil S. Chem. Soc. Rev. 2012, 41, 1261–1296. 10.1039/c1cs15173h. [DOI] [PubMed] [Google Scholar]
- Akhavan J.The Chemistry of Explosives; Royal Society of Chemistry, 2011; pp 34–37. [Google Scholar]
- Cenas N.; Nemeikaite-Ceniene A.; Sergediene E.; Nivinskas H.; Anusevicius Z.; Sarlauskas J. Biochim. Biophys. Acta, Gen. Subj. 2001, 1528, 31–38. 10.1016/S0304-4165(01)00169-6. [DOI] [PubMed] [Google Scholar]
- Schmitt H.; Altenburger R.; Jastorff B.; Schüürmann G. Chem. Res. Toxicol. 2000, 13, 441–450. 10.1021/tx9901635. [DOI] [PubMed] [Google Scholar]
- Zvinavashe E.; Murk A. J.; Vervoort J.; Soffers A. E. M. F.; Freidig A.; Rietjens I. M. C. M. Environ. Toxicol. Chem. 2006, 25, 2313–2321. 10.1897/05-678R.1. [DOI] [PubMed] [Google Scholar]
- Akhavan J.The Chemistry of Explosives, 3rd ed.; Royal Society of Chemistry: Cambridge, U.K., 2011; Chapter 1, pp 1–22. [Google Scholar]
- Hamric J. T. U.S. Patent 3515604, June 2, 1970.
- Jian C.; Seitz W. R. Anal. Chim. Acta 1990, 237, 265–271. 10.1016/S0003-2670(00)83928-8. [DOI] [Google Scholar]
- Yang X.; Niu C.-G.; Shen G.-L.; Yu R.-Q. Analyst 2001, 126, 349–352. 10.1039/b009002f. [DOI] [PubMed] [Google Scholar]
- Yang J.-S.; Swager T. M. J. Am. Chem. Soc. 1998, 120, 11864–11873. 10.1021/ja982293q. [DOI] [Google Scholar]
- Toal S. J.; Trogler W. C. J. Mater. Chem. 2006, 16, 2871–2883. 10.1039/b517953j. [DOI] [Google Scholar]
- Sivaraman G.; Vidya B.; Chellappa D. RSC Adv. 2014, 4, 30828–30831. 10.1039/c4ra02931c. [DOI] [Google Scholar]
- Madhu S.; Bandela A.; Ravikanth M. RSC Adv. 2014, 4, 7120–7123. 10.1039/c3ra46565a. [DOI] [Google Scholar]
- Du J.; Fan J.; Peng X.; Li H.; Sun S. Sens. Actuators, B 2010, 144, 337–341. 10.1016/j.snb.2009.09.022. [DOI] [Google Scholar]
- Fan J.; Sun W.; Hu M.; Cao J.; Cheng G.; Dong H.; Song K.; Liu Y.; Sun S.; Peng X. Chem. Commun. 2012, 48, 8117–8119. 10.1039/c2cc34168a. [DOI] [PubMed] [Google Scholar]
- Xu Y.; Li B.; Li W.; Zhao J.; Sun S.; Pang Y. Chem. Commun. 2013, 49, 4764–4766. 10.1039/c3cc41994k. [DOI] [PubMed] [Google Scholar]
- Han F.; Bao Y.; Yang Z.; Fyles T. M.; Zhao J.; Peng X.; Fan J.; Wu Y.; Sun S. Chem.—Eur. J. 2007, 13, 2880–2892. 10.1002/chem.200600904. [DOI] [PubMed] [Google Scholar]
- Pati P. B.; Zade S. S. Tetrahedron Lett. 2014, 55, 5290–5293. 10.1016/j.tetlet.2014.07.098. [DOI] [Google Scholar]
- Yao S.; Schafer-Hales K. J.; Belfield K. D. Org. Lett. 2007, 9, 5645–5648. 10.1021/ol7026366. [DOI] [PubMed] [Google Scholar]
- Gogoi B.; Sarma N. S. ACS Appl. Mater. Interfaces 2015, 7, 11195–11202. 10.1021/acsami.5b01102. [DOI] [PubMed] [Google Scholar]
- Chowdhury A.; Mukherjee P. S. J. Org. Chem. 2015, 80, 4064–4075. 10.1021/acs.joc.5b00348. [DOI] [PubMed] [Google Scholar]
- Bhalla V.; Gupta A.; Kumar M.; Rao D. S. S.; Prasad S. K. ACS Appl. Mater. Interfaces 2013, 5, 672–679. 10.1021/am302132h. [DOI] [PubMed] [Google Scholar]
- Vij V.; Bhalla V.; Kumar M. ACS Appl. Mater. Interfaces 2013, 5, 5373–5380. 10.1021/am401414g. [DOI] [PubMed] [Google Scholar]
- Béreau V.; Duhayon C.; Sutter J.-P. Chem. Commun. 2014, 50, 12061–12064. 10.1039/c4cc05888g. [DOI] [PubMed] [Google Scholar]
- Acharyya K.; Mukherjee P. S. Chem. Commun. 2014, 50, 15788–15791. 10.1039/C4CC06225F. [DOI] [PubMed] [Google Scholar]
- Ghosh P.; Banerjee P. Phys. Chem. Chem. Phys. 2016, 18, 22805–22815. 10.1039/c6cp01620k. [DOI] [PubMed] [Google Scholar]
- Roy B.; Bar A. K.; Gole B.; Mukherjee P. S. J. Org. Chem. 2013, 78, 1306–1310. 10.1021/jo302585a. [DOI] [PubMed] [Google Scholar]
- Xiong J.-F.; Li J.-X.; Mo G.-Z.; Huo J.-P.; Liu J.-Y.; Chen X.-Y.; Wang Z.-Y. J. Org. Chem. 2014, 79, 11619–11630. 10.1021/jo502281b. [DOI] [PubMed] [Google Scholar]
- Bhalla V.; Gupta A.; Kumar M. Org. Lett. 2012, 14, 3112–3115. 10.1021/ol301202v. [DOI] [PubMed] [Google Scholar]
- Maity D.; Manna A. K.; Karthigeyan D.; Kundu T. K.; Pati S. K.; Govindaraju T. Chem.—Eur. J. 2011, 17, 11152–11161. 10.1002/chem.201101906. [DOI] [PubMed] [Google Scholar]
- Mosquera M.; Penedo J. C.; Rodríguez M. C. R.; Rodríguez-Prieto F. J. Phys. Chem. 1996, 100, 5398–5407. 10.1021/jp9533638. [DOI] [Google Scholar]
- de Vivie-Riedle R.; De Waele V.; Kurtz L.; Riedle E. J. Phys. Chem. A 2003, 107, 10591–10599. 10.1021/jp035204r. [DOI] [Google Scholar]
- Mahapatra A. K.; Mondal S.; Manna S. K.; Maiti K.; Maji R.; Ali S. S.; Mandal S.; Uddin M. R.; Maiti D. K. ChemistrySelect 2016, 1, 375–383. 10.1002/slct.201500032. [DOI] [Google Scholar]
- Bhalla V.; Kaur S.; Vij V.; Kumar M. Inorg. Chem. 2013, 52, 4860–4865. 10.1021/ic3023997. [DOI] [PubMed] [Google Scholar]
- Zhou X.-H.; Li L.; Li H.-H.; Li A.; Yang T.; Huang W. Dalton Trans. 2013, 42, 12403–12409. 10.1039/c3dt51081f. [DOI] [PubMed] [Google Scholar]
- Bhalla V.; Arora H.; Singh H.; Kumar M. Dalton Trans. 2013, 42, 969–974. 10.1039/C2DT31459B. [DOI] [PubMed] [Google Scholar]
- Shanmugaraju S.; Joshi S. A.; Mukherjee P. S. J. Mater. Chem. 2011, 21, 9130–9138. 10.1039/c1jm10406c. [DOI] [Google Scholar]
- Iwan A.; Kaczmarczyk B.; Jarzabek B.; Jurusik J.; Domanski M.; Michalak M. J. Phys. Chem. A 2008, 112, 7556–7566. 10.1021/jp8019304. [DOI] [PubMed] [Google Scholar]
- Ballesteros E.; Moreno D.; Gómez T.; Rodríguez T.; Rojo J.; García-Valverde M.; Torroba T. Org. Lett. 2009, 11, 1269–1272. 10.1021/ol900050z. [DOI] [PubMed] [Google Scholar]
- Sun X.; Ma X.; Kumar C. V.; Lei Y. Anal. Methods 2014, 6, 8464–8468. 10.1039/C4AY01941E. [DOI] [Google Scholar]
- He G.; Peng H.; Liu T.; Yang M.; Zhang Y.; Fang Y. J. Mater. Chem. 2009, 19, 7347–7353. 10.1039/b906946a. [DOI] [Google Scholar]
- Becke A. D. J. Chem. Phys. 1993, 98, 5648–5652. 10.1063/1.464913. [DOI] [Google Scholar]
- Lee C.; Yang W.; Parr R. G. Phys. Rev. B: Condens. Matter Mater. Phys. 1988, 37, 785–789. 10.1103/PhysRevB.37.785. [DOI] [PubMed] [Google Scholar]
- Miehlich B.; Savin A.; Stoll H.; Preuss H. Chem. Phys. Lett. 1989, 157, 200–206. 10.1016/0009-2614(89)87234-3. [DOI] [Google Scholar]
- Xiong J.-F.; Li J.-X.; Mo G.-Z.; Huo J.-P.; Liu J.-Y.; Chen X.-Y.; Wang Z.-Y. J. Org. Chem. 2014, 79, 11619–11630. 10.1021/jo502281b. [DOI] [PubMed] [Google Scholar]
- Encyclopedia of Toxicology, 3rd ed., 2014; pp 952–954. [Google Scholar]
Associated Data
This section collects any data citations, data availability statements, or supplementary materials included in this article.