Abstract
The need for better microplastic removal from wastewater streams is clear, to prevent potential harm the microplastic may cause to the marine life. This paper aims to investigate the efficacy of electrocoagulation (EC), a well-known and established process, in the unexplored context of microplastic removal from wastewater streams. This premise was investigated using artificial wastewater containing polyethylene microbeads of different concentrations. The wastewater was then tested in a 1 L stirred-tank batch reactor. The effects of the wastewater characteristics (initial pH, NaCl concentration, and current density) on removal efficiency were studied. Microbead removal efficiencies in excess of 90% were observed in all experiments, thus suggesting that EC is an effective method of removing microplastic contaminants from wastewater streams. Electrocoagulation was found to be effective with removal efficiencies in excess of 90%, over pH values ranging from 3 to 10. The optimum removal efficiency of 99.24% was found at a pH of 7.5. An economic evaluation of the reactor operating costs revealed that the optimum NaCl concentration in the reactor is between 0 and 2 g/L, mainly due to the reduced energy requirements linked to higher water conductivity. In regard to the current density, the specific mass removal rate (kg/kWh) was the highest for the lowest tested current density of 11 A/m2, indicating that low current density is more energy efficient for microbead removal.
1. Introduction
Over the last century, the plastics industry has emerged and grown into a monolith that affects us at every step of our lives. Over the past 50 years, the use of plastics has increased 20-fold worldwide, with a predicted doubling of plastic usage over the next 20 years.1 Sadly, this growth in plastic usage has also manifested itself via an ever increasing presence of plastics in waste streams, both on land and in water. It has been estimated that there were over 150 million tons of plastic waste in marine waters as of 2016.2 Approximately, 0.1–1.5% of this waste is made up of microplastics, which are defined as plastic particles of less than 5 mm diameter.3 Microplastics can be classified as either primary or secondary. Primary microplastics are intentionally produced to fill very specific roles in many industries. The largest use is in personal care and cosmetic products (PCCPs), such as facial scrubs, where around 93% of all microplastics used in PCCPs are polyethylene-derived beads.3 These microplastic particles commonly find their way into wastewater streams, pass through wastewater treatment plants (WWTPs) untreated, and finally end up in marine waters.4 Secondary microplastics are produced when larger plastic particles that currently find themselves in water streams break apart due to a combination of UV degradation, mechanical stresses, and biological processes.5
Because of their small size, microplastics that are present in marine waters are easily ingested by the local marine flora. The impact of the addition of plastic to the diet of marine organisms is not fully understood. However, evidence has shown that cosmetic-derived microbeads can transfer adsorbed organic pollutants to aquatic species that ingest them, making cosmetic microbeads a serious but entirely preventable source of marine pollution.6,7
A legislative ban of microbeads in cosmetic products in developed countries, such as the United States, has proven effective.8 However, in developing countries, PCCP regulation is severely deficient9 and they lack both the infrastructure and the capital to construct centralized WWTPs, including expensive tertiary treatment capable of removing microbeads from effluent streams.10 There is a clear need for an innovative, cheap, and energy-efficient solution that can be used both locally and to supplant existing tertiary treatment.
Electrochemical techniques, such as electrocoagulation (EC), electrodecantation, and electroflotation, offer a cheaper method of tertiary treatment that does not rely on chemicals or microorganisms, such as in chemical coagulation or activated sludge processes. Instead, EC uses metal electrodes to produce coagulant electrically, making the process simple and robust.11 The benefits of electrochemical processes, including EC, extend to environmental compatibility, low capital costs, energy efficiency, sludge minimization, amenability to automation, and cost effectiveness.12
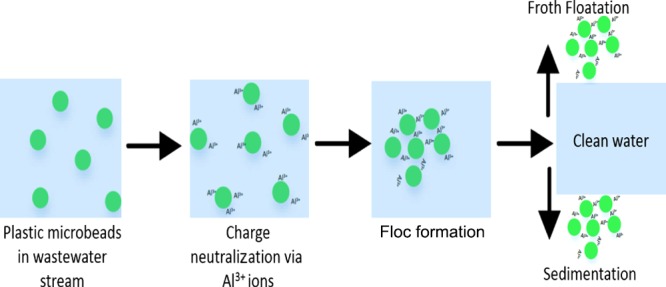
The process of EC functions by liberating metal ions from sacrificial electrodes into the water stream via electrolysis. The anodic and cathodic reactions are given in eqs 1–2 and 3–4, respectively. These ions then form coagulants in situ. The most commonly used coagulants produced by EC are formed by reaction of the metal ions, usually Fe2+ or Al3+, with OH– ions formed by electrolysis to produce metal hydroxide coagulants. These coagulants destabilize the surface charges of the suspended solids, breaking up the colloid or emulsion, which in turn allows them to approach each other close enough for van der Waals forces to take effect. Meanwhile, the coagulant forms a sludge blanket, which traps the suspended solid particles. The H2 gas liberated in the electrolysis process then lifts the resultant sludge to the water surface.13 Presently, EC has been shown to effectively remove dyes,14 heavy metals,15 and clay particles,16 with >80% of the polluting particles removed after treatment. Effective removal of some liquid organics has also been proven.11 However, the possibility of using EC for the removal of microplastics, such as polyethylene microbeads, has not been explored. In this context, we propose to utilize a reactor setup that has not been explored by other research groups, in the bid to reduce the operating cost of the microbead removal process. This is the niche that this project attempts to explore. To the author’s knowledge, our paper reports, for the first time, the investigation of using EC for microbeads removal.
| 1 |
| 2 |
| 3 |
| 4 |
| 5 |
The aim of the presented work is to investigate the feasibility of using aluminum-based EC to effectively remove plastic microbeads present in both domestic wastewater and industrial effluent. The study focused on investigating three operational parameters: initial pH, conductivity (NaCl concentration), and current density, to observe their effects on the microbead removal efficiency and to optimize both the microbead removal and energy efficiency. Removal and energy efficiency were measured in terms of removal efficiency and specific mass removal of the microbeads, respectively. On the basis of the findings within this paper, possible operation parameters for the implementation of EC as part of wastewater treatment were proposed.
2. Results and Discussion
For all of the investigations in this study, substantial removal of microbeads was observed with the EC process, with the highest removal efficiency being 90–100%. Statistical analysis using the t test adapted for non-normal distributions, the Mann–Whitney U test, shows that the microbead concentration in a treated sample at any given time is always significantly lesser than the microbead concentration in an untreated control sample (Mann–Whitney U test; U = 190.5, p < 0.0005). The U value shows the average difference in applied statistical rank between treated and control samples, whereas p < 0.05 shows that these results are significant with a >95% confidence level.
2.1. Effect of Initial pH
The initial pH value of the water was found to be an important operational parameter by other research groups17−19 for turbidity removal in industrial estate and food processing wastewater and drinking water feeds using the EC process. In these studies, there was often a characteristic optimum pH range discovered for different wastewater types. Figure 1 shows the change in the removal efficiency over time at different pH values. For all of the pH values investigated (pH = 3, 5, 7.5, and 10), the removal efficiency increases with time and reaches plateau after 40 min of EC operation. The maximum removal efficiency achieved is found to be 85–100%, showing that the EC process is effective for microbead removal over a wide range of pH values (pH = 3–10). As seen in Figure 1, there is no significant variance in removal efficiency across the tested pH range.
Figure 1.
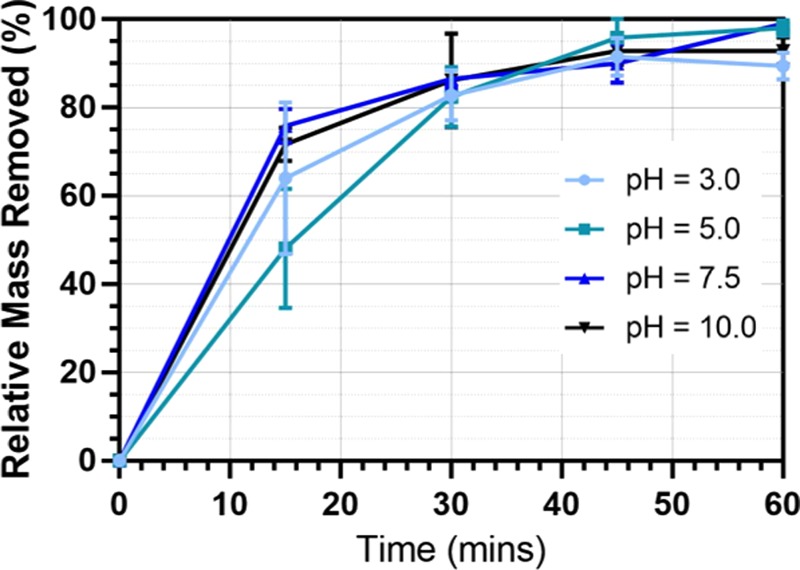
Microbead removal efficiency with time at different starting pH values. All other reactor conditions: current density, 15 mA/cm2; sodium chloride as supporting electrolyte 10 g/L; initial microbead (300–355 μm) concentration, 0.1 g/L; electrode spacing, 1 cm; and stirring speed, 60 rpm.
Nevertheless, after 60 min of treatment, samples at all pH ranges expressed successful removal with final removal efficiencies of >85%. From this data, the characteristic optimum pH range for this wastewater analogue is found to be pH = 3–10, indicating that EC is suitable for removing microbeads from wastewater streams with a wide range of pH values. The pH value of the wastewater depends on its origin. For example, the domestic/municipal wastewater usually has a pH range of 6–9.2.20,21 This flexibility of the EC process with regards to pH means that it could be used effectively for all common wastewater effluent-containing microbeads without requiring the addition of further chemicals to adjust the pH.
Figure 2 shows the final microbead removal efficiency at different initial pH values after 60 min of EC operation time. A removal efficiency of above 89% is successfully achieved for all of the samples at pH values ranging from 3 to 10. The final removal efficiencies at pH = 3 and 10 is lower than those at pH = 5 and 7.5. The optimum final removal efficiency of 99% was found at pH = 7.5. The results indicate that a more neutral pH is expected to give better removal due to the favorable production of coagulant at neutral pH, the same phenomena being reported by other research groups.18
Figure 2.
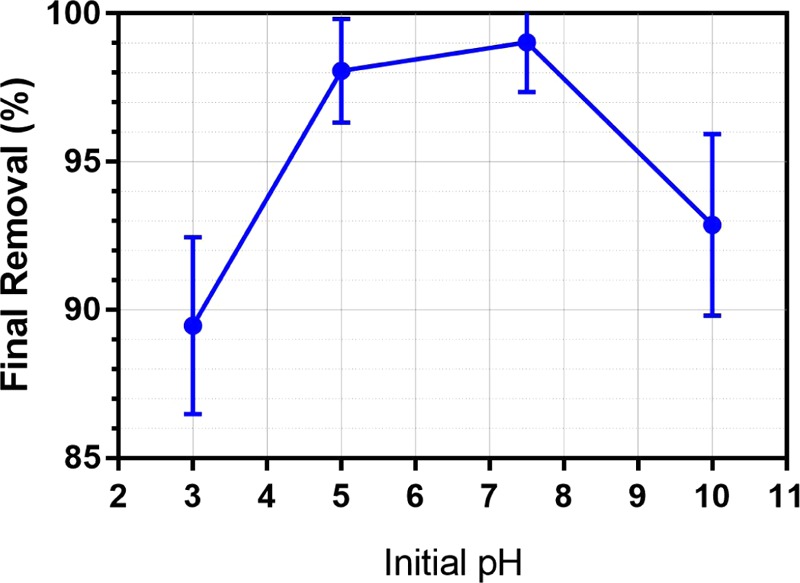
Final microbead removal efficiency after 60 min of electrocoagulation at different initial pH values. Reactor conditions same as those given in Figure 1.
At pH = 3, it was also observed that the beginning of floc formation was only visible after 5 min, whereas floc formation was visible almost immediately (<1 min) at all other initial pH values investigated. Previous work has found that for an Al/H2O system at 25 °C, Al(OH)3 will be the predominant species above pH = 3.7.13 Below pH = 3.7, the reaction described by eq 5 is less favorable and Al3+ is dominant. Figure 3 shows the change in pH of the wastewater samples with a constant line at pH = 3.7. The sample with initial pH = 3.0 took approximately 5 min to cross pH = 3.7, which agrees with the above observation that flocs began visibly forming after 5 min. This was when the pH was high enough for Al3+ to react favorably to form Al(OH)3 precipitate.
Figure 3.
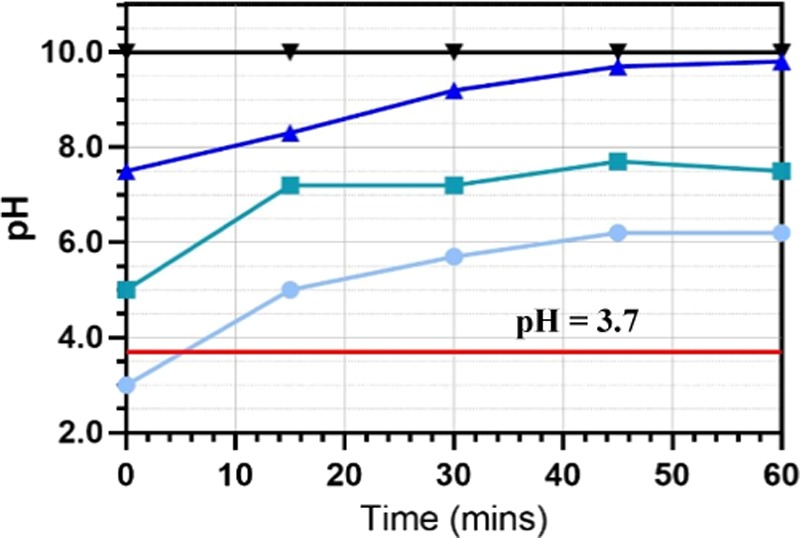
pH change against electrolysis time at different starting pH values (light blue filled circles, pH = 3.0; green filled squares, pH = 5.0; dark blue filled triangles, pH = 7.5; and black filled inverted triangles, pH = 10.0). Reactor conditions are the same as in Figure 2. The red line shows constant pH = 3.7 above which Al(OH)3 is the dominant metal species.
Although floc formation is clearly affected by pH, the time-dependent removal efficiency in Figure 1 shows small dependence on pH values. Visible observations showed that complete coverage of the reactor in a floc blanket with microbeads being seen visibly adsorbed on the flocs occurred at 15 min. This indicates that floc production may not be a significant factor when determining removal in the first 15 min. It is speculated that the mechanism of charge neutralization by Al3+ ions may be as effective as the flocculation mechanism by Al(OH)3 within this time frame. Further research is required to understand in detail the dominating mechanism for microbead removal at different pH values.
2.2. Effect of Conductivity
The effect of conductivity of the wastewater was investigated by adjusting the concentration of NaCl in the sample. The minimum and maximum salt concentrations employed were 2 and 8 g/L, respectively, corresponding to measured wastewater conductivities of 7.44 and 13.75 mS/cm. Figure 4 shows the average time-dependent removal efficiency at each NaCl concentration. Over the range of 2–8 g/L, NaCl concentration had no significant effect on removal efficiency at any time. The microbead removal efficiency increases with time and reaches a plateau after 40 min. All samples treated show >90% final removal efficiency after EC treatment for 60 min.
Figure 4.
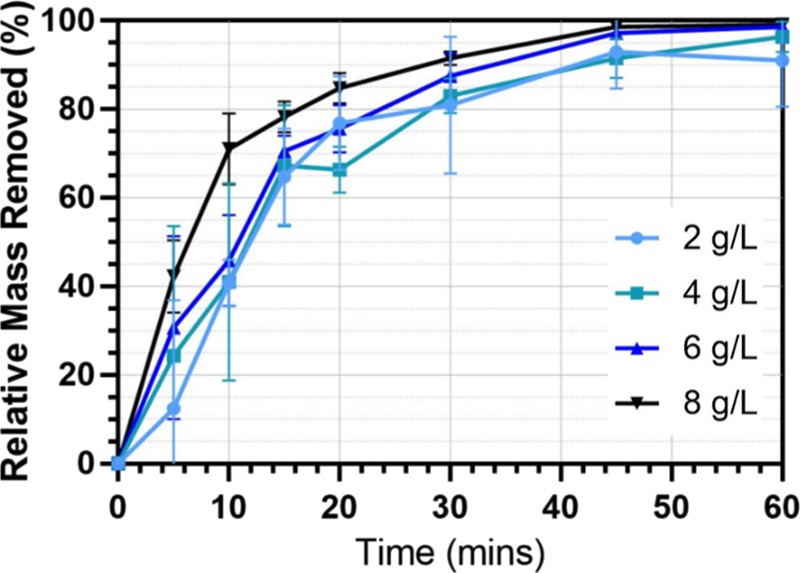
Microbead removal efficiency against time at different NaCl concentrations. All other reactor conditions: current density, 15 mA/cm2; initial pH = 7.5; initial microbead (300–355 μm) concentration 0.1 g/L; electrode spacing, 1 cm; and stirring speed, 60 rpm.
The results show that the increased presence of Cl– ions has minor effect on the removal efficiency (especially for NaCl concentration below 8 g/L), whereas previous studies22 showed heavy dependence of the removal efficiency of the targeted pollutants (dyes) on the concentration of Cl– ions. In the previous study, it was found that the presence of Cl– ions and formed HOCl resulted in side reactions that decomposed the dyes and aided adsorption onto the formed flocs,22 whereas in the case of microbead removal, at the pH range that was investigated, there was no evidence to suggest that the removal of polyethylene microbeads was affected by the presence of Cl– and HOCl species. It is postulated that the time taken for HOCl to cause degradation in the microbeads is far longer than the 60 min residence time of the electrochemical reactor and so the effect of NaCl concentration on the removal efficiency is not significant.
The energy consumption, E(t), of the EC cell was calculated. Throughout the EC process, the voltage fluctuated with time to keep a constant density as set by the direct current (DC) power supply. As such, further calculations will be using the time-averaged voltage applied, V, and the constant current, I. From E(t) and the absolute removal, Mabs,t (eq 13, found in Section 4.3), the specific mass removal per unit energy (g/kJ), Xs(t), of the cell was calculated, using eqs 6 and 7.
| 6 |
| 7 |
Figure 5 shows the calculated energy-specific removal over time for each NaCl concentration studied. It can be seen that specific removal is improved as NaCl concentration is increased. The sample containing 8 g/L of NaCl consumed 62% less electrical energy than that of the sample containing 2 g/L of NaCl. This revealed the possibility of optimizing the energy consumption (which is directly related to the operation cost) based on the addition of NaCl. According to Ozyonar and Karagozoglu,23 the operating cost per cubic meter of water treated by an EC reactor can be described using eq 8 (adapted to include the cost of NaCl). Note that this is simplified and does not consider the costs of waste sludge removal, cleaning, and maintenance that a full-scale reactor would incur
| 8 |
The salinity of wastewater has been found to have no significant effect on electrodissolution rate.13 This optimization is simplified to only consider the effect of NaCl concentration on operating cost, therefore revealing the optimum NaCl concentration for any other combination of operating conditions. Because electrode consumption and its associated costs do not depend on NaCl concentration, eq 8 can be simplified to
| 9 |
where energycons and saltcons are the consumptions of electricity and NaCl per m3 of water treated, respectively. X and Y are the unit costs of electricity (p/kWh) and NaCl (p/kg), respectively.
Figure 5.
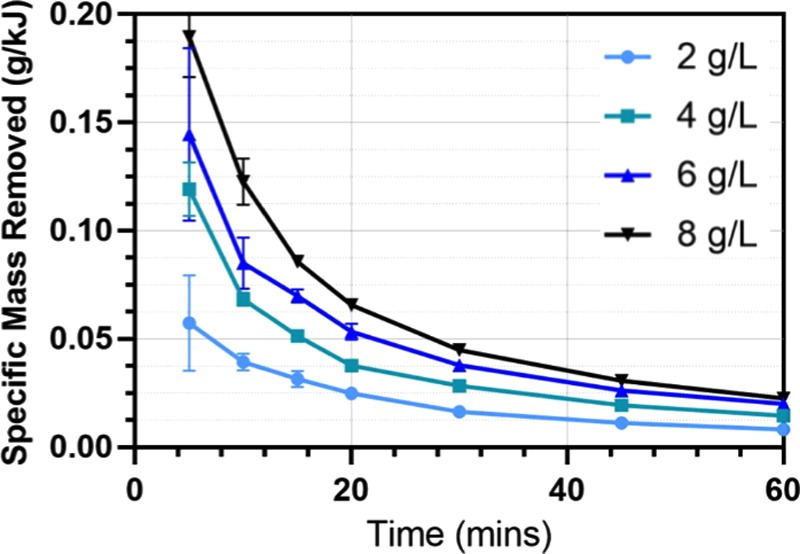
Specific microbead removal (g/kJ) against time at different NaCl concentrations. The reactor conditions are the same as Figure 6.
Figure 6 shows the estimated operating costs as a function of salt concentration for an EC cell operating for 60 min, at a current density of 15 mA/cm2, an electrode spacing of 1.5 cm, and stirring speed of 60 rpm. As the NaCl concentration in wastewater increases, operating cost increases. This is a result of the increase in the amount (therefore, cost) of NaCl salt added to achieve the corresponding NaCl concentration. Figure 6 shows that for NaCl concentration higher than 3 g/L, the largest factor affecting cost is the salt consumption per m3 of water treated.
Figure 6.
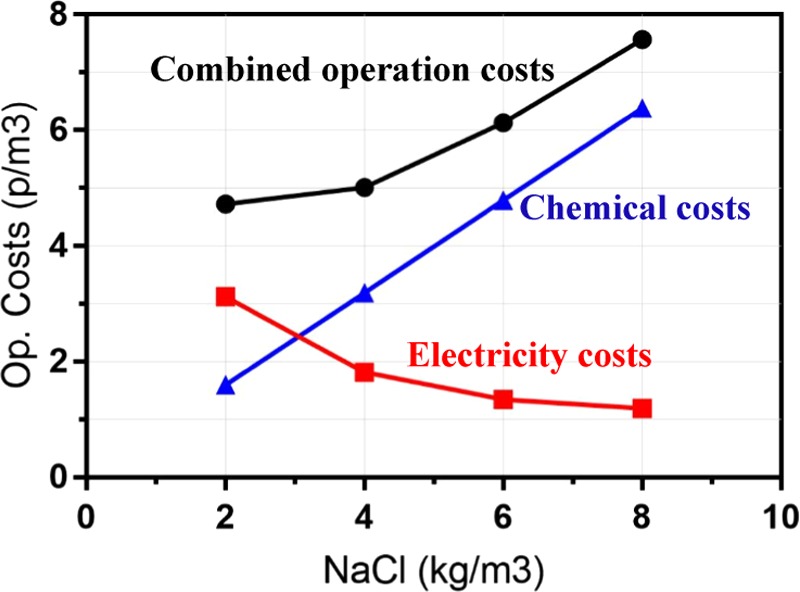
EC reactor operating costs per m3 of water treated against different NaCl concentrations. Operating cost calculations done using eqs 9–12. Unit cost of electricity based on cost of electricity (9.83 p/kWh) for industrial consumers.24 Unit cost of NaCl = 0.798 p/kg.
Figure 6 also shows that the cost of electricity is the dominant factor in determining the operation cost, when the NaCl added is below 3 g/L. Of all of the concentration values tested, the minimum operating cost (for factors related to salt concentration) for microbead removal was found to be at 2 kg/m3 NaCl.
2.3. Effect of Current Density
Current density is a key parameter in the application of EC as it is an operating parameter that can be directly controlled using the DC power supply.13,25Figure 7 shows the average microbead removal rates for the different tested current densities. Between 11 and 23 A/m2, there was no distinct difference in removal rates between the current density values tested at any specific time.
Figure 7.
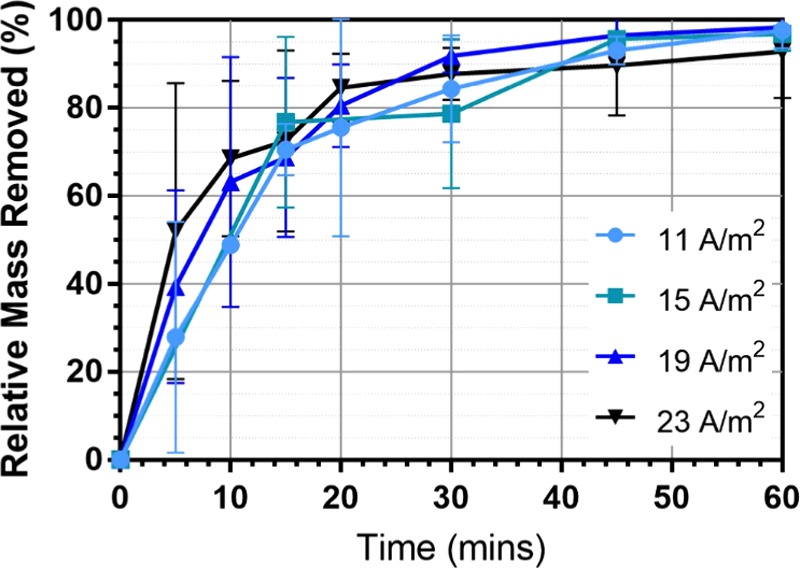
Average fractional removal for varied current densities.
According to Faraday’s law of electrolysis (eq 10), it is expected that increasing current density of the cell will result in an increase in metal ions liberated from the electrodes. This means that high amount of metal ions and therefore flocculants is expected to be present at high current density.
| 10 |
Figure 7 shows that removal efficiency of microbeads by EC is not significantly affected by the change in current density. This indicates that the amount of metal ions does not cause obvious removal of microbeads for the range of current densities investigated. It is clear that flocculation and settling appear to be the dominant mechanism of microbead removal when an excess of coagulant has been produced. The time at which coagulants are in excess and flocculation mechanisms dominate appears to be between 0 and 30 min as current density appears to have a more important effect on microbead removal over this time frame. This is shown by the decrease in gradient of the removal efficiency lines after 30 min in Figure 7. This implies that operating the reactor for more than 30 min would create excess coagulant with little effect on removal efficiency compared to allowing it to settle after 30 min. Meanwhile, longer operation will result in more reactor waste and greater electrode and energy consumption.
The most energy-efficient current density for microbead removal in this particular EC cell was found by comparing the specific mass removed per kJ of energy spent against current density. Figure 8 shows that at higher current densities the specific removal of the microbeads is reduced, largely due to the increase in energy consumption at higher current densities but yielding no significant increase in removal efficiency.
Figure 8.
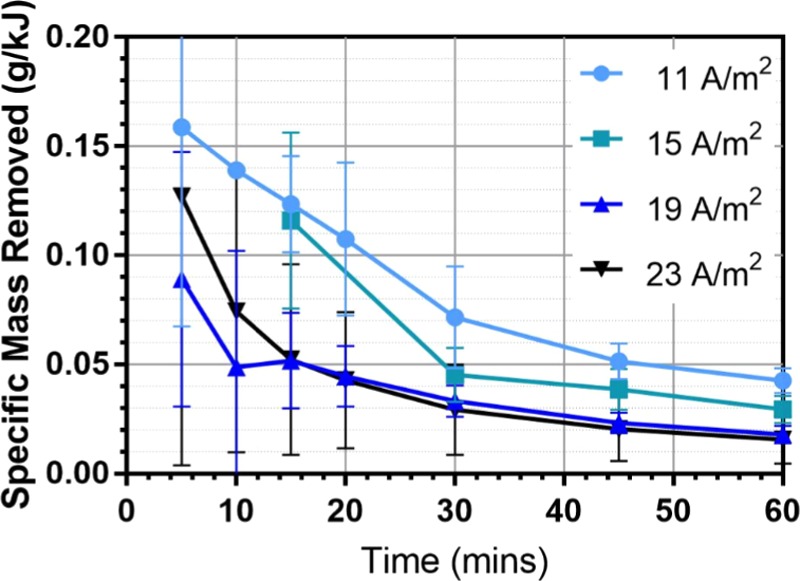
Specific microbead mass removal for different current densities.
From Figure 8, the lowest current density tested, 11 A/m2, offers the highest energy-efficient microbeads removal over the 1 h operational time. It is speculated that the most efficient current density may be lower than the range currently tested. On the basis of these results, we can conclude that current density does not affect the removal efficiency of the EC cell but operating at a lower current density will improve the energy efficiency of the cell. However, changing current density will also determine at what time the reactor will start producing an excess of coagulant, which will not further improve removal efficiency and will incur excess of reactor waste and increased electrode consumption. The time at which the reactor begins producing in excess will be specific to the reactor conditions, specifically current density, and can be used to determine the best operating time for the reactor in question.
2.4. Comparison with Previous Literature
Table 1 summarizes the results from recent studies involving electrocoagulation of various pollutants. It is noted that there is no other study in the literature using EC for the removal of microbeads. Therefore, direct comparison of our results with the literature is not possible. As shown in Table 1, the pollutant removal rate (typically above 90%) and optimum pH (∼7) from other work agree very well with our work. The apparatus we designed in this work has, however, managed to achieve a considerable reduction in operating cost compared to that by most other research groups. This is mainly attributed to the type of pollutants and the fact that microbeads undergo rapid charge neutralization during the first 15 min, which is able to quickly remove the 50–80% of the initial load of microbeads within this time frame. In the remaining operating period, flocculation mechanisms dominate and act to polish the wastewater and remove the remaining microbeads trapped in colloidal suspension. The combined mechanisms allow for substantial removal compared with previous research while also requiring less power to operate. It is recommended that, by exploiting the combination of these effects, low-cost treatment of microbead-laden streams is feasible. Further work would involve optimization of the operation time so that power and electrode consumption could be further minimized.
Table 1. Table Comparing Various EC Investigations Found in the Recent Literature.
| reference | type of pollutants | electrode material | electrode configuration | pollutant removal rate | COD removal | TSS removal | optimum initial pH | operating cost (per m3) |
|---|---|---|---|---|---|---|---|---|
| this work | PE microbeads | Al | bipolar | 99% | n/a | n/a | 7.5 | £0.05 |
| (26) | dye (RR198) | Al | monopolar-parallel | 98.6% | 84% | 98.6% | not tested | $0.26 |
| (23) | domestic wastewater | Al | monopolar-parallel | 98% | 72% | 98% | 7.8 | $0.86 |
| (27) | fluoride | Al | bipolar | >85% | n/a | n/a | 7 | 3.43 kWh |
| (28) | iron | Al | perforated plate flow column | 98.5% | n/a | n/a | 6 | $0.22 |
| (29) | bleaching effluent | Al | monopolar-series | n/a | 90% | 94% | 7 | $1.56 |
| (30) | strontium | stainless steel | monopolar-series | 93% | n/a | n/a | 5 | ≈$2.30 |
| (31) | paint manufacturing wastewater | Al | monopolar-parallel | n/a | 94% | 89% | 6.95 | €0.13 |
3. Conclusions
In this study, the removal of spherical microbeads from simulated wastewater by electrocoagulation using aluminum electrodes was investigated. The effects of pH, conductivity, and current density were studied in an electrochemical batch reactor in bipolar, parallel configuration. The results showed that EC is an effective method of removing microbeads from simulated domestic wastewater. Observations showed that microbeads underwent both flocculation and charge neutralization simultaneously. By configuring the reactor to exploit both mechanisms, the reactor operating costs are reduced. For the range of parameters investigated, the optimum reactor conditions were found to be pH = 7.5, NaCl concentration = 2 g/L, and current density = 11 A/m2. Future investigations are recommended to examine the effects of further reducing NaCl concentration and current density on the EC operation efficiency and cost. The most viable option for a large-scale industrial EC cell for removing microbeads seems to be a two-stage, continuous EC reactor/settler unit. Further research should look at possible reactor designs and configurations to optimize the process.
4. Materials and Methods
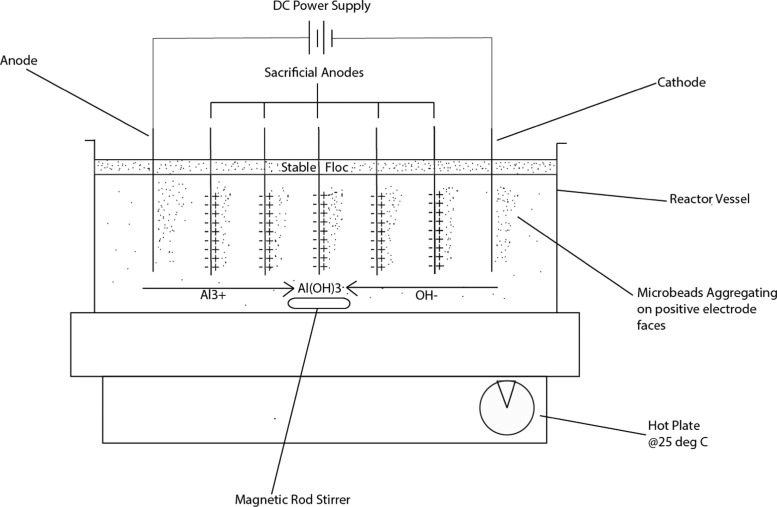
Electrocoagulation was conducted in a bench-scale stirred-tank batch reactor (details are given in Section 4.1). Wastewater analogue (1 L, details are given in Section 4.2) was added and electrodes placed in parallel along the reactor. Figure 9 shows the schematic of the reactor setup, connected to a DC power supply, which controls the voltage and current density of the EC operation. The reactor was run for 60 min for each experiment and then turned off, after which the contents were allowed to settle for 16 h.
Figure 9.
Schematic of bench-scale reactor setup used in the investigation.
Three investigations were conducted separately, each with different independent variables. The values of the controlled variables along with the range of variables studied for each investigation are given in Table 2.
Table 2. Parameter Values Studied for the Three Separate EC Investigations.
| investigation |
||||
|---|---|---|---|---|
| control variable values | pH | NaCl concn | current density | electrode spacing |
| pH | 3, 5, 7.5, 10 | 7.5 | 7.5 | 7.5 |
| NaCl concn (g/L) | 10 | 2, 4, 6, 8, 10 | 10 | 10 |
| current density (A/m2) | 15 | 15 | 11, 15, 19, 23 | 15 |
4.1. Electrochemical Reactor
A 1 L rectangular tank (233 mm × 130 mm × 100 mm) was used as the reactor containing wastewater analogue. Seven metal electrodes each of 90 mm × 30 mm × 1 mm were cut from the same 1 mm thick aluminum sheet. The electrodes were placed in the reactor vessels in parallel configuration suspended by a nonconductive plastic rod of 10 mm diameter. The two outermost electrodes were fixed to copper wires by pop-rivet connectors leading to a Farnell Ltd. triple output (4–6, 5–17 V) DC power supply. Only the outermost electrodes, one acting as the primary anode and the other as the primary cathode, were connected directly to the power supply giving a parallel, bipolar configuration. The five unconnected electrodes in between the anode and the cathode would then act as bipolar sacrificial electrodes. This resulted in a parallel, bipolar electrode setup. Bipolar configuration was chosen because it appeared to offer better removal rates in other EC investigations.32 The use of unconnected sacrificial electrodes was preferable as it reduced the number of interelectrode connections making the reactor easier to set up and clean in between experiments, while still providing a source of aluminum ions (albeit not as strong a source as a connected electrode). The connections between the powered electrodes were reversed after each experiment to prevent excessive, preferential, oxide (passive) layers forming on one electrode. The mixing within the reactor was achieved by a Fisher Scientific magnetic stirrer set at 60 rpm (placed at the bottom of the reactor) to evenly disperse the formed flocs.
This EC reactor as described above is also suitable for the removal of other substances from wastewater. In some unpublished work, we have used this system to improve the quality of the opaque water from a local lake. The EC process using this system successfully removed the organic matters and particles contained in the water, turning the lake water from opaque to transparent.
4.2. Wastewater Analogue
To gain a better understanding of the effects of water properties, a wastewater analogue was produced to emulate the conditions of domestic wastewater while allowing for complete control over the variables. In this study, four variables affecting the wastewater properties are investigated, including pH, conductivity of water, and the concentration and particle size of microbeads.
The wastewater analogue was made up using industrial fresh water with an average conductivity of 447 μS/cm and a pH of 7.5. HCl (1 M) and NaOH (1 M) solutions were used to control the pH without allowing a buffer to form in the initial sample. NaCl crystals (99.5% w/w, Fisher Chemicals) were added to 1 L of the water to adjust conductivity as required.
Fluorescent green, spherical microbeads of 300–355 μm (0.997 g/cm3) were used. According to the supplier (Cospheric LLC), >90% of the microbeads, which are used in industry and end up in wastewater streams, were expected to have similar size ranges; also >90% of the microbeads are spherical. The concentration of microbeads was controlled to be 0.1 g/L for this investigation.
The polyethylene beads were hydrophobic at the time of manufacture. To ensure that the microbeads are fully dispersed in water, 2 g of cussons morning fresh washing up liquid, acting as a source of surfactants, was added to every 1 L of wastewater sample. The contained surfactants emulate an average domestic wastewater surfactant concentration of 300 mg/L33 and aid the microbeads to evenly form a suspension as they would in real wastewater. Figure 10 shows the image of the as-made wastewater analogue with microbeads well dispersed.
Figure 10.
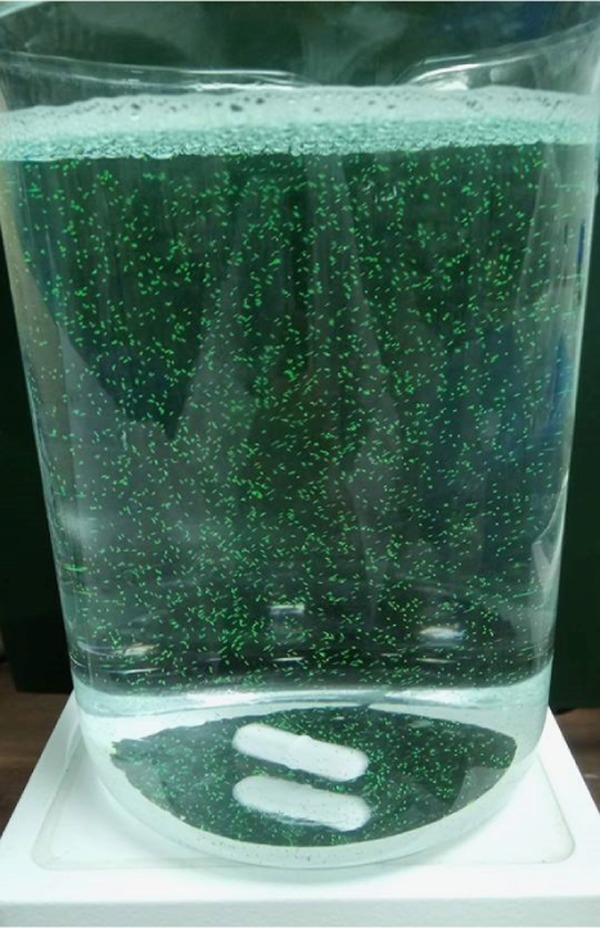
Image of a beaker containing wastewater analogue before the EC process.
4.3. Variable Measurements
The EC reactor was run for 60 min with water property measurements taken at every 5 min interval from 0 to 20 min, then followed by further sampling at 30, 45, and 60 min. Temperature and conductivity were continually monitored using a Mettler Toledo Five Easy Plus conductivity meter (calibrated using 0.1 g/L of KCl calibrating solution). pH was measured at each interval using ±0.5 accuracy pH indicator sticks (Fisher Scientific). Current and voltage readings were taken from the power supply readout at each sample time.
As EC progressed, the wastewater analogue became visibly more turbid due to the formation of a polymeric floc structure thought to be Al(OH)3. Mixing at 60 rpm dispersed these flocs relatively easily throughout the vessel, and some microbeads were visibly seen attached to the flocs. After 16 h settlement followed the EC process, the contents of the reactor settled. The formed floc blanket sank to the bottom of the reactor and took with it most of the contained microbeads. The remaining liquid bulk was visibly more clear and free of microbeads compared to that of the original samples.
The removal of microbeads was tracked by taking samples from the reactor during the EC operation. A representative 20 mL of sample was extracted from the bulk of the liquid by a 20 mL plastic syringe. The samples then underwent gravity filtration through Grade 1 Whatman filter papers and then were dried at 20 °C for 16 h. The number of microbeads, Nt, for each dried sample was counted. The estimated bulk concentration for the particle diameter, dp, at the sample time was then calculated by
| 11 |
For 300–355 μm microbeads employed in this investigation, an average dp = 327.5 μm was used in calculation, where ρ is the density of the polyethylene microbeads and Cmb is the microbead concentration in the bulk of the liquid (g/L). Absolute mass removal, Mabs,t, at sample time, t, was calculated by
| 12 |
And the removal efficiency, Mr,t, is calculated by
| 13 |
4.4. Reactor Maintenance
The reactor vessel was rinsed after each experiment with distilled water, and the electrodes were cleaned by acid bath in 1 M hydrochloric acid for 30 min. After being rinsed clean with deionized water, the edges were deburred using a file. This was done to remove much of the oxide layer formed during experiments, which would prevent electrode passivation from affecting the removal efficiency.
Acknowledgments
We would like to extend special thanks to the Department of Chemical and Process Engineering at the University of Surrey for providing the funding for this project. The same applies to Chris Burt and Ben Gibbons, the lab technicians at the aforementioned department. Their help and advice in regards to the reactor design as well as reagent procurement has been invaluable.
The authors declare no competing financial interest.
References
- World Economic Forum . The New Plastics Economy: Rethinking the Future of Plastics; WEC: Davos-Klosters, 2016. [Google Scholar]
- EPA . Plastic Microbeads in Products and the Environment; EPA: Sydney, 2016. [Google Scholar]
- Gouin T.; Avalos J.; Brunning I.; Brzuska K.; de Graaf J.; Kaumanns J.; Koning T.; Meyberg M.; Rettinger K.; Schlatter H.; Thomas J.; van Welie R.; Wolf T. Use of Micro-Plastic Beads in Cosmetic Products in Europe and Their Estimated Emissions to the North Sea Environment. SOFW 2015, 1–33. [Google Scholar]
- Elias S. A. Plastics in the Ocean. Encycl. Anthropocene 2018, 1, 133–149. 10.1016/b978-0-12-809665-9.10514-2. [DOI] [Google Scholar]
- Imhof H. K.; Laforsch C.; Wiesheu A. C.; Schmid J.; Anger P. M.; Niessner R.; Ivlevab N. P. Pigments and plastic in limnetic ecosystems: A qualitative and quantitative study on microparticles of different size classes. Water Res. 2016, 98, 64–74. 10.1016/j.watres.2016.03.015. [DOI] [PubMed] [Google Scholar]
- Farrell P.; Nelson K. Trophic level transfer of microplastic: Mytilus edulis (L.) to Carcinus maenas (L.). Environ. Pollut. 2013, 177, 1–3. 10.1016/j.envpol.2013.01.046. [DOI] [PubMed] [Google Scholar]
- Napper I. E.; Bakir A.; Rowland S. J.; Thompson R. C. Characterisation, quantity and sorptive properties of microplastics extracted from cosmetics. Mar. Pollut. Bull. 2015, 178–185. 10.1016/j.marpolbul.2015.07.029. [DOI] [PubMed] [Google Scholar]
- Wardrop D.; Bott C.; Criddle C.; Hale R.; McDevitt J.; Morse M.; Rochman C.. Technical Review of Microbeads/Microplastics in the Chesapeake Bay; STAC: Edgewater, MD, 2016. [Google Scholar]
- Leslie H.Review of Microplastics in Cosmetics; IVM Institute for Environmental Studies, 2014; Vol. 476, pp 1–33. [Google Scholar]
- Löhr A.; Savelli H.; Beunen R.; Kalz M.; Ragas A.; Van Belleghem F. Solutions for global marine litter pollution. Curr. Opin. Environ. Sustainability 2017, 28, 90–99. 10.1016/j.cosust.2017.08.009. [DOI] [Google Scholar]
- Garcia-Segura S.; Eiband M. M. S. G.; Viera de Melo J.; Martinez-Huitle C. A. Electrocoagulation and advanced electrocoagulation processes: A general review about the fundamentals, emerging applications and its association with other technologies. J. Electroanal. Chem. 2017, 801, 267–299. 10.1016/j.jelechem.2017.07.047. [DOI] [Google Scholar]
- Zeboudji B.; Drouiche N.; Lounici H.; Mameri N.; Ghaffour N. The Influence of Parameters Affecting Boron Removal by Electrocoagulation Process. Sep. Sci. Technol. 2013, 48, 1280–1288. 10.1080/01496395.2012.731125. [DOI] [Google Scholar]
- Moussa D. T.; Al-Marri M. J.; El-Naas M. H.; Nasser M. A comprehensive review of electrocoagulation for water treatment: potentials and challenges. J. Environ. Manage. 2017, 186, 24–41. 10.1016/j.jenvman.2016.10.032. [DOI] [PubMed] [Google Scholar]
- Khemila B.; Merzouk B.; Chouder A.; Zidelkhir R.; Leclerc J.; Lapicque F. Removal of a textile dye using photovoltaic electrocoagulation. Sustainable Chem. Pharm. 2018, 7, 27–35. 10.1016/j.scp.2017.11.004. [DOI] [Google Scholar]
- Akbal F.; Camci S. Copper, chromium and nickel removal from metal plating wastewater by electrocoagulation. Desalination 2011, 269, 214–222. 10.1016/j.desal.2010.11.001. [DOI] [Google Scholar]
- Adapureddy S. M.; Goel S. In Optimizing Electrocoagulation of Drinking Water for Turbidity Removal in a Batch Reactor, International Conference on Environmental Science and Technology; IACSIT Press: Singapore, 2012.
- Janpoor F.; Torabian A.; Khatibikamal V. Treatment of laundry waste-water by electrocoagulation. J. Chem. Technol. Biotechnol. 2011, 86, 1113–1120. 10.1002/jctb.2625. [DOI] [Google Scholar]
- Yavuz Y.; Ogutveren U. B. Treatment of industrial estate wastewater by the application of electrocoagulation process using iron electrodes. J. Environ. Manage. 2018, 207, 151–158. 10.1016/j.jenvman.2017.11.034. [DOI] [PubMed] [Google Scholar]
- Banerji T.; Chaudhari S. Arsenic removal from drinking water by electrocoagulation using iron electrodes- an understanding of the process parameters. J. Environ. Chem. Eng. 2016, 4, 3990–4000. 10.1016/j.jece.2016.09.007. [DOI] [Google Scholar]
- Ahsan M.; Riaz A.; Jaskani M. J.; Hameed M. Physiological and Anatomical Response of Fragrant Rosa Species with Treated and Untreated Wastewater. Int. J. Agric. Biol. 2017, 19, 13. 10.17957/IJAB/15.0160. [DOI] [Google Scholar]
- Idris-Nda A.; Aliyu H. K.; Dalil M. The challenges of domestic wastewater management in Nigeria: A case study of Minna, central Nigeria. Int. J. Dev. Sustainability 2013, 2, 1169–1182. [Google Scholar]
- Pirkarami A.; Ebrahim Olya M. Removal of dye from industrial wastewater with an emphasis on improving economic efficiency and degradation mechanism. J. Saudi Chem. Soc. 2017, 21, S179–S186. 10.1016/j.jscs.2013.12.008. [DOI] [Google Scholar]
- Ozyonar F.; Karagozoglu B. Operating Cost Analysis and Treatment of Domestic Wastewater by Electrocoagulation Using Aluminum Electrodes. Pol. J. Environ. Stud. 2011, 20, 173–179. [Google Scholar]
- Annut A. Prices of fuels purchased by non-domestic consumers in the UK [data set], 2013. https://www.gov.uk/government/statistical-data-sets/gas-and-electricity-prices-in-the-non-domestic-sector (accessed May 08, 2017).
- Nandi B. K.; Patel S. Effects of operational parameters on the removal of brilliant green dye from aqueous solutions by electrocoagulation. Arabian J. Chem. 2017, 10, S2961–S2968. 10.1016/j.arabjc.2013.11.032. [DOI] [Google Scholar]
- Dalvand A.; Gholami M.; Joneidi A.; Mahmoodi N. M. Dye Removal, Energy Consumption and Operating Cost of Electrocoagulation of Textile Wastewater as a Clean Process. Clean: Soil, Air, Water 2011, 39, 665–672. 10.1002/clen.201000233. [DOI] [Google Scholar]
- Palahouane B.; Drouiche N.; Aoudj S.; Bensadok K. Cost-effective electrocoagulation process for the remediation of fluoride from pretreated photovoltaic wastewater. J. Ind. Eng. Chem. 2015, 22, 127–131. 10.1016/j.jiec.2014.06.033. [DOI] [Google Scholar]
- Hashim K. S.; Shaw A.; Al Khaddar R.; Pedrola M. O.; Phipps D. Iron removal, energy consumption and operating cost of electrocoagulation of drinking water using a new flow column reactor. J. Environ. Manage. 2017, 189, 98–108. 10.1016/j.jenvman.2016.12.035. [DOI] [PubMed] [Google Scholar]
- Sridhar R.; Sivakumar V.; Immanuel V. P.; Maran J. P. Treatment of pulp and paper industry bleaching effluent by electrocoagulant process. J. Hazard. Mater. 2011, 186, 1495–1502. 10.1016/j.jhazmat.2010.12.028. [DOI] [PubMed] [Google Scholar]
- Murthy Z. V. P.; Parmar S. Removal of strontium by electrocoagulation using stainless steel and aluminum electrodes. Desalination 2011, 282, 63–67. 10.1016/j.desal.2011.08.058. [DOI] [Google Scholar]
- Akyol A. Treatment of paint manufacturing wastewater by electrocoagulation. Desalination 2012, 285, 91–99. 10.1016/j.desal.2011.09.039. [DOI] [Google Scholar]
- Palahouane B.; Drouiche N.; Aoudj S.; Bensadok K. Cost-effective electrocoagulation process for the remediation of fluoride from pretreated photovoltaic wastewater. J. Ind. Eng. Chem. 2015, 22, 127–131. 10.1016/j.jiec.2014.06.033. [DOI] [Google Scholar]
- Tomczak-Wandzel R.; Dereszewska A.; Cytawa S.; Swarzewo M. K. A. The effect of surfactants on activated sludge process. Joint Polish-Swedish Reports, 2009; pp 1–8.


