

Abstract

In this work, donor−π–acceptor-type four crystalline compounds have been tested for the first time to restrict the corrosion of mild steel in 1 M HCl. The details of the compounds are: C1, 4-N,N-dimethylamino-β-nitrostyrene; C2, 2-(4-(dimethylamino) benzylidene)malononitrile; C3, ethyl 2-cyano-3-(4-(dimethylamino) phenyl)acrylate; and C4, methyl 2-cyano-3-(4-(dimethylamino)phenyl)acrylate. The corrosion inhibition potentials of the compounds have been primarily investigated by electrochemical techniques, such as linear polarization resistance, Tafel polarization curves, and electrochemical impedance spectroscopy. The secondary investigation is performed by scanning electron microscopy, fluorescence surface imaging, spectroscopic techniques (UV–visible and Fourier transform infrared spectroscopy), and X-ray diffraction patterns. The results disclosed that 50 mg L–1 of the compounds (1–4) in 1 M HCl provided the maximum inhibition efficiency as 93% (1), 88% (2), 82% (3), and 86% (4). The function of the compounds as corrosion inhibitors is explained with equilibrium corrosion potential, adsorption isotherms, and the frontier molecular orbital energies of the compounds (EHOMO and ELUMO) estimated by cyclic voltammetry curves and UV–visible spectra.
1. Introduction
Inhibitors are strategically developed materials for the inhibition of metallic corrosion in various aggressive solutions. Generally, inhibitors are directly added in corrosive media. During initial ionic interactions, inhibitor molecules adsorb on the metal surface and specifically retard cathodic or anodic or both corrosion reactions. Because of numerous benefits of inhibitors, such as fast application procedure, low price, and high anticorrosion potential, scientists and researchers have tested several chemical moieties as corrosion inhibitors.1−7 However, they have achieved good corrosion inhibition efficiency only with the inhibitors having functional groups rich in aromatic rings, heteroatoms, and π-conjugated molecules.8−15
Because of the facts quoted in above paragraph, the prime focus of the present work is set to test the inhibition ability of compound 1 (C1), compound 2 (C2), compound 3 (C3), and compound 4 (C4) to lower the corrosion loss of M.S. in 1 M HCl. All of these compounds commonly have a dimethylamino group at one end and different electron-accepting groups at the other ends. This arrangement of the compounds creates a unique family of push–pull-type materials.16 These donor−π–acceptor (d−π–a)-type compounds can be categorized as organic charge-transfer materials (OCTMs). OCTMs are widely used in optics and optoelectronic applications because of their property of low-energy intramolecular charge-transfer (ICT) adsorptions.17,18 The reason for the selection of the compounds (C1–C4) for corrosion inhibition study is because of their fascinating chemical structures and fluorescence properties. These π-conjugated organic molecules are attached with electron acceptor (dimethylamino) and electron donor functional groups at the opposite ends, which make these molecules able to transfer charges from donor to acceptor groups within the molecule.19,20 In general, an inhibitor is either a good electron donor or a good electron acceptor. Hence, it is scientific and logical to use a chemical moiety that has both electron donor and electron acceptor functional groups for high corrosion inhibition efficiency via better chemical bonding with the metals. As these compounds are also fluorescent,16 the surface attachment of the compounds can be detected by their fluorescence properties. Additionally, these compounds (C1–C4) are rich in heteroatoms (N and O) as well as π-conjugated molecules; they meet with the specific requirements of an active corrosion inhibitor.21−24 Therefore, we have investigated the corrosion inhibition efficiency of C1, C2, C3, and C4 in 1 M HCl by open-circuit potential (OCP), electrochemical impedance spectroscopy (EIS), Tafel polarization curves, linear polarization resistance, UV–visible spectroscopy, Fourier transform infrared (FTIR) spectroscopy, X-ray diffraction (XRD), fluorescence surface imaging, and scanning electron microscopy (SEM) techniques. The key results of this work have illustrated that these compounds have remarkably decreased the M.S. corrosion loss in 1 M HCl. To the best of our knowledge, these organic compounds have never been employed to restrict the corrosion loss of M.S. in acid solutions to date; they have great potential for being promoted as corrosion inhibitors.
2. Results and Discussion
2.1. Structural Characterization of the Compounds
Powder XRD (PXRD) patterns of the compounds were recorded to know the crystalline behavior as well as symmetry of the synthesized chromophores and are shown in Figure 1. The chromophores exhibited sharp diffraction peaks mainly in the region of 10°–30°. The planes corresponding to various diffraction peaks were indexed and are shown in Figure 1. In the diffraction pattern of chromophore 1, the most intense peak was observed at 13.9° corresponding to the plane (0 0 4). However, the chromophores 2, 3, and 4 showed the most intense peaks at 26.7°, 24.9°, and 16.1° corresponding to the planes (1 2 −1), (2 0 0), and (0 1 1), respectively. From the analysis of XRD patterns of the chromophores, it could be stated that all inhibitors were crystalline in nature. The crystal structures of the chromophores were reported as orthorhombic, monoclinic, triclinic, and triclinic for compounds 1, 2, 3, and 4, respectively,16 which showed that the symmetry of the compounds lowered from compound 1–4.
Figure 1.
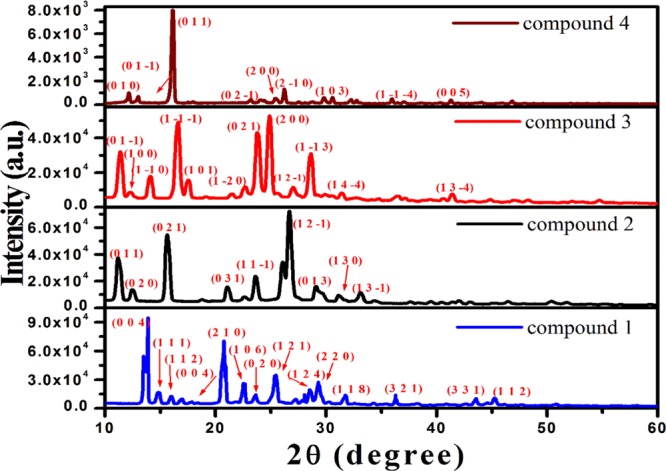
PXRD patterns of the compounds 1,2, 3, and 4.
The bonding details of the chromophores were investigated by FTIR spectroscopy and are shown in Figure 2. The FTIR spectra of the chromophores exhibited vibrational peaks in the region of 1400–1540 and 2890–3090 cm–1, which could be credited to C–C and C–H stretching of the benzene ring, respectively. The peak of C=C stretching vibration was recognized in the range of 1550–1622 cm–1 in the spectra with a large shifting toward a higher wavenumber. That occurred because of the conjugation effect of several electron-withdrawing groups present in all chromophores. The additional spikes observed throughout the FTIR spectra were a clear indication of Fermi resonances. Furthermore, the conjugated nitro group in chromophore 1 produced strong bands near 1327 cm–1. The C–N vibration peaks of chromophores 2 and 3 appeared at 2218 and 2212 cm–1, respectively. This slight shift of the peak position was caused by the conjugation of C=O. Vibrational bands for C=O stretching appeared at 1706 and 1712 cm–1 in chromophores 3 and 4, respectively. The extent of vibrational shifting to C=C showed the effect of conjugation with C=O and C≡N groups.
Figure 2.

FTIR spectra of the compounds 1,2, 3, and 4.
Figure 3 represents the UV–visible absorption spectra of the compounds (C1–C4) in an aqueous medium. In the spectra of all compounds, high-intensity absorption peaks appeared between 421 and 439 nm that are the artifacts of π–π* transitions in prominently π-conjugated molecules.16,25,26 These transitions were observed in the spectra of the compounds because of ICT from the donor of the compounds (N,N-dimethylamino) to various acceptors, that is, nitrovinyl (C1), dicyanomethylidene (C2), cyano (ethoxycarbonyl)methylidene (C3), and cyano(methoxycarbonyl)-methylidene (C4), of the compounds. Furthermore, a decrease in the λmax value of the absorption peaks was acknowledged for the chromophores 2, 3, and 4 with respect to chromophore 1. The decrease in λmax values could be attributed to the difference in the strength of acceptor groups attached with the compounds, that is, from nitrovinyl (C1) to cyano(methoxycarbonyl)methylidene (C4).
Figure 3.

UV–visible spectra of the compounds 1,2, 3, and 4 in an aqueous solution.
2.2. Electrochemical Methods
2.2.1. OCP and Cyclic Voltammetry Study
All electrochemical measurements were recorded after 10 min immersion of M.S. electrodes in electrolytes. The OCPs of M.S. electrodes were monitored for 10 min; however, the OCP curves having the optimum concentration of all compounds in acid solutions are shown in Figure 4. A careful analysis of the OCP curve in blank 1 M HCl revealed that the M.S. started to corrode in the early period of immersion and developed a layer on the surface. However, only slight variations in OCPs were observed after 10 min, which could be treated as a stable OCP of the M.S. electrode. Furthermore, Figure 4 disclosed that OCPs of the electrodes shifted toward cathodic potentials with reference to that in blank hydrochloric acid. This fact indicated that inhibitors were more actively working against cathodic reactions with respect to anodic reactions.27,28
Figure 4.

OCP curves for M.S. in 1 M HCl at room temperature with an optimum concentration of the compounds.
Analysis of Figure 5 revealed that the compounds were showing high redox activity, which was good for bond formation and hence also for corrosion inhibition. The main reason to perform the cyclic voltammetry (CV) analysis was to calculate EHOMO and ELUMO energies of the compounds, which could be calculated by knowing the onset potentials of oxidation peaks of the compounds. The onset oxidation potentials of the compounds (1, 2, 3, and 4) were found as 1.007, 1.060, 1.13, and 1.03 V, respectively. The EHOMO and ELUMO energies of the compounds were obtained and discussed under section 2.5.
Figure 5.

CV curves of the chromophores (a) C1, (b) C2, (c) C3, and (d) C4.
2.2.2. Impedance Study by EIS
The changes in the impedance behavior of M.S. electrodes in the presence of various concentrations of the compounds (C1–C4) were investigated in blank hydrochloric acid by EIS. Nyquist plots corresponding to the results are presented in Figure 6. The graphical analysis of Figure 6 disclosed that the Nyquist plots for all chromophores were in the shape of semicircles. Additionally, the shape of Nyquist plots did not change significantly at different concentrations of the chromophores. Both the facts suggested that corrosion as well as corrosion inhibition of steel in pure HCl could be described mainly as charge-transfer reactions. The shape of Nyquist plots also suggested that the chromophores inhibited the corrosion process by suppressing the charge transfer across the M.S.–HCl interface. However, it was true that Nyquist plots of the compounds at either concentrations could not appear as an exact semicircle, meaning that the steel–acid interface was covered with the inhibitor molecules and showed deviation from a perfect capacitor behavior. Uneven adsorption of chemical moieties on the metal surface could be a strong reason of distributed response current of M.S. electrodes, which appeared and often documented as the imperfect semicircle shape of Nyquist plots.29−31 Furthermore, the Nyquist plots of the compounds (C1–C4) exhibited that the changes in Rct of M.S electrodes were in perfect harmony with the concentrations of the compounds. This fact suggested that specific adsorption of the compounds on the steel surface was primarily responsible for the corrosion inhibition properties of the inhibitors. However, the increment in Rct became limited beyond 50 mg L–1 of each compound in the acid solution. As discussed above, the adsorption characteristics of the inhibitors could affect their corrosion inhibition ability. Accordingly, the corrosion resistance of the chromophores could be placed in the order: compound 1 > compound 2 > compound 4 > compound 3 (Figure 7). This order of corrosion inhibition was also validated by phase angle measurements. The phase angle for M.S. in blank acid was the lowest, which represented the highest degree of corrosion. However, addition of inhibitors in the acid solution caused an increase in the phase angle, which could be related to the improved capacitive behavior of the M.S. electrode in the presence of compounds (C1–C4) and corresponded to lesser damage of the electrode surface than that in the blank acid solution.32−34
Figure 6.

Nyquist plots for M.S. in 1 M HCl at room temperature with different concentrations of (a) compound 1, (b) compound 2 (c) compound 3, and (d) compound 4.
Figure 7.

(a) Bode impedance and (b) Bode phase plots for M.S. in 1 M HCl at room temperature with an effective concentration (50 mg L–1) of chromophores.
The inside details of M.S. corrosion were further probed through an equivalent electrochemical circuit, as shown in Figure 8. The term Rs in the circuit was used for electrolyte resistance. The impedance responses of the compounds evidenced single capacitive loops in Nyquist plots, meaning that corrosion of the inhibitor-modified steel surface was a charge-transfer process having one time constant (Bode phase plot). This single time constant was a projection of a single metal–acid interface, and it could be defined with a constant phase element (CPE) and Rct in parallel. In the circuit, CPE was used to mimic the capacitive behavior of the metal surface modified by the inhibitor/acid molecules.35−37 The mathematical equation for the total impedance Z of the circuit could be defined as
| 1 |
where ω is the frequency, α is a parameter related to the CPE behavior of the electrode surface, and Y is the CPE modulus. The equivalent capacitance (Ceq) of CPE was calculated using the equation38
| 2 |
Figure 8.

Equivalent electrical circuit for fitting of Nyquist plots.
All basic corrosion parameters, viz., Rs, Rct, α, Y, were obtained by fitting the Nyquist plots and listed in Table 1.
Table 1. Technical Parameters Deduced from Nyquist Plots of Mild Steel in 1 M HCl at Different Concentrations of Inhibitors at Room Temperature.
| inhibitors | concn (mg L–1) | Rs (Ω cm2) | Rct (Ω cm2) | α | Y (10–6 Ω–1 cm–2) | Ceq (μF cm–2) | % μRct | χ2 |
|---|---|---|---|---|---|---|---|---|
| blank | 1.42 | 26 | 0.750 | 372 | 79 | 2.78 × 10⁻³ | ||
| compound 1 | 10 | 1.95 | 140 | 0.754 | 188 | 57 | 81 | 1.81 × 10⁻³ |
| 20 | 1.23 | 167 | 0.774 | 155 | 53 | 84 | 2.28 × 10⁻³ | |
| 40 | 1.60 | 216 | 0.762 | 137 | 45 | 88 | 3.28 × 10⁻³ | |
| 50 | 1.53 | 356 | 0.786 | 103 | 41 | 93 | 2.38 × 10⁻³ | |
| compound 2 | 10 | 2.16 | 67 | 0.753 | 241 | 62 | 61 | 3.68 × 10⁻³ |
| 20 | 2.27 | 130 | 0.764 | 183 | 57 | 80 | 1.62 × 10⁻³ | |
| 40 | 1.46 | 154 | 0.778 | 148 | 50 | 83 | 1.26 × 10⁻³ | |
| 50 | 1.34 | 220 | 0.780 | 127 | 46 | 88 | 2.31 × 10⁻³ | |
| compound 3 | 10 | 1.5 | 43 | 0.756 | 273 | 65 | 40 | 1.49 × 10⁻⁴ |
| 20 | 1.46 | 70 | 0.761 | 220 | 59 | 63 | 1.90 × 10⁻³ | |
| 40 | 1.34 | 119 | 0.771 | 167 | 52 | 78 | 1.36 × 10⁻³ | |
| 50 | 1.23 | 145 | 0.773 | 151 | 49 | 82 | 1.51 × 10⁻³ | |
| compound 4 | 10 | 1.5 | 72 | 0.747 | 235 | 59 | 64 | 4.07 × 10⁻³ |
| 20 | 1.28 | 110 | 0.756 | 192 | 55 | 76 | 1.65 × 10⁻³ | |
| 40 | 1.29 | 132 | 0.768 | 160 | 52 | 80 | 2.25 × 10⁻³ | |
| 50 | 1.32 | 192 | 0.770 | 139 | 47 | 86 | 2.54 × 10⁻³ |
Analysis of data listed in Table 1 revealed that Rct of the M.S. electrode increased with the addition of the compounds in the solutions. This increase in Rct was found to be a function of inhibitor concentration; however, no valuable improvement in the corrosion behavior of M.S. was acknowledged beyond 50 mg L–1 of all compounds. Such a concentration-dependant increase in resistance values indicated that the compounds were self-assembled at the steel–electrolyte interface and thus produced a barricade effect to stop further corrosion of M.S. This statement could be connected with the fall in capacitance values of the M.S. surface in hydrochloric acid in the presence of inhibitors. The drop in equivalent capacitance (Ceq) was consistent with the quantity of the compounds. The lowering of Ceq with inhibitor concentration could be justified either by reduction in the charge storage ability or thickening of the protective film.39−42 The reduction in the charge storage ability of the M.S.–inhibitor–HCl system with reference to the M.S.–HCl system could occur because of the exchange of adsorbate (H2O) with the compounds, which led to diminution of the overall dielectric constant of the system. Further lowering of the dielectric constant as per the quantity of the compounds in HCl solutions could be a result of the expansion of the inhibitor layer (thickness wise). The fall in Ceq could also portray that the surface quality (density) of the interfacial film of the compounds improved with the concentration, which resulted in the reduction of the total surface area. Thus, Rct, Ceq, and α value suggested that the compounds tested in this study substantially impeded the corrosion loss of steel in HCl.
The Nyquist plots explained that molecular attachment of the compounds with the M.S. surface manifested in different EIS parameters, viz., Rct, Ceq, α, and μRct. However, there was no parameter revealing the adsorption behavior of the inhibitors. Hence, isotherm models were employed to establish a relation between adsorption of the inhibitors and the corrosion inhibition efficiency. Different isotherms were tested to fit the EIS results; however, the best fitting results were achieved with the Langmuir isotherm model. The slopes and linear regression coefficient of the fitting lines were close to one (Figure 9), which validated the selection of the Langmuir isotherm to expound the accumulation process of the compounds at the M.S.–HCl interface.
Figure 9.

Langmuir isotherm fitting results obtained from EIS for M.S. in 1 M HCl with compound 1, compound 2, compound 3, and compound 4 at room temperature.
The adsorption coefficients Kads were obtained from the Langmuir fitting curves and used to quantify the free-energy change ΔG° at the experimental temperature (T = 298 ± 2 K) according to the equation as given below43,44
| 3 |
where Csolvent denotes the water concentration in the tested solution (1 × 10³ g L–1) and R corresponds to the gas constant (8.314 J K–1 mol–1). The ΔG° values (kJ mol–1) for the compounds (C1–C4) were found as −32.06, −30.31, −27.73, and −30.20, respectively, which indicated that both types of adsorptions (electrostatic and chemical) were partially effective in the attachment of the compounds with the metal surface.45−47 This fact suggested that there is a possibility of chemical bonding between the M.S. and inhibitor molecules that were first physically adsorbed on the electrode. Hence, the free-energy change existed above −20 kJ mol–1 (upper limit of physical adsorption) and below −40 kJ mol–1 (lower limit of chemical adsorption). Furthermore, the Kads value of compound 1 suggested that the molecular adsorption of compound 1 was much greater than others, which was the clear reason of the highest inhibition potential of compound 1 that resulted from a greater coverage of the M.S. surface.
2.2.3. Tafel Region Polarization Behavior of the Electrodes
Different concentrations of the compounds were added in hydrochloric acid, and quantity-based changes in cathodic as well as the anodic polarization behavior of the M.S. electrode were investigated in the Tafel region (Figure 10). Analysis of Figure 10 projected the fact that addition of the inhibitors in acid solutions affected both cathodic and anodic polarization curves. In addition, equilibrium of the electrodes was disturbed and the corresponding corrosion potential (Ecorr) advanced in the cathodic region with respect to the pure acid solution. Together, these facts suggested that the compounds restricted both corrosion reactions eventuating at cathodic and anodic sites of the M.S. surface; however, they did more effective inhibition of cathodic reactions of M.S. corrosion.27,28,48 Further investigation of the Tafel curves predicted that the intersection point of the curves shifted toward a lower corrosion current with respect to the blank acid solution, which symbolized reduction in M.S. corrosion loss in HCl solutions.
Figure 10.

Tafel polarization curves for M.S. in 1 M HCl at room temperature with different concentrations of (a) compound 1, (b) compound 2 (c) compound 3, and (d) compound 4.
Corrosion inhibition properties of the compounds were quantified by estimating the kinetic corrosion standards, such as Icorr as current per cm2 at the equilibrium conditions, Ecorr, and slopes of polarization curves in the Tafel region (ba, anodic; bc, cathodic), by fitting the polarization curves with CHI 7041C software (CH Instruments, USA). The parameters are listed in Table 2. A close observation of the changes in Ecorr values revealed that addition of the compounds in HCl solutions modified the M.S. electrode surface, which were manifested through shifting of the corrosion potentials. The Ecorr values of the inhibited electrodes were more negative with respect to that of the uninhibited electrode. However, the maximum changes in Ecorr values for compounds 1, 2, 3, and 4 were acknowledged as 43, 34, 32, and 29 mV respectively, whereas the changes at the maximum inhibitor concentration were reported as 27, 24, 27, and 29 mV, respectively. In any case, the shifts in Ecorr values were not greater than 85 mV. This fact announced that the compounds were mixed-type inhibitors.49,50
Table 2. Technical Parameters Deduced from Tafel Polarization Curves of Mild Steel in 1 M HCl at Different Concentrations of Inhibitors at Room Temperature.
| inhibitors | concn (mg L–1) | –Ecorr (mV vs Ag/AgCl) | Icorr (μA cm–2) | ba (mV dec–1) | –bc (mV dec–1) | %μp | RP | % μPR |
|---|---|---|---|---|---|---|---|---|
| blank | 404 | 1386 | 130 | 227 | 30 | |||
| compound 1 | 10 | 447 | 249 | 106 | 190 | 82 | 153 | 80 |
| 20 | 430 | 194 | 84 | 186 | 86 | 187 | 84 | |
| 40 | 436 | 139 | 77 | 185 | 90 | 215 | 86 | |
| 50 | 431 | 51 | 67 | 178 | 96 | 376 | 92 | |
| compound 2 | 10 | 421 | 430 | 96 | 162 | 69 | 83 | 64 |
| 20 | 437 | 277 | 81 | 157 | 80 | 139 | 78 | |
| 40 | 426 | 222 | 75 | 163 | 84 | 183 | 84 | |
| 50 | 438 | 121 | 76 | 162 | 91 | 239 | 87 | |
| compound 3 | 10 | 413 | 623 | 105 | 154 | 55 | 62 | 52 |
| 20 | 423 | 500 | 89 | 162 | 64 | 78 | 62 | |
| 40 | 436 | 332 | 82 | 163 | 76 | 141 | 79 | |
| 50 | 431 | 236 | 78 | 157 | 83 | 168 | 82 | |
| compound 4 | 10 | 424 | 471 | 109 | 179 | 66 | 74 | 59 |
| 20 | 431 | 332 | 81 | 168 | 76 | 102 | 71 | |
| 40 | 428 | 264 | 82 | 172 | 81 | 129 | 77 | |
| 50 | 433 | 166 | 81 | 177 | 88 | 173 | 83 |
Further analysis of Table 2 clarified that the existence of the compounds in HCl solutions materially decayed Icorr values of M.S. electrodes in accord with the quantity of the inhibitors. However, the decrease in Icorr became stable at 50 mg L–1 of inhibitors in HCl. The compounds could be ordered as per the corrosion current values at the highest concentration of inhibitors: C1 < C2 < C4 < C3. As the corrosion currents could be considered as corrosion rates for comparison purpose, it was obvious that the highest corrosion protection was acknowledged with compound 1 followed by compound 2, compound 4, and compound 3. Furthermore, the linear polarization resistance values RP were found to be increased with the inhibitor concentration in blank acid solutions. The greatest increase in RP was recognized for compound 1. The order of inhibition efficiencies of the compounds according to RP values was same as obtained for the corrosion current densities. An increase in the RP value suggested that the modified M.S. was generating lesser current in the environments of the compounds rather than in the pure acid medium. In other words, it could be stated that the resistance of the electrode against polarization (nonequilibrium conditions) was enhanced in the inhibited solutions. The additional increase in the polarization resistance with the increase in inhibitor concentrations eventuated because of greater adsorption of the compounds on the M.S.–HCl interface, which effectively masked the active corrosion zones on the electrode surface.51,52 Thus, the compounds suppressed the electrochemical reactivity of the surface and provided immunity to M.S. from corrosion in HCl.
To extract information about kinetic adsorption characteristics of the compounds, data of polarization curves were fitted by the Langmuir isotherm. This was done already for EIS data, but the purpose to perform this study again here was to check the uniformity of information obtained from the two experimental techniques working on different phenomena. It was projected through the slopes and linear regression coefficients (R) of the fitting lines that the Langmuir isotherm was good in the prediction of the adsorption characteristic of the compounds as both were close to 1 (Figure 11). The Kads values (L g–1) for the compounds followed the same order as obtained for EIS data. This fact reconfirmed that molecules of compound 1 were more successfully adsorbed on the electrode surface than the other compounds discussed in this work. The ΔG° values (kJ mol–1) for the compounds (C1–C4) were obtained as −31.87, −30.63, −28.90, and −30.34, respectively. This meant that molecular adsorption of the compounds over the M.S. electrode eventuated because of physicochemical interactions, which emulated the same information obtained by isotherm study based on impedance values.45−47
Figure 11.

Langmuir isotherm fitting curves obtained from polarization curves for M.S. in 1 M HCl with compound 1, compound 2, compound 3, and compound 4 at room temperature.
On the basis of the results of polarization curves and linear polarization resistance study, it was claimed that the inhibitors adsorbed exclusively on dynamic cathodic and anodic sites of the M.S. electrode, which prevented the M.S. surface from wild HCl attack. A quantitative enhancement in proficiency of the compounds in restriction of M.S. loss was spotted, which could occur because of widening/thickening of the molecular layer of the compounds formed at the M.S.–HCl interface.
2.3. Surface Analysis
Figure 12a disclosed that there were some scratches on the polished M.S. surface, which could be the result of manual polishing of the samples. However, no crack was visualized on the surface. Conversely, the surface became extremely rough and small corrosion pits appeared on the surface as a result of intense corrosion reactions in HCl. The surface morphologies in the presence of inhibitors (Figure 12c–f) revealed that inhibitors significantly retarded the effect of HCl on the M.S. surface by averting the growth of corrosion pits. Few scratches, similar to that in Figure 12a, surfaced in inhibited samples, which evidenced the effectiveness of the inhibitors indirectly. However, surfaces of the samples were not as smooth as polished M.S. surface, which indicated a partial damage of the M.S. electrode in HCl.
Figure 12.

Morphology of the M.S. surface: (a) polished; (b) corroded in 1 M HCl; and inhibited by (c) compound 1, (d) compound 2, (e) compound 3, and (f) compound 4 at room temperature.
2.4. Fluorescence Surface Imaging
As per the report,16 the compounds also show fluorescence in liquid as well as in solid phase. Hence, fluorescence properties of the compounds were probed to know the M.S.–compound surface interactions. Fluorescence (Figure 13) and corresponding optical images (Figure S1, Supporting Information) were collected after 3 h immersion in HCl by a Dewinter Fluorex LED, similar to SEM analysis. A black image shown in Figure 13a indicated that there were no fluorescence particles on the corroded M.S. surface, which was obliviously expected. Figure 13b–e disclosed that compounds were adsorbed on the surface and emitted different colors because of their different fluorescence properties.16 Thus, it was projected by Figures 13 and S1 that M.S.–compound interactions were taking place in the acid and averting the surface from being corroded.
Figure 13.

Fluorescence surface imaging of the M.S. surface: (a) corroded in 1 M HCl and inhibited by (b) compound 1, (c) compound 2, (d) compound 3, and (e) compound 4 at room temperature.
2.5. Electrochemical and Theoretical Approach toward Corrosion Inhibition
The electrochemical techniques used in this study disclosed that interfacial adsorption of the compounds was the major cause behind retarded demolition of M.S. in hydrochloric acid. The quantitative assessment of atomistic level adsorption (based on ΔG° values) suggested that the compounds could attach themselves with the metal via electrostatic attraction as well as chemical bonding. However, the exact way of adsorption could not be predicted for mixed-type adsorptions without taking the amount of aggregate charge (Eagr) experienced by the metal in the acid and highest occupied molecular orbital (HOMO)–lowest unoccupied molecular orbital (LUMO) energies of inhibitor molecules into consideration. Hence, first Eagr was determined by subtraction of the metal potential at the zero charge condition (Eq0) from the corresponding Ecorr, as described in the literature.53 The Eq0 of a bare M.S. electrode was reported as −485 mV versus Ag/AgCl in 1 M HCl (−530 mV vs saturated calomel electrode).54 On the basis of this information, it was easy to disclose that the M.S. surface always carried positive charges in each case (Table 2). This fact suggested that although protonated inhibitor molecules could not initiate sharing of electrons with the electrically charged metal (+), electrovalent bond formation could occur between the two because of the chloride ion-modified M.S. surface.55,56 Chloride ions could attract protonated inhibitor molecules toward the metal surface, which promoted electrostatic coupling between the metal and inhibitor molecules. Thus, a protective layer originated at the M.S.–HCl interface and retarded further loss of M.S. in hydrochloric acid solution.
For an explanation of the electronic interactions occurring between the metal and inhibitor molecules, the HOMO and LUMO energies of the molecules were estimated by UV–visible and CV measurements. HOMO energy of molecules could be determined from onset of the first oxidation peak in the CV curve by the following relationship: EHOMO = −(Eox + 4.4) eV.57,58 Subsequently, ELUMO energies of the molecules were obtained by deducing the optical band gap of the compounds (corresponding to cutoff wavelength) from EHOMO energies. Accordingly, both orbital energies of the molecules (EHOMO and ELUMO) were determined and listed in Table 3. However, the standard EHOMO and ELUMO energies of an iron atom were adapted from the literature and used for the interpretation.59
Table 3. HOMO and LUMO Energies of the Compounds Calculated from CV and UV–Visible Measurements.
| inhibitors | EHomo (eV) | ELumo (eV) | ELH1 (eV) | ELH2 (eV) |
|---|---|---|---|---|
| compound 1 | –5.407 | –2.967 | 2.108 | 3.660 |
| compound 2 | –5.460 | –2.877 | 2.198 | 3.713 |
| compound 3 | –5.530 | –2.874 | 2.200 | 3.783 |
| compound 4 | –5.430 | –2.797 | 2.277 | 3.683 |
| iron | –5.075 | –1.747 |
To know the direction of initial interactions between metal atoms and inhibitor molecules, the differences in the LUMO energy of inhibitors and HOMO energy of an iron atom (ELH1) and vice versa (ELH2) were determined and listed in Table 3. The values of ELH1 were lower than that of ELH2 for all compounds, which meant that the reactions represented by ELH1 were having a stronger tendency to occur than the reactions represented by ELH2.60,61 In other words, the inhibitor molecules could accept electrons from iron atoms during initial interactions, which could lead to the bond formation. Later on, some additional interactions between the compounds and iron could also take place because of sharing of the electrons donated by inhibitor molecules. This could occur because of the fast protonation of the donor groups attached to the compounds in 1 M HCl (Figure 14).
Figure 14.

Chemical structure of the compounds.
To enrich the information
about the metal–inhibitor interactions,
the quantum chemical parameters were obtained by Koopmans’
theorem62 and listed in Table 4. According to the theorem,
the electron affinity (A) and ionization potential
(I) were, respectively, equivalent to −ELUMO and −EHOMO. On the basis of A and I, the chemical properties of the compounds,
such as electronegativity χ  , hardness η
  , and softness σ (=1/η) were
evaluated and listed in Table 4.
, and softness σ (=1/η) were
evaluated and listed in Table 4.
Table 4. Quantum Chemical Parameters for the Compounds Calculated with the EHOMO and ELUMO Values.
| compounds | I (eV) | A (eV) | ΔE (eV) | η (eV) | σ (eV–1) | χ (eV) |
|---|---|---|---|---|---|---|
| 1 | 5.407 | 2.967 | 2.440 | 1.220 | 0.8196 | 4.187 |
| 2 | 5.460 | 2.877 | 2.583 | 1.291 | 0.7742 | 4.168 |
| 3 | 5.530 | 2.874 | 2.656 | 1.328 | 0.7530 | 4.202 |
| 4 | 5.430 | 2.797 | 2.633 | 1.316 | 0.7590 | 4.113 |
It has been reported earlier that the band gap (ΔE = ELUMO – EHOMO) of a compound has a direct relationship with the corrosion inhibition efficiency. A low ΔE corresponds to high inhibition efficiency and vice versa is also true. Also, it is reported that low hardness, great softness, and high electronegativity of the molecules lead to high inhibition efficiency.63−65 Analysis of Table 4 disclosed the order of the compounds as per ΔE values as: C1 < C2 < C4 < C3, which indicated that the compound 1 was the most chemically active molecule among others. Also, Table 3 disclosed that both ELH1 and ELH2 of compound 1 were minimum among the investigated compounds, which suggested that electron-donating and electron-accepting ability of compound 1 was the highest among all studied compounds. This fact could be correlated with the higher adsorption rate of the molecules of compound 1 (higher σ and lower η values than others) over the M.S. surface and accordingly also with the lower corrosion rate. The order established by ΔE values and quantum chemical parameters was the same as the order of the compounds reported by the electrochemical measurements, which authenticated the explanation of corrosion activity of the compounds based on frontier orbital energies of the compounds.
Thus, it could be stated based on the free energy (ΔG°), Eagr, and HOMO–LUMO energies of the compounds that inhibitor molecules adsorbed at the M.S.–HCl interface through physicochemical adsorptions. After being adsorbed, the compounds produced a barricade effect for chloride ions via covering the exposed area, which curbed the rate of M.S. loss in HCl.
3. Conclusions
The behavior of the M.S.–HCl interface was researched in the domains of d−π–a-type four organic compounds (C1–C4). The structural characterization techniques, viz., XRD, UV–visible, and FTIR spectroscopy, disclosed that the compounds were crystalline in nature and rich sources of electroactive molecules. The electroactivity of the compounds could be recognized in CV curves. The polarization curves revealed that all compounds acted on both corrosion reactions and lowered corrosion current densities as to HCl alone, which were the manifested signs of corrosion inhibition. However, the Tafel curves disclosed that inhibitors blocked the reduction of moieties at the M.S.–HCl interface in a more effective manner than metal ionization. This fact was well-supported by the relative shifting of OCP and Ecorr of the inhibited M.S. electrodes to the potentials negative to bare M.S. electrode. The impedance behavior of M.S. suggested that corrosion inhibition was acknowledged because the M.S.–HCl interface was protected by a layer of the compounds. The resistance of this layer was comparatively higher than the oxide layer developed in the blank acid solution, which corresponded to a less corroded M.S. surface. Low capacitances of the protective layers also manifested the same fact, that is, retarded oxidation (corrosion). The prime reason for inhibition was molecular adsorption of compounds over the steel electrode, which could be justified with the Langmuir model and fluorescence surface imaging. The adsorption involved both physical and chemical interactions, as revealed by ΔG° values. The HOMO–LUMO energies of the compounds disclosed that a chemical bond between metal atoms and inhibitor molecules could form because of the donation and back-donation of electrons. On the basis of corrosion inhibition ability, the compounds could be arranged as: C1 > C2 > C4 > C3, which portrayed that the corrosion inhibition efficiency of the compounds was also dependent on their crystal symmetry.
4. Materials and Experimental Techniques
4.1. Inhibitor Preparation
4.1.1. Materials Used in Synthesis
The base compound for the synthesis of all inhibitors, that is, 4-N,N-dimethylaminobenzaldehyde, was purchased from Avra Chemical Private Limited. Prior to use, the as-obtained compound was recrystallized using methanol. The other materials, viz., ethyl cyanoacetate (a), methyl cyanoacetate (b), malononitrile (c), nitromethane (d), and ammonium acetate (e), were obtained from Spectrochem Pvt Ltd (a and b) and S D Fine-Chem Ltd (c–e). All chemicals (a–e) and 1,8-diazabicyclo[5.4.0]undec-7-ene (DBU) of Sigma-Aldrich USA were consumed in the synthesis as supplied without any further treatment. All solvents used in the synthesis process were distilled prior to use.
4.1.2. Synthesis Procedures
The synthesis of chromophores (inhibitors) was executed as per the method described in the literature.66 The synthesis and the structural confirmation of the synthesized compounds have been earlier reported by Gupta and Singh.16 However, we used newly synthesized compounds for corrosion inhibition studies.
4.1.2.1. Compound 1
First, a solution was prepared by mixing 24 mmol (1.85 g) ammonium acetate and 60 mmol (3.25 mL) nitromethane in 12 mL of acetic acid. In this solution, 10 mmol (1.49 g) 4-N,N-dimethylaminobenzaldehyde was slowly transferred. Then, the solution was refluxed for 25 min. Thus, the prepared solution was dispensed into a beaker containing water at ice temperature. As a resultant, precipitation of a red color compound occurred. After filtering, the compound was washed thrice with double-distilled water and dried completely. At the end, recrystallization of the dried compound was completed in ethanol, and thus, the obtained compound was used as a corrosion inhibitor. The yield of the process was 86%.
4.1.2.2. Compound 2
First, 10 mmol (1.49 g) 4-N,N-dimethylaminobenzaldehyde and 10 mmol (0.66 g) malononitrile were weighed and mixed. In this mixture, 0.15 mL (1 mmol) of DBU was transferred. The resultant mixture was ground manually in a mortar with a pastel for 5 min. Afterward, ice cold water was used to treat the mixture. At the end, the final product of the process was obtained by filtering the mixture along with drying the solid compound. Thus, the obtained compound was in crude form and hence recrystallized in an ethanol–acetone mixture to obtain pure a compound. The yield of the total process was 96%.
A synthesis process similar to that of compound 2 was adapted for the synthesis of compound 3 and compound 4. Only, the changes were done in the grinding time (60 s), and instead of malononitrile, ethyl cyanoacetate (1.06 mL) and methyl cyanoacetate (0.88 mL) were used in the synthesis of compound 3 (yield—90%) and compound 4 (yield—91%) respectively.
4.1.3. Inhibitors
The chromophores were not easily soluble in water. Hence, we dissolved 10 mg powder of chromophores in 1 mL of acetone and soaked this mixture in distilled water. Thus, stock solutions of the chromophores were prepared. The required amounts of the inhibitors were taken from the stock solutions and directly added in the acid solutions for corrosion inhibition studies at different concentrations of inhibitors.
4.2. Characterization of Inhibitors
4.2.1. XRD Measurements
A PANalytical X-ray diffractometer, Cu (Kα, 1.5408 Å), was employed to record the diffraction patterns of the chromophores (powder). The 2θ range of the investigation was 10–90°, and the scanning rate was kept at 3°/min.
4.2.2. UV–Visible and FTIR Spectroscopy
The powders of the chromophores were manually mixed with potassium bromide powder in a mortar with a pestle for 10 min. The palettes of the prepared mixture were made with the help of a small hydraulic press. Thus, the prepared palettes were investigated by a Thermo scientific FTIR spectrometer (Nicolet 6700) for the presence of functional groups. The transmittance mode of the instrument was used to scan the palettes in the FTIR spectral zone of 400–4000 cm–1. Thus, the spectra of the chromophores were obtained and analyzed by matching the different peaks of the spectra with the characteristic peaks of the known functional groups.
The optical characteristics of the chromophores were inspected by a UV–vis spectrometer of PerkinElmer (Lambda 25) in the UV–vis spectral zone of 200–900 nm. For this test, 25 μL of inhibitors were taken from their respective stock solutions and dissolved in 3 mL of double-distilled water. Thus, the obtained solutions were tested by the UV–vis spectrometer.
4.3. Test Specimen and Solution
The strips (0.1 cm thickness) having surface dimensions of 5 cm × 1 cm were cut from a M.S. plate of 15 cm × 10 cm area. First, the M.S. strips were scraped by a Sianor b emery paper (made in Switzerland) of grade 1/0 for 5 min. Afterward, the strips were grinded with the emery papers of grade 2/0, 3/0, 4/0, and 5/0 for 5 min each. The final abrading of the strips was done with a grade 6/0 emery paper for 10 min for a smooth surface finish of the strips. Afterward, the strips surfaces were degreased with acetone (AR Grade), wiped with a tissue paper, washed with double-distilled water, and dried at room temperature. Thus, the treated M.S. strips were masked (open area—1 cm2) and employed for the corrosion experiments. For surface study, M.S. strips of 1 cm2 area were used. The compositional detail of M.S. strips according to weight percentage could be given as: C-0.15, Si-0.18, Mn-0.030, S-0.024, P-0.03, and balance Fe. The corrosive agent used for this study was AR Grade HCl. The stock solution of hydrochloric acid (18 M) was diluted with an appropriate amount of double-distilled water to prepare the test solution (1 M HCl) for corrosion experiments.
4.4. Electrochemical Measurements
Both Tafel polarization curve test and EIS experiments were executed in a three-neck glass cell at room temperature (25 ± 2 °C) and controlled by an electrochemical workstation CHI 7041C, CH instruments, USA. The description of the electrodes used is as follows: an Ag/AgCl tubular electrode (Metrohm, Switzerland) as the reference electrode; a platinum tubular electrode (Metrohm, Switzerland) as the counter electrode, and the test samples as working electrodes. OCPs of the electrochemical systems were monitored; and the experiments were executed in almost stable (less varying) OCP conditions after 10 min immersion of electrodes in solutions.
In EIS experiments, the single sine perturbation wave of 5 mV amplitude was applied to the working electrodes at different frequencies ranging from 100 000 to 0.01 Hz. The resultant impedance curves (Nyquist plots) were fit by ZSim3.20 software and the technical parameters were extracted. Inhibition efficiencies (μRct) were obtained using charge-transfer resistance (Rct) values at each inhibitor concentration by the following equation67
| 4 |
where Rcto and Rct indicates the charge-transfer resistance of the M.S. electrode in HCl for corroded and inhibited samples.
Polarization behavior of the M.S. electrode in pure HCl and in the presence of inhibitors were studied by varying the potential from cathodic to anodic direction in the region of OCP ± 250 mV (against Ag/AgCl reference electrode) at a rate of 30 mV/min. The polarization curves were fitted by CHI 7041C software. The other corrosion parameters of polarization, that is, current densities (Icorr), equilibrium potentials (Ecorr), and linear polarization resistances (RP) were extracted from the curves. Polarization inhibition efficiencies (μP) as well as linear polarization inhibition efficiencies (μPR) were calculated by the following equations68
| 5 |
where Icorro and Icorr are the corrosion current densities in blank acid solutions and inhibited solutions, respectively.
| 6 |
where RPi and RP denote polarization resistances in inhibited and blank acid solutions, respectively.
To probe the electrochemical behavior of the compounds, the current–voltage characteristics of the chromophores were tested by CV experiments. The details are as follows: supporting electrolyte, 5 mL of 0.1 M tetraethylammonium tetrafluoroborate in dichloromethane & acetonitrile (1:1 by volume); working electrode, platinum; counter electrode, platinum foil; and reference electrode, Ag/AgCl. For the experiments, stock solutions of the chromophores were prepared by dissolving 1 mg of each in 200 μL of dichloromethane. An amount equal to 20 μL of thus-prepared stock solutions was employed for CV experiments.
4.5. SEM Measurements
The effects of chromophores on M.S. corrosion were investigated via surface morphology changes, captured by a SUPRA 40 scanning electron microscope of Carl Zesis, Germany. For SEM analysis, the prepared M.S. strips (section 2.3) were dipped in blank 1 M HCl and in acid media containing optimum concentrations of the chromophores for 3 h. Afterward, the immersed M.S strips were pulled out, washed under a fine stream of distilled water, and dried with a tissue paper followed by placing it in a hot oven at 35 °C for 5 min. Thus, the arranged samples were examined for surface changes.
Acknowledgments
G.J. acknowledges Preeti Tiwari (SMST, IIT BHU Varanasi) for her kind assistance during this work. V.K.G. appreciates UGC (New Delhi) for providing BSR fellowship.
Supporting Information Available
The Supporting Information is available free of charge on the ACS Publications website at DOI: 10.1021/acsomega.8b00083.
Figure S1, optical images corresponding to fluorescence images shown in Figure 13; and Scheme S1, EHOMO and ELUMO calculation for the compounds (PDF)
The authors declare no competing financial interest.
Supplementary Material
References
- Ellayyachy M.; El Idrissi A.; Hammouti B. New thio-compounds as corrosion inhibitor for steel in 1M HCl. Corros. Sci. 2006, 48, 2470–2479. 10.1016/j.corsci.2005.09.016. [DOI] [Google Scholar]
- Shukla S. K.; Quraishi M. A.; Prakash R. A self-doped conducting polymer “Polyanthranilic acid”: An efficient corrosion inhibitor for mild steel in acidic solution. Corros. Sci. 2008, 50, 2867–2872. 10.1016/j.corsci.2008.07.025. [DOI] [Google Scholar]
- Lashgari M.; Malek A. M. Fundamental studies of aluminum corrosion in acidic and basic environments: Theoretical predictions and experimental observations. Electrochim. Acta 2010, 55, 5253–5257. 10.1016/j.electacta.2010.04.054. [DOI] [Google Scholar]
- Barouni K.; Bazzi L.; Salghi R.; Mihit M.; Hammouti B.; Albourine A.; El Issami S. Some amino acids as corrosion inhibitors for copper in nitric acid solution. Mater. Lett. 2008, 62, 3325–3327. 10.1016/j.matlet.2008.02.068. [DOI] [Google Scholar]
- Herrag L.; Hammouti B.; Elkadiri S.; Aouniti A.; Jama C.; Vezin H.; Bentiss F. Adsorption properties and inhibition of mild steel corrosion in hydrochloric solution by some newly synthesized diamine derivatives: experimental and theoretical investigations. Corros. Sci. 2010, 52, 3042–3057. 10.1016/j.corsci.2010.05.024. [DOI] [Google Scholar]
- Bentiss F.; Traisnel M.; Lagrenee M. The substituted 1,3,4-oxadiazoles: a new class of corrosion inhibitors of mild steel in acidic media. Corros. Sci. 2000, 42, 127–146. 10.1016/s0010-938x(99)00049-9. [DOI] [Google Scholar]
- Ouchrif A.; Zegmout M.; Hammouti B.; Dafali A.; Benkaddour M.; Ramdani A.; Elkadiri S. New synthesized diamine derivatives as corrosion inhibitors of steel in 0.5 M H2SO4. Prog. Org. Coat. 2005, 53, 292–296. 10.1016/j.porgcoat.2005.02.010. [DOI] [Google Scholar]
- Singh A. K.; Quraishi M. A. Effect of Cefazolin on the corrosion of mild steel in HCl solution. Corros. Sci. 2010, 52, 152–160. 10.1016/j.corsci.2009.08.050. [DOI] [Google Scholar]
- Kumar S. H.; Karthikeyan S. Torsemide and Furosemide as Green Inhibitors for the Corrosion of Mild Steel in Hydrochloric Acid Medium. Ind. Eng. Chem. Res. 2013, 52, 7457–7469. 10.1021/ie400815w. [DOI] [Google Scholar]
- Gece G. Drugs: A review of promising novel corrosion inhibitors. Corros. Sci. 2011, 53, 3873–3898. 10.1016/j.corsci.2011.08.006. [DOI] [Google Scholar]
- Obot I. B.; Obi-Egbedi N. O.; Umoren S. A. Antifungal drugs as corrosion inhibitors for aluminium in 0.1 M HCl. Corros. Sci. 2009, 51, 1868–1875. 10.1016/j.corsci.2009.05.017. [DOI] [Google Scholar]
- Matad P. B.; Mokshanatha P.; Hebbar N.; Venkatesha V. T.; Tandon H. C. Ketosulfone Drug as a Green Corrosion Inhibitor for Mild Steel in Acidic Medium. Ind. Eng. Chem. Res. 2014, 53, 8436–8444. 10.1021/ie500232g. [DOI] [Google Scholar]
- Ji G.; Anjum S.; Sundaram S.; Prakash R. Musa Paradisica Peel Extract as Green Corrosion Inhibitor for Mild Steel in HCl Solution. Corros. Sci. 2015, 90, 107–117. 10.1016/j.corsci.2014.10.002. [DOI] [Google Scholar]
- Ji G.; Dwivedi P.; Sundaram S.; Prakash R. Inhibitive effect of Chlorophytum borivilianum root Extract on mild steel corrosion in HCl and H2SO4 solutions. Ind. Eng. Chem. Res. 2013, 52, 10673–10681. 10.1021/ie4008387. [DOI] [Google Scholar]
- Singh A.; Lin Y.; Ebenso E. E.; Liu W.; Pan J.; Huang B. Gingko biloba fruit extract as an eco-friendly corrosion inhibitor for J55 steel in CO2 saturated 3.5% NaCl solution. J. Ind. Eng. Chem. 2015, 24, 219–228. 10.1016/j.jiec.2014.09.034. [DOI] [Google Scholar]
- Gupta V. K.; Singh R. K. An investigation on single crystal growth, structural, thermal and optical properties of a series of organic D−π–A push–pull materials. RSC Adv. 2015, 5, 38591–38600. 10.1039/c5ra04907e. [DOI] [Google Scholar]
- Gupta V. K.; Singh R. A. Aggregation-induced enhanced green light emission from a simple donor−π–acceptor (D−π–A) material: a structure–property relationship study. Faraday Discuss. 2017, 196, 131–142. 10.1039/c6fd00158k. [DOI] [PubMed] [Google Scholar]
- Roquet S.; Cravino A.; Leriche P.; Alévêque O.; Frère P.; Roncali J. Triphenylamine–Thienylenevinylene Hybrid Systems with Internal Charge Transfer as Donor Materials for Heterojunction Solar Cells. J. Am. Chem. Soc. 2006, 128, 3459–3466. 10.1021/ja058178e. [DOI] [PubMed] [Google Scholar]
- Carlotti B.; Spalletti A.; Šindler-Kulyk M.; Elisei F. Ultrafast photoinduced intramolecular charge transfer in push–pull distyryl furan and benzofuran: solvent and molecular structure effect. Phys. Chem. Chem. Phys. 2011, 13, 4519–4528. 10.1039/c0cp02337j. [DOI] [PubMed] [Google Scholar]
- Shen X. Y.; Yuan W. Z.; Liu Y.; Zhao Q.; Lu P.; Ma Y.; Williams I. D.; Qin A.; Sun J. Z.; Tang B. Z. Fumaronitrile-Based Fluorogen: Red to Near-Infrared Fluorescence, Aggregation-Induced Emission, Solvatochromism, and Twisted Intramolecular Charge Transfer. J. Phys. Chem. C 2012, 116, 10541–10547. 10.1021/jp303100a. [DOI] [Google Scholar]
- Ji G.; Dwivedi P.; Sundaram S.; Prakash R. Aqueous extract of Argemone mexicana roots for effective protection of mild steel in an HCl environment. Res. Chem. Intermed. 2016, 42, 439–459. 10.1007/s11164-015-2029-y. [DOI] [Google Scholar]
- Srivastava M.; Tiwari P.; Srivastava S. K.; Prakash R.; Ji G. Electrochemical Investigation of Irbesartan Drug Molecules as an Inhibitor of Mild Steel Corrosion in 1 M HCl and 0.5 M H2SO4 Solutions. J. Mol. Liq. 2017, 236, 184–197. 10.1016/j.molliq.2017.04.017. [DOI] [Google Scholar]
- Ji G.; Shukla S. K.; Dwivedi P.; Sundaram S.; Prakash R. Inhibitive effect of Argemone mexicana Plant Extract on acid corrosion of mild steel. Ind. Eng. Chem. Res. 2011, 50, 11954–11959. 10.1021/ie201450d. [DOI] [Google Scholar]
- Singh A. K. Inhibition of Mild Steel Corrosion in Hydrochloric Acid Solution by 3-(4-((Z)-Indolin-3-ylideneamino)phenylimino)indolin-2-one. Ind. Eng. Chem. Res. 2012, 51, 3215–3223. 10.1021/ie2020476. [DOI] [Google Scholar]
- Malina I.; Kampars V.; Turovska B.; Belyakov S. Novel green-yellow-orange-red light emitting donor-π-acceptor type dyes based on 1,3-indandione and dimedone moieties. Dyes Pigm. 2017, 139, 820–830. 10.1016/j.dyepig.2017.01.017. [DOI] [Google Scholar]
- Kothavale S.; Sekar N. Novel pyrazino-phenanthroline based rigid donor-π-acceptor compounds: A detail study of optical properties, acidochromism, solvatochromism and structure-property relationship. Dyes Pigm. 2017, 136, 31–45. 10.1016/j.dyepig.2016.08.032. [DOI] [Google Scholar]
- Pereira S. S. d. A. A.; Pêgas M. M.; Fernández T. L.; Magalhães M.; Schöntag T. G.; Lago D. C.; de Senna L. F.; D’Elia E. Inhibitory action of aqueous garlic peel extract on the corrosion of carbon steel in HCl solution. Corros. Sci. 2012, 65, 360–366. 10.1016/j.corsci.2012.08.038. [DOI] [Google Scholar]
- Satapathy A. K.; Gunasekaran G.; Sahoo S. C.; Amit K.; Rodrigues P. V. Corrosion inhibition by Justicia gendarussa plant extract in hydrochloric acid solution. Corros. Sci. 2009, 51, 2848–2856. 10.1016/j.corsci.2009.08.016. [DOI] [Google Scholar]
- Macdonald J. R. Impedance spectroscopy and its use in analyzing the steady-state AC response of solid and liquid electrolytes. J. Electroanal. Chem. Interfacial Electrochem. 1987, 223, 25–50. 10.1016/0022-0728(87)85249-x. [DOI] [Google Scholar]
- Lebrini M.; Lagrenée M.; Vezin H.; Traisnel M.; Bentiss F. Experimental and theoretical study for corrosion inhibition of mild steel in normal hydrochloric acid solution by some new macrocyclic polyether compounds. Corros. Sci. 2007, 49, 2254–2269. 10.1016/j.corsci.2006.10.029. [DOI] [Google Scholar]
- Rammelt U.; Reinhard G. The influence of surface roughness on the impedance data for iron electrodes in acid solutions. Corros. Sci. 1987, 27, 373–382. 10.1016/0010-938x(87)90079-5. [DOI] [Google Scholar]
- Oguzie E. E.; Adindu C. B.; Enenebeaku C. K.; Ogukwe C. E.; Chidiebere M. A.; Oguzie K. L. Natural Products for Materials Protection: Mechanism of Corrosion Inhibition of Mild Steel by Acid Extracts of Piper guineense. J. Phys. Chem. C 2012, 116, 13603–13615. 10.1021/jp300791s. [DOI] [Google Scholar]
- Chidiebere M. A.; Ogukwe C. E.; Oguzie K. L.; Eneh C. N.; Oguzie E. E. Corrosion Inhibition and Adsorption Behavior of Punica granatum Extract on Mild Steel in Acidic Environments: Experimental and Theoretical Studies. Ind. Eng. Chem. Res. 2012, 51, 668–677. 10.1021/ie201941f. [DOI] [Google Scholar]
- Krishnegowda P. M.; Venkatesha V. T.; Krishnegowda P. K. M.; Shivayogiraju S. B. Acalypha torta leaf extract as green corrosion inhibitor for mild steel in hydrochloric acid solution. Ind. Eng. Chem. Res. 2013, 52, 722–728. 10.1021/ie3018862. [DOI] [Google Scholar]
- Yadav M.; Kumar S.; Purkait T.; Olasunkanmi L. O.; Bahadur I.; Ebenso E. E. Electrochemical, thermodynamic and quantum chemical studies of synthesized benzimidazole derivatives as corrosion inhibitors for N80 steel in hydrochloric acid. J. Mol. Liq. 2016, 213, 122–138. 10.1016/j.molliq.2015.11.018. [DOI] [Google Scholar]
- Kartsonakis I. A.; Stanciu S. G.; Matei A. A.; Hristu R.; Karantonis A.; Charitidis C. A. A comparative study of corrosion inhibitors on hot-dip galvanized steel. Corros. Sci. 2016, 112, 289–307. 10.1016/j.corsci.2016.07.030. [DOI] [Google Scholar]
- Gowraraju N. D.; Jagadeesan S.; Ayyasamy K.; Olasunkanmi L. O.; Ebenso E. E.; Subramanian C. Adsorption characteristics of Iota-carrageenan and Inulin biopolymers as potential corrosion inhibitors at mild steel/sulphuric acid interface. J. Mol. Liq. 2017, 232, 9–19. 10.1016/j.molliq.2017.02.054. [DOI] [Google Scholar]
- Ateya B. G.; El-Anadouli B. E.; El-Nizamy F. M. The adsorption of thiourea on mild steel. Corros. Sci. 1984, 24, 509–515. 10.1016/0010-938x(84)90033-7. [DOI] [Google Scholar]
- Kumar S. H.; Karthikeyan S. Torsemide and Furosemide as Green Inhibitors for the Corrosion of Mild Steel in Hydrochloric Acid Medium. Ind. Eng. Chem. Res. 2013, 52, 7457–7469. 10.1021/ie400815w. [DOI] [Google Scholar]
- Yoo S.-H.; Kim Y.-W.; Chung K.; Kim N.-K.; Kim J.-S. Corrosion inhibition properties of triazine derivatives containing carboxylic acid and amine groups in 1.0 M HCl solution. Ind. Eng. Chem. Res. 2013, 52, 10880–10889. 10.1021/ie303092j. [DOI] [Google Scholar]
- Babić-Samardžija K.; Lupu C.; Hackerman N.; Barron A. R.; Luttge A. Inhibitive properties and surface morphology of a group of heterocyclic diazoles as inhibitors for acidic iron corrosion. Langmuir 2005, 21, 12187–12196. 10.1021/la051766l. [DOI] [PubMed] [Google Scholar]
- Umoren S. A.; Obot I. B.; Gasem Z. M. Adsorption and corrosion inhibition characteristics of strawberry fruit extract at steel/acids interfaces: experimental and theoretical approaches. Ionics 2015, 21, 1171–1186. 10.1007/s11581-014-1280-3. [DOI] [Google Scholar]
- Li X.; Deng S.; Fu H. Inhibition of the corrosion of steel in HCl, H2SO4 solutions by bamboo leaf extract. Corros. Sci. 2012, 62, 163–175. 10.1016/j.corsci.2012.05.008. [DOI] [Google Scholar]
- Fuchs-Godec R.; Doleček V. A effect of sodium dodecylsulfate on the corrosion of copper in sulphuric acid media. Colloids Surf., A 2004, 244, 73–76. 10.1016/j.colsurfa.2004.05.015. [DOI] [Google Scholar]
- Bentiss F.; Lebrini M.; Lagrenée M. Thermodynamic characterization of metal dissolution and inhibitor adsorption processes in mild steel/2,5-bis(n-thienyl)-1,3,4-thiadiazoles/hydrochloric acid system. Corros. Sci. 2005, 47, 2915–2931. 10.1016/j.corsci.2005.05.034. [DOI] [Google Scholar]
- Bentiss F.; Jama C.; Mernari B.; El Attari H.; El Kadi L.; Lebrini M.; Traisnel M.; Lagrenée M. Corrosion control of mild steel using 3,5-bis(4 methoxyphenyl)-4-amino-1,2,4-triazole in normal hydrochloric acid medium. Corros. Sci. 2009, 51, 1628–1635. 10.1016/j.corsci.2009.04.009. [DOI] [Google Scholar]
- Hu Z.; Meng Y.; Ma X.; Zhu H.; Li J.; Li C.; Cao D. Experimental and theoretical studies of benzothiazole derivatives as corrosion inhibitors for carbon steel in 1M HCl. Corros. Sci. 2016, 112, 563–575. 10.1016/j.corsci.2016.08.012. [DOI] [Google Scholar]
- Morad M. S. Inhibition of iron corrosion in acid solutions by Cefatrexyl: Behaviour near and at the corrosion potential. Corros. Sci. 2008, 50, 436–448. 10.1016/j.corsci.2007.08.018. [DOI] [Google Scholar]
- Li W.-h.; He Q.; Zhang S.-t.; Pei C.-l.; Hou B.-r. Some new triazole derivatives as inhibitors for mild steel corrosion in acidic medium. J. Appl. Electrochem. 2008, 38, 289–295. 10.1007/s10800-007-9437-7. [DOI] [Google Scholar]
- Ferreira E. S.; Giancomelli C.; Giacomelli F. C.; Spinelli A. Evaluation of the inhibitor effect of L-ascorbic acid on the corrosion of mild steel. Mater. Chem. Phys. 2004, 83, 129–134. 10.1016/j.matchemphys.2003.09.020. [DOI] [Google Scholar]
- Li X.; Deng S.; Fu H.; Xie X. Synergistic inhibition effects of bamboo leaf extract/major components and iodide ion on the corrosion of steel in H3PO4 solution. Corros. Sci. 2014, 78, 29–42. 10.1016/j.corsci.2013.08.025. [DOI] [Google Scholar]
- Oguzie E. E.; Adindu C. B.; Enenebeaku C. K.; Ogukwe C. E.; Chidiebere M. A.; Oguzie K. L. Natural Products for Materials Protection: Mechanism of Corrosion Inhibition of Mild Steel by Acid Extracts of Piper guineense. J. Phys. Chem. C 2012, 116, 13603–13615. 10.1021/jp300791s. [DOI] [Google Scholar]
- Lebrini M.; Lagrenée M.; Vezin H.; Gengembre L.; Bentiss F. Electrochemical and quantum chemical studies of new thiadiazole derivatives adsorption on mild steel in normal hydrochloric acid medium. Corros. Sci. 2005, 47, 485–505. 10.1016/j.corsci.2004.06.001. [DOI] [Google Scholar]
- Banerjee G.; Malhotra S. N. Contribution to adsorption of aromatic amines on mild steel surface from HCl solutions by impedance, UV, and Raman spectroscopy. Corrosion 1992, 48, 10–15. 10.5006/1.3315912. [DOI] [Google Scholar]
- Bockris J. O’. M.; yang B. The Mechanism of Corrosion Inhibition of Iron in Acid Solution by Acetylenic Alcohols. J. Electrochem. Soc. 1991, 135, 2237–2252. 10.1149/1.2085956. [DOI] [Google Scholar]
- Deng S.; Li X. Inhibition by Jasminum nudiflorum Lindl. leaves extract of the corrosion of aluminium in HCl solution. Corros. Sci. 2012, 64, 253–262. 10.1016/j.corsci.2012.07.017. [DOI] [Google Scholar]
- Bredas J. L.; Silbey R.; Boudreaux D. S.; Chance R. R. Chain-length dependence of electronic and electrochemical properties of conjugated systems: polyacetylene, polyphenylene, polythiophene and polypyrrole. J. Am. Chem. Soc. 1983, 105, 6555–6559. 10.1021/ja00360a004. [DOI] [Google Scholar]
- Shafiee A.; Salleh M. M.; Yahaya M. Determination of HOMO and LUMO of [6,6]-Phenyl C61-butyric Acid3-ethylthiophene Ester and Poly (3-octyl-thiophene-2, 5-diyl) through Voltametry Characterization. Sains Malays. 2011, 40, 173–176. [Google Scholar]
- Huang W.; Tan Y.; Chen B.; Dong J.; Wang X. The binding of antiwear additives to iron surfaces: quantum chemical calculations and tribological tests. Tribol. Int. 2003, 36, 163–168. 10.1016/s0301-679x(02)00130-5. [DOI] [Google Scholar]
- Mourya P.; Banerjee S.; Singh M. M. Corrosion inhibition of mild steel in acidic solution by Tagetes erecta (Marigold flower) extract as a green inhibitor. Corros. Sci. 2014, 85, 352–363. 10.1016/j.corsci.2014.04.036. [DOI] [Google Scholar]
- Mobin M.; Rizvi M. Polysaccharide from Plantago as a green corrosion inhibitor for carbon steel in 1 M HCl solution. Carbohydr. Polym. 2017, 160, 172–183. 10.1016/j.carbpol.2016.12.056. [DOI] [PubMed] [Google Scholar]
- Awad M. K.; Mustafa M. R.; Elnga M. M. A. Computational simulation of the molecular structure of some triazoles as inhibitors for the corrosion of metal surface. J. Mol. Struct.: THEOCHEM 2010, 959, 66–74. 10.1016/j.theochem.2010.08.008. [DOI] [Google Scholar]
- Hasanov R.; Bilge S.; Bilgiç S.; Gece G.; Kılıç Z. Experimental and theoretical calculations on corrosion inhibition of steel in 1M H2SO4 by crown type polyesters. Corros. Sci. 2010, 52, 984–990. 10.1016/j.corsci.2009.11.022. [DOI] [Google Scholar]
- Khalil N. Quantum chemical approach of corrosion inhibition. Electrochim. Acta 2003, 48, 2635–2640. 10.1016/s0013-4686(03)00307-4. [DOI] [Google Scholar]
- Obi-Egbedi N. O.; Obot I. B.; El-Khaiary M. I. Quantum chemical investigation and statistical analysis of the relationship between corrosion inhibition efficiency and molecular structure of xanthene and its derivatives on mild steel in sulphuric acid. J. Mol. Struct. 2011, 1002, 86–96. 10.1016/j.molstruc.2011.07.003. [DOI] [Google Scholar]
- a Meredith P.; Atkinson S. Synthesis of Acetoxy Stabilised Indolequinones as Precursors to Model Eumelanin Polymers. Synlett 2003, 1853–1855. 10.1055/s-2003-41409. [DOI] [Google Scholar]; b Ware M.; Madje B.; Pokalwar R. K.; Kakade G.; Shingare M. DBU: An efficient catalyst for Knoevenagel condensation under solvent-free condition. Bull. Catal. Soc. India 2007, 6, 104–106. [Google Scholar]
- Umoren S. A.; Gasem Z. M.; Obot I. B. Natural Products for Material Protection: Inhibition of Mild Steel Corrosion by Date Palm Seed Extracts in Acidic Media. Ind. Eng. Chem. Res. 2013, 52, 14855–14865. 10.1021/ie401737u. [DOI] [Google Scholar]
- Banerjee S.; Srivastava V.; Singh M. M. Chemically modified natural polysaccharide as green corrosion inhibitor for mild steel in acidic medium. Corros. Sci. 2012, 59, 35–41. 10.1016/j.corsci.2012.02.009. [DOI] [Google Scholar]
Associated Data
This section collects any data citations, data availability statements, or supplementary materials included in this article.