

Abstract
The binding site of the macrolides laulimalide and peloruside A, which is different from that of the clinically useful drugs paclitaxel/taxol and ixabepilone (tax site), is known to be between two adjacent β-tubulin units (ext site). Here, we report our study of the binding of these molecules to an α1β1/α2β2-tubulin “tetramer” model. AutoDock 4.2.6//AutoDock Vina dockings predicted that the affinities of laulimalide and peloruside A for the tax site are quite similar to those for the ext site. However, molecular dynamics (MD) simulations indicated that only when these two ligands are located at the ext site, there are contacts that help stabilize the system, favoring the β1/β2 interactions. The binding affinity of laulimalide for this site is stronger than that of peloruside A, but this is compensated for by additional β1/β2 contacts that are induced by peloruside A. MD studies also suggested that epothilones at the tax site and either laulimalide or peloruside A at the ext site cause similar stabilizing effects (mainly linking the M-loop of β1 and loop H1–B2 of β2). In a “hexamer” model (3 units of αβ-tubulin), the effects are confirmed. Metadynamics simulations of laulimalide and peloruside A, which are reported for the first time, suggest that peloruside A produces a stronger change in the M-loop, which explains the stabilization of the β1/β2 interaction.
Introduction
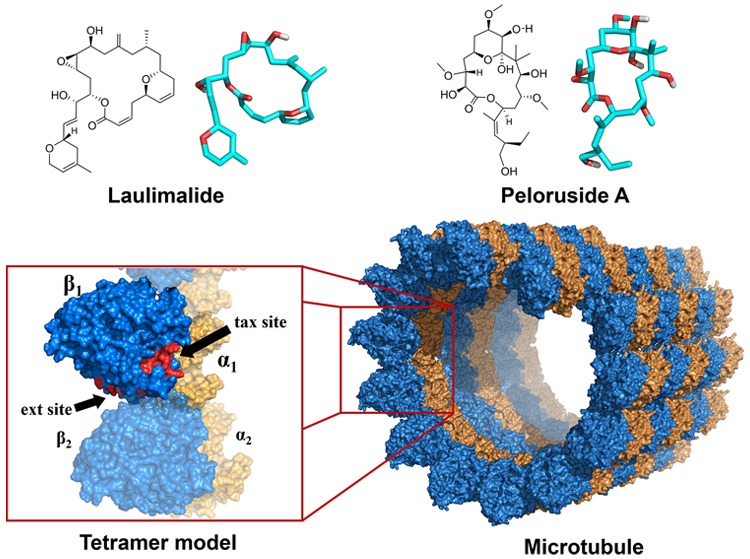
Laulimalide (1) and peloruside A (henceforward peloruside, 2) are antimitotic macrolides isolated from marine sponges that grow in the Pacific Ocean, around Indonesia, Vanuatu, Okinawa, and the Marshall Islands and around New Zealand, respectively (Figure 1).1,2 In sharp contrast to other microtubule-stabilizing agents (MSAs), such as paclitaxel/taxol, docetaxel/taxotere, epothilones A and B (3a and 3b), and many other macrolides, which bind to β-tubulin at the so-called taxol site (henceforward tax site), compounds 1 and 2 compete with each other but not with the former macrolides for the tax site and, consequently, retain their activity against taxol-resistant tumors.
Figure 1.

Laulimalide (1) and peloruside (2), two macrolides that share a common binding site, different from the tax site. Epothilones 3a and 3b.
As is well-known, paclitaxel is used clinically against breast and ovarian cancer treatments, whereas ixabepilone is a macrolactam analog of 3b that is useful against metastatic breast cancer. Although the toxicity of 1 is disappointing, the antiangiogenic effect and the activity against neurodegeneration and autoimmune disorders of 2 maintain hopes for the development of clinical uses of these MSAs. Very recent excellent reviews and full papers summarize these studies.3−16
Two issues have worried bioorganic and medicinal chemists for a long: (a) where is the binding site of 1 and 2? (b) How two molecules (ligands) that are so different structurally can share the same binding pocket? The fact is that 1 has two hydrogen-bond donors and clog P = 2.19 ± 0.55 (so it is relatively hydrophobic), whereas 2 has five hydroxyl groups and clog P = 0.44 ± 0.67 (so it is quite polar).
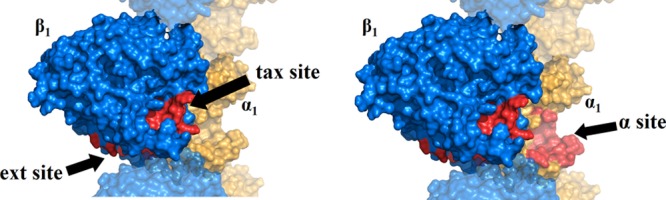
The first issue has been solved in recent years, after some initial doubts. In fact, more than a decade ago some of us suggested a hypothetical site in α-tubulin (α site, Figure 2), mainly relying upon blind molecular docking carried out with AutoDock 3.0 on an αβ-tubulin dimer.17 This binding site is located below the B9–B10 loop of α-tubulin, which does not exist in β-tubulin (where the tax site is found). This loop has to be raised up to permit the entry of ligands 1 and 2 into this α-tubulin binding pocket, which is rather similar to the tax site. Surprisingly, molecular docking calculations predicted that these ligands would have similar binding affinities for the tax site and α site.18 Jiménez-Barbero et al., after determining the bioactive conformer of 2 by NMR, confirmed this α site, also using AutoDock 3.0.18
Figure 2.
B9–B10 loop of α-tubulin represented in red. (A) Original conformation (closed loop) and (B) conformation revealing a new cavity (open loop).
However, on the basis of H/D exchange mass spectrometry of the complex of bovine tubulin with 2, Schreimer and co-workers reported in 2008 that the binding site of peloruside was on the external side (outer surface) of β-tubulin.19 Later, Schreimer et al. confirmed this binding site for laulimalide, using a mass shift perturbation technique.20 Much more recently, using X-ray crystallography (from cocrystals of the tubulin dimer, protein RB3, and tubulin tyrosine ligase at a 2.1–2.2 Å resolution), Steinmetz et al. established21 that 1 and 2 bind to the β-tubulin pocket already proposed by Schreimer et al.20 and interact with a second tubulin dimer of the neighboring filament.
Henceforward, we call this external binding site “the ext site”. In other words, 1 and 2 link two vicinal β-tubulin units (in two different filaments). Calculations concerning this issue by Hamel et al. (1 and 2, Glide),22 by Horwitz and co-workers (1 and 2, AutoDock),23 and by Liao et al. (2, AD4.2 and AMBER 10)24 are worth noting. Two excellent articles, by Tuszynski et al. (1, AMBER 12 and AMBER 14),25,26 which appeared when the present study with other methods had started, are also key because, as it will be demonstrated herein, our results confirm and complement them. As a matter of fact, there are important differences with the outcomes of the previous computational studies, as recognized by the authors themselves, although most are minor. Sometimes, three binding sites were found. Liao et al.,24 for instance, found that the tax site was the most favorable for 2, followed by the ext site and by a new site in α-tubulin, but outside the B9–B10 loop. We cannot repeat or even summarize here all the agreements and divergences, but it is understandable that the use of tubulins arising from different animal sources, the nature of the characterization techniques for such delicate complexes, the features of the cocrystals (sometimes quite artificial in relation to the intracellular world), the disparate calculation methods and their simplifications, and so forth cannot give rise to identical results. Generally speaking, all of the studies are “approaches to the truth”.
Be that as it may, for 1 and 2, there is sufficient experimental evidence in favor of the ext site, an outer site between two adjacent β-tubulins (in vicinal filaments). No doubts remain. Why was the AutoDock method unable to locate this binding site more than 12 years ago?17,18 Are there updated docking methods currently available that are much more reliable in this respect? We would like to consider these questions.
In a preceding paper,27 we examined the pros and cons of several updated docking programs (AutoDock, UCSF DOCK, and Glide), as far as the reproduction of Protein Data Bank (PDB) structures of cocrystals of proteins and natural macrolides or related compounds is concerned. Because AutoDock methods allow for a global blind docking, we used here AutoDock 4.2.628 (henceforward AD4.2), AutoDock Vina29 (ADVina), and AutoDock PSOVina (PSOVina).30 AD4.2 has a scoring function based on a semiempirical force field, which includes intramolecular terms, a full desolvation model, and the entropic energy of the ligand, whereas Vina has a hybrid scoring function (a mixture of empirical- and knowledge-based scoring function) with a more rapid and accurate search algorithm for the binding mode predictions29 and PSOVina combines the particle swarm optimization algorithm with the local search method adopted in Vina.30 Vina and PSOVina give less reliable scoring values than AD4.2, but they are extremely quick. In this context, we demonstrated27 that the rescoring of Vina with AD4.2 (which we called AD4.2//Vina) gave rise to better results (energy gaps between poses), so it turned out to be our method of choice for macrolide–receptor interactions. Thus, we have included here AD4.2//Vina calculations. Also, we have examined for the first time AD4.2//PSOVina (i.e., rescoring with AD4.2 of the docked poses obtained from PSOVina).
Here, we first check whether AD4.2, ADVina, and PSOVina can detect the above-mentioned binding site (ext site) or not, with models of microtubules. Afterward, with the refinement provided by the rescorings and MD calculations, we compare the features of the interaction of 1 and 2 with the amino acid units of the ext site, that is, we analyze the second issue mentioned in the preceding paragraphs regarding the analogies and differences between 1 and 2.
Results and Discussion
Blind Docking to the αβ-Tubulin Dimer Model
First of all, PDB structure 1JFF was overlapped with 2XRP, to treat α-tubulin as we did.17 The B9–B10 loop was maintained in an open conformation. Blind docking with different programs indicated the binding sites marked in Figure 3. The outcomes are summarized in Table 1. A long hyphen in a column of this and the following Tables mean that the percentage of low-energy conformers found at that site was <5%.
Figure 3.
Model of the αβ-tubulin dimer (of a microtubule filament) used as a first approximation.
Table 1. Docking Results (Minimum/Maximum Score Values, in kcal/mol, Found for Different Conformers and % of Conformers Bound in Each Binding Site), for the Tubulin Dimer with the B9–B10 Loop (of the α-Tubulin) “Open”.
| laulimalide
(1) |
peloruside
(2) |
|||||||||||
|---|---|---|---|---|---|---|---|---|---|---|---|---|
| tax site | ext site | α site | tax site | ext site | α site | |||||||
| AD4.2 | –8.52/–7.07 | 23% | –6.96/–6.48 | 9% | –8.83/–7.39 | 54% | –4.60/–2.73 | 36% | –5.31/–3.18 | 64% | ||
| ADVina | –7.9/–7.7 | 15% | –8.1/–7.6 | 10% | –8.3/–7.5 | 70% | –6.5/–6.0 | 10% | –6.8 | 5% | –6.6/–5.6 | 65% |
| AD4.2//Vina | –8.60/–7.84 | 15% | –9.65/–8.97 | 10% | –8.87/–7.00 | 70% | –6.66/–6.35 | 10% | –6.58 | 5% | –5.83/–3.66 | 65% |
| AD4.2//PSOVina | –7.23/–5.34 | 15% | –8.43/–5.59 | 70% | –5.06/–2.91 | 10% | –4.92/–4.01 | 10% | ||||
The blind docking results with the B9–B10 loop in its “open arrangement” (Table 1) located many conformers (over 50% in 7 out of 10 calculations of Table 1) at the α site, although the conformer with the lowest binding energy did not coincide from one docking program to another.
For 1, with AD4.2, ADVina, and AD4.2//PSOVina, the conformation with the lowest binding energy was in the α site (−8.83, −8.3, and −8.43 kcal/mol, respectively). However, the AD4.2//Vina rescoring method predicted it would be at the ext site, with a binding energy of −9.65 kcal/mol.
Meanwhile, the blind docking of 2 suggested that the conformation with the lowest binding energy was at the α site with AD4.2 (−5.31 kcal/mol), whereas it was at the ext site (−6.8 kcal/mol) with ADVina. Nevertheless, rescorings with both AD4.2//Vina and AD4.2//PSOVina predicted that the highest affinity conformation would be at the tax site (−6.66 and −5.06 kcal/mol, respectively). By the way, the binding energies obtained with AD4.2 are not very different from those we had obtained with the old AutoDock 3.0.
We estimated the barrier associated with the opening of the B9–B10 loop, the pocket here called α site, at the OPLS2005 level. We found no suitable bonds whose rotation allowed the pocket to be opened with a barrier lower than 20 kcal/mol. Thus, this α site probably does “exist”, but we expect that it is usually inaccessible. Moreover, for this allosteric site to be effective, it should be capable of producing additional favorable interactions between this α-tubulin (α1) and the closest α-tubulin (α2) in the vicinal filament. We did not observe any such α1/α2 interaction in silico (proceeding in the same way as described below, with a tetramer model, for β1/β2 interactions). We (some of us) obviously thus retract part of the previous results concerning the chances for the α site published in 2004.17 The main issue was not the poor performance of the old AutoDock because some of the updated AD calculations shown in Table 1 also suggest that the affinities for this site and/or the percentages of conformers binding to it are high.
With the B9–B10 loop “closed”, that is, in its expected arrangement, the tax site was predicted (Table 2) to “contain” most conformations as well as a good percentage of those conformations that showed the highest affinities in the case of 1. In the case of 2, the conformations with the highest affinities were generally those predicted to interact with the ext site. Interaction with the outside part of the B9–B10 loop (on, around, and near the above-mentioned α site, which is now “closed”) was predicted by all of the methods to be irrelevant.
Table 2. Docking Results (Minimum/Maximum Score Values in kcal/mol and % of Conformers Bound in Each Binding Site), for the Tubulin Dimer, with the B9–B10 Loop of the α-Tubulin “Closed”, as in all of the Known Crystal Structures.
| laulimalide (1) |
peloruside (2) |
|||||||
|---|---|---|---|---|---|---|---|---|
| tax site | ext site | tax site | ext site | |||||
| AD4.2 | –7.12/–6.89 | 7% | –6.82/–5.03 | 12% | –7.29/–5.34 | 14% | –8.23/–4.13 | 12% |
| ADVina | –9.2/–8.0 | 60% | –8.4 | 5% | –6.6/–5.7 | 10% | –7.1/–6.4 | 10% |
| AD4.2//Vina | –9.47/–6.96 | 50% | –9.09 | 5% | –6.23/–4.63 | 10% | –7.02/–5.72 | 10% |
| AD4.2//PSOVina | –9.10/–6.81 | 35% | –6.72 | 5% | –6.16/–4.02 | 25% | –7.11/–4.86 | 10% |
To summarize, an overall view of Table 2 suggests that 1 has a preference for the tax site, whereas 2 would rather stay at the ext site. The structural differences between 1 and 2, especially the fewer polar groups and hydrogen-bond donors in 1, may explain the preference of 1 for a more hydrophobic pocket such as the tax site (the binding pocket of clinical drugs that are hardly soluble in water, such as paclitaxel, for which clog P = 3.95 ± 0.81).
Docking to a Tubulin Tetramer Model
Going further, Figure 4 shows a new model with two α-tubulins and two β-tubulins (α1β1/α2β2, the minimum representative fragment of two adjacent filaments of a microtubule), to evaluate features of the lateral contacts. Other authors have very recently calculated the interactions of tetramers with 1(25,26) or with 2(24) via other methods. Our blind docking outcomes in the case of 1 are shown in Figure 4 and the results for 2 in Figure 5. The dockings were only carried out on α1β1 and the upper part of α2β2 (for the sake of simplicity and computer time issues).
Figure 4.

Blind docking of 1 on the upper part of a tetramer model (α1β1/α2β2), according to ADVina and PSOVina.
Figure 5.

Blind docking of 2 on the upper part of a tetramer model (α1β1/α2β2), according to ADVina and PSOVina.
Significant percentages of poses are found in the pore (around the pores), but these values are not indicated in Table 3, which only shows the binding affinities and the percentage of conformers from Figures 4 and 5 concerning the tax site and the ext site. The affinities for α site (“closed”) are very low, and the percentages of conformers near this zone are insignificant (<5%); therefore, these values are not included in Table 3 and neither are they considered anymore herein.
Table 3. Docking Results (Score Values or Minimum/Maximum Score Values, in kcal/mol, and % of Conformers Bound in Each Binding Site on the Upper Part of the Model).
| laulimalide
(1) |
peloruside
(2) |
|||||||
|---|---|---|---|---|---|---|---|---|
| tax site | ext site | tax site | ext site | |||||
| AD4.2 | –10.27/–6.31 | 16% | –9.72/–6.63 | 5% | –5.66/–2.90 | 18% | ||
| ADVina | –7.9 | 5% | –8.0/–7.3 | 15% | –5.50 | 5% | –5.9/–5.8 | 10% |
| AD4.2//Vina | –9.34 | 5% | –9.42/–7.21 | 15% | –6.30 | 5% | –6.45/–5.40 | 10% |
| AD4.2//PSOVina | –9.57/–8.54 | 10% | –8.75/–6.99 | 15% | –6.97/–6.71 | 10% | ||
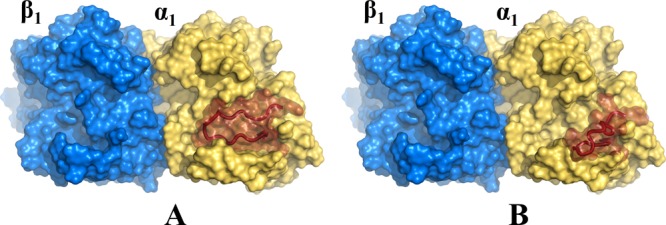
Table 3 suggests that 1 and 2 may be distributed similarly at the tax site and the ext site, although each docking approach predicts different percentages. We also note that 1 interacts more strongly than 2 with both sites, in general. Furthermore, in the light of AD4.2//Vina, there is one pose of 1 and another of 2 with the highest affinities for the ext site. The details of their binding modes are shown in Figure 6. Thus, the best pose of 1 shows a hydrogen bond with Ser298 (a distance of 1.9 Å) and hydrophobic interactions between the 3,6-dihydro-2H-pyran moiety and Tyr342, Pro307, and Tyr312. Meanwhile, there are several hydrogen bonds between the OH groups of 2 and Phe296 (1.9 Å), Ser298 (2.3 Å), and Arg308 (2.1 Å), as well as a weaker hydrogen bond (3.0 Å) with Asp120 of the adjacent β-tubulin (β2); ligand 2 also shows hydrophobic contacts with Tyr312 and Tyr342.
Figure 6.

Binding modes of the best poses of 1 (A) and 2 (B) at the ext site, obtained with AD4.2//Vina. Hydrogen bonds and interatomic distances (Å) are shown in red. Hydrophobic contacts are depicted in gray (dotted lines).
We carried out docking experiments in which both pockets, tax site and ext site, were occupied with ligands at the same time: the tax site with a competitor of paclitaxel and docetaxel, such as epothilone A, 3a, and the ext site with either 1 or 2. It did not allow us to observe significant differences with respect to filling the model with only one ligand. The fact is that the approach of the M-loop to the β2-tubulin is similarly favored in both cases. There seems that the effect of 3 and the effect of 1–2 do not significantly potentiate each other, even if (or when) they are located in the same β-tubulin. This agrees with the cryo-electron microscopy (EM) studies of Nogales and co-workers (Kellogg et al.),7 who concluded that “simultaneous binding cannot be the reason for the synergistic effect observed in the cellular context”.
Molecular Dynamics Simulation of the Tetramer Model
Molecular dynamics (MD) simulations of the tetramer (α1β1/α2β2), with or without the ligand docked on the external site of β1 (i.e., between β1 and β2), were first performed with trajectories of 20 ns. The calculations were later repeated with longer trajectories (50 ns), which confirmed the initial results. Various parameters were analyzed throughout the trajectory, especially the root-mean-square deviation (rmsd) of backbone atoms and the total number of intermolecular hydrogen bonds between the ligand and protein. As is known, the evolution of rmsd values from the starting structure is important for the convergence of the system. From the simulations in the absence of ligand, we observed that the rmsd oscillated between 1.24 and 7.89 Å, with a mean value of 5.25. The rmsd of the complex with 1 varied from 0.99 to 4.39 Å, with a mean value of 3.50 Å. The complex with 2 oscillated between 1.12 and 4.29 Å, with a mean value of 3.28 Å. The rmsd values of all of the protein atoms, with and without the ligands inside, are shown in Figure 7, which indicates that the two complexes reached an equilibrium state after ca. 7.5 ns. Thus, 50 ns simulations are long enough to stabilize the systems.
Figure 7.
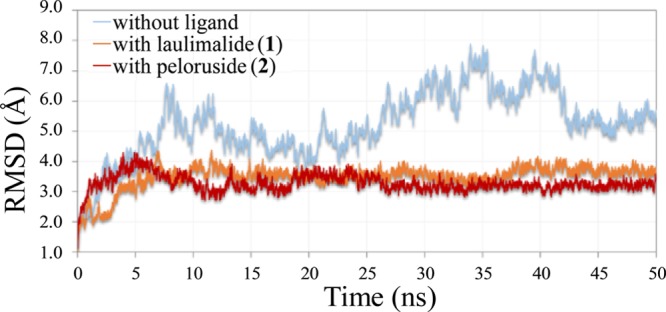
rmsd plot of the interaction between β1-tubulin and β2-tubulin without any ligand (blue), with 1 inside the ext site (red), and with 2 at the ext site (orange).
The root-mean-square fluctuation (RMSF) analysis of the β1-tubulin–ligand complexes showed more fluctuation in the residues corresponding to the M-loop region (ca. 3.5 Å). The plot revealed that Ser280 has a high RMSF value (4.4 Å). In general, the RMSF values decreased slightly with the ligands inside, as shown in Figure 8.
Figure 8.

RMSF plot of β1-tubulin. Graphic representation of the M-loop and helices 9 and 10 (H9 and H10).
The binding mode of 1 at the ext site (Figure 9) showed three hydrogen bonds: with the side chain of Ser298 at a distance of ca. 2.0 Å and with 40% binding during the simulation; with the side chain of Asp297 (1.8 Å/81%); and with Asn339 (2.0 Å/76%). Hydrophobic interactions of the 3,6-dihydro-2H-pyran moiety with Phe296, Tyr342, Phe343, Pro307, and Tyr312 were also evident. In the case of 2, five hydrogen bonds were noted: with Phe296 (1.8 Å/99%), Tyr312 (1.8 Å/98%), Ser298 (2.4 Å/83%), and Gln293 (1.9 Å/40%), as well as with Asp120 of β2 (2.0 Å/87%). This last hydrogen bond is now predicted to be much stronger than by docking. Hydrophobic interactions of 2 with Pro307 and Tyr342 are also pointed out in Figure 8. The conclusion is that both 1 and 2 bind to the ext site with the “weapons” they have: the less polar ligand, 1, with one hydrogen bond and three hydrophobic contacts; the more polar molecule, 2, with three hydrogen bonds and two hydrophobic contacts. Moreover, 2 exhibits one further hydrogen bond with the neighboring β2, which may make the β1/β2 interaction stronger.
Figure 9.

Binding modes of 1 (A) and 2 (B) after the MD simulations. Hydrogen bonds are shown as red dotted lines, with interatomic distances in angstrom, and amino acid residues in blue. Hydrophobic contacts are indicated in gray. All interactions of 1 are with residues of β1, whereas 2 also interacts with Asp120 of β2.
The agreement between Figure 6 (AutoDock) and Figure 9 (MD) is not perfect, but it is remarkable. The difference is that the MD simulations detected some additional interactions, readily noted by comparing Figures 6 and 9.
Binding Energy Calculations
First, we calculated the binding energies of the two complexes using molecular mechanics Poisson–Boltzmann surface area (MM–PB/SA). This method has been used to evaluate the relative binding stabilities of supramolecular systems.31 It has also been applied to better understand the interactions, by decomposing the total binding energy into its various components. We found an average binding energy of −39.39 ± 2.77 kcal/mol for 1 and of −33.16 ± 3.07 kcal/mol for 2. Thus, the binding affinity of 1 for the ext site is higher than that of 2. On the basis of the individual contributions to the binding energy, it may be suggested that the van der Waals energy is more significant in the case of 1, whereas the electrostatic energy contributed much more to the binding energy for 2, as shown in Table 4.
Table 4. Individual Terms of MM–PB/SA Binding Energy (kcal/mol)a.
| ΔEvdW | ΔEele | ΔEpolar | ΔESASA | ΔEbinding | |
|---|---|---|---|---|---|
| 1 | –59.74 ± 3.45 | –4.77 ± 2.25 | 30.74 ± 2.75 | –5.62 ± 0.16 | –39.39 ± 2.77 |
| 2 | –49.34 ± 3.50 | –19.53 ± 3.70 | 40.90 ± 3.90 | –5.19 ± 0.11 | –33.16 ± 3.07 |
ΔEvdW van der Waals contributions to the binding energy, ΔEele electrostatic contributions to the binding energy, ΔEpolar polar contributions to the binding energy, ΔESASA solvent-accessible surface area contributions, ΔEbinding total binding energy.
The binding energy was also decomposed per residue. As shown in blue bars in Figure 10, the α-amino acid units (residues) that interact more strongly with 1 than with 2 are Ser298 (−0.94 ± 0.05 kcal/mol), Phe307 (−0.69 ± 0.03 kcal/mol), Tyr312 (−0.95 ± 0.05 kcal/mol), and Val335 (−1.42 ± 0.04 kcal/mol). Meanwhile, 2 interacts more strongly than 1 with Asp297 (−2.41 ± 0.07 kcal/mol), Asp306 (−1.85 ± 0.04 kcal/mol), and Tyr342 (−1.51 ± 0.06 kcal/mol) (see red bars); in contrast, the interactions of 2 with protonated side chains (the basic Arg308 and Lys338) are unfavorable. Overall, the protein–ligand affinities are mainly determined by the residues of the H9–B8 and H10–B9 loops (Figure 11).
Figure 10.
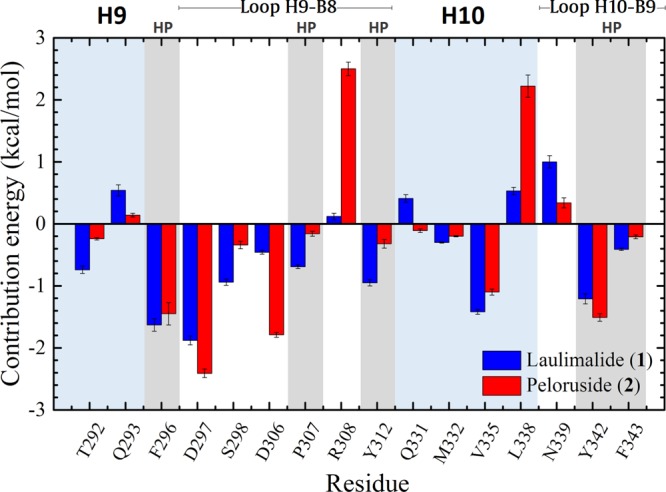
Free-energy values decomposed per residue for the complexes of 1 and 2 with tetramer α1β1/α2β2. HP = hydrophobic.
Figure 11.

Binding mode of 1 (A) and its schematic representation (B). Binding mode of 2 (C) and its schematic representation (D).
Analysis of the Side Contacts between β1- and β2-Tubulin
We subsequently analyzed the MD of the lateral contacts between the two adjacent β-tubulin units (β1/β2) without any ligand, using Molecular Dynamics consensus (MDcons).32 The principal contact areas (Figure 12) involved M-loop/H9/H10 of β1 and H3/H2–B3 of β2, that is, between residues 280–340 of β1 and 50–135 of β2. These contacts are already present in the model (with two filaments close together, under favorable conditions for the formation of microtubules), as seen in the 2XRP crystal structure.33−35
Figure 12.

Graphic representation of contacts between β1 and β2. The M-loop and H2–B3 loop in green; domains H9 and H3 in blue. The yellow stripe highlights the interactions of the M-loop.
When the MD simulations were carried out with either 1 or 2 at the ext site, new contacts between the M-loop of β1-tubulin and loop H1–B2 of β2-tubulin were noted (Figure 13), which appeared to be stronger in the case of 2 than 1. The side chain of Arg284 (guanidinium ion) of β1 interacts with the CO group of the alanyl unit (Ala56 of β2), whereas the CONH group of Ala285 of β1 interacts with the threonine OH group (Thr57 of β2). Figure 14 summarizes the interactions. The red circles and arrows highlight the domains where the number of contacts increased. On the contrary, the number of contacts between the H9/M-loop regions of β1 and H3 of β2 decreased slightly. This may explain why the antitumor activities of 1 and 2, although all IC50 values are in the nanomolar range, are not as strong as those of paclitaxel and epothilones.3−16
Figure 13.
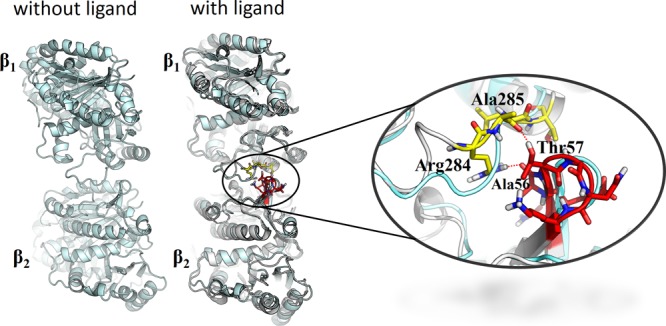
New lateral contacts between the adjacent β-tubulins (β1 and β2), as predicted by MD simulations with 1 or 2 at the ext site.
Figure 14.

Graphic representation of the lateral contacts between β1- and β2-tubulin of the α1β1/α2β2 tetramer model, with 1, 2, or 3a at the ext site of β1 (top) and with 1, 2, or 3a at the tax site of β1 or 3a at the tax site of β2 (bottom). The areas where the changes of the lateral contacts are predicted to be more relevant, with respect to the tetramer in the absence of ligands, are highlighted in red circles. As in Figure 12, the yellow stripes highlight the interactions of the M-loop.
For the sake of comparison, the effect of 3a at the ext site (Figure 14, top) was calculated, with the best docking pose obtained from AD4.2//Vina as the starting point. The MD simulations indicated that 3a at the ext site decreases significantly the interactions of the M-loop of β1 with the H1–B2 loop of β2 (red circle). Contacts of the M-loop of β1 (as well as of H9 and vicinal domains of β1) with H3 of β2 are noted, but it seems that they are not sufficient compensation.
Also for comparison, the effects of 1, 2, and 3a at the tax site were calculated (see Figure 14, bottom). Inside the tax site, only 3a gave rise to the additional stabilizing contacts (red circle) between β1-tubulin and β2-tubulin. This occurs either with 3a at the tax site of β1 or β2 (!), indicating that the allosteric effect is “propagated” in both directions. By contrast, 1 and 2, although they can be accommodated within the binding pocket of the tax site, showed fewer contacts between the M-loop (β1) and the H1–B2 loop (β2) (red circle) and also, in comparison with 3a, between the H9/M-loop region (β1) and H3 (β2). Although not included in Figure 14 to save space, analogous results were obtained with 3b instead of 3a.
It is known36−39 that there is a synergy between the tax site-interacting MSAs and the ext site-interacting MSAs in tumor cell cultures, although exceptions have been reported and additional factors are probably involved.7 As mentioned, the chances that in vivo one tax site-binding ligand and one ext site-binding ligand were both bound to a microtubule at the same β-tubulin unit or at vicinal β-tubulins are scarce.7 In spite of that to gain insight into the potential cooperation or the absence of cooperation between both types of antimitotic drugs, we carried out MD simulations in which two vicinal pockets were occupied with the corresponding ligands, that is, the tax site of β1 with 3a and the ext site of β1 with 1 or 2. We observed that the effect of 3a (at its site) and the effect of 1–2 (at their site) are similar; they favor the contacts of the M-loop of β1 with the loop H1–H2 of β2 (red circles), as Tuszynski et al. also showed using AMBER.25 The benefit of mixing 1 or 2 with 3a, if they would occupy neighboring sites, may lie on the reinforcement of the stability of the contacts highlighted by red circles. Furthermore, the tendency of 3a to improve the contacts between H9/M-loop and H3 may compensate the tendency of 2 to slightly undermine or weaken these contacts, with respect to a tetramer already formed, without ligands, arising from the two neighboring filaments of the above-mentioned crystal structure. However, the MD results do not predict a strong cooperation.
MD Simulations of a Hexamer Model
With the purpose of confirming or rejecting the preceding observations and assumptions, a hexamer model (α1β1/α2β2/α3β3, almost 2700 amino acid units, over 300 kDa) was built up on the basis of the crystal structure 3JAS (containing three protofilaments) and various MD experiments were undertaken with ligands 2 and 3a at the respective binding sites. The results are summarized in Figure 15.
Figure 15.

Graphic representation of the lateral contacts, in a hexamer model (α1β1/α2β2/α3β3), between β1- and β2-tubulin and between β2- and β3-tubulin. First column: MD of the hexamer model (from the crystal structure of three protofilaments). Second column: one molecule of 2 was included in the ext site of β1. Third: 2 was included in the ext site of β2. Fourth: 3a at the tax site of β1. Fifth: 3a at the tax site of β2. Red circles, as always, highlight the interactions between the M-loop and loop H1–B2.
MD calculations predict that 2, at β1 or β2, stabilizes both the union of β1 and β2 and of β2 and β3 via the interactions between the M-loop and loop H1–B2 (red circles). These mainly involve amino acid units Tyr283, Arg284, Ala285, Thr207, and Glu290 of the M-loop and residues Ala56, Thr57, Lys60, and Val62 of loop H1–B2. The H9–H3 contacts decrease significantly or partially or do not decrease (see Figure 15).
Ligand 3a, at the tax site, produces similar effects. It is also predicted that 3a at its site stabilizes not only the proximal linkage but also the following and the previous contacts (red circles), confirming what was noted in the case of the tetramer model.
The combination of 2 and 3a, at their respective binding sites (on the same or vicinal β-tubulins, despite the fact that, as mentioned above, it seems improbable in practice),7 again showed a moderate or scarce additivity, as in the tetramer model. Bearing in mind the structure of a complete eukaryotic microtubule, with 13 protofilaments (and the features of the seam), the explanation of the synergy or lack of synergy should be computationally investigated using larger models.
Metadynamics
During the MD simulations of the tetramer model, we detected transient folded conformations with the M-loop of β1 adopting an α-helix arrangement but it was not found to be an energy minimum. Because the cocrystal structures of tubulin protofilaments with 1 and protofilaments with 2, very recently published,21 showed the M-loop folded as an α-helix (Figure 16), we have subjected our tetramer model to a metadynamics simulation with Desmond.32,40 To the best of our knowledge, after an extensive search through SciFinder and SciFindern, metadynamics simulations of 1 or 2 (interacting with β1) have not been previously reported. There are no metadynamics studies of other antimitotic macrolides, the total syntheses of which are a long-standing research line of the senior author.41−45 There is only one metadynamics study that involves the microtubule-destabilizing agent combretastatin.46 Two works on the energy profiles of other antimitotic agents have also been reported.47,48
Figure 16.

(A) M-loop conformation of β1-tubulin in the 1JFF structure (starting model). (B) M-loop bioactive conformation of β1-tubulin in the 4O4I structure.
The results for the complex of 1 with the tetramer model are shown in Figure 17. The key amino acids indicated by Steinmetz et al.21 were considered in the simulation, with the distance between Arg284 and Glu290 as CV1 and the distance between Thr276 and Gln294 as CV2. Two metastates were found: in A, the Arg284–Glu290 distance was shortened to 2.1–3.2 Å (see Figure 17, A), whereas the separation between Thr276 and Gln294 was maintained around 10 Å; in B, these distances were reduced to 3.7–4.3 Å and around 7.6 Å, respectively.
Figure 17.

Two-dimensional FES (color map) as a function of the collective variables CV1 and CV2 for 1.
The results for the complex of 2 with the tetramer model are summarized in Figure 18. There are three metastates that have a similar energy. The above-mentioned distances are reduced to 1.7 and 3.9 Å (see A), to 3.6 and 2.4 Å (see B), and to 3.5 and 3.9 Å (see C).
Figure 18.

Two-dimensional FES (color map) as a function of the collective variables CV1 and CV2 for 2.
Conclusions
In a tubulin tetramer model (α1β1/α2β2, with side contact), rescorings with AutoDock 4.2.6 (AD4.2//Vina) predict that 1 and 2 have strong interactions at several points of the tubulin surface. Small percentages of the total numbers of conformers of 1 and 2 are found at the tax site and the ext site. At first sight, this does not agree with the experimental preference of 1 and 2 for the ext site. However, when β1/β2 lateral contacts are analyzed by means of MD calculations, once 1 and 2 are at the ext site, it is confirmed that the interactions of β1-tubulin with the adjacent β2-tubulin become much stronger than when they are at the tax site (which is a larger pocket that is hardly affected by the size and noncovalent bonding effects of these two ligands). Moreover, the more polar molecule, ligand 2, causes a larger shift of the M-loop, which gives rise to stronger β1/β2 lateral contacts than those provoked by 1. In other words, although molecular docking predicts that the binding affinity of 1 for the ext site is higher than that of 2, the difference is partially compensated for by the more favorable β1/β2 lateral interactions that are induced by 2, as compared to 1. The metadynamics simulations explain how ligand 1 at the ext site of β1, by bringing together Arg284 and Glu290, shifts the M-loop to an α-helix conformation, as well as how ligand 2 forces to an even greater extent the approach both of Arg284 and Glu290 and of Thr276 and Gln294, which also causes the M-loop to adopt the α-helix form, in accordance with the reported crystal structures.21 All of the experimental results are thus in agreement and the main question posed in the introduction—how can two ligands that are structurally so different exert similar antitumor activity?—can be answered as follows:
-
(a)
Ligand 1 has a much higher affinity for the hydrophobic ext site than 2 has.
-
(b)
In contrast, the more polar ligand, 2, favors the lateral contacts between the neighboring tubulins (βn and βn+1) more than 1 does.
-
(c)
In both cases, the interaction between the M-loop of βn and the H2–B3 loop of βn+1 is favorable (Figures 14 and 15, red circles) and other stabilizing interactions are maintained. The interaction of the H9/M-loop region of βn with the H3 domain of βn+1 is slightly undermined.
-
(d)
The affinity of the M-loop of βn (for the H2–B3 loop of βn+1) is reinforced after folding to an α-helix,20 which is produced in the case of 2 by shortening distances Arg284–Glu290 and Thr276–Gln294.
The events, when ligands 1 or 2 approach the binding site, can be represented as in Figure 19 (a cartoon). We are conscious that the results are approximate because of the unavoidable simplifications, including the use of tetramers or hexamers instead of large microtubule portions (MD calculations that are practically infeasible at present), but they pave the way for future computational studies, in which we plan to examine more deeply the known experimental synergy between some tax site- and ext site-binding antimitotic drugs,43−46 in the light of the cryo-EM studies of Kellogg et al.7 and of the calculations disclosed here. In our MD simulations on tetramer and hexamer models, adding 1 and 3a or 2 and 3a, both types of drugs are predicted to favor mainly the contacts between the M-loop of one β-tubulin with the H1–B2 loop of the neighboring β-tubulin, as expected.7,25 Moreover, to our surprise, the contacts between the next and previous pair are also favored. We also hope to apply the successful methods examined here to the study of the interactions between other antitumor macrolides and the cytoskeleton protein actin.
Figure 19.

Simplified drawings (front partial view) of the region between β1 and β2 (A) and of the effect of 1 (see B) and 2 (see C) on the β1/β2 interaction.
Methods
Tubulin Crystalline Complexes
The crystal structures of tubulin with laulimalide (PDB ID: 4O4I) and peloruside (PDB ID: 4O4L)21 were downloaded from the PDB (http://www.rcsb.org/). The protein and nucleotide models were obtained from the 1JFF crystal structure,49 and missing residues 35–60 in α-tubulin were obtained from the 1TUB crystal structure.50 The α-tubulin subunit with the “open” B9–B10 loop model was generated from 1JFF coordinates, following Pineda et al.17 The model of two adjacent tubulin heterodimers (“tetramer” α1β1/α2β2) was obtained using 2XRP(33) as the template. The “hexamer” model (α1β1/α2β2/α3β3) was obtained using the 3JAS crystal structure51 as the template. Tubulin residue numbering is as defined in Löwe et al.49 As known,3−16 each α-tubulin comprises around 450 amino acid units or residues and each β-tubulin consists of around 445 amino acid units. Before starting the calculations, guanosine triphosphate was removed from the tubulin structures.
Preparation of the Structures and Blind Docking
Coordinate files for 1 and 2 were extracted from the corresponding PDB files and used as reference structures for rmsd calculations. AutoDock 4.2 Tools were used to add polar hydrogen atoms and Gasteiger charges. The blind dockings were run with AutoDock 4.2.6 (AD4.2) using an empirical free-energy method, with an initial population of 150 individuals, a maximum number of 2 500 000 energy evaluations, and a mutation rate of 0.02 (by default). The dockings were carried out over 50 runs using the Lamarckian genetic algorithm. The docking area, as defined by the grid box, was centered [100 (x), 80 (y), and 111 (z)], with a size of 50 × 38 × 70 and with a spacing of 1.000 Å between the grid points. In the case of AutoDock Vina and PSOVina, the dockings were executed over 50 runs, with an exhaustiveness of 30.
Molecular Dynamics
All of the MD simulations in this study were performed using Desmond (release 2016-2).32 Orthorhombic periodic boundary conditions were set up to specify the shape and size of the repeating unit buffered at 10 Å distances. The ligand–protein complexes were solvated with the TIP3P water model, and ions were added to neutralize the system. Na+ and Cl– ions were also added to the solvated system at a concentration of 0.15 M. After building the solvated system, we carried out minimization and relaxation of the ligand–protein complex under the NPT ensemble using the default Desmond protocol. The MD simulations were performed with the periodic boundary conditions in the NPT ensemble using OPLS2005 force field parameters; the ligand−β-tubulin and β-tubulin−β-tubulin interactions turned out to be almost identical to those obtained with AMBER.24−26 The temperature and pressure were kept at 300 K and 1 atm (1013.25 hPa), respectively, using Nose–Hoover temperature coupling and isotropic scaling. Finally, the analysis of the contacts between the two adjacent β-tubulins was done with MDcons.52
Root-Mean-Square Deviation and Fluctuation
rmsd and RMSF calculations were carried out using the “simulation–interaction diagram” scripts.32 Frames from each interval were aligned to the first frame of the trajectory; the values were calculated using the backbone α-carbon atoms.
Binding Energy Calculations
Gibbs free energy was calculated using Gromacs 2016.2,53 from the method developed by Kumari et al.54 The interaction energies of 1 and 2 with the microtubule model (tetramer) were calculated using MM–PB/SA methods for 20 to 40 ns. For each simulated system, total snapshots were taken from the last 10 ns of the trajectory at the interval of 20 ps. This methodology includes electrostatic interactions, van der Waals interactions, polar solvation energy, and nonpolar solvation energy. The MM–PB/SA analysis also offers an individual contribution to the binding energy and per residue contribution that provides the important amino acid, which can be helpful in designing dual inhibitors.
Metadynamics Parameters
We have used metadynamics simulations to construct the free-energy surface (FES) of the tetramer model with Desmond.32 As known,40 metadynamics is a method that enhances conformational sampling of the free-energy landscape, by making use of some reaction coordinates. These reaction coordinates are so-called “Collective Variables” (CVs). They are carefully selected degrees of freedom along which the system is expected to proceed by traversing the complete conformational path. In the present study, the simulation temperature was kept at 300 K and a pressure of 1.013 bar. Initial Gaussian height was kept at 0.03 kcal/mol. The CVs used for these metadynamics simulations were the distances between Arg284 and Glu290 and between Gln294 and Thr276. The simulations were run during 50 ns.
Acknowledgments
Grants CTQ2012-39230 and CTQ2015-71506-R (FEDER, Spanish Government) are acknowledged. A.C.-A. has held a PhD studentship from CONICYT through Becas Chile 2012 and is currently a fellow of the Fundació Cellex de Barcelona. This work is dedicated to the late President of the Fundació Cellex of Barcelona, chemist and entrepreneur, Dr. Pere Mir (deceased 10 March 2017)
Author Present Address
† Present address: Barcelona Supercomputing Center, 08034 Barcelona, Catalonia, Spain
The authors declare no competing financial interest.
References
- Mooberry S. L.; Tien G.; Hernandez A. H.; Plubrukarn A.; Davidson B. S. Laulimalide and isolaulimalide, new paclitaxel-like microtubule-stabilizing agents. Cancer Res. 1999, 59, 653–660. [PubMed] [Google Scholar]
- West L. M.; Northcote P. T.; Battershill C. N. Peloruside A: a potent cytotoxic macrolide isolated from the New Zealand marine sponge Mycale sp.. J. Org. Chem. 2000, 65, 445–449. 10.1021/jo991296y. [DOI] [PubMed] [Google Scholar]
- Chan A.; Gilfillan C.; Templeton N.; Paterson I.; Northcote P. T.; Miller J. H. Induction of accelerated senescence by the microtubule-stabilizing agent peloruside A. Invest. New Drugs 2017, 35, 706–717. 10.1007/s10637-017-0493-5. [DOI] [PubMed] [Google Scholar]
- Yadava U.; Yadav V. K.; Yadav R. K. Novel anti-tubulin agents from plant and marine origins: insight from a molecular modeling and dynamics study. RSC Adv. 2017, 7, 15917–15925. 10.1039/c7ra00370f. [DOI] [Google Scholar]
- Zúñiga M. A.; Alderete J. B.; Jaña G. A.; Jiménez V. A. Structural insight into the role of Gln293Met mutation on the peloruside A/laulimalide association with αβ-tubulin from molecular dynamics simulations, binding free energy calculations and weak interactions analysis. J. Comput.-Aided Mol. Des. 2017, 31, 643–652. 10.1007/s10822-017-0029-2. [DOI] [PubMed] [Google Scholar]
- Ruiz-Torres V.; Encinar J.; Herranz-López M.; Pérez-Sánchez A.; Galiano V.; Barrajón-Catalán E.; Micol V. An updated review on marine anticancer compounds: the use of virtual screening for the discovery of small-molecule cancer drugs. Molecules 2017, 22, 1037. 10.3390/molecules22071037. [DOI] [PMC free article] [PubMed] [Google Scholar]
- Kellogg E. H.; Hejab N. M. A.; Howes S.; Northcote P.; Miller J. H.; Díaz J. F.; Downing K. H.; Nogales E. Insights into the distinct mechanisms of action of taxane and non-taxane microtubule stabilizers from cryo-em structures. J. Mol. Biol. 2017, 429, 633–646. 10.1016/j.jmb.2017.01.001. [DOI] [PMC free article] [PubMed] [Google Scholar]
- Kumar B.; Kumar R.; Skvortsova I.; Kumar V. Mechanisms of tubulin binding ligands to target cancer cells: updates on their therapeutic potential and clinical trials. Curr. Cancer Drug Targets 2017, 17, 357–375. 10.2174/1568009616666160928110818. [DOI] [PubMed] [Google Scholar]
- Zhao Y.; Mu X.; Du G. Microtubule-stabilizing agents: new drug discovery and cancer therapy. Pharmacol. Ther. 2016, 162, 134–143. 10.1016/j.pharmthera.2015.12.006. [DOI] [PubMed] [Google Scholar]
- Kanakkanthara A.; Northcote P. T.; Miller J. H. Peloruside A: a lead non-taxoid-site microtubule-stabilizing agent with potential activity against cancer, neurodegeneration, and autoimmune disease. Nat. Prod. Rep. 2016, 33, 549–561. 10.1039/c5np00146c. [DOI] [PubMed] [Google Scholar]
- Brunden K. R.; Trojanowski J. Q.; Smith A. B.; Lee V. M.-Y.; Ballatore C. Microtubule-stabilizing agents as potential therapeutics for neurodegenerative disease. Bioorg. Med. Chem. 2014, 22, 5040–5049. 10.1016/j.bmc.2013.12.046. [DOI] [PMC free article] [PubMed] [Google Scholar]
- Rohena C. C.; Mooberry S. L. Recent progress with microtubule stabilizers: new compounds, binding modes and cellular activities. Nat. Prod. Rep. 2014, 31, 335–355. 10.1039/c3np70092e. [DOI] [PMC free article] [PubMed] [Google Scholar]
- Field J. J.; Díaz J. F.; Miller J. H. The binding sites of microtubule-stabilizing agents. Chem. Biol. 2013, 20, 301–315. 10.1016/j.chembiol.2013.01.014. [DOI] [PubMed] [Google Scholar]
- Gajewski M. M.; Alisaraie L.; Tuszynski J. A. Peloruside, laulimalide, and noscapine interactions with β-tubulin. Pharm. Res. 2012, 29, 2985–2993. 10.1007/s11095-012-0809-2. [DOI] [PubMed] [Google Scholar]
- Gaitanos T. N.; Buey R. M.; Díaz J. F.; Northcote P. T.; Teesdale-Spittle P.; Andreu J. M.; Miller J. H. Peloruside A does not bind to the taxoid site on β-tubulin and retains its activity in multidrug-resistant cell lines. Cancer Res. 2004, 64, 5063–5067. 10.1158/0008-5472.can-04-0771. [DOI] [PubMed] [Google Scholar]
- Pryor D. E.; O’Brate A.; Bilcer G.; Díaz J. F.; Wang Y.; Kabaki M.; Jung M. K.; Andreu J. M.; Ghosh A. K.; Giannakakou P.; Hamel E. The microtubule stabilizing agent laulimalide does not bind in the taxoid site, kills cells resistant to paclitaxel and epothilones, and may not require its epoxide moiety for activity. Biochemistry 2002, 41, 9109–9115. 10.1021/bi020211b. [DOI] [PubMed] [Google Scholar]
- Pineda O.; Farràs J.; Maccari L.; Manetti F.; Botta M.; Vilarrasa J. Computational comparison of microtubule-stabilising agents laulimalide and peloruside with taxol and colchicine. Bioorg. Med. Chem. Lett. 2004, 14, 4825–4829. 10.1016/j.bmcl.2004.07.053. [DOI] [PubMed] [Google Scholar]
- Jiménez-Barbero J.; Canales A.; Northcote P. T.; Buey R. M.; Andreu J. M.; Díaz J. F. NMR determination of the bioactive conformation of peloruside A bound to microtubules. J. Am. Chem. Soc. 2006, 128, 8757–8765. 10.1021/ja0580237. [DOI] [PubMed] [Google Scholar]
- Huzil J. T.; Chik J. K.; Slysz G. W.; Freedman H.; Tuszynski J.; Taylor R. E.; Sackett D. L.; Schriemer D. C. A unique mode of microtubule stabilization induced by peloruside A. J. Mol. Biol. 2008, 378, 1016–1030. 10.1016/j.jmb.2008.03.026. [DOI] [PMC free article] [PubMed] [Google Scholar]
- Bennett M. J.; Barakat K.; Huzil J. T.; Tuszynski J.; Schriemer D. C. Discovery and characterization of the laulimalide-microtubule binding mode by mass shift perturbation mapping. Chem. Biol. 2010, 17, 725–734. 10.1016/j.chembiol.2010.05.019. [DOI] [PubMed] [Google Scholar]
- Prota A. E.; Bargsten K.; Northcote P. T.; Marsh M.; Altmann K.-H.; Miller J. H.; Díaz J. F.; Steinmetz M. O. Structural basis of microtubule stabilization by laulimalide and peloruside A. Angew. Chem., Int. Ed. 2014, 53, 1621–1625. 10.1002/anie.201307749. [DOI] [PubMed] [Google Scholar]
- Nguyen T. L.; Xu X.; Gussio R.; Ghosh A. K.; Hamel E. The assembly-inducing laulimalide/peloruside a binding site on tubulin: molecular modeling and biochemical studies with [3H]peloruside A. J. Chem. Inf. Model. 2010, 50, 2019–2028. 10.1021/ci1002894. [DOI] [PMC free article] [PubMed] [Google Scholar]
- Khrapunovich-Baine M.; Menon V.; Yang C.-P. H.; Northcote P. T.; Miller J. H.; Angeletti R. H.; Fiser A.; Horwitz S. B.; Xiao H. Hallmarks of molecular action of microtubule stabilizing agents: effects of epothilone B, ixabepilone, peloruside A, and laulimalide on microtubule conformation. J. Biol. Chem. 2011, 286, 11765–11778. 10.1074/jbc.m110.162214. [DOI] [PMC free article] [PubMed] [Google Scholar]
- Liao S.-Y.; Mo G.-Q.; Chen J.-C.; Zheng K.-C. Docking and molecular dynamics studies of the binding between peloruside A and tubulin. J. Enzyme Inhib. Med. Chem. 2014, 29, 702–709. 10.3109/14756366.2013.845816. [DOI] [PubMed] [Google Scholar]
- Churchill C. D. M.; Klobukowski M.; Tuszynski J. A. The unique binding mode of laulimalide to two tubulin protofilaments. Chem. Biol. Drug Des. 2015, 86, 190–199. 10.1111/cbdd.12475. [DOI] [PubMed] [Google Scholar]
- Churchill C. D. M.; Klobukowski M.; Tuszynski J. A. Analysis of the binding mode of laulimalide to microtubules: establishing a laulimalide–tubulin pharmacophore. J. Biomol. Struct. Dyn. 2016, 34, 1455–1469. 10.1080/07391102.2015.1078115. [DOI] [PubMed] [Google Scholar]
- Castro-Alvarez A.; Costa A.; Vilarrasa J. The performance of several docking programs at reproducing protein–macrolide-like crystal structures. Molecules 2017, 22, 136–149. 10.3390/molecules22010136. [DOI] [PMC free article] [PubMed] [Google Scholar]
- Morris G. M.; Huey R.; Lindstrom W.; Sanner M. F.; Belew R. K.; Goodsell D. S.; Olson A. J. AutoDock4 and AutoDockTools4: automated docking with selective receptor flexibility. J. Comput. Chem. 2009, 30, 2785–2791. 10.1002/jcc.21256. [DOI] [PMC free article] [PubMed] [Google Scholar]
- Trott O.; Olson A. J. AutoDock Vina: improving the speed and accuracy of docking with a new scoring function, efficient optimization, and multithreading. J. Comput. Chem. 2010, 31, 455–461. 10.1002/jcc.21334. [DOI] [PMC free article] [PubMed] [Google Scholar]
- Ng M. C. K.; Fong S.; Siu S. W. I. PSOVina: The hybrid particle swarm optimization algorithm for protein–ligand docking. J. Bioinf. Comput. Biol. 2015, 13, 1541007. 10.1142/s0219720015410073. [DOI] [PubMed] [Google Scholar]
- Genheden S.; Ryde U. The MM/PBSA and MM/GBSA methods to estimate ligand-binding affinities. Expert Opin. Drug Discovery 2015, 10, 449–461. 10.1517/17460441.2015.1032936. [DOI] [PMC free article] [PubMed] [Google Scholar]
- a Shivakumar D.; Williams J.; Wu Y.; Damm W.; Shelley J.; Sherman W. Prediction of absolute solvation free energies using Molecular Dynamics free energy perturbation and the OPLS force field. J. Chem. Theory Comput. 2010, 6, 1509–1519. 10.1021/ct900587b. [DOI] [PubMed] [Google Scholar]; Desmond MD System, DE Shaw Research . Maestro-Desmond Interoperability Tools; Schrödinger: New York, 2017.
- Fourniol F. J.; Sindelar C. V.; Amigues B.; Clare D. K.; Thomas G.; Perderiset M.; Francis F.; Houdusse A.; Moores C. A. Template-free 13-protofilament microtubule–MAP assembly visualized at 8 Å resolution. J. Cell Biol. 2010, 191, 463–470. 10.1083/jcb.201007081. [DOI] [PMC free article] [PubMed] [Google Scholar]
- Ayoub A. T.; Craddock T. J. A.; Klobukowski M.; Tuszynski J. Analysis of the strength of interfacial hydrogen bonds between tubulin dimers using quantum theory of atoms in molecules. Biophys. J. 2014, 107, 740–750. 10.1016/j.bpj.2014.05.047. [DOI] [PMC free article] [PubMed] [Google Scholar]
- Wells D. B.; Aksimentiev A. Mechanical properties of a complete microtubule revealed through molecular dynamics simulation. Biophys. J. 2010, 99, 629–637. 10.1016/j.bpj.2010.04.038. [DOI] [PMC free article] [PubMed] [Google Scholar]
- Gapud E. J.; Bai R.; Ghosh A. K.; Hamel E. Laulimalide and paclitaxel: a comparison of their effects on tubulin assembly and their synergistic action when present simultaneously. Mol. Pharmacol. 2004, 66, 113–121. 10.1124/mol.66.1.113. [DOI] [PubMed] [Google Scholar]
- Hamel E.; Day B. W.; Miller J. H.; Jung M. K.; Northcote P. T.; Ghosh A. K.; Curran D. P.; Cushman M.; Nicolaou K. C.; Paterson I.; Sorensen E. J. Synergistic effects of peloruside A and laulimalide with taxoid site drugs, but not with each other, on tubulin assembly. Mol. Pharmacol. 2006, 70, 1555–1564. 10.1124/mol.106.027847. [DOI] [PubMed] [Google Scholar]
- Clark E. A.; Hills P. M.; Davidson B. S.; Wender P. A.; Mooberry S. L. Laulimalide and synthetic laulimalide analogues are synergistic with paclitaxel and 2-methoxyestradiol. Mol. Pharm. 2006, 3, 457–467. 10.1021/mp060016h. [DOI] [PubMed] [Google Scholar]
- Wilmes A.; O’Sullivan D.; Chan A.; Chandrahasen C.; Paterson I.; Northcote P. T.; La Flamme A. C.; Miller J. H. Synergistic interactions between peloruside A and other microtubule-stabilizing and destabilizing agents in cultured human ovarian carcinoma cells and murine T cells. Cancer Chemother. Pharmacol. 2011, 68, 117–126. 10.1007/s00280-010-1461-3. [DOI] [PubMed] [Google Scholar]
- Barducci A.; Bonomi M.; Parrinello M. Metadynamics. WIREs Comput. Mol. Sci. 2011, 1, 826–843. 10.1002/wcms.31. [DOI] [Google Scholar]
- Rodríguez-Escrich C.; Urpí F.; Vilarrasa J. Stereocontrolled total synthesis of amphidinolide X via a silicon-tethered metathesis reaction. Org. Lett. 2008, 10, 5191–5194. 10.1021/ol8021676. [DOI] [PubMed] [Google Scholar]
- Trigili C.; Pera B.; Barbazanges M.; Cossy J.; Meyer C.; Pineda O.; Rodríguez-Escrich C.; Urpí F.; Vilarrasa J.; Díaz J. F.; Barasoain I. Mechanism of action of the cytotoxic macrolides amphidinolide X and J. ChemBioChem 2011, 12, 1027–1030. 10.1002/cbic.201100042. [DOI] [PubMed] [Google Scholar]
- Mola L.; Olivella A.; Urpí F.; Vilarrasa J. Synthesis of amphidinolide Y precursors. Tetrahedron Lett. 2014, 55, 900–902. 10.1016/j.tetlet.2013.12.047. [DOI] [Google Scholar]
- Sánchez D.; Andreou T.; Costa A. M.; Meyer K. G.; Williams D. R.; Barasoain I.; Díaz J. F.; Lucena-Agell D.; Vilarrasa J. Total synthesis of amphidinolide K, a macrolide that stabilizes F-actin. J. Org. Chem. 2015, 80, 8511–8519. 10.1021/acs.joc.5b00966. [DOI] [PubMed] [Google Scholar]
- Bosch L.; Mola L.; Petit E.; Saladrigas M.; Esteban J.; Costa A. M.; Vilarrasa J. Formal total synthesis of amphidinolide E. J. Org. Chem. 2017, 82, 11021–11034. 10.1021/acs.joc.7b01973. [DOI] [PubMed] [Google Scholar]
- Gaspari R.; Prota A. E.; Bargsten K.; Cavalli A.; Steinmetz M. O. Structural basis of cis- and trans-combretastatin binding to tubulin. Chem 2017, 2, 102–113. 10.1016/j.chempr.2016.12.005. [DOI] [Google Scholar]
- Peng L. X.; Hsu M. T.; Bonomi M.; Agard D. A.; Jacobson M. P. The free energy profile of tubulin straight-bent conformational changes, with implications for microtubule assembly and drug discovery. PLoS Comput. Biol. 2014, 10, e1003464 10.1371/journal.pcbi.1003464. [DOI] [PMC free article] [PubMed] [Google Scholar]
- Maccari G.; Mori M.; Rodríguez-Salarichs J.; Fang W.; Díaz J. F.; Botta M. Free energy profile and kinetics studies of paclitaxel internalization from the outer to the inner wall of microtubules. J. Chem. Theory Comput. 2013, 9, 698–706. 10.1021/ct3006612. [DOI] [PubMed] [Google Scholar]
- Löwe J.; Li H.; Downing K. H.; Nogales E. Refined structure of αβ-tubulin at 3.5 Å resolution. J. Mol. Biol. 2001, 313, 1045–1057. 10.1006/jmbi.2001.5077. [DOI] [PubMed] [Google Scholar]
- Nogales E.; Wolf S. G.; Downing K. H. Structure of the αβ-tubulin dimer by electron crystallography. Nature 1998, 391, 199–203. 10.1038/34465. [DOI] [PubMed] [Google Scholar]
- Zhang R.; Alushin G. M.; Brown A.; Nogales E. Mechanistic origin of microtubule dynamic instability and its modulation by EB proteins. Cell 2015, 162, 849–859. 10.1016/j.cell.2015.07.012. [DOI] [PMC free article] [PubMed] [Google Scholar]
- Abdel-Azeim S.; Chermak E.; Vangone A.; Oliva R.; Cavallo L. MDcons: Intermolecular contact maps as a tool to analyze the interface of protein complexes from molecular dynamics trajectories. BMC Bioinf. 2014, 15, S1. 10.1186/1471-2105-15-s5-s1. [DOI] [PMC free article] [PubMed] [Google Scholar]
- Abraham M. J.; Murtola T.; Schulz R.; Páll S.; Smith J. C.; Hess B.; Lindahl E. Gromacs: high performance molecular simulations through multi-level parallelism from laptops to supercomputers. SoftwareX 2015, 1–2, 19–25. 10.1016/j.softx.2015.06.001. [DOI] [Google Scholar]
- Kumari R.; Kumar R.; Lynn A. g_mmpbsa—A GROMACS tool for high-throughput MM-PBSA calculations. J. Chem. Inf. Model. 2014, 54, 1951–1962. 10.1021/ci500020m. [DOI] [PubMed] [Google Scholar]