Abstract
Low-cost, stable, highly sensitive, and easy-to-equip fluorescent high-pressure sensors are always attractive in both industrial and scientific communities. Organic emitting materials with pressure-dependent bathochromisms usually exhibit prominent mechanoluminescence, due to disturbance of intermolecular packing. This hinders their applications in stable and robust pressure sensing. In this work, we have developed a mechanically stable organic molecular pressure sensor, caused by intramolecular consecutive rotations by pressure, which exhibit large and eye-detectable emission bathochromism from yellow-green to red fluorescence and can be used for 0–15 GPa pressure sensing. The emission bathochromism shows good linear relationship with pressure, exhibiting a high linear coefficient of 9.1 nm/GPa. Moreover, this molecular sensor exhibits high thermal and mechanical stabilities, indicating good potentials for robust and outdoor applications.
1. Introduction
High pressure is essential in modern industry and scientific research, such as the explosive evaluation of military weapons, geological/biological/deep-sea/outer space research or exploration, ultraprecision manufacturing, investigation of phase diagram/transition/structural revolution, study of thermodynamic/electric/magnetic/optical behavior in extreme environment, and pressure-driven synthesis or reaction (i.e., synthesis of artificial diamond).1 Therefore, real-time, accurate and rapid detection of high pressure has become an important issue.
Pressure sensors are generally designed on the basis of different transduction mechanisms, including piezoresistivity,2 piezocapacitance,3 piezoelectricity,4 and piezotronic or piezo-optical effects.5 These devices exhibit superior performances but mostly work in a limited detection range.4a,6 High-pressure sensors, which can detect pressures beyond 500 MPa, are still quite limited. To measure high pressure, the electric sensors require complicated signal processing circuits and extra pressure overload protection.7 Optical sensors using diamond anvil cell (DAC) can easily compress materials to high pressures up to several hundred gigapascals and offer a noncontact way of remote, fast, and in situ high-pressure monitoring under extreme conditions, by integration of the pressure-sensitive DAC component with normal optical detecting instruments.
The pressure can be determined by using fluorescence wavelength shift,8,9 Raman wavelength shift,1i,10 synchrotron X-ray diffractions signals,1d or luminescence lifetime.11 Using Raman shift, fluorescence lifetime, or synchrotron X-ray signals of metals provides accurate high-pressure detection but requires complicated and expensive equipment. In comparison, luminescent sensors are cost effective. However, the mostly used inorganic ruby sensors have defects of peak broadening, overlap of the two lines of the doublet fluorescence, as well as series crosstalk of pressure and temperature effects caused by the shift of emission positions at elevating temperatures.9 The alternative SrB4O7/Sm2+ exhibits pressure-sensitive fluorescence shift with negligible temperature dependence. Nevertheless, the mismatch of yield strength and elastic property between the pressure sensor and the coexisting sample remains a big problem.12 In addition, for both sensors, the fluorescence shift with pressure is quite small (within 10 nm when increasing to 30 GPa); thus, the sensitivity is limited and the crosstalk, if there is, between pressure and other factors (i.e., thermo) cannot be ignored. Moreover, these inorganic materials are expensive and intrinsically brittle, which cannot be used for cheap and flexible applications.13 Therefore, low-cost, sensitive, and reliable optical high-pressure sensors are highly in demand.
Organic sensors are always regarded as good potential alternatives due to many advantages, such as low-cost preparation, good flexibility, and large-area fabrication. In recent years, very few organic materials have been reported to exhibit significant piezochromism, caused by change of crystal structures (relating to different intermolecular packing).14 However, these materials always exhibit prominent mechanoluminescence properties under smashing or grinding, due to the easy disturbance of weak noncovalent interactions between molecules. Some of them even show significant emission color change upon heating. Moreover, most of the organic fluorophores exhibit significant emission quenching under high pressures. All of these limitations hinder their applications for robust and stable pressure sensing.
A few publications have demonstrated that some organic compounds show significant piezochromic behavior due to disturbance of the energy level arrangements.14e,15 In our previous work, we found that a few organic chromophores exhibit pressure-dependent spectra caused by change in molecular configuration.16 Herein, on the basis of the mechanism of pressure-induced intramolecular rotations, an organic molecular gauge exhibiting significant pressure-dependent bathochromism with good mechanical and thermal stabilities has been demonstrated. This molecular sensor shows eye-detectable yellow-green to red luminescence color change over a wide pressure range from 0 to 15 GPa, suggesting good potentials for low-cost, easily prepared, and reliable pressure sensing.
2. Results and Discussion
The DAAD compound has been prepared by Knoevenagel condensation of [9,9′-bianthracene]-10,10′-dicarbaldehyde and malononitrile under the catalysis of weak alkali (Scheme 1).17 The molecular structures and purities are confirmed by 1H and 13C NMR spectroscopies and mass spectroscopy (see the synthesis details and full molecular characterizations in the Experimental Section). DAAD shows almost identical absorption profiles in polar and nonpolar solvents, with the maximum absorption peaks at 440 nm. However, the emission maximum varies significantly with solvent polarity (Figure 1a), characteristics of charge transfer property. To investigate the pressure-dependent spectroscopic change of DAAD, poly(methyl methacrylate) (PMMA) was used as the molecularly dispersed polymer matrix. Under ambient pressure, the maximum absorption of the film peaks at 445 nm, similar to those in solutions. The emission maximum of the doped film is 569 nm, which is similar to that in ethyl acetate solvent (Figure 1b), indicating a moderate solid–solvent polarity.
Scheme 1. Synthetic Routes of DAAD.
Figure 1.
(a) Normalized absorption and emission spectra of DAAD in solutions (1.0 × 10⁻⁵ mol/L, λex = 420 nm) and (b) in film (0.5 wt % dispersed in PMMA matrix).
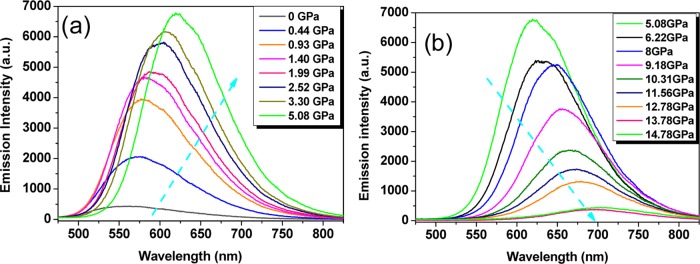
Although the yellow-green emission of the film is weak, exhibiting a low photoluminescence quantum yield of 2%, it can be abnormally enhanced when gradually increasing the applied static pressure (Figure 2a). At 0.44 GPa, the fluorescence intensity significantly increased by almost 5 times. When the applied pressure increases to 5.08 GPa, the photoluminescence quantum efficiency reaches a maximum value of 32%, with the total fluorescence intensity increased by 16 times. During this emission-increasing process, the emission spectra clearly show a gradual red shift with the emission maximum from 563 nm at 0 GPa to 620 nm at 5.08 GPa. On further increasing the applied pressure, the emission bathochromism keeps on while the emission intensity begins to drop. As the applied pressure increases from 5.08 to 14.78 GPa, the emission maximum gradually shifts from 620 to 704 nm with the fluorescence intensity progressively decreased by 15 times (Figure 2b). To the best of our knowledge, the overall detected pressure-dependent large bathochromism (141 nm) from yellow-green (563 nm) to red (704 nm) emission is the largest piezochromic shift of organic materials reported to date.18 More importantly, after the pressure is released, the emission maximum wavelength can return back to its original location (Figure S1). The spectrum at the reverse 0 GPa (r0 GPa) corresponds to the emission maximum of 565 nm, which is quite similar to that at 0 GPa (563 nm) before the pressure-increasing process. This indicates almost no hysteresis and potentially frequent application of the sensor. Using polystyrene (PS) as the polymer matrix, the pressure-dependent emission spectra exhibit a similar change tendency (Figure S2).
Figure 2.
Pressure-dependent fluorescence spectra of DAAD film (0.5 wt % dispersed in the PMMA matrix): (a) emission-increasing process and (b) emission-decreasing process.
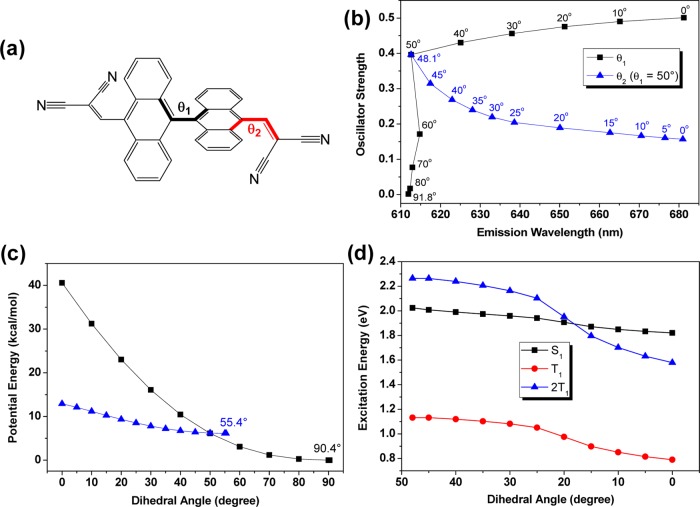
The pressure-dependent X-ray diffraction patterns indicate that the DAAD powder remains in the amorphous state with increase of applied pressure (Figure S3). Thus, the pressure-induced emission shift should not originate from change of crystalline structure. The intramolecular mechanism is more reasonable. To gain an indepth insight into the pressure effect on the photophysical properties, we carried out theoretical calculations on the DAAD molecule. The molecular geometries of the ground state (S0) and the first singlet excited state (S1) were optimized by density functional theory (DFT) and time-dependent DFT (TDDFT) at the B3LYP/6-31G** level, respectively. The two anthracene moieties at the fully optimized S0 and S1 geometries are both nearly perpendicular, with the dihedral angles (θ1) of 90.4 and 91.8°, respectively (Figure 3). This dihedral angle is much larger than those between the anthracene units and the bis(cyano)-substituted vinyl groups (θ2), which are the same for S0 (54.1°) but different for S1 (37.7 and 56.0°). The diagram of the dihedral angles of θ1 and θ2 in the molecular structure is depicted in Figure 4a.
Figure 3.
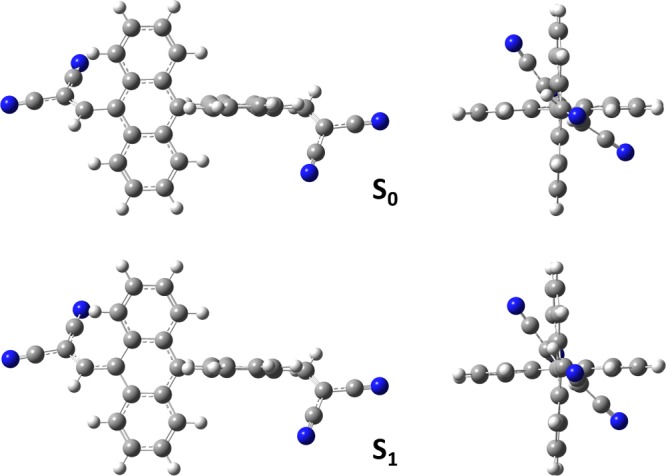
Fully optimized molecular geometries of S0 and S1 by DFT and TDDFT at the B3LYP/6-31G** level.
Figure 4.
a) Diagram of the dihedral angles of θ1 and θ2 in the molecular structure. (b) Vertical emission wavelengths and oscillator strengths of the S1 state optimized at different dihedral angles of θ1 and θ2 (black: only θ1 is fixed at different angles; blue: θ2 decreases from the optimal angle of 48.1–0° with θ1 kept at 50°). (c) Relative potential energies of the ground state optimized at different dihedral angles of θ1 and θ2 (black: only θ1 is fixed at different angles; blue: θ2 decreases from the optimal angle of 55.4 to 0° with θ1 kept at 50°). (d) Evolution of the S1 and T1 excitation energies at the optimized S1 state as a function of the dihedral angle θ2 when the dihedral angle θ1 is fixed at 50°.
When θ1 decreases from 90 to 50°, the oscillator strength for the S1 → S0 transition increases sharply (Figure 4b), which is well consistent with the experimental observation of the initial emission enhancement until the applied pressure reaches 5.08 GPa (Figure 2a). However, in contrast to the subsequent decrease of emission under higher pressure (Figure 2b), the oscillator strength continues to slowly increase if θ1 decreases from 50 to 0°. On the contrary, our calculations indicate that when θ1 is 50°, the optimized θ2 is ca. 48° and, interestingly, when θ2 is reduced from 48° with θ1 kept at 50°, the S1 → S0 oscillator strength decreases by 2 times (Figure 4b). Moreover, the potential energy surface scan shows that the molecule is more stable by decreasing θ2 (with θ1 fixed at 50°) than by continuously decreasing θ1 (<50°) (Figure 4c). That is, exerting pressure of more than 5.08 GPa will result in the decrease of θ2 rather than that of θ1. However, this is still inadequately responsible for the 15-fold decrease in the experimental fluorescence intensity when the applied pressure increases from 5.08 to 14.78 GPa. To understand the large emission decrease, we further calculated the first triplet excited state (T1) as a function of θ2 with θ1 fixed at 50° (Figure 4d). When θ2 is less than 15°, the excitation energy of S1 is found to become higher than twice the T1 excitation energy. Thus, a possible explanation is that singlet fission (SF), referring to a multiple exciton generation process that one photoexcited high-energy singlet exciton is converted into a pair of low-energy triplet excitons,19 can occur under higher pressure. This SF process can mainly account for the dramatic decrease in fluorescence intensity under high pressures of 5.08–14.78 GPa.20 Similar trends in oscillator strength, potential energy surface, and singlet–triplet energy alignment with θ2 are found when fixing θ1 at 60° (Figure S4). To conclude, as the pressure increases, the torsion between the two anthracene rings will first be reduced, leading to gradually enhanced and bathochromic emission. Then, the torsion between the anthracene ring and bis(cyano)-substituted vinyl group will become smaller, leading to continuous red-shift emission and subsequent emission quenching due to the combinatorial effects of enhanced singlet fission and decreased oscillator strength.
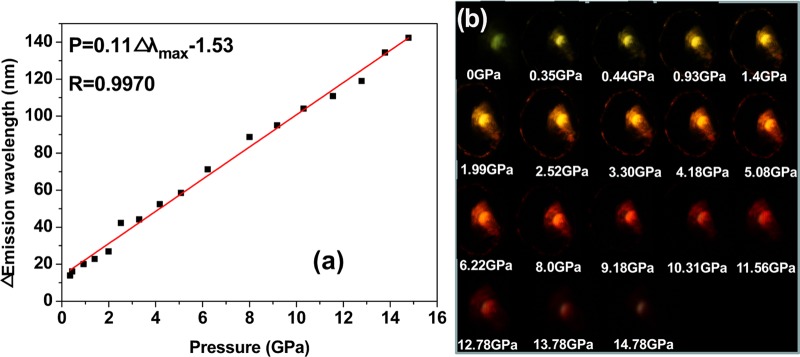
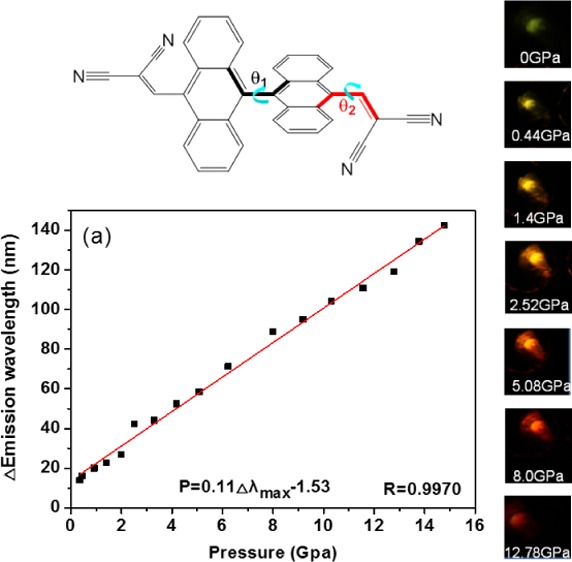
On the basis of the large pressure-dependent bathochromism, it is expected to establish a precise sensing of pressure. The curve based on the change of maximum emission wavelength with pressure was calibrated, which shows a good linear relationship fitted as a function of P = 0.11Δλmax – 1.53 with correlation coefficient 0.9970 (Figure 5a). Here, λmax is the maximum emission wavelength (nm) and P is the applied pressure (GPa). The slope of the calibration curve provides a pressure sensitivity of dP/dλmax = 0.11 GPa/nm. The linear P coefficient is estimated to be 9.1 nm/GPa, which is more than 25 and 36 times higher than that of ruby (Al2O3/Cr3+)- and SrB4O7/Sm2+-based fluorescent sensors, respectively (see Table 1).21 It should be noted that the deviation of the fitted line from the zero point is mainly caused by the mismatch between the yield strength and the elastic property of the ruby and that of the PMMA polymer film.22 If the ruby is much harder than the sample, the determined pressure would be higher than the actual value due to stress concentration or pressure intensification.23 On increasing the pressure, the emission color shifts gradually from yellow-green to red (Figure 5b), which agrees well with the pressure-dependent emission spectra. Under ambient pressure, it gives a faint yellow-green emission. With pressure increasing from 0.35 to 1.4 GPa, the film emission shifts to yellow with gradual enhancement in emission intensity. Then, the emission becomes orange at 1.99–3.30 GPa and orange-red at 4.18–5.08 GPa with continuously increasing intensity. When increasing the pressure to higher than 6.22 GPa, the emission color turns red and finally to deep red with the emission intensity gradually decreasing.
Figure 5.
(a) Relationship of emission maximum shift with pressure. (b) Photographic images of the illuminated DAAD film under different pressures.
Table 1. Summary of the Physical Parameters for the Optical Pressure Sensor.
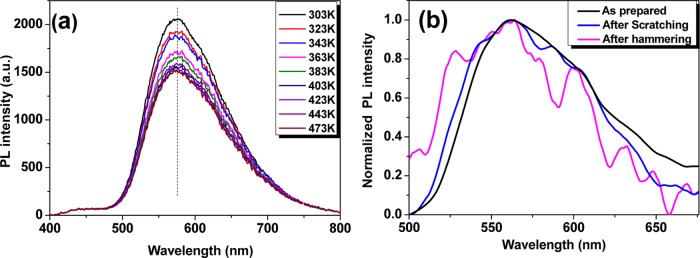
More importantly, this film is thermally and mechanically stable and is chemically resistant to corrosive media due to protection of the PMMA matrix. With increase in the ambient temperature to 473 K, the emission maximum shows almost no shift, with the emission intensity still remaining 75% of that at room temperature (Figure 6a). Moreover, the emission color of the pressure-sensitive film did not change under scratching or violent hammering (Figure 6b). Considering the regulatory restriction of the heating accessory system, the applicable range can be extended to higher temperatures. The eye-detectable large bathochromism, high linear P coefficient, high mechanical resistance, and wide applicable temperature range indicate great potentials for facile and robust outdoor applications, such as portable devices, geological exploration, and fieldwork, as well as harsh-environment pressure sensing by integration with optical fiber-based techniques.
Figure 6.
(a) Temperature-dependent emission spectra of the DAAD film. (b) PL spectra before and after scratching or violent hammering.
3. Conclusions
In summary, a naked-eye organic luminescent high-pressure sensor with large bathochromism has been developed on the basis of specific molecular dual-rotators via consecutive intramolecular conformational planarization. When the central large dihedral angle of the molecule was pressed smaller to some extent, the side dihedral angle then began to be pressed. This pressure sensor can be applied in high pressure range up to 15 GPa, with a high linear P coefficient of 9.1 nm/GPa. Significant emission color change, high mechanical and thermal stabilities, as well as good film-forming abilities make it suitable for eye-detectable rough pressure sensing and facile outdoor applications. Moreover, the large emission chromism at single molecular level is prospective for future high-resolution spatial pressure sensing.
4. Experimental Section
4.1. Materials and Film Preparation
Zinc power and 1,1-dichlorodimethyl ether were purchased from Energy Chemical. Zinc chloride was purchased from aladdin. Poly(methyl methacrylate) and polystyrene were purchased from Sigma-Aldrich. 9,9-Bianthracene was obtained through an addition reaction of 9-anthrone to a suspension of Zn powder and ZnCl2, according to the previously published literature.ref24 PMMA (medium molecular weight of 400 000) was purchased from Aldrich and used after reprecipitation. Spectral-grade chloroform was used as solvent to dissolve the DAAD compounds and PMMA. To prepare films, PMMA and DAAD were dissolved in chloroform and the solution was poured into a glass dish to form a uniform film after solvent evaporation at room temperature. The film was then placed in a vacuum oven for a few days at 45 °C. Transparent blended film with a low concentration (0.5 wt %) of dispersed DAAD was obtained and was optically clear without phase separation.
4.2. Instrumental Methods
The NMR spectra were recorded on a Bruker AV 400 MHz NMR spectrometer. Mass spectra were collected using a Microflex matrix-assisted laser desorption ionization time-of-flight (MALDI-TOF) mass spectrometer (Bruker Daltonics, Germany). UV–vis absorption and PL spectra were recorded on Hitachi UV-3010 and Hitachi F-7000 spectrometers, respectively. The film fluorescence quantum yields were measured using an Edinburgh FLSP920 spectrometer with an integration sphere. A Merrill–Bassett diamond anvil cell (DAC) was used to generate high pressure. The hole diameter of the gasket holding the sample was about 300 μm, with a thickness of about 90 μm. A small chip of ruby was placed in the hole to calibrate the pressure by measuring its fluorescence red shift. Light mineral oil served as a pressure medium. The DAC containing the sample was placed under a Nikon fluorescence microscope to focus the laser onto the sample. Emission spectra were obtained from an Ocean Optics HR4000 spectrometer by using a monochromator equipped with a photomultiplier. The maximum emission wavelength is determined by the numerical maximum.
4.3. Synthesis of [9,9′-Bianthracene]-10,10′-dicarbaldehyde
A solution of TiCl4 (1.7 mL, 15 mmol, 1.8 equiv) in CH2Cl2 (2 mL) was added to a solution of 9,9-bianthracene (3 g, 8.4 mmol, 1 equiv) and 1,1-dichlorodimethyl ether (2.54 g, 22 mmol, 1.3 equiv) in CH2Cl2 (100 mL) at 0 °C. The mixture was stirred for 1 h at 0 °C and 2 h at room temperature. The reaction was poured into ice water and extracted with CH2Cl2. The organic layer was washed with water, dried over MgSO4, and concentrated, providing the product without further purification (3.34 g, 97%). 1H NMR (400 MHz, CDCl3): δ 11.65 (s, 2H), 9.04–9.01 (d, J = 12 Hz, 4H), 7.64–7.59 (m, 4H), 7.21–7.19 (m, 4H), 7.18–7.03 (m, 4H). MALDI-TOF MS (m/z): 409.734 [M]+.
4.4. Synthesis of DAAD
A solution of malononitrile (0.38 g, 5.9 mmol, 2.4 equiv) in ethanol (10 mL) was added to a solution of [9,9′-bianthracene]-10,10′-dicarbaldehyde (1 g, 2.4 mmol, 1 equiv) and piperidine (0.3 mL, 2.4 mmol, 1 equiv) in ethanol (20 mL) at 65 °C, and the mixture was stirred for 2 h. The reaction was poured into ice water and extracted with CH2Cl2. The organic layer was washed with water and dried over MgSO4. Purification by recrystallization provided 1.02 g DAAD (83%). 1H NMR (400 MHz, CDCl3): δ 9.12 (s, 2H), 8.09–8.07 (d, J = 8.8 Hz, 4H), 7.69–7.65 (m, 4H), 7.31–7.28 (m, 3H), 7.12–7.10 (d, J = 8.8 Hz, 4H). 13C NMR (400 MHz, CDCl3): δ 160.72, 137.83, 130.77, 128.72, 128.39, 127.73, 127.05, 124.81, 124.32, 112.86, 111.39, 93.40; HRMS (EI): calcd for C36H18N4 [M]+ 506.1531; found 506.1526.
Acknowledgments
We sincerely thank Prof. Bo Zou for measuring the pressure-dependent emission spectra and photographs. We also thank the National Natural Science Foundation of China (Grant Nos. 2162780049, 21627802, 21373114, 21573111, and 21233011), National Basic Research Program (2013CB834505, 2013CB834703), the Foundation Supported by Science Challenge Project (No. TZ2016001), the Priority Academic Program Development of Jiangsu Higher Education Institutions (PAPD, YX03001), Jiangsu National Synergetic Innovation Center for Advanced Materials (SICAM), Synergetic Innovation Center for Organic Electronics and Information Displays, the Six Peak Talents Foundation of Jiangsu Province (No. XCL-CXTD-009), Qing Lan Project, and NUPT 1311 project for their financial support.
Supporting Information Available
The Supporting Information is available free of charge on the ACS Publications website at DOI: 10.1021/acsomega.7b01746.
Emission spectra and photographs during the pressure-decompressed process, pressure-dependent fluorescence spectra of DAAD dispersed in the PS matrix, evolution of the S1 and T1 excitation energies at the optimized S1 state as a function of θ2 when fixing θ1 at 60° (PDF)
The authors declare no competing financial interest.
Supplementary Material
References
- a Mao H. K.; Bell P. M. High-Pressure Physics: The 1-Megabar Mark on the Ruby R1 Static Pressure Scale. Science 1976, 191, 851–852. 10.1126/science.191.4229.851. [DOI] [PubMed] [Google Scholar]; b Datchi F.; Weck G.; Saitta A. M.; Raza Z.; Garbarino G.; Ninet S.; Spaulding D. K.; Queyroux J. A.; Mezouar M. Structure of liquid carbon dioxide at pressures up to 10 GPa. Phys. Rev. B 2016, 94, 014201 10.1103/PhysRevB.94.014201. [DOI] [Google Scholar]; c Likhacheva A. Y.; Rashchenko S. V.; Litasov K. D. High-pressure structural properties of naphthalene up to 6 GPa. J. Appl. Crystallogr. 2014, 47, 984–991. 10.1107/S1600576714005937. [DOI] [Google Scholar]; d Dewaele A.; Datchi F.; Loubeyre P.; Mezouar M. High pressure-high temperature equations of state of neon and diamond. Phys. Rev. B 2008, 77, 094106 10.1103/PhysRevB.77.094106. [DOI] [Google Scholar]; e Moggach S. A.; Parsons S.; Wood P. A. High-pressure polymorphism in amino acids. Crystallogr. Rev. 2008, 14, 143–183. 10.1080/08893110802037945. [DOI] [Google Scholar]; f Itié J. P.; Girard E.; Guignot N.; Le Godec Y.; Mezouar M. Crystallography under high pressure using synchrotron radiation. J. Phys. D: Appl. Phys. 2015, 48, 504007 10.1088/0022-3727/48/50/504007. [DOI] [Google Scholar]; g Ayrinhac S.; Gauthier M.; Le Marchand G.; Morand M.; Bergame F.; Decremps F. Thermodynamic properties of liquid gallium from picosecond acoustic velocity measurements. J. Phys.: Condens. Matter 2015, 27, 275103 10.1088/0953-8984/27/27/275103. [DOI] [PubMed] [Google Scholar]; h Spaulding D. K.; Weck G.; Loubeyre P.; Datchi F.; Dumas P.; Hanfland M. Pressure-induced chemistry in a nitrogen-hydrogen host-guest structure. Nat. Commun. 2014, 5, 5739 10.1038/ncomms6739. [DOI] [PubMed] [Google Scholar]; i Occelli F.; Loubeyre P.; Letoullec R. Properties of diamond under hydrostatic pressures up to 140 GPa. Nat. Mater. 2003, 2, 151–154. 10.1038/nmat831. [DOI] [PubMed] [Google Scholar]
- a Pang C.; Lee G.-Y.; Kim T.-i.; Kim S. M.; Kim H. N.; Ahn S.-H.; Suh K.-Y. A flexible and highly sensitive strain-gauge sensor using reversible interlocking of nanofibres. Nat. Mater. 2012, 11, 795–801. 10.1038/nmat3380. [DOI] [PubMed] [Google Scholar]; b Pan L.; Chortos A.; Yu G.; Wang Y.; Isaacson S.; Allen R.; Shi Y.; Dauskardt R.; Bao Z. An ultra-sensitive resistive pressure sensor based on hollow-sphere microstructure induced elasticity in conducting polymer film. Nat. Commun. 2014, 5, 3002 10.1038/ncomms4002. [DOI] [PubMed] [Google Scholar]; c Shao Q.; Niu Z.; Hirtz M.; Jiang L.; Liu Y.; Wang Z.; Chen X. High-Performance and Tailorable Pressure Sensor Based on Ultrathin Conductive Polymer Film. Small 2014, 10, 1466–1472. 10.1002/smll.201303601. [DOI] [PubMed] [Google Scholar]; d Zhu B.; Niu Z.; Wang H.; Leow W. R.; Wang H.; Li Y.; Zheng L.; Wei J.; Huo F.; Chen X. Microstructured Graphene Arrays for Highly Sensitive Flexible Tactile Sensors. Small 2014, 10, 3625–3631. 10.1002/smll.201401207. [DOI] [PubMed] [Google Scholar]; e Zhu B.; Wang H.; Liu Y.; Qi D.; Liu Z.; Wang H.; Yu J.; Sherburne M.; Wang Z.; Chen X. Skin-Inspired Haptic Memory Arrays with an Electrically Reconfigurable Architecture. Adv. Mater. 2016, 28, 1559–1566. 10.1002/adma.201504754. [DOI] [PubMed] [Google Scholar]
- a Lipomi D. J.; Vosgueritchian M.; Tee B. C. K.; Hellstrom S. L.; Lee J. A.; Fox C. H.; Bao Z. Skin-like pressure and strain sensors based on transparent elastic films of carbon nanotubes. Nat. Nanotechnol. 2011, 6, 788–792. 10.1038/nnano.2011.184. [DOI] [PubMed] [Google Scholar]; b Takei K.; Takahashi T.; Ho J. C.; Ko H.; Gillies A. G.; Leu P. W.; Fearing R. S.; Javey A. Nanowire active-matrix circuitry for low-voltage macroscale artificial skin. Nat. Mater. 2010, 9, 821–826. 10.1038/nmat2835. [DOI] [PubMed] [Google Scholar]
- a Wang C.; Hwang D.; Yu Z.; Takei K.; Park J.; Chen T.; Ma B.; Javey A. User-interactive electronic skin for instantaneous pressure visualization. Nat. Mater. 2013, 12, 899–904. 10.1038/nmat3711. [DOI] [PubMed] [Google Scholar]; b Pan C.; Dong L.; Zhu G.; Niu S.; Yu R.; Yang Q.; Liu Y.; Wang Z. L. High-resolution electroluminescent imaging of pressure distribution using a piezoelectric nanowire LED array. Nat. Photonics 2013, 7, 752–758. 10.1038/nphoton.2013.191. [DOI] [Google Scholar]
- a Sekitani T.; Yokota T.; Zschieschang U.; Klauk H.; Bauer S.; Takeuchi K.; Takamiya M.; Sakurai T.; Someya T. Organic Nonvolatile Memory Transistors for Flexible Sensor Arrays. Science 2009, 326, 1516–1519. 10.1126/science.1179963. [DOI] [PubMed] [Google Scholar]; b Kim D.-H.; Lu N.; Ma R.; Kim Y.-S.; Kim R.-H.; Wang S.; Wu J.; Won S. M.; Tao H.; Islam A.; Yu K. J.; Kim T.-i.; Chowdhury R.; Ying M.; Xu L.; Li M.; Chung H.-J.; Keum H.; McCormick M.; Liu P.; Zhang Y.-W.; Omenetto F. G.; Huang Y.; Coleman T.; Rogers J. A. Epidermal Electronics. Science 2011, 333, 838–843. 10.1126/science.1206157. [DOI] [PubMed] [Google Scholar]
- Sekitani T.; Zschieschang U.; Klauk H.; Someya T. Flexible organic transistors and circuits with extreme bending stability. Nat. Mater. 2010, 9, 1015–1022. 10.1038/nmat2896. [DOI] [PubMed] [Google Scholar]
- Zhao Y.; Fang X.; Jiang Z.; Zhao L. An ultra-high pressure sensor based on SOI piezoresistive material. J. Mech. Sci. Technol. 2010, 24, 1655–1660. 10.1007/s12206-010-0515-0. [DOI] [Google Scholar]
- Mao H. K.; Xu J.; Bell P. M. Calibration of The Ruby Pressure Gauge to 800-Kbar Under Quasi-Hydrostatic Conditions. J. Geophys. Res. 1986, 91, 4673–4676. 10.1029/JB091iB05p04673. [DOI] [Google Scholar]
- Lacam A.; Chateau C. High-Pressure Measurements at Moderate Temperatures in a Diamond Anvil Cell with a New Optical Sensor - SrB4O7-Sm2+. J. Appl. Phys. 1989, 66, 366–372. 10.1063/1.343884. [DOI] [Google Scholar]
- Schmidt C.; Ziemann M. A. In-Situ Raman Spectroscopy of Quartz: A Pressure Sensor for Hydrothermal Diamond-Anvil Cell Experiments at Elevated Temperatures. Am. Mineral. 2000, 85, 1725–1734. 10.2138/am-2000-11-1216. [DOI] [Google Scholar]
- Stich M. I. J.; Nagl S.; Wolfbeis O. S.; Henne U.; Schaeferling M. A Dual Luminescent Sensor Material for Simultaneous Imaging of Pressure and Temperature on Surfaces. Adv. Funct. Mater. 2008, 18, 1399–1406. 10.1002/adfm.200701199. [DOI] [Google Scholar]
- Jing Q.; Wu Q.; Liu L.; Xu J.-a.; Bi Y.; Liu Y.; Chen H.; Liu S.; Zhang Y.; Xiong L.; Li Y.; Liu J. An Experimental Study on SrB4O7:Sm2+ as a Pressure Sensor. J. Appl. Phys. 2013, 113, 023507 10.1063/1.4774113. [DOI] [Google Scholar]
- a Qian Y.; Zhang X.; Xie L.; Qi D.; Chandran B. K.; Chen X.; Huang W. Stretchable Organic Semiconductor Devices. Adv. Mater. 2016, 28, 9243–9265. 10.1002/adma.201601278. [DOI] [PubMed] [Google Scholar]; b Qian Y.; Zhang X.; Qi D.; Xie L.; Chandran B. K.; Chen X.; Huang W. Thin-Film Organic Semiconductor Devices: From Flexibility to Ultraflexibility. Sci. China Mater. 2016, 59, 589–608. 10.1007/s40843-016-5091-1. [DOI] [Google Scholar]
- a Zhang Y.; Wang K.; Zhuang G.; Xie Z.; Zhang C.; Cao F.; Pan G.; Chen H.; Zou B.; Ma Y. Multicolored-Fluorescence Switching of ICT-Type Organic Solids with Clear Color Difference: Mechanically Controlled Excited State. Chem. - Eur. J. 2015, 21, 2474–2479. 10.1002/chem.201405348. [DOI] [PubMed] [Google Scholar]; b Wang L.; Wang K.; Zou B.; Ye K.; Zhang H.; Wang Y. Luminescent Chromism of Boron Diketonate Crystals: Distinct Responses to Different Stresses. Adv. Mater. 2015, 27, 2918–2922. 10.1002/adma.201500589. [DOI] [PubMed] [Google Scholar]; c Sagara Y.; Yamane S.; Mitani M.; Weder C.; Kato T. Mechanoresponsive Luminescent Molecular Assemblies: An Emerging Class of Materials. Adv. Mater. 2016, 28, 1073–1095. 10.1002/adma.201502589. [DOI] [PubMed] [Google Scholar]; d Nagura K.; Saito S.; Yusa H.; Yamawaki H.; Fujihisa H.; Sato H.; Shimoikeda Y.; Yamaguchi S. Distinct Responses to Mechanical Grinding and Hydrostatic Pressure in Luminescent Chromism of Tetrathiazolylthiophene. J. Am. Chem. Soc. 2013, 135, 10322–10325. 10.1021/ja4055228. [DOI] [PubMed] [Google Scholar]; e Li H.; Zhong B.; He L. M.; Yang G. Q.; Li Y.; Wu S. K.; Liu J. High Pressure Effects on the Luminescent Properties and Structure of Coumarin 153. Appl. Phys. Lett. 2002, 80, 2299–2301. 10.1063/1.1465524. [DOI] [Google Scholar]; f Li H.; He L. M.; Zhong B.; Li Y.; Wu S. K.; Liu J.; Yang G. Q. High Pressure Effects on the Emission Properties and Crystal Structure of Coumarin 120. ChemPhysChem 2004, 5, 124–127. 10.1002/cphc.200300816. [DOI] [PubMed] [Google Scholar]
- a Mitchell D. J.; Schuster G. B.; Drickamer H. G. Effect of Pressure on the Fluorescence of 9-Carbonyl Substituted Anthracenes. J. Am. Chem. Soc. 1977, 99, 1145–1148. 10.1021/ja00446a029. [DOI] [Google Scholar]; b Tanka J.; Koda T.; Shionoya S.; Minomura S. The Effect of Pressure on the Fluorescence Spectra of Anthracene, Chrysene and Pyrene. Bull. Chem. Soc. Jpn. 1965, 38, 1559–1560. 10.1246/bcsj.38.1559. [DOI] [Google Scholar]; c Drickamer H. G. High-Pressure Studies of Molecular Luminescence. Annu. Rev. Phys. Chem. 1982, 33, 25–47. 10.1146/annurev.pc.33.100182.000325. [DOI] [Google Scholar]; d Rollinson A. M.; Drickamer H. G. High-pressure study of luminescence from intramolecular CT compounds. J. Chem. Phys. 1980, 73, 5981–5996. 10.1063/1.440132. [DOI] [Google Scholar]
- a Wang Q.; Li S.; He L.; Qian Y.; Li X.; Sun W.; Liu M.; Li J.; Li Y.; Yang G. Pressure-Induced Emission Enhancement of a Series of Dicyanovinyl-Substituted Aromatics: Pressure Tuning of the Molecular Population with Different Conformations. Chemphyschem 2008, 9, 1146–1152. 10.1002/cphc.200700837. [DOI] [PubMed] [Google Scholar]; b Sun W.; Li S. Y.; Hu R.; Qian Y.; Wang S. Q.; Yang G. Q. Understanding Solvent Effects on Luminescent Properties of a Triple Fluorescent ESIPT Compound and Application for White Light Emission. J. Phys. Chem. A 2009, 113, 5888–5895. 10.1021/jp900688h. [DOI] [PubMed] [Google Scholar]
- Kumpf J.; Schwaebel S. T.; Bunz U. H. F. Amine Detection with Distyrylbenzenedialdehyde-Based Knoevenagel Adducts. J. Org. Chem. 2015, 80, 5159–5166. 10.1021/acs.joc.5b00577. [DOI] [PubMed] [Google Scholar]
- Dong Y.; Xu B.; Zhang J.; Tan X.; Wang L.; Chen J.; Lv H.; Wen S.; Li B.; Ye L.; Zou B.; Tian W. Piezochromic Luminescence Based on the Molecular Aggregation of 9,10-Bis((E)-2-(pyrid-2-yl)vinyl)anthracene. Angew. Chem., Int. Ed. 2012, 51, 10782–10785. 10.1002/anie.201204660. [DOI] [PubMed] [Google Scholar]
- a Xia J.; Sanders S. N.; Cheng W.; Low J. Z.; Liu J.; Campos L. M.; Sun T. Singlet Fission: Progress and Prospects in Solar Cells. Adv. Mater. 2017, 29, 1601652 10.1002/adma.201601652. [DOI] [PubMed] [Google Scholar]; b Zhang Y.-D.; Wu Y.; Xu Y.; Wang Q.; Liu K.; Chen J.-W.; Cao J.-J.; Zhang C.; Fu H.; Zhang H.-L. Excessive Exoergicity Reduces Singlet Exciton Fission Efficiency of Heteroacenes in Solutions. J. Am. Chem. Soc. 2016, 138, 6739–6745. 10.1021/jacs.6b03829. [DOI] [PubMed] [Google Scholar]; c Sanders S. N.; Kumarasamy E.; Pun A. B.; Appavoo K.; Steigerwald M. L.; Campos L. M.; Sfeir M. Y. Exciton Correlations in Intramolecular Singlet Fission. J. Am. Chem. Soc. 2016, 138, 7289–7297. 10.1021/jacs.6b00657. [DOI] [PubMed] [Google Scholar]
- Zeng T.; Ananth N.; Hoffmann R. Seeking Small Molecules for Singlet Fission: A Heteroatom Substitution Strategy. J. Am. Chem. Soc. 2014, 136, 12638–12647. 10.1021/ja505275m. [DOI] [PubMed] [Google Scholar]
- a Datchi F.; Dewaele A.; Loubeyre P.; Letoullec R.; Le Godec Y.; Canny B. Optical Pressure Sensors for High-Pressure-High-Temperature Studies in a Diamond Anvil Cell. High Pressure Res. 2007, 27, 447–463. 10.1080/08957950701659593. [DOI] [Google Scholar]; b Hess N. J.; Schiferl D. Pressure and Temperature-Dependence of Laser-Induced Fluorescence of Sm: YAG to 100 Kbar and 700 °C and an Empirical-Model. J. Appl. Phys. 1990, 68, 1953–1960. 10.1063/1.346593. [DOI] [Google Scholar]; c Zhao Y. C.; Barvosa-Carter W.; Theiss S. D.; Mitha S.; Aziz M. J.; Schiferl D. Pressure measurement at high temperature using ten Sm: YAG fluorescence peaks. J. Appl. Phys. 1998, 84, 4049–4059. 10.1063/1.368693. [DOI] [Google Scholar]
- a Conil N.; Kavner A. Elastic Behavior and Strength of Al2O3 Fiber/Al Matrix Composite and Implications for Equation of State Measurements in The Diamond Anvil Cell. J. Appl. Phys. 2006, 100, 043517 10.1063/1.2234556. [DOI] [Google Scholar]; b Wang J.; He D.; Duffy T. S. Stress State of Diamond and Gold Under Nonhydrostatic Compression to 360 Gpa. J. Appl. Phys. 2010, 108, 063521 10.1063/1.3485828. [DOI] [Google Scholar]
- Sung C. M.; Goetze C.; Mao H. K. Pressure Distribution in the Diamond Danvil and Shear Press Strength of Fayalite. Rev. Sci. Instrum. 1977, 48, 1386. 10.1063/1.1134902. [DOI] [Google Scholar]
- Natarajan P.; Schmittel M. Photoluminescence, Redox Properties, and Electrogenerated Chemiluminescence of Twisted 9,9′-Bianthryls. J. Org. Chem. 2013, 78, 10383. 10.1021/jo401785c. [DOI] [PubMed] [Google Scholar]
Associated Data
This section collects any data citations, data availability statements, or supplementary materials included in this article.


