Abstract

Diatoms are unicellular algae of enormous biodiversity that occur in all water habitats on earth. Their cell walls are composed of amorphous biosilica and exhibit species-specific nanoporous to microporous and macroporous patterning. Therefore, diatom biosilica is a promising renewable material for various applications, such as in catalysis, drug-delivery systems, and biophotonics. In this study, diatom biosilica of three different species (Stephanopyxis turris, Eucampia zodiacus, and Thalassiosira pseudonana) was used as support material for gold nanoparticles using a covalent coupling method. The resulting catalysts were applied for the oxidation of d-glucose to d-gluconic acid. Because of its high specific surface area, well-established transport pores, and the presence of small, homogeneously distributed gold nanoparticles on the surface, diatom biosilica provides a highly catalytically active surface and advanced accessibility to the active sites. In comparison to those of the used reference supports, higher catalytic activities (up to 3.28 × 10⁻⁴ mmolGlc s–1 mgAu–1 for T. pseudonana biosilica) and slower deactivation were observed for two of the diatom biosilica materials. In addition, diatom biosilica showed very high gold-loading capacities (up to 45 wt %), with a homogeneous nanoparticle distribution.
Introduction
The oceans of the world are home to a large number of micrometer-sized, single-celled organisms. This so-called phytoplankton is the origin of the food chain in the marine ecosystem. One of the largest phytoplankton classes is diatoms, which are special unicellular eukaryotic algae.1 Their cell walls consist of amorphous biosilica, which exhibits a species-specific micro and nano patterning. These cell walls, also called valves, are formed by a biomineralization process, which is a subject of ongoing research.2−5
Because of its outstanding properties, diatom biosilica has recently attracted increasing research interest. It exhibits ordered porous structures with a relatively high specific surface area (SSA), pore volume, biocompatibility, thermal stability, and chemical inertness.6 It is built by biomineralization at a neutral pH as well as at an ambient temperature and pressure in an aqueous environment. Moreover, diatom biosilica is a renewable material, which can be produced in high quantity and purity without massive energy and material effort. Therefore, diatom biosilica can be an interesting alternative to synthetic silica materials for several applications, especially in catalysis, optics, and biophotonics, drug-delivery systems, or microfluidic applications.7 For example, Zhang et al. used palladium nanoparticles supported on diatomite to catalyze the Heck and Suzuki reaction.8 Platinum nanoparticles covalently coupled to diatom biosilica of the species Stephanopyxis turris were used in the catalysis of the redox reaction of hexacyanoferrate and sodium thiosulfate.9 Moreover, Sandhage et al. converted diatom biosilica into other materials (e.g., carbon10 and titania11) and used the resulting diatom-shaped materials for different catalytic reactions.
Biosilica is abundantly available as diatomaceous earth (DE) from the mining industry at a reasonable cost (∼30 €/kg Sigma Aldrich). However, DE contains a lot of impurities, random structures from various diatom species, and broken valves.12,13 For size-selective applications (e.g., in catalysis or filtration), it is preferable to use one pristine diatom species of a defined and well-preserved structure.
Catalysis is a key technology for industrial production and biotechnological reactions. Of all chemicals, 90% are produced via catalytic processes or intermediate steps. Especially, heterogeneous catalysis is advantageous because the separation of the catalyst from the reaction products is simple. Moreover, catalyst recycling is relatively easy.14 Therefore, the investigation of suitable catalyst support materials has become increasingly important over the last few decades.
In this work, the properties of diatom species in comparison to those of synthetic silica and DE as catalyst supports in the gold-catalyzed oxidation of d-glucose to d-gluconic acid have been investigated. d-gluconic acid is an important chemical intermediate in the pharmaceutical industry, in paper and concrete production, as well as in the food industry. Its worldwide production amounts to 100 000 t/year.15−17 Beyond enzymatic oxidation of d-glucose, recent developments have shown the great potential of heterogeneous noble metal catalysts for d-gluconic acid production. Different support materials, such as carbon, silica, and alumina, were successfully used in heterogeneous glucose oxidation, with differences in conversion, product selectivity, and long-life stability. For example, catalytic conversion with silica-supported catalysts yields no byproduct, in contrast to carbon-supported catalytic conversion under alkaline conditions, during which fructose and other sugar molecules are also formed (up to 50%).17 In particular, gold has received increasing interest for selective oxidation of functional groups (alcohols or aldehydes).18 Compared with biocatalytic systems, gold catalysts enable oxidation under mild conditions and over a wide range of pH’s. Furthermore, they provide a higher conversion and selectivity as well as a lower deactivation compared to those of other noble metals, such as platinum or palladium.15,18 Because only small gold nanoparticles with diameters of 4–7 nm showed excellent activity in oxidation reactions,19−23 presynthesized gold nanoparticles of defined size were coupled to silica in this work. This procedure has already been established for silica materials,24 especially for diatom biosilica, by different groups.9,25,26 Because of the unique diatom structure, catalysts with well-dispersed nanoparticles could be synthesized, showing promising performance in the oxidation of d-glucose.
Results and Discussion
Structures of Different Silica Materials
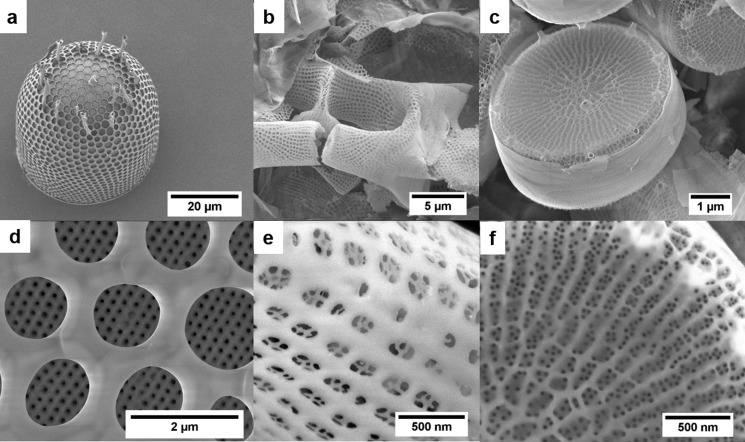
Biosilica from three different diatom species was investigated: Stephanopyxis turris (S. turris, ST), Eucampia zodiacus (E. zodiacus, EZ), and Thalassiosira pseudonana (T. pseudonana, TP). Diatoms were cultivated in artificial seawater under defined conditions, as described in the Supporting Information. After cell wall extraction in sodium dodecyl sulfate (SDS)/ethylenediaminetetraacetic acid (EDTA), calcination was performed for 5 h at 550 °C under air atmosphere. This treatment led to the formation of pure silica and maintained the unique structure of the diatom cell walls. All investigated species are saltwater diatoms, which belong to the class Centrales. S. turris is the largest species, with a valve diameter of about 50 μm. The valves exhibit a hierarchical pore architecture and show a honeycomb-like structure with hexagonal chambers and a silica layer with a highly regular pore pattern at the bottom (Figure 1a,d).26,27 Calcined S. turris biosilica has a SSA of 56 m2 g–1 and a pore volume of 0.15 cm3 g–1 (Table 2). E. zodiacus biosilica exhibits submicron-sized pores of squared appearance, which further exhibit an array of even smaller pores (Figure 1b,e). T. pseudonana has cell walls of sizes between 5 and 10 μm. The valves are cylindrical and contain ridges and pores with relatively uniform diameters of approximately 20 nm. Rimoportulae and fultoportulae with tubelike structures are located at the rim of each valve and in the central area (Figure 1c,f).3 Calcined biosilica of E. zodiacus and T. pseudonana exhibit SSAs of approximately 100 m2 g–1 and pore volumes of 0.30 and 0.40 cm3 g–1, respectively (Table 2).
Figure 1.
Scanning electron microscopy (SEM) images of S. turris (a, d), E. zodiacus (b, e), and T. pseudonana (c, f) biosilica.
Table 2. SSA, Specific Pore Volume (SPV), Gold Loadings, and Catalytic Data of the Different Silica Materials.
| SSA/m2 g–1 | SPV/cm3 g–1 | Au loading/wt % | activity per mg Au/10–4 mmolGlc s–1 mgAu–1 | activity per mg catalyst/10–5 mmolGlc s–1 mgCat–1 | |
|---|---|---|---|---|---|
| ST | 56 | 0.15 | 14.75 | 1.60 | 2.36 |
| EZ | 112 | 0.30 | 12.67 | 2.43 | 3.07 |
| TP | 97 | 0.40 | 15.09 | 3.28 | 4.27 |
| MCF | 677 | 2.43 | 11.89 | 1.63 | 1.93 |
| SB | 34 | 0.15 | 14.05 | 1.12 | 1.58 |
| DE | 38 | 0.15 | 6.06 | 0a | 0a |
Conversion of d-glucose was below the detection limit of the used titration measurement.
All three diatom species show a specific macroporous structure, which is not entirely detected with the nitrogen physisorption measurements but may be favorable for diffusion processes during the catalytic reaction. The silica itself exhibits mainly mesopores and a remarkably high SSA. These structural features are quite unique for an inorganic material of natural origin and make diatom biosilica a promising support material for heterogeneous catalysis.
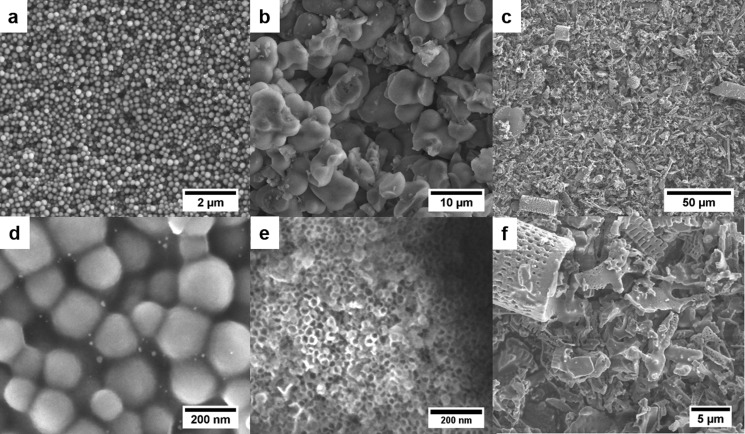
Silica beads (SB) synthesized by the Stoeber method have a spherical shape and an average size of 200–300 nm (Figure 2a,d). Because of the dense structure of the spheres, the material shows a SSA of 34 m2 g–1 and a total pore volume of 0.15 cm3 g–1. Mesocellular foam (MCF) (Figure 2b,e) exhibits disordered mesopores in the range of 20–50 nm and has a SSA of 677 m2 g–1. DE contains various remnants from different diatom species and numerous impurities (Figure 2c,f). It exhibits a SSA of 38 m2 g–1 and a total pore volume of 0.15 cm3 g–1. Nitrogen physisorption isotherms of all silica materials are presented in Figure S1.
Figure 2.
SEM images of SB (a, d), MCF (b, e), and DE (c, f).
Structure of the Catalysts
To immobilize the catalytically active nanoparticles on silica materials, a covalent coupling method using presynthesized gold nanoparticles was used, as reported earlier by our group.9,26
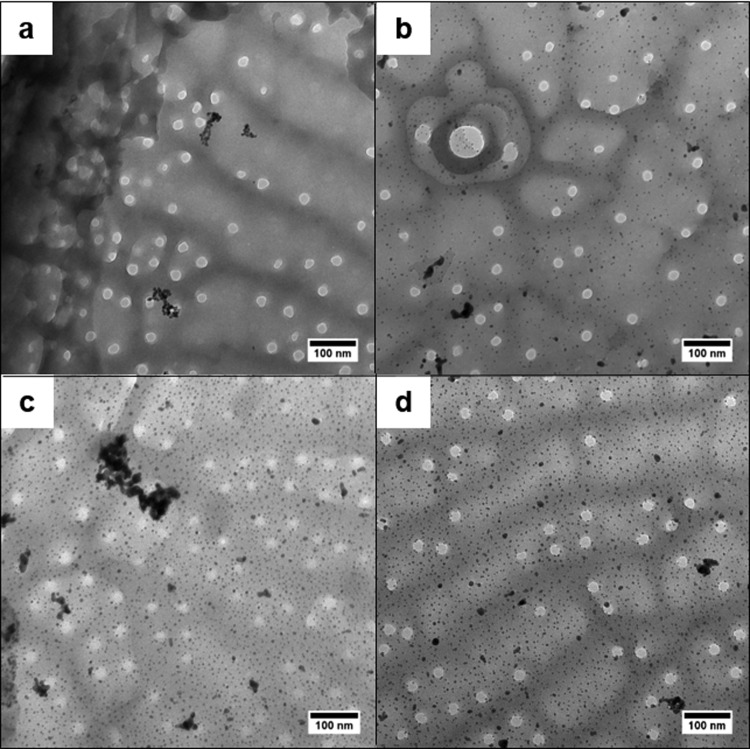
To investigate the effect of different Au-NP loadings, the biosilica of T. pseudonana was loaded with 3–15 wt % of gold. As expected, the transmission electron microscopy (TEM) measurements show an increased density of Au-NPs on the silica surface (Figure 3). Surprisingly, all samples show only small amounts of agglomerates of Au-NPs, independent of the gold content. The majority of gold nanoparticles is well dispersed on the diatom surface. Unexpectedly, the sample with the lowest loading shows several agglomerates. Obviously, the high SSA and unique structure of the biosilica from T. pseudonana allow uniform distribution of separated Au-NPs even at high gold loadings of up to 15 wt %.
Figure 3.
TEM images of T. pseudonana biosilica with different Au-NP loadings: 3.4 wt % (a), 6.9 wt % (b), 8.1 wt % (c), and 15.1 wt % (d).
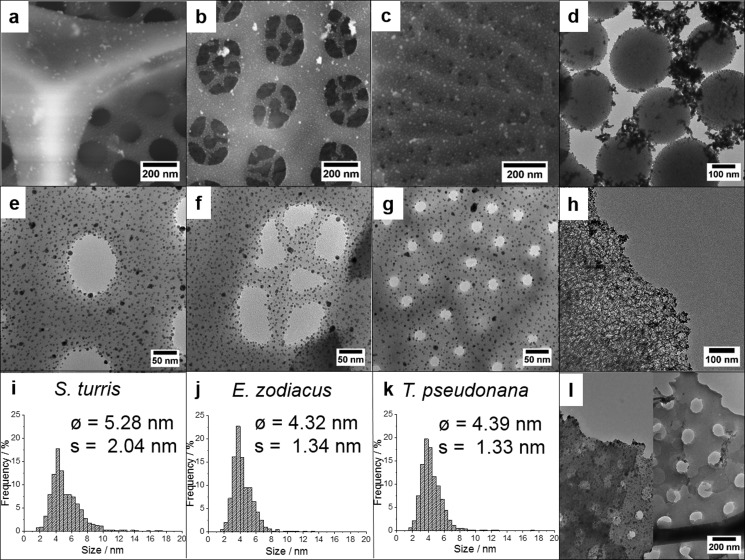
Besides varying Au-NP loadings, several silica templates of natural or synthetic origin were loaded with 15 wt % gold. Despite the use of a high gold content, well-dispersed Au-NP monolayers of 3–7 nm were observed on the silica surface of all biosilica materials (Figure 4). Especially, the diatom biosilica samples show a rather uniform distribution of Au-NPs on the entire surface (Figure 4a–c,e–g). Even the delicate internal silica structures in the pores of E. zodiacus biosilica are homogeneously covered with Au-NPs (Figure 4f). The nanoparticles exhibit a narrow size distribution due to the use of well-defined presynthesized nanoparticles. For diatom biosilica, the particle size distribution is shown in Figure 4i–k. Surprisingly, the biosilica of S. turris shows a slightly higher average particle size (5.28 nm) than the biosilica of the other diatom species, E. zodiacus and T. pseudonana (4.32 and 4.39 nm). This may be explained by a slightly higher agglomeration tendency. In general, however, Au-NPs on the biosilica materials do not exhibit excessive agglomeration. In contrast, large agglomerates of gold located between Au-NP-coupled silica spheres are observed for the synthetic SB in TEM measurements (Figure 4d). This is due to the high gold content and low SSA provided by this support. MCF is filled with Au-NPs immobilized inside mesopores. TEM measurements do not show significant amounts of gold agglomerates in synthetic MCF (Figure 4h). DE exhibits a lower capacity for loading of Au-NPs. It is not able to support comparable amounts of gold to those by other silica materials. DE was saturated at a gold loading of only approximately 6 wt %. This means that the number of Au-NPs that can be immobilized on the surface using the covalent coupling method is limited. The intrinsic inhomogeneities within this material result in a rather inhomogeneous nanoparticle distribution (Figure 4l). Some valves are completely covered with Au-NPs and agglomerates whereas others are completely empty. Strong agglomeration of Au-NPs on the material (Figure S2) may reduce the catalytic activity of Au/DE by decreasing the active surface.
Figure 4.
SEM and TEM images of Au-NP-coupled S. turris (a,e), E. zodiacus (b, f), and T. pseudonana (c, g) biosilica; SB (d), MCF (h), and DE (l); and Au-NP distribution of S. turris (i), E. zodiacus (j), and T. pseudonana (k) biosilica (15 wt %).
In summary, the cultivated diatom cells exhibit well-defined silica structures with a high purity and surface area, which can be beneficial for the catalytic behavior compared to that of commercially available DE and the SB. The silica surface of diatom biosilica is well suited for a homogeneous and uniform distribution of the coupled nanoparticles. Moreover, smaller Au-NPs and only a limited amount of agglomerates are observed, leading to a surface with a higher catalytic activity.
d-Glucose Oxidation Using Different Gold Loadings
The oxidation of d-glucose is catalyzed by Au-NPs of sizes below 5 nm.19−23 The selectivity of the reaction under the used conditions is known from the literature.17,18,30,31 To confirm this for the Au/biosilica catalyst materials, HPAEC measurements were performed for one sample (T. pseudonana 15 wt % Au). The results show that the reaction solution after catalysis is composed of d-glucose and d-gluconic acid exclusively (see Figure S3). To investigate the influence of different gold loadings on the catalytic behavior, the biosilica of T. pseudonna was coupled with variable amounts (3–15 wt %) of Au-NPs. All catalyst samples show comparable specific catalytic activity related to the amount of gold. Small deviations are explained by small differences in the amount of agglomerated gold. The amount of converted d-glucose and the resulting catalytic activities for different gold loadings are shown in Figure 5a and Table 1.
Figure 5.
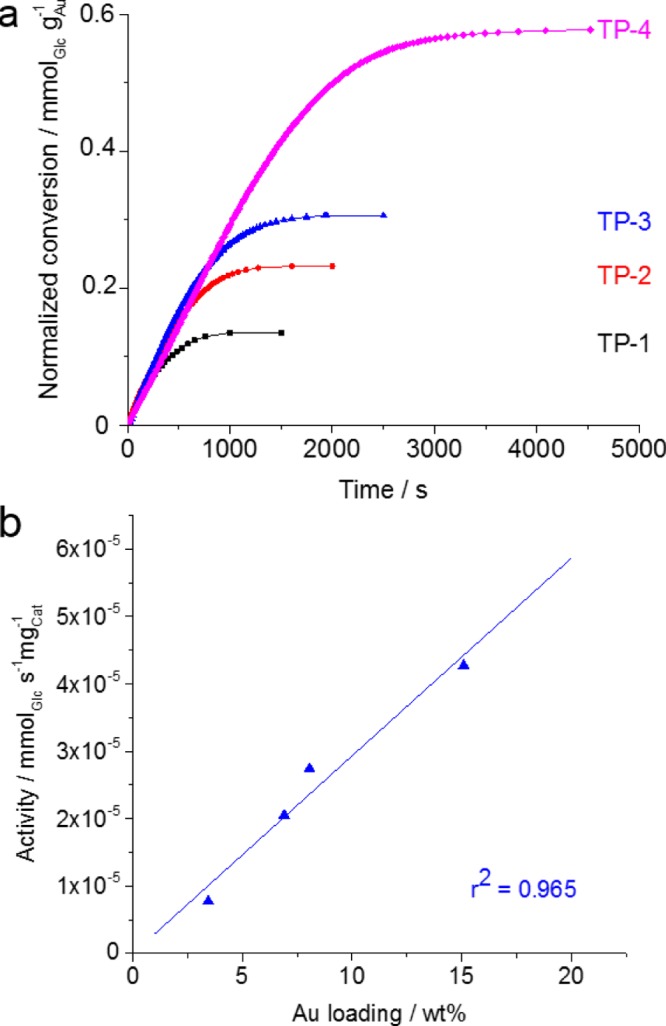
Catalytic activity at different gold loadings (a). Relationship between Au loading and activity of the catalyst (b).
Table 1. Gold Loading and Catalytic Data for Au/T. pseudonana Catalysts.
| Au loading/wt % | activity per Au/10–4 mmolGlc s–1 mgAu–1 | activity per catalyst/10–5 mmolGlc s–1 mgCat–1 | normalized conversion Glca/mmol mgCat–1 | |
|---|---|---|---|---|
| TP-1 | 3.44 | 2.27 | 0.77 | 0.004 |
| TP-2 | 6.90 | 2.99 | 2.05 | 0.014 |
| TP-3 | 8.06 | 3.42 | 2.74 | 0.022 |
| TP-4 | 15.09 | 3.28 | 4.27 | 0.085 |
After complete deactivation.
The higher the d-glucose to Au ratio, the faster the deactivation occurs, resulting in significant differences in the amount of converted d-glucose. This means that the higher the amount of Au-NPs, the higher the conversion related to the whole catalyst (see Figure S4). A linear correlation between gold loading and catalytic activity is observed in this loading range (Figure 5b). TEM images (Figure 3) of the samples show that even at high gold loadings, the nanoparticles are well dispersed and have a size below 5 nm, which is essential for high catalytic activity. Additionally, they are well accessible for the reactants. Thus, Au/biosilica catalysts are clearly different from conventional catalysts, which show a considerable drop in catalytic activity with increasing gold loading. For example, Au/Al2O3 catalysts reported by Baatz et al.15 show a reduction in the activity by 1 order of magnitude when increasing the amount of gold from 0.06 to 10 wt %.
d-Glucose Oxidation Using Different Silica Materials
For all silica materials, a gold loading of approximately 15 wt % was targeted. The gold loadings determined by ICP-OES measurements for the different samples are shown in Table 2. The normalized conversion curves of d-glucose are shown in Figure 6. All catalysts (except for DE) exhibit high activity in d-glucose oxidation. Especially, diatom biosilica serves as an excellent support material for active Au-NPs in the catalytic oxidation of d-glucose. To the best of our knowledge, these are the first reported active gold-based d-glucose oxidation catalysts with diatom biosilica as a support material.
Figure 6.
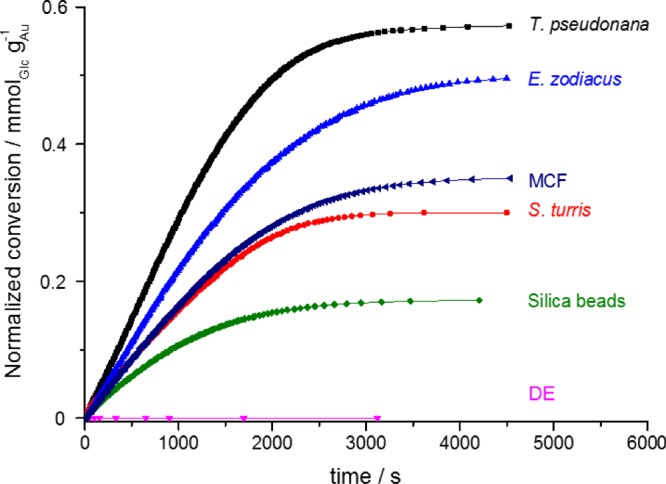
Normalized catalytic conversion of d-glucose using gold catalysts with different silicas as support materials.
Biosilica of the different species show significantly higher catalytic activity compared to that of the established silica reference materials and at least similar catalytic activity compared to that of the tailored porous synthetic silica material MCF with a high mesoporosity (Figure 6 and Table 2). The open, porous structure of T. pseudonana, with transport pores exceeding 20 nm; the high pore volume; and the high SSA contribute to the highest catalytic activity of 3.28 10–4 mmolGlc s–1 mgAu–1. The structural characteristics of this diatom species enable the deposition of 15 wt % small Au-NPs without noticeable agglomeration, resulting in a large number of catalytic active sites and thereby high catalytic performance. A similar behavior can be observed with S. turris and E. zodiacus biosilica. However, the biosilica of S. turris exhibits a slightly lower catalytic activity, which is probably due to the lower SSA and pore volume and the higher average nanoparticle size.
Because of the macroporous structure of diatom biosilica, the active sites are well accessible for the reactants. This leads to beneficial diffusion of d-glucose into the Au-NPs, yielding higher initial catalytic activities, and to diffusion of d-gluconic acid away from the Au-NPs immobilized on the silica surface, which may be advantageous for reduced deactivation of the catalysts.
For the deactivation of metal catalyst in alcohol oxidations, several deactivation mechanisms have been identified: decarbonylation (CO formation), sintering/crystalline growth, overoxidation, self-limiting reaction, and metal dissolution (leaching). No sintering or leaching effects were observed on the investigated catalysts, as could be proven by TEM/REM measurements performed before and after the catalytic test as well as heterogeneity tests. Overoxidation, the so-called oxygen poisoning of the metal surface, where the surface is partially covered by chemisorbed oxygen, is an accepted deactivation mechanism for metal catalysts, especially Pt and Pd catalysts.32,33 Metals with a higher redox potential are less prone to oxidation. This explains why Au catalysts show higher resistance to oxygen poising during alcohol oxidation.34−38 Decarbonylation was investigated by several groups,39,40 which found that CO formation is only observed under oxygen mass transport limited conditions for certain compounds like aromatic alcohols and aldehydes. Abbadi et al.41 revealed that d-gluconic acid, the reaction product, and not CO is the main poisoning species. The poisoning effect of d-gluconic acid (self-limiting reaction) was reported by several groups.17,33,41−43d-Gluconic acid caps the Au-NP surface, thus decreasing the accessible catalytically active surface and hence the reaction process. In this context, effective mass transport of d-gluconic acid from the surface can have a significant influence on the deactivation process.
MCF shows a catalytic activity of 1.63 × 10⁻⁴ mmolGlc s–1 mgAu–1, which is comparable to that of S. turris biosilica. Because of the well-connected mesopore system, MCF provides good mass transport and shows a slightly later deactivation than that of S. turris biosilica. Moreover, the nanoparticles are well distributed in MCF due to the high SSA and large pore volume of the synthetic silica material. However, considering the 7 times higher SSA of MCF, the high activities of biosilica are very surprising. T. pseudonana and E. zodiacus are even more active than MCF, a synthetic high-end silica material. SB exhibit a lower catalytic activity of 1.12 × 10⁻⁴ mmolGlc s–1 mgAu–1 in the conversion of d-glucose due to significant agglomeration of the Au-NPs (Figure 4d). DE shows almost no measurable conversion of d-glucose. This is probably caused by the inhomogeneous structures of DE, which result in an inhomogeneous nanoparticle distribution. Furthermore, nanoparticle agglomerates were visible in the TEM measurements for this material. Moreover, DE is already saturated at a loading of only approximately 6 wt % gold. The lower gold content and heterogeneous distribution of Au-NPs on the surface with agglomerates are convincing reasons for the observed low catalytic activity.
To evaluate the stability of the catalyst and possible leaching effects, the active catalysts were investigated in a heterogeneity test. The catalyst was separated after 600 s from the reaction solution by filtration, and the reaction was continued without the catalyst for another 600 s. After removing the catalyst, no further conversion of d-glucose to d-gluconic acid takes place (Figure 7). This means that no active Au-NPs are found in the solution, indicating that the Au-NPs are indeed tightly attached to the silica surface during the reaction.
Figure 7.
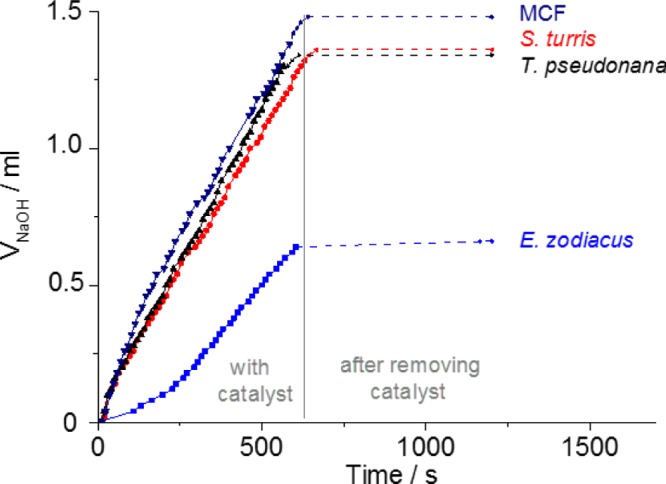
Heterogeneity test with MCF, S. turris, E. zodiacus, and T. pseudonana biosilica with 15 wt % gold loading.
Hence, all catalytic experiments show that the use of diatom biosilica from a single species as a catalyst support is highly preferable. Compared to synthetic silica like silica beads with only a third of the activity, MCF with comparable or less activity than DE, shows no measureable activity. Diatom species provide higher initial catalytic activity due to well dispersed Au-NPs and slower deactivation of the catalyst probably due to favorable advanced mass transport.
High Gold Loadings
In further experiments, the possibility of loading the biosilica materials with maximum amounts of gold until saturation was tested to investigate whether these materials still showed catalytic activity. The biosilica of E. zodiacus was able to take up 45 wt % of gold, and the other biosilica materials reach amounts of about 30 wt % (Table 3). Despite the high loadings, only a few agglomerates could be observed in the TEM measurements. The nanoparticles are still homogeneously distributed and show sizes in the range of 3–7 nm (Figure S5). All materials exhibit decreasing catalytic activity related to the amount of gold as compared to that of the catalysts with gold loadings of 15 wt % and below. The biosilica of E. zodiacus shows the strongest decrease in catalytic activity. This is probably due to the fact that it exhibits the highest gold loading among all of the materials, which causes the highest degree of agglomeration (see TEM measurements in Figure S5). However, because of the high gold loadings, the catalytic activity related to the amount of catalyst material used is nevertheless very high (Table 3). This behavior indicates the potential for industrial application. For example, in batch reactors, high capacities of active material are essential. These require a high loading of support material with catalytically active centers. Au/diatom catalysts exhibit a high catalytic activity of more than 5 × 10⁻⁵ mmolGlc s–1 mgCat–1 even at gold loadings of more than 40 wt %. In contrast to the known gold-supported catalysts from Baatz et al.15 or Önal et al.17 with an activity of 3 × 10⁻⁵ mmolGlc s–1 mgCat–1, biosilica-based catalysts show excellent activities. Moreover, the macroporous structure allows good accessibility to the active sites.
Table 3. Gold Loadings and Catalytic Activities of Saturated Biosilica.
| Au loading/wt % | activity per Au/10–4 mmolGlc s–1 mgAu–1 | activity per catalyst/10–5 mmolGlc s–1 mgCat–1 | |
|---|---|---|---|
| ST | 30.82 | 2.53 | 7.82 |
| EZ | 44.99 | 1.33 | 5.99 |
| TP | 26.86 | 2.37 | 6.36 |
Experimental Section
Chemicals
Gold(III) chloride trihydrate, 1-ethyl-3-(3-dimethyl-aminopropyl)carbo diimide (EDC), and SDS were purchased from Sigma Aldrich. N-hydroxysuccinimide (NHS), tetraethyl orthosilicate (TEOS), and sodium borohydride obtained from Merck, EDTA from Gruessing, trisodium citrate dihydrate from Acros organics, d-glucose from Roth, and (3-aminopropyl)trimethoxysilane (APTMS) from Alfa Aesar were used as received. DE was purchased from Supelco (calcined, purified).
Diatom Cultivation and Purification of Diatom Biosilica
Diatom species S. turris, E. zodiacus, and T. pseudonana were used. These species were grown as reported elsewhere.26 Detailed procedures for the cultivation of S. turris, E. zodiacus, and T. pseudonana can be found in the Supporting Information.
Cell wall extraction was performed as described by Hedrich et al.27 To remove physically bound organic material from the cell walls, an aqueous buffer containing EDTA (0.1 mol L–1) and SDS (2 wt %) at pH 8 was used. The harvested cells were resuspended in 20 mL SDS/EDTA solution and heated to 95 °C for 10 min. This treatment was repeated three times. Finally, the biosilica was washed thrice with Milli-Q water. After all steps, the biosilica was separated from the supernatant by centrifugation (Heraeus biofuge primo, swinging bucket rotor, 2500 RCF, 10 min). After extraction, the samples were freeze-dried.
To remove the remaining organic material from the biosilica, calcination was performed in a muffle furnace (Nabertherm) for 5 h at 550 °C under static air atmosphere.
Synthetic Silica Materials
SB were synthesized by the Stoeber method.28 In a 250 mL flask, 12.5 mL of concentrated ammonia and 8 g of TEOS were added to 125 mL of ethanol (EtOH) and stirred for 12 h. The resulting SB were washed three times with EtOH and freeze-dried overnight. The material was calcined under the same conditions as those for biosilica.
MCF was synthesized as reported by Schmidt-Winkel et al.29
Preparation of the Catalyst
Gold nanoparticles (Au-NPs) were synthesized as reported by Jantschke et al.,26 which is described in the Supporting Information. To immobilize the Au-NPs on the silica surface, a covalent coupling method was applied.9 Before nanoparticle coupling, all silica materials were dried in vacuum for at least 12 h at 80 °C. The silica material (100 mg) was mixed with 8 mL of 3 vol % APTMS in 95 vol % methanol (MeOH) and ultrasonicated for 15 min. After centrifugation, the supernatant was removed and the material was washed three times with MeOH, followed by heating for 1 h in 10 mL of MeOH under reflux. After cooling and centrifugation, 200 μL of phosphate-buffered saline (pH 7.4), 600 μL of 0.025 mol L–1 NHS/EDC, and the concentrated gold nanoparticles (Au-NPs) were added to the silica and sonicated for 15 min. Finally, the silica materials were washed three times with water and freeze-dried for 12 h. The amount of concentrated Au-NPs on the support (measured with ICP-OES) ranged from 3 to 45 wt %.
Catalyst Characterization
Nitrogen physisorption isotherms were measured at 196 °C on a Quadrasorb apparatus (Quantachrome Instruments). SSAs were calculated using the multipoint BET equation (p/p0 = 0.05–0.2). Total pore volumes (micropores and mesopores) were calculated at p/p0 = 0.99.
SEM analyses were performed on a Hitachi SU 8000 field-emission scanning electron microscope. Droplets of water suspensions of the samples were placed on sample holders equipped with a carbon tap and dried.
ICP-OES was carried out on an ICP-OES PerkinElmer Optima 7000DV instrument to determine the amount of gold and silicon in the samples, with a plasma flow of 15 L min–1 at standard temperature and a pressure of 6.5 bar and a 1400 W HF generator output. Silicon was detected radially at 288.158 nm, and gold was detected axially at a spectral line of 267.595 nm. The flow rate was 1.3 mL min–1. The decomposition procedure of samples is described in the Supporting Information.
The size and distribution of the metal nanoparticles on diatoms were characterized with transmission electron microscopes Libra 120 and Libra 200 MC (Zeiss). Libra 120 was operated at an acceleration voltage of 120 kV and was equipped with the LaB6 filament. The images were acquired with a CCD camera from Tröndle Restlichtverstärker Systeme and iTEM software (Olympus). Libra 200 MC was operated at an acceleration voltage of 200 kV and is equipped with the Schottky filament and Ω monochromator. The images were acquired with CCD camera TemCam-F416 and EM-MENU4 software of Tietz Video and Image Processing Systems. The nanoparticle size distribution was calculated with Image J software.
d-Glucose Oxidation
The prepared gold/silica catalysts were tested in d-glucose oxidation as a model reaction. The experiments were carried out in a three-necked flask thermostated at 45 °C, with 40 mL of 0.05 mol L–1d-glucose solution and continuous stirring at 1000 rpm. Oxygen was bubbled through the solution with a flow rate of 500 mL min–1 at atmospheric pressure. Before starting the reaction, the pH was adjusted to slightly above 9 by adding 0.1 mol L–1 NaOH solution. The reaction was started by adding 10 mg of catalyst (suspended in 5 mL of water) to the d-glucose solution. During the experiment, the pH of the reaction suspension was kept constant at 9 using TitroLine α plus (SI Analytics) with Titrisoft 2.7 software (Fisher Scientific) by titration with 0.1 mol L–1 NaOH solution. All experiments were repeated three times, and the results showed only little variation for the different samples (less than 5% for the catalytic activities). The shown data represent the average of all measurements. As reported elsewhere,17,18,30,31 the selectivity of d-glucose oxidation to d-gluconic acid is close to 100% under the applied conditions, which allows direct calculation of the yield of d-gluconic acid from the titration curve. Selectivity measurements were performed with HPAEC and are provided in the Supporting Information. The activity was calculated from the slope of the titration curve before deactivation occurred regarding the amount of used catalyst and used gold. The specific activity related to the metal content (mmolGlc s–1 mgAu–1) was used for comparison of catalysts with different gold contents.
To investigate the stability of the catalyst and leaching effects with additional experiments, the catalyst was separated from the reaction solution after 600 s by filtration. The reaction was continued without the catalyst for another 600 s.
Conclusions
For the first time, we present the use of naturally occurring silica materials as renewable support material for the catalytic oxidation of d-glucose to d-gluconic acid with Au-NPs. Using a covalent coupling method, presynthesized Au-NPs with a diameter of 4–7 nm could be successfully immobilized onto the silica surface. TEM measurements showed that especially diatom biosilica provides well-dispersed nanoparticles on the silica surface. The good adhesion of Au-NPs on silica support and therefore the absence of leaching phenomena were proven by heterogeneity tests. High SSAs; favorable transport pores; and small, homogeneously distributed gold nanoparticles on the biosilica surface led to the formation of surfaces with high catalytic activity and good accessibility to the active sites. As a consequence, the highest catalytic activity was obtained for the two of diatom biosilica materials from E. zodiacus and T. pseudonana. They showed higher activities and slower deactivation than reference silica materials like SB and DE. Even the synthetic high-end material MCF, which has a very high SSA and mesopore volume, showed activity lower than or similar to that of the Au-NP loaded diatom biosilica. Moreover, diatom biosilica has a very high capacity of gold loading as well as a homogeneous nanoparticle distribution and good accessibility to the active sites, due to the macroporous structure. These properties render diatom biosilica a promising sustainable support material for heterogeneous catalysts in industrial applications. More than 100 000 diatom species are known, and all of them exhibit different natural structures. Considerable progress has been made in upscaling cultivation, for example, growing diatoms in large tanks, photobioreactors, or in outside ponds.44 Because of the increasing industrial uses of algae and their products (e.g., oil for fuel and as fertilizers), their production is likely to increase further in the next few years. Diatom biosilica may thus become available as a cheap byproduct of this growing industry.
Acknowledgments
Thanks are due to Susanne Goldberg and Andrea Bruenner for the SEM measurements and Renate Schulze for the ICP-OES measurements. Furthermore, we thank Martin Oschatz and Winfried Nickel for providing the MCF material and for BET measurements. Financial support from the German Research Foundation (SPP 1569: Generation of multifunctional inorganic materials by molecular bionics) is gratefully acknowledged. Marion Adam would like to thank the Graduate Academy Dresden and the Excellence Initiative of Germany and Saxony for financial support.
Supporting Information Available
The Supporting Information is available free of charge on the ACS Publications website at DOI: 10.1021/acsomega.6b00406.
Diatom cultivation, synthesis of Au-NPs, decomposition of the silica samples for ICP-OES measurements, N2-physisorption measurements, selectivity measurements (HPAEC), additional SEM and TEM images (PDF)
Author Contributions
The manuscript was written through contributions of all authors. All authors approved the final version of the manuscript.
The authors declare no competing financial interest.
Supplementary Material
References
- Falciatore A.; Bowler C. Annu. Rev. Plant Biol. 2002, 53, 109–130. 10.1146/annurev.arplant.53.091701.153921. [DOI] [PubMed] [Google Scholar]
- Sumper M.; Brunner E. Chembiochem 2008, 9, 1187–1194. 10.1002/cbic.200700764. [DOI] [PubMed] [Google Scholar]
- Hildebrand M. Chem. Rev. 2008, 108, 4855–4874. 10.1021/cr078253z. [DOI] [PubMed] [Google Scholar]
- Kröger N.; Poulsen N. Annu. Rev. Genet. 2008, 42, 83–107. 10.1146/annurev.genet.41.110306.130109. [DOI] [PubMed] [Google Scholar]
- Brunner E.; Gröger C.; Lutz K.; Richthammer P.; Spinde K.; Sumper M. Appl. Microbiol. Biotechnol. 2009, 84, 607–616. 10.1007/s00253-009-2140-3. [DOI] [PubMed] [Google Scholar]
- Lopez P. J.; Desclés J.; Allen A. E.; Bowler C. Curr. Opin. Biotechnol. 2005, 16, 180–186. 10.1016/j.copbio.2005.02.002. [DOI] [PubMed] [Google Scholar]
- Jeffryes C.; Agathos S. N.; Rorrer G. Curr. Opin. Biotechnol. 2015, 33, 23–31. 10.1016/j.copbio.2014.10.005. [DOI] [PubMed] [Google Scholar]
- Zhang Z.; Wang Z. J. Org. Chem. 2006, 71, 7485–7487. 10.1021/jo061179k. [DOI] [PubMed] [Google Scholar]
- Jantschke A.; Hermann A.-K.; Lesnyak V.; Eychmüller A.; Brunner E. Chem. – Asian J. 2012, 7, 85–90. 10.1002/asia.201100563. [DOI] [PubMed] [Google Scholar]
- Davis S. C.; Sheppard V. C.; Begum G.; Cai Y.; Fang Y.; Berrigan J. D.; Kröger N.; Sandhage K. H. Adv. Funct. Mater. 2013, 23, 4611–4620. 10.1002/adfm.201203758. [DOI] [Google Scholar]
- Lee S.-J.; Huang C.-H.; Shian S.; Sandhage K. H. J. Am. Ceram. Soc. 2007, 90, 1632–1636. 10.1111/j.1551-2916.2007.01571.x. [DOI] [Google Scholar]
- Vrieling E. G.; Beelen T. P. M.; van Santen R. A.; Gieskes W. W. C. J. Biotechnol. 1999, 70, 39–51. 10.1016/S0168-1656(99)00056-5. [DOI] [Google Scholar]
- Vrieling E. G.; Gieskes W. W. C.; Beelen T. P. M.; Hustedt N. G. J. Phycol. 1999, 35, 548–559. 10.1046/j.1529-8817.1999.3530548.x. [DOI] [Google Scholar]
- Hagen J.Industrial Catalysis—A Practical Approach; Wiley-VCH Verlag GmbH & Co. KGaA: Weinheim, 2006. [Google Scholar]
- Baatz C.; Prüße U. J. Catal. 2007, 249, 34–40. 10.1016/j.jcat.2007.03.026. [DOI] [Google Scholar]
- Baatz C.; Thielecke N.; Prüße U. Appl. Catal., B 2007, 70, 653–660. 10.1016/j.apcatb.2006.01.020. [DOI] [Google Scholar]
- Önal Y.; Schimpf S.; Claus P. J. Catal. 2004, 223, 122–133. 10.1016/j.jcat.2004.01.010. [DOI] [Google Scholar]
- Biella S.; Prati L.; Rossi M. J. Catal. 2002, 206, 242–247. 10.1006/jcat.2001.3497. [DOI] [Google Scholar]
- Hatura M.; Kobayashi T.; Sano H.; Yamada N. Chem. Lett. 1987, 16, 405–408. 10.1246/cl.1987.405. [DOI] [Google Scholar]
- Tsubota S.; Haruta M.; Kobayashi T.; Ueda A.; Nakahara Y. In Preparation of Catalysts; Poncelet G., Jacobs P. A., Grange P., Delmon B., Eds.; Elsevier: Amsterdam, 1991; pp 695–704. [Google Scholar]
- Biella S.; Castiglioni G. L.; Fumagalli C.; Prati L.; Rossi M. Catal. Today 2002, 72, 43–49. 10.1016/S0920-5861(01)00476-X. [DOI] [Google Scholar]
- Porta F.; Prati L.; Rossi M.; Coluccia S.; Martra G. Catal. Today 2000, 61, 165–172. 10.1016/S0920-5861(00)00370-9. [DOI] [Google Scholar]
- Bianchi C.; Porta F.; Prati L.; Rossi M. Top. Catal. 2000, 13, 231–233. 10.1023/A:1009065812889. [DOI] [Google Scholar]
- Shavel A.; Gaponik N.; Eychmüller A. ChemPhysChem 2005, 6, 449–451. 10.1002/cphc.200400516. [DOI] [PubMed] [Google Scholar]
- Gale D. K.; Gutu T.; Jiao J.; Chang C.-H.; Rorrer G. L. Adv. Funct. Mater. 2009, 19, 926–933. 10.1002/adfm.200801137. [DOI] [Google Scholar]
- Jantschke A.; Fischer C.; Hensel R.; Braun H.; Brunner E. Nanoscale 2014, 6, 11637–11645. 10.1039/C4NR02662D. [DOI] [PubMed] [Google Scholar]
- Hedrich R.; Machill S.; Brunner E. Carbohydr. Res. 2013, 365, 52–60. 10.1016/j.carres.2012.11.001. [DOI] [PubMed] [Google Scholar]
- Stöber W.; Fink A.; Bohn E. J. Colloid Interface Sci. 1968, 26, 62–69. 10.1016/0021-9797(68)90272-5. [DOI] [Google Scholar]
- Schmidt-Winkel P.; Lukens W. W.; Zhao D.; Yang P.; Chmelka B. F.; Stucky G. D. J. Am. Chem. Soc. 1999, 121, 254–255. 10.1021/ja983218i. [DOI] [Google Scholar]
- Comotti M.; La Pina C.; Falletta E.; Rossi M. J. Catal. 2006, 244, 122. 10.1016/j.jcat.2006.07.036. [DOI] [Google Scholar]
- Mirescu A.; Berndt H.; Martin A.; Prusse U. Appl. Catal., A 2007, 317, 204–209. 10.1016/j.apcata.2006.10.016. [DOI] [Google Scholar]
- Besson M.; Gallezot P. Catal. Today 2000, 57, 127–141. 10.1016/S0920-5861(99)00315-6. [DOI] [Google Scholar]
- Gallezot P. Catal. Today 1997, 37, 405–418. 10.1016/S0920-5861(97)00024-2. [DOI] [Google Scholar]
- Benko T.; Beck A.; Frey K.; Srankó D. F.; Geszt O.; Sáfrán G.; Maróti B.; Schay Z. Appl. Catal., A 2014, 479, 103–111. 10.1016/j.apcata.2014.04.027. [DOI] [Google Scholar]
- Besson M.; Lahmer F.; Gallezot P.; Fuertes P.; Fleche G. J. Catal. 1995, 152, 116–121. 10.1006/jcat.1995.1065. [DOI] [Google Scholar]
- Bronnimann C.; Bodnar Z.; Hug P.; Mallat T.; Baiker A. J. Catal. 1994, 150, 199–211. 10.1006/jcat.1994.1336. [DOI] [Google Scholar]
- Decker N.Oxidation von Glucose und ethoxylierten Alkoholen an geträgerten Edelmetallkatalysatoren, p 135, Braunschweig, 2014. [Google Scholar]
- Biella S.; Prati L.; Rossi M. J. Catal. 2002, 206, 242–247. 10.1006/jcat.2001.3497. [DOI] [Google Scholar]
- Gangwal V. R.; van der Schaff J.; Kuster B. F. M.; Schouten J. C. J. Catal. 2005, 229, 389–403. 10.1016/j.jcat.2004.11.021. [DOI] [Google Scholar]
- Keresszegi C.; Brgi T.; Mallat T.; Baiker A. J. Catal. 2002, 211, 244–251. 10.1016/S0021-9517(02)93723-1. [DOI] [Google Scholar]
- Abbadi A.; van Bekkum H. J. Mol. Catal. A: Chem. 1995, 97, 111–118. 10.1016/1381-1169(94)00078-6. [DOI] [Google Scholar]
- Lang N. J.; Liu B.; Liu J. J. Colloid Interface Sci. 2014, 428, 78–83. 10.1016/j.jcis.2014.04.025. [DOI] [PubMed] [Google Scholar]
- Mallat T.; Bodnar Z.; Balker A.; Greis O.; Striibig H.; Relier A. J. Catal. 1993, 142, 237. 10.1006/jcat.1993.1204. [DOI] [Google Scholar]
- Anderson R. A.Algal Culturing Techniques, Elsevier Academic Press, 2005. [Google Scholar]
Associated Data
This section collects any data citations, data availability statements, or supplementary materials included in this article.


