Abstract
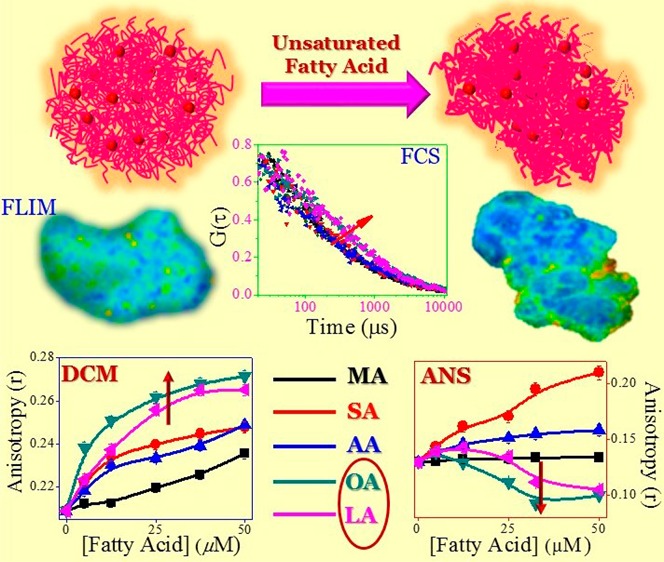
Casein, one of the major constituent of milk protein, is considered to be a good candidate for oral drug delivery system. Also, milk transports various essential fatty acid to blood through dietary supplements. In this study, we have explored the alteration in the structural characteristic in terms of the modulations in the microenvironment of the protein in the presence of different types of fatty acids. Herein, we have observed that the unsaturation of fatty acids mostly affects the structure of casein micelles (CMs) by impinging upon the hydrophobic force of interaction following a decrease in the electrostatic interaction of various amino acid unit. Alteration of such forces is responsible for the increase in the aggregate size, modification in the protein secondary structure, and different morphology of CMs. Fluorescence behavior of 4-(dicyanomethylene)-2-methyl-6-(4-dimethylaminostyryl)-4H-pyran indicates that the rigidity of the microenvironment is the main characteristic of the fatty acid binding, and the binding constant increases with the fatty acid chain length for saturated fatty acid or with the introduction of unsaturation onto it. Fluorescence lifetime imaging microscopy study indicates that the microstructure of CMs becomes more compact in the presence of unsaturated fatty acids, and this is also responsible for the increase in the diffusion time of the probe. Moreover, decrease in the fluorescence of extrinsic probe 8-anilinonaphthalene-1-sulfonate with the addition of unsaturated fatty acid reveals that these fatty acids alter the electrostatic interaction between casein units, more specifically in case of the surface-bound κ-casein. Therefore, this study provides a very useful information on the binding of fatty acids and helps to evaluate other fatty acid, as well as different small molecules binding in the applicative medicinal purpose.
1. Introduction
Protein-based biometrical is always an important system to be employed in the controlled delivery of drugs, nutrients, bioactive peptides, and so forth.1−3 Over the past few decades, drug delivery systems based on food proteins have gained quite a remarkable attention due to their usability for various reason, e.g., excellent functional properties, high nutritional value, emulsification, gelation, foaming, and water-binding capacity, as well as their applications as ingredients in the food industry.1,4
Milk is usually known as a complete food for supplying carbohydrates, fatty acids (FAs), vitamins, inorganic elements, and proteins.5,6 In bovine milk, the major ingredient protein is casein (80%) with respect to whey protein (20%). Casein accommodates low-molecular-weight compounds, mainly calcium phosphate, to supply two essential elements, calcium and phosphorus.1,7 Casein (Scheme 1) contains mainly four types of phosphoproteins, αS1-, αS2-, β-, and κ-casein, in proportions of 4:1:4:1 approximately by weight.1,8−10 The variations in molecular weights are between 19 and 25 kDa, with the number of amino acids ranging between 169 and 209.1,7 The average isoelectric point of different units of casein is between 4.6 and 4.8.9 Structurally, casein resembles the block copolymers comprising high level of hydrophobic or hydrophilic amino acid residues blocks (amphiphilic blocks) and shows a strong tendency to form self-assembles into casein micelles (CMs) in the aqueous solution.1,9 The hydrophobic residues are concentrated in the interior part of casein micelles, whereas the surface layer is surrounded by the hydrophilic and charged ones to provide the right balance of the steric and electrostatic effects in the micelle.1 Also, the presence of calcium phosphate in casein plays a pivotal role in maintaining the compactness of micelles. Actually, the colloidal calcium phosphate makes a link between the phosphoserine residues of different types of casein molecules in the aggregate.1
Scheme 1. (a) One of the Proposed Model Structures of CMs and (b) Structure of Various Fatty Acids Used in This Study.
Fatty acids (FAs, they are long-chain organic molecule containing the terminal carboxylic functional group) are the basic units of the cell membranes as a component of phospholipids and glycolipids.11 Also, fatty acids are joined together with one glycerol molecule to form triacylglycerols, and also these are capable of storing fatty energy in the adipose tissue.11,12 Additionally, they are responsible for many biological activities, i.e., influencing cell and tissue metabolism, function, and responsiveness to hormonal and other signals.11,12 These biological activities collectively work for many biological functions (e.g., regulation of membrane structure and function, regulation of intracellular signaling pathways, regulation of the production of bioactive lipid mediators, and gene expression).12 As a consequence, these effects help to reduce the disease risk and maintain a good health condition.
The supply of fatty acids in the blood mainly comes from diet, and milk is regarded as the main supplier of fatty acids.5,13 The major (∼70%) fatty acids in milk are the saturated ones. In milk, palmitic acid, myristic acid, and stearic acid are present approximately in 30, 11, and 12% by weight, respectively.14 The remaining proportion mainly comprises short-chain fatty acids. Besides, approximately 25% of the fatty acids in milk are monounsaturated, where oleic acid is the major constituent (∼23.8%) by weight of the total fatty acids in the dairy milk.14 Also, 2.3% of the weight fraction of total fatty acid is polyunsaturated fatty acids, where linoleic and α-linolenic acids present in 1.6 and 0.7% by weight are the main constituents. Also, milk fat contains some amount of omega-6 and omega-3 fatty acids in the ratio 2.3:1.14 But, there are no exact details to identify the amount of fatty acids content in an individual milk protein. However, some reports state that globular protein is responsible for carrying the fatty acids.5 In case of β-lactoglobulin, the binding affinity of short-chain fatty acids to protein is relatively low, and the binding constant of fatty acids increases with increase in the length of aliphatic chain.5 Also, Aynié et al. have reported that the interaction efficiencies of milk proteins in the emulsion with nitroxide homologues of fatty acids decreases in the order of αs1-casein > β-lactoglobulin > β-casein ≈ whole casein.15 In that report, they proposed that this type of high interaction of αs1casein occurs through the hydrogen bonds and/or electrostatic interactions between the lipid polar heads and the protein polar side chains. A recent study suggests that entropy and electrostatic energy are the main important factors to control the binding affinities of fatty acids for β-lactoglobulin.16 Therefore, we can say that the structural changes and interaction pattern of β-lactoglobulin in the presence of various fatty acids enriched the understanding of the metabolism of fatty acids. However, there is no such report to describe how fatty acids interact with casein. Only in some specific cases it has been shown that casein can accommodate polyunsaturated fatty acid.17 However, in case of β-casein, it has been found that in epithelial cells, unsaturated fatty acids stimulate the degradation of protein, whereas saturated fatty acids fail to do so.18 Therefore, in a broader perspective, it will be fascinating to study the alteration of various forces inside the CMs in the presence of fatty acids.
In this present work, we plan to demonstrate the change in the microenvironment of CMs as a result of modification of various forces of interactions in the presence of different types of fatty acids. Actually, a change in the microenvironment precisely reveals the real structural scenario. For that, we have used two common extrinsic fluorophores, i.e., 4-(dicyanomethylene)-2-methyl-6-(4-dimethylaminostyryl)-4H-pyran (DCM) and 8-anilinonaphthalene-1-sulfonate (ANS) (Scheme 2). To extract information about the extent of interaction, structure, and dynamical properties of CMs in the presence of fatty acids, we have performed fluorescence correlation spectroscopy (FCS) and fluorescence lifetime imaging microscopy (FLIM) experiments. We have used dynamic light scattering (DLS) and circular dichroism (CD) techniques to gain knowledge about the alteration in the size and secondary structures. In addition, we have also investigated the morphological changes in CMs by using the field emission scanning electron microscopy (FESEM). Moreover, the present study is interesting at the same time important to understand the role of various fatty acids toward the structural change of casein due to binding. Herein, we have used three saturated fatty acids that vary in their aliphatic chain length (myrisitic acid, MA; steric acid, SA; and arachidic acid, AA) and two unsaturated fatty acid (oleic acid, OA; and linoleic acid, LA) (Scheme 1) differing in the amounts of unsaturation.
Scheme 2. Chemical Structure of (a) DCM and (b) ANS Anion Used as a Florescence Probe in Different Experiments.

2. Results and Discussion
2.1. Structural Change of CMs in the Presence of Fatty Acids
2.1.1. Dynamic Light Scattering (DLS) study
CMs are colloidal protein clusters with diameters ranging between 50 and 500 nm, with an average of roughly 200 nm, and they consist of different casein proteins.10,19 In an aqueous medium, CMs show two peaks around 50 and 300 nm, with an average size of around 270 nm. Figure 1 shows the effect of fatty acid on the size of the CMs. As shown in that figure, fatty acid changes the size of CMs from smaller to larger, with the exception of MA and SA. For those two saturated fatty acids, no substantial increase in size has been observed. However, the other saturated fatty acid AA has been found to considerably change the size of the CMs (from 268 to 324.5 nm). In the case of unsaturated fatty acids, the particles of CMs mostly increase in size (413 and 419 nm with OA and LA). This means that the unsaturated fatty acids alter the nature of micellar aggregate of CMs more than the saturated ones do. Moreover, in a comparison among the saturated fatty acids, the size of the micellar aggregates of CMs depends upon the chain length of the fatty acids.
Figure 1.
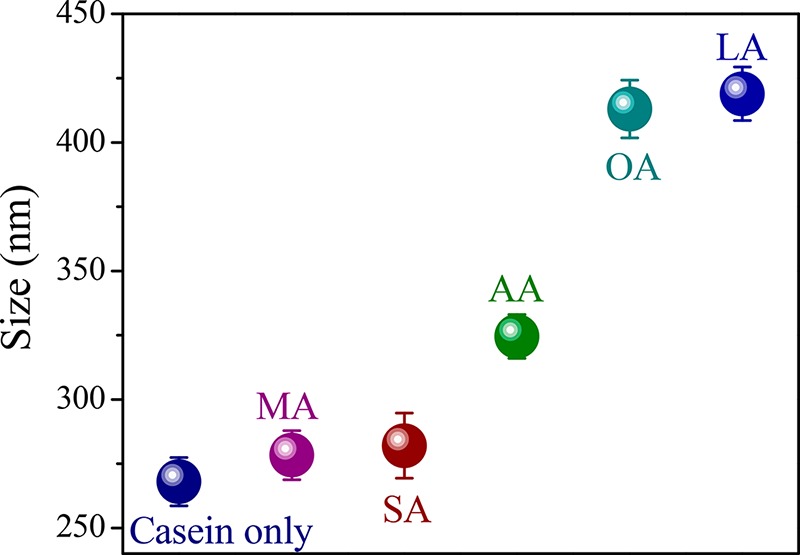
Change in the average size of CMs (0.025 mg mL–1) with the addition of various saturated and unsaturated fatty acids (50 μM).
2.1.2. Circular Dichroism (CD) Study
All of the casein varieties consist of a substantial number of hydrophobic amino acids, and some of them (especially β- and κ-caseins) contain a large number of hydrophobic blocks in their sequences.10 Also, these caseins do not show any definitive permanent secondary and tertiary structures. For these reasons, casein is regarded as a “rheomorphic” or “natively disordered” protein.10 Sometimes, the addition of a small molecule or a change in the environment allows this type of proteins to attain a definite conformation.20,21 In that case, a modification in the hydrophobic and electrostatic interaction is responsible for such type of changes. In this study, CD (0.1 mg mL–1) spectra of casein exhibit a negative band around 200 nm, suggesting an irregular structure (Figure S1, Supporting Information). With the addition of fatty acid, as such, no change is observed for that band. Interestingly, in the case of unsaturated fatty acid, a little change in the band characteristic is observed around the 222 nm region. This is the suggestive region for an α-helix structure (Figure S1, Supporting Information). This means that in the presence of unsaturated fatty acids, the secondary structure also gets changed along with an increase in the size of CMs from an irregular coil to an α-helix structure. In a recent report, such a structural changeover in the case of κ-casein due to the addition of cetyltrimethyl ammonium bromide has been described.20 Therefore, this result indicates that unsaturated fatty acids render some kind of assistance to change the secondary structure of CMs via the modulation of the hydrophobic and electrostatic force of interactions of surface-binding κ-casein.
2.2. Photophysical Property of Pyrene in CMs
Pyrene is a well-studied fluorophore to probe the heterogeneity of the micellar medium, and it is frequently employed to determine the CMC of the surfactants.8,22 Now, in this case, to understand the change in the heterogeneity inside the CMs, we have plotted I1/I3 with the fatty acid concentrations. In high concentrations of CMs (>2 mg mL–1), we have not observed a substantial change in the ratio of I1/I3 with the addition of fatty acids (data not shown). So, we select a low concentration of CMs (0.025 mg mL–1) to study the effect of fatty acids. Figure 2 depicts the change in I1/I3 with the increasing concentration of fatty acids, which indicates that for saturated fatty acids, the changes are very less (from 1.53 to 1.48). However, for unsaturated fatty acid, interestingly, the value decreases gradually. The change is more in case of OA than that of LA. This indicates that with the addition of unsaturated fatty acids, the CMs become more hydrophobic due to the occupancy of fatty acids inside the micelle by displacing the water molecule therein. However, in the presence of saturated fatty acids, the hydrophobic nature around the pyrene does not change much.
Figure 2.
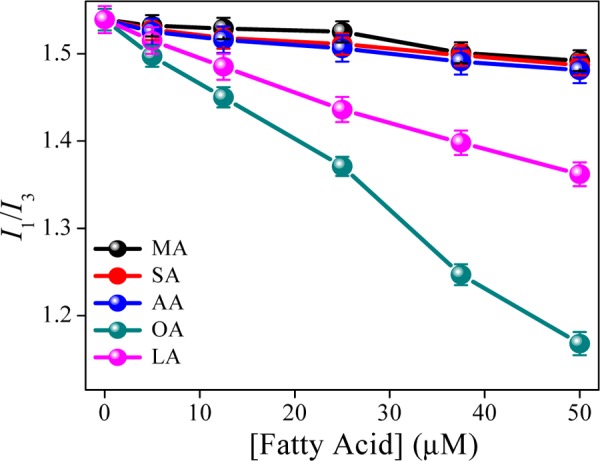
Plots of pyrene fluorescence intensity (1 μM) of first and third band ratio vs concentration fatty acids at 298 K.
2.3. Study of the Fluorescence of CMs
Estimation of the intrinsic fluorescence of proteins is a convenient method to understand its binding properties in aqueous solutions with small molecules. Selective excitation of tryptophan (λex= 295 nm) of CMs shows a broad emission profile with the emission maxima around 351 nm. With the addition of fatty acids into the casein solution, the fluorescence intensity decreases gradually. The quenching of the fluorescence indicates the possible interaction of fatty acids with casein. As the solubility of fatty acids is quite low in an aqueous medium (even in casein solution), we are not able to monitor the total quenching processes and also cannot estimate the binding constant from the Scatchard plot. Therefore, we employ the Stern–Volmer equation23,24 (eq 1) for further analysis
| 1 |
where F0 and F are fluorescence intensities in the absence and presence of a quencher (fatty acids), [Q] is the fatty acid concentration (μM), and KSV is the Stern–Volmer quenching constant, which can be determined from the linear fit of the F0/F plot against [Q].
Figure 3 depicts the linear plot of F0/F as a function of fatty acid concentrations. The estimated KSV value is more in the case of unsaturated fatty acids (8493 and 7603 M–1 for OA and LA, respectively) than that of saturated fatty acids (2734, 3730, and 4430 M–1 for MA, SA, and AA, respectively). The higher values of KSV in the case of unsaturated fatty acids suggest that these acids interact strongly with casein than the saturated ones. Among the saturated fatty acids, long-chain fatty acid AA strongly binds casein and the binding efficiency decreases with the decreasing chain length. Besides, no change in the fluorescence lifetime (λex = 295 nm) of tryptophan fluorescence indicates that this quenching is static in nature (data are not shown).
Figure 3.
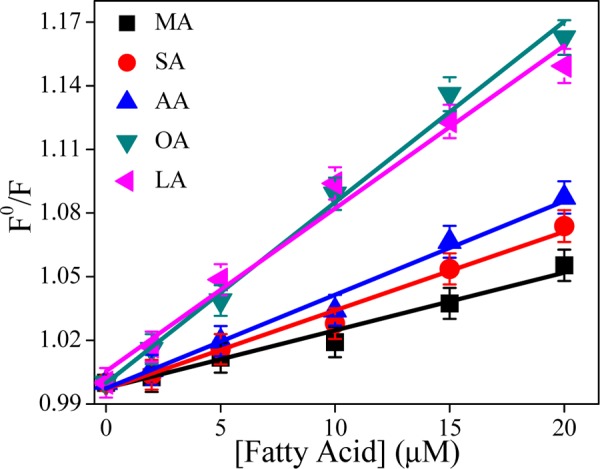
Plot of F0/F vs various fatty acids concentration (λex = 295 nm and λem = 351 nm), with the line showing the linear fit of data with an intercept of 1.
2.4. Characterizing the Interaction of Fatty Acids with CMs by Using DCM as a Fluorescence Probe
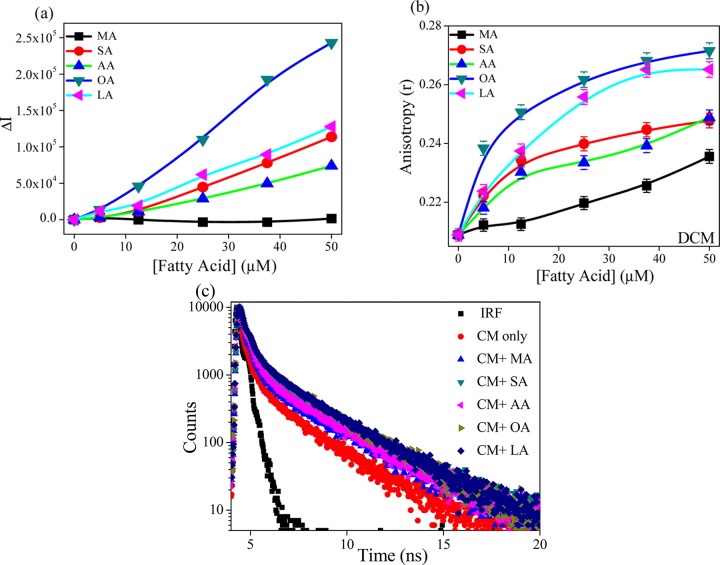
DCM is a neutral hydrophobic molecule, and it is known to reside in the hydrophobic region of protein, micelle, and vesicle.24−26 Change in the photophysical properties of fluorophore indicates an alteration in the microenvironment of the hydrophobic region. In water, DCM shows a broad emission band (λex = 480 nm), with λem of around 635 nm (Figure S2, Supporting Information). With the addition of CMs, the emission band is slightly blue shifted (∼12 nm), with an increase in the emission intensity (∼2-fold). Figure 4a indicates that with increasing fatty acid concentration, the fluorescence intensity increases for all of the fatty acids except MA, and the order of increment is OA > LA > SA > AA > MA. Also, with increase in the fluorescence intensity, the band further blue shifts, and this shifting is found to be maximum for OA (λem ∼ 592 nm). Moreover, the change in the steady state anisotropy of DCM with the addition of fatty acids (Figure 4b) shows a similar trend (observed from fluorescence study), but little increase in anisotropy value is found with MA. Actually, the anisotropy value signifies the rigidity of the microenvironment surrounding the probe. Therefore, we can say that the enhancement of fluorescence intensity is due to the location of the DCM in the hydrophobic region, and with the addition of fatty acids, the rigidity of probe molecule becomes higher with the increase in hydrophobic nature of the microenvironment. Figure 4c shows the florescence decay plot of DCM in casein in the presence and absence of different fatty acids. The corresponding biexponential fitted data are tabulated in Table 1. This table indicates that the value of fast lifetime component increases with the increase in the chain length of saturated fatty acid from MA to AA (from 0.096 to 0.128 ns), along with the increase in fluorescence intensity. Besides, no noticeable change (∼±5%) is observed in the longer lifetime value (2.39–2.43 ns). However, the average lifetime in the presence of AA and SA is quite similar (0.203 and 0.213 ns), with a slightly different distribution in the lifetime components. Moreover, with an increasing unsaturation of the fatty acids, the average lifetime increases (0.255 and 0.270 ns for OA and LA, respectively) with increase in the contribution from the slow lifetime component. In many instances, it is noticed that the lifetime of DCM increases with increase in the rigidity of the hydrophobic microenvironment.25,26 This means that for saturated fatty acids, the compactness or rigidity inside the microenvironment is enhanced with the increase in the chain length of the fatty acids (from MA to AA). Also, the alteration in the unsaturation of fatty acids exhibits a substantial enhancement in the rigidity of CMs. Furthermore, the earlier report describes that due to the incorporation of DCM in the confined hydrophobic medium, the emission maxima are largely blue shifted and the decay pattern shows the wavelength dependence.26,27 However, in our case, we did not observe any such wavelength dependence (data not shown). This means that the rigidly of microenvironment is not so high to get different information. Actually, in a nonpolar solvent, a large blue shift in DCM has been observed with no such wavelength dependence. Therefore, we can say that the enhancement in fluorescence intensity and lifetime DCM is due to increase in the hydrophobic nature inside the CMs.
Figure 4.
(a) Change in the fluorescence intensity (ΔI) and (b) change in the anisotropy of DCM (5 μM) with the addition of fatty acids in the presence of CMs (0.05 mg mL–1). (c) Fluorescence decay profiles (in log scale) of DCM (5 μM) in the presence of various fatty acids on casein micelle.
Table 1. Fluorescence Lifetime Parameters (λex = 442.6 nm) of DCM at 298 Ka.
| system | τ1 (a1) (ns) | τ2 (a2) (ns) | τavg (ns) |
|---|---|---|---|
| water | 0.076 (0.987) | 2.23 (0.013) | 0.104 |
| CM | 0.083 (0.982) | 2.39 (0.018) | 0.125 |
| CM + MA | 0.096 (0.978) | 2.60 (0.022) | 0.151 |
| CM + SA | 0.116 (0.960) | 2.54 (0.040) | 0.213 |
| CM + AA | 0.128 (0.969) | 2.54 (0.031) | 0.203 |
| CM + OA | 0.128 (0.943) | 2.36 (0.057) | 0.255 |
| CM + LA | 0.142 (0.944) | 2.43 (0.056) | 0.270 |
Experimental errors in the determination of lifetime ±5%.
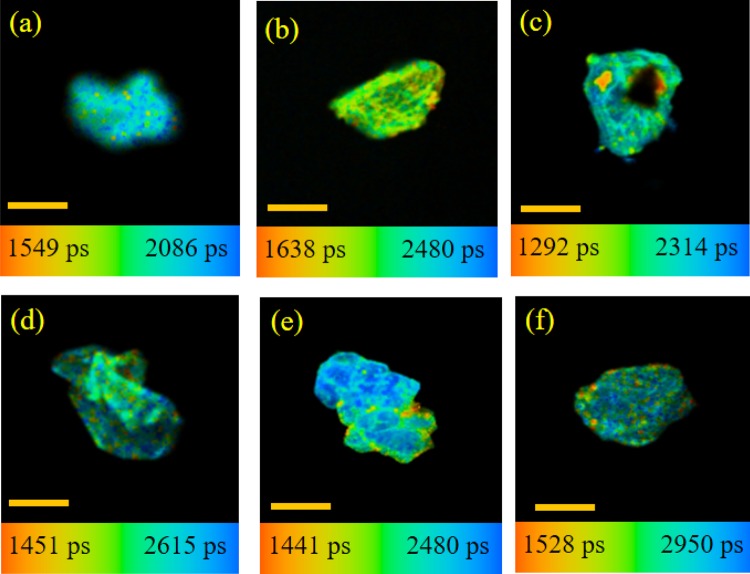
We also perform the FLIM study to get the information about the lifetime distribution of DCM within the CMs. Figure 5 demonstrates the FLIM images of casein micelle in the absence and presence of fatty acids. Due to the inherent lower resolution of FLIM images, we are unable to identify the structural change in the small-size caseins. For that we monitor comparatively larger aggregate to understand the facts (Figure 5). These images indicate that the apparent size of the casein is somewhat increased with the addition of fatty acid. In addition, the compactness of casein is also enhanced with the addition of fatty acids, and it is more in case of OA and LA (Figure 5e,f); this type of findings are also observed in the FESEM study (Figure S3, Supporting Information). However, FESEM study has been performed in the dried condition. Nevertheless, those results provide important information to compare the structural change with FLIM studies in a more low (nanometer) dimension. Figure S3a (Supporting Information) displays the FESEM image of CMs only; it is found that the average diameter of the micelle is around 200 nm, although they are somewhat polydispersed and not uniformly shaped. It looks like various submicellar unit assemble to form a spongelike morphology as observed in the FLIM image also (Figure 5a). With the addition of fatty acids, it is found that the size of CMs increases somewhat with some change in the morphology, except in the case of MA. In the presence of AA and LA, the CMs form a nice branched architecture, followed by a preferential growth of various casein units. But in the presence of SA and OA, such an architecture has not been found. Rather, the CMs are converted to round nanoentities, which are segregated from each other. In comparison between the saturated and unsaturated fatty acids, no remarkable difference is observed, except the alteration in the compactness of the nanosphere for OA and LA, which also corroborated the findings from the FLIM study. Actually, unsaturated fatty acids form more compact structures than saturated ones do, and the spongy characteristic of the structure is not observed. It is known that the κ-casein generally occupies the micellar surface that determines many of the properties of the particles, especially their stability toward aggregation.10,19 Therefore, we can say that AA, OA and LA interact with κ-casein predominantly to form a nice aggregated architecture, and at the same time impart compactness to the casein structure. This compactness can also be explained by the measuring the lifetime distribution of DCM, and the observed lifetime distribution of DCM is on the higher side for the unsaturated fatty acids than that for saturated fatty acids (Figure 6). As DCM is a hydrophobic probe, its lifetime will be increased when the surrounding microenvironment is changed to be more hydrophobic and at the same time rigid.
Figure 5.
FLIM images of the CM (comparatively larger aggregate) (a) in the absence of fatty acids and the presence of (b) MA, (c) SA, (d) AA, (e) OA, and (f) LA. The scale bar is 1 μm.
Figure 6.
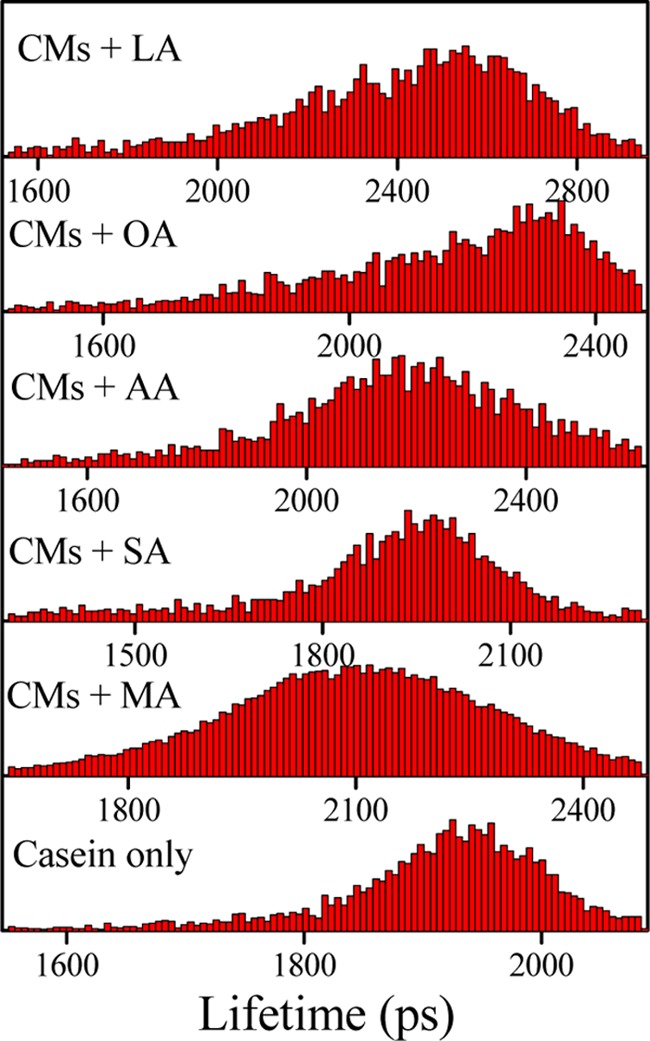
Lifetime distribution of DCM various fatty acid casein medium.
The FCS technique is an elegant and sensitive method to determine the diffusion dynamic of the heterogeneous assemblies in sub-microsecond time scales.25,28,29 Here, the fluctuation in the fluorescence intensity is taken into account within a small volume, i.e., at the single-molecule level, to determine the diffusion coefficient (Dt), which can be utilized to extract the information about the size, morphology, and structural heterogeneity of the organized assemblies.25,28 In this study, we have measured the fluorescence autocorrelation trace (FCS trace) of DCM in the presence of casein with different fatty acids. The normalized traces are highlighted in Figure 7. For a higher polydispersity in size, multiple fittings are performed for different FCS traces, and “Dt” is calculated from the fitting data (Table S1, Supporting Information). In the casein medium DCM shows two types of diffusion coefficients, where the faster component (Dt1) of 302.78 μm2 s–1 corresponds to the diffusion of DCM in the bulk aqueous medium and the slower component (Dt2) comes from the incorporation of the DCM into the CMs. Now, we compare the difference in the diffusion rate (Dt2) of DCM due to the addition of various fatty acids onto the CMs. The results indicate that in the case of unsaturated fatty acids, the Dt2 (13.10 and 14.41 μm2 s–1 for OA and LA, respectively) is comparatively slower with respect to casein (24.01 μm2 s–1) and the Dt2 after the addition of saturated fatty acids is 20.23, 19.73, and 18.32 μm2 s–1 for MA, SA, and AA, respectively. Also, the contribution of Dt2 is more for unsaturated fatty acids (0.30 and 0.26 for OA and LA, respectively), whereas, in the case of saturated fatty acid, it is found that the Dt2 value is marginally altered with the increasing carbon chain of fatty acid from MA to AA. Therefore, from these results, we can say that the diffusion motion of CMs in the solution is considerably slowed down in the presence unsaturated fatty acid. This could be due to the formation of larger sized aggregates.
Figure 7.
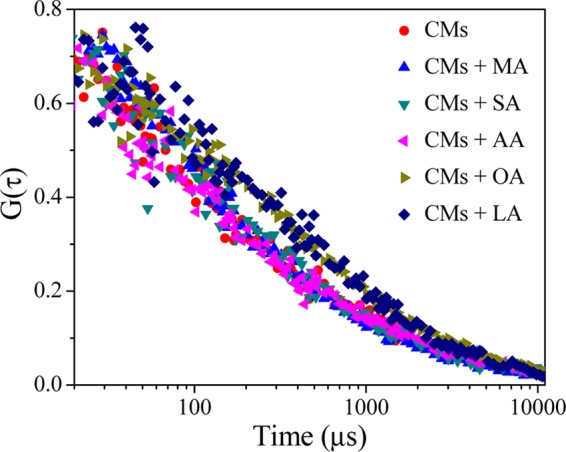
Normalized FCS traces of DCM (10 nM) in CMs (0.025 mg mL–1) and different fatty acid (50 μM) medium at 298 K.
2.5. Photophysical Investigation with ANS
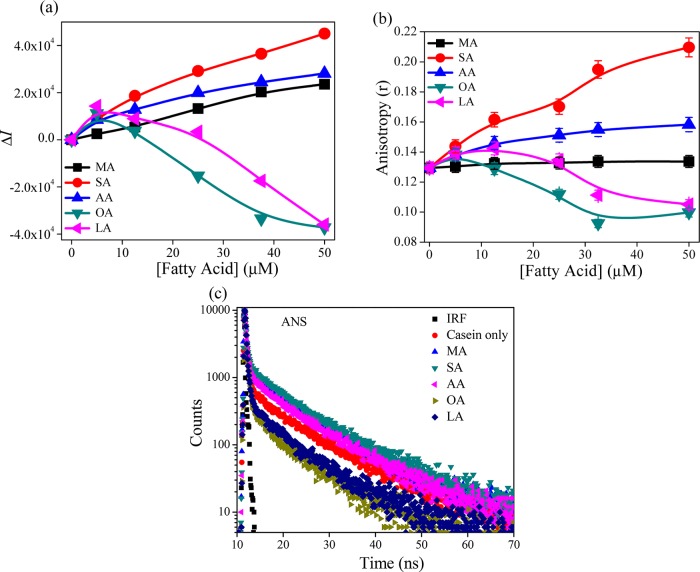
ANS has been widely used to study the microheterogeneity and surface-related phenomena of proteins, micelles, polymers, and lipid bilayer membrane systems.30 The ANS shows a low green fluorescence at around 524 nm; but in the presence of CMs, the band is largely blue shifted (∼30 nm), with a substantial increase (∼2-fold) in the fluorescence intensity (Figure S4, Supporting Information). However, the increment in intensity is quite less as compared to that in micelles, polymers, and lipid bilayer. Figure 8a displays the change in the fluorescence intensity of ANS with the addition of fatty acids. It is found that in the case of saturated fatty acids, the fluorescence intensity increases in the order of SA > AA > MA. However, for unsaturated fatty acids, the fluorescence intensity initially increases slightly, but after that interestingly the fluorescence intensity decreases gradually with an increase in the fatty acid concentration. The drop in the intensity is more for OA than that for LA. However, at 50 μM concentration, the change in fluorescence is almost similar, and the effect of LA still exists (we could not measure the data beyond 50 μM due to the instability of the sample), whereas changes in the intensity saturate for OA. The change in anisotropy value shows a similar trend (Figure 8b). This means that the change in fluorescence is due to the rigidity of microenvironment experienced by the probe ANS. We also studied the excited state phenomenon to understand the dynamics of the ANS probe in the presence of casein micelle. The excited sate decay profile is highlighted in Figure 8c, and fitted parameters are tabulated in Table 2. The lifetime of ANS in the aqueous medium is biexponential in nature, where shorter lifetime component (0.234 ns) is predominant (99.7%) than that of slow component (4.61 ns). However, in the presence of casein, the decay traces of ANS exhibit another slower lifetime component (13.66 ns), and it is presumably arising due to the casein-bound ANS. The incorporation of ANS into CMs provides an increase in τavg value (0.536 ns) than in an aqueous medium (0.247 ns). Actually, here, the rigidness of ANS is due to its incorporation in the hydrophobic region of CMs and consequent formation of ion pair between the positively charged amino acid residue (Arg/Lys/His) and the sulfonate group of ANS. This effectively reduces the intermolecular charge transfer (CT) rate that leads to the enhancement in fluorescence, as well as the τavg value.31Table 2 depicts that with the addition of saturated fatty acids in CMs, the contribution of the slow lifetime component increases, leading to an increase in τavg value (0.746, 0.866, and 0.655 ns for MA, SA, and AA, respectively). With the introduction of unsaturation in the fatty acid, the τavg value is suddenly reduced (0.335 and 0.366 ns for OA and LA, respectively), even lower than the value observed with CMs only (0.536 ns). This indicates that in the presence of unsaturated fatty acids, the ANS is segregated from the CMs to bulk water. Matulis et al. and others reported that the enhancement of fluorescence of ANS is not only for the hydrophobic interaction.30−32 Indeed, from the overall interaction perspective, an electrostatic interaction via the formation of an ion pair is the major determinant in binding. Therefore, here, the two fluorophores (DCM and ANS) are mainly regarded as hydrophobic probes, but they sense the microenvironment differently. DCM only encounters the enhancement in hydrophobic character of CMs due to the addition of fatty acids. On the other hand, results of ANS are quite interesting, which indicate that the reduction in electrostatic interaction with a concomitant increase in the hydrophobic interaction due to the addition of unsaturated fatty acid in CMs leads to the decrease in the fluorescence intensity. It is also interesting to note that for saturated fatty acids, the increase in fluorescence lifetime and blue shifting of emission maxima (Figure S5, Supporting Information) of ANS support the formation of ion pair. This result indicates that the saturated fatty acids do not substantially affect the association of CMs by imparting hydrophobic force of interaction. In fact, the hydrophobic interaction slightly increases without affecting the ion pair formation. This also corroborates the findings from the FE-SEM study, pyrene fluorescence, and FLIM images data. Most likely, the low binding nature of saturated fatty acids could not affect the strong electrostatic interaction. The increase in hydrophobicity of the CMs only with the increase in unsaturation in fatty acid is responsible for the decrease in the fluorescence of ANS. Also the observed pattern (first increase then decrease)in the fluorescence behavior (intensity and anisotropy) of ANS (Figure 8a and b) in the presence unsaturated fatty acids looks interesting, and indicates that above some concentration the fatty acids the hydrophobic nature of interaction becomes prominent and possibly masks the electrostatic factors substantially. In the case of unsaturated fatty acid, we observe more changes for OA than for LA. However, LA contains one more unsaturation unit than OA. Consequently, more changes are expected to be observed in the case of LA, if the hydrophobic force is dominated here. From the above results we may suggest that the strength binding affinity between unsaturated fatty acid and casein depends upon the appropriate hydrophilic–lipophilic balance (HLB) of the fatty acids, and this balance is optimum for OA.
Figure 8.
(a) Change in the fluorescence intensity (ΔI) and (b) change in the anisotropy of ANS (5 μM) with the addition of fatty acids in the presence of CMs (0.05 mg mL–1). (c) Fluorescence decay profiles (in log scale) of ANS (5 μM) in the presence of various fatty acids on casein micelle.
Table 2. Fluorescence Lifetime Parameters (λex = 376.0 nm) of ANS at 298 Ka.
| systems | τ1 (a1) (ns) | τ2 (a2) (ns) | τ2 (a3) (ns) | τavg (ns) |
|---|---|---|---|---|
| water | 0.234 (0.997) | 4.61 (0.003) | 0.247 | |
| CM | 0.239 (0.965) | 4.61 (0.019) | 13.66 (0.016) | 0.536 |
| CM + MA | 0.236 (0.938) | 5.43 (0.038) | 13.28 (0.024) | 0.746 |
| CM + SA | 0.244 (0.926) | 5.72 (0.048) | 14.13 (0.026) | 0.866 |
| CM + AA | 0.234 (0.947) | 4.86 (0.031) | 12.85 (0.022) | 0.655 |
| CM + OA | 0.219 (0.981) | 3.06 (0.012) | 10.39 (0.008) | 0.335 |
| CM + LA | 0.226 (0.980) | 4.25 (0.012) | 11.66 (0.008) | 0.366 |
Experimental errors in the determination of lifetime ±5%.
3. Conclusions
In the present study, we have demonstrated the change in microenvironment of CMs in terms of structural alteration due to fatty acid binding. For this, we have purposely employed different varieties of fatty acids with increasing aliphatic chain length (MA, SA, and AA) or unsaturation (OA and LA). The DLS study indicates that in the presence of unsaturated fatty acids, the size of CMs is significantly enhanced than that with saturated fatty acid; also, there is little structural changeover of CMs from irregular to α-helix as is evident from the CD studies. Pyrene fluorescence studies have further indicated that the hydrophobic nature inside the CMs increases with increase in fatty acid chain length and unsaturation. High Ksv value for OA and LA indicates that unsaturated fatty acids bind strongly with CMs. It also found that Ksv value progressively increases with increasing fatty acid chain length. To understand the facts more clearly, we have used two extrinsic fluorophores (DCM and ANS). These molecules differently sense an alteration in the microenvironmental rigidity. Fluorescence and FLIM studies suggest that compactness and rigidity of CMs are higher in the case of unsaturated fatty acid, exhibiting a higher lifetime distribution. Such change in microenvironment with size is responsible for the observed slow diffusion time (Dt) of the CM-unsaturated fatty acid complex. Interestingly, in the case of unsaturated fatty acids, the decrease in fluorescence intensity of ANS has been found. It could be thought that unsaturated fatty acid adds up more hydrophobicity to the CMs, specifically to the surface binder κ-casein. For this reason, the electrostatic interaction of CMs is largely modified to show a little ordered structure (α-helix), increase in the size of aggregate, and a drop in ANS fluorescence intensity. Eventually, this study provides the information about the important aspect of fatty acid binding by monitoring the change in the microstructure of casein, and this will further help to understand the pattern of interaction of small molecules as nutrients with milk.
4. Materials and Methods
4.1. Materials
Casein micelles (CMs) were purchased from TCI Chemicals (Japan) and used as received without further purification. The used fatty acids for this study were purchased from Sigma-Aldrich. 4-(Dicyanomethylene)-2-methyl-6-(4-dimethylaminostyryl)-4H-pyran (DCM) and 8-anilino-1-naphthalenesulfonic acid magnesium(II) salt hydrate (ANS) were purchased from Exciton and TCI Chemicals (Japan), respectively. NaCl (analytical grade, Merck, India) and methanol (UV spectroscopic grade, Spectrochem, India) and all of the other chemicals were of analytical reagent (AR) grade. Ultrapure Milli-Q water was used in the study. All of the solutions were prepared in 5 mM sodium phosphate buffer of pH 7.4 (±0.1). The pH was measured with a precalibrated EUTECH pH 510 ion pH meter.
4.2. Instrumentation and Methods
Dynamic light scattering (DLS) measurements were performed using a Malvern Nano ZS instrument (model no. ZEN3600) having a thermostated sample chamber. All of the data were collected using a 4 mW He–Ne laser (λ = 632 nm).
Field emission scanning electron microscopy (FESEM) images were acquired using a FEI NOVA NANOSEM 450 working at 5 kV. The film samples spread on the glass slide were coated with gold particles in a sputter coater.
The CD spectra were collected on a Jasco J-815 circular dichroism (CD) spectropolarimeter over a wavelength range of 190–260 nm, with a scan speed of 50 nm/min at 298 K under constant N2 flushing. A 0.1 cm thick quartz cell was used, and two consecutive scans were taken to generate each spectrum. All of the spectra were baseline corrected by subtracting the spectrum of the buffer solution under the same condition.
The UV–vis absorption spectra were collected by scanning solution in the 1 cm cuvette in the wavelength range 250–600 nm on a Shimadzu UV-2600 absorption spectrophotometer equipped with a TCC-260 thermoelectrically temperature-controlled cell holder.
The steady-state fluorescence spectra were accrued with a Horiba Jobin Yvon spectrofluorometer (Flurolog-3) attached to a temperature-controlled water-cooled cuvette holder to maintain the constant experimental temperature (298 K), and a 1 cm path length quartz cuvette was used to take the scan of the solutions.
Steady-state anisotropy (r) was also measured by the same fluorescence instrument. The steady-state anisotropy (r) is expressed as follows
| 2 |
| 3 |
where IVV and IVH are the emission intensities collected from the sample when the excitation polarizer is oriented vertically and the emission polarizer is placed vertically and horizontally, respectively. G is the correction factor for the instrument and estimated by keeping the excitation polarizer horizontal and the emission polarizer vertical and horizontal successively.
The fluorescence lifetime studies were carried out using a time-correlated single photon counting (TCSPC) spectrometer from Edinburgh Instrument Ltd. (U.K.) as described in our earlier report.33 Briefly, the samples were excited at 376.0 and 442.6 nm using a picoseconds laser diodes (EPL-375 and EPL-445) for ANS and DCM, respectively, and the signals were collected at a magic angle of 54.7° using a high-speed photomultiplier tube (H10720-01, photosensor module from Hamamatsu, Japan). The instrument response functions (IRFs) were ∼260 ps (full width at half-maximum, FWHM) for these two laser diodes. All of the fluorescence decays were monitored at the corresponding emission maxima obtained from the steady-state fluorescence measurements. The data were analyzed using a F-900 software from Edinburgh Instruments. All of the fluorescence decays were fitted with a multiexponential function considering a χ2 value close to 1, which is an indication of a good fit.
Now, the average lifetime of the samples was calculated by multiexponential decay function using the following equation
| 4 |
where ai is the pre-exponential terms of ith component of τ.
The fluorescence lifetime images of DCM in the casein medium in the absence and presence of fatty acids were taken using a DCS-120 confocal laser scanning system (Becker & Hickl DCS-120) with an inverted microscope from Zeiss with 20× objective. For this experiment, 488 nm laser was used as an illumination source. A suitable filter (510LP, Chroma) was placed before the detectors to block the exciting laser light. The fluorescence was focused through a pinhole (1.5 mm). The polarized dual-channel optical scanner DCS-120 from Becker & Hickl (bh) was used with a galvodrive controller unit (Becker & Hickl GDA- 120), and the signal was detected by a pair of HMP-100-40 GaAsP hybrid detectors (ID-Quantique ID100). This FLIM system employs the bh SPCM data acquisition software. The signal was subsequently processed by the SPCImage software module by performing a deconvolution on the decay data in the pixels of FLIM data. The instrument response function (IRF) of this setup was ∼100 ps (full width at half-maximum, FWHM). In each case, the images were taken after some time period (∼10–15 min) to ensure proper immobilization of the samples on the glass surface.
The FCS study of the DCM was performed in the casein medium, adding various fatty acids using the same instrument for FLIM measurement with the water-immersion objective (40×). The autocorrelation function G(τ) has been defined in the following equation with respect to the temporal fluctuation of fluorescence intensity in confocal volume.
| 5 |
where δF(t) is the fluctuation in the fluorescence intensity at time t, δF(t + τ) is the fluctuation after a delay time τ, and ⟨F(t)⟩ is the average fluorescence intensity.
In this study, a three-dimensional (3D) diffusion model have been utilized for fitting the autocorrelation curves and G(τ) can be described as the following equation for c fraction of dyes diffused within in the casein medium.
| 6 |
In the above equation, N denotes the number of fluorophores within the focal volume, φi is the fractional weighting factor for the ith contribution to the autocorrelation curve, τDi is the diffusion time of the fluorescent species within the observation volume, and τ is the delay or lag time. k denotes the structure parameter of the excitation volume.
To determine diffusion coefficient Dt, the following equation was employed
| 7 |
where w0 is the transverse radius of the confocal volume, and it was calibrated using a reference sample (R6G) of known diffusion coefficient (426 μm2 s–1). The estimated value of k was found to be 5 and the volume of the excitation volume was ∼1.5 fL with w0 ∼ 365 nm.
Acknowledgments
M.H. thanks DST SERB Govt. of India (Fund no. SB/S1/PC-041/2013) for financial support. S.P. and D.K.K. thanks UGC India for their individual fellowships. We thank Prof. D. Dhara for help in measuring DLS in his laboratory. We would like to thank the anonymous reviewers for their critical comments and suggestions.
Supporting Information Available
The Supporting Information is available free of charge on the ACS Publications website at DOI: 10.1021/acsomega.7b01741.
Far-UV CD spectra of the CMs (0.1 mg mL–1) in the presence of different fatty acids (50 μM) at 298 K(Figure S1); fluorescence spectra of DCM (5 μM) in the absence and presence of CMs (0.05 mg mL–1) at 298 K (Figure S2); FESEM images of CMs (0.05 mg mL–1) (a) in the absence of fatty acids and presence of (b) MA, (c) SA, (d) AA, (e) OA, and (f) LA (50 μM) (Figure S3); fluorescence spectra of ANS (5 μM) in the absence and presence of CMs (0.05 mg mL–1) at 298 K (Figure S4); normalized fluorescence spectra of ANS (5 μM) with addition of various fatty acids (50 μM) in the CMs (0.05 mg mL–1) at 298 K (Figure S5); translational diffusion parameter of DCM in water, CMs, and presence of different fatty acid in CMs (Table S1) (PDF)
The authors declare no competing financial interest.
Supplementary Material
References
- Elzoghby A. O.; El-Fotoh W. S. A.; Elgindy N. A. Casein-based formulations as promising controlled release drug delivery systems. J. Controlled Release 2011, 153, 206–216. 10.1016/j.jconrel.2011.02.010. [DOI] [PubMed] [Google Scholar]
- Lohcharoenkal W.; Wang L. Y.; Chen Y. C.; Rojanasakul Y. Protein Nanoparticles as Drug Delivery Carriers for Cancer Therapy. BioMed Res. Int. 2014, 2014, 180549 10.1155/2014/180549. [DOI] [PMC free article] [PubMed] [Google Scholar]
- Gagner J. E.; Kim W.; Chaikof E. L. Designing protein-based biomaterials for medical applications. Acta Biomater. 2014, 10, 1542–1557. 10.1016/j.actbio.2013.10.001. [DOI] [PMC free article] [PubMed] [Google Scholar]
- Walstra P. In Studying Food Colloids: Past, Present and Future; Dickinson E., van Vlie T., Eds.; Royal Society of Chemistry: Cambridge, 2003. [Google Scholar]
- Le Maux S.; Bouhallab S.; Giblin L.; Brodkorb A.; Croguennec T. Bovine beta-lactoglobulin/fatty acid complexes: binding, structural, and biological properties. Dairy Sci. Technol. 2014, 94, 409–426. 10.1007/s13594-014-0160-y. [DOI] [PMC free article] [PubMed] [Google Scholar]
- Picciano M. F. Nutrient composition of human milk. Pediatr. Clin. North Am. 2001, 48, 53–67. 10.1016/S0031-3955(05)70285-6. [DOI] [PubMed] [Google Scholar]
- Phadungath C. Casein micelle structure: a concise review. Songklanakarin J. Sci. Technol. 2005, 27, 201–212. [Google Scholar]
- Liu Y.; Guo R. pH-dependent structures and properties of casein micelles. Biophys. Chem. 2008, 136, 67–73. 10.1016/j.bpc.2008.03.012. [DOI] [PubMed] [Google Scholar]
- Liu Y.; Guo R. Interaction between casein and the oppositely charged surfactant. Biomacromolecules 2007, 8, 2902–2908. 10.1021/bm7006136. [DOI] [PubMed] [Google Scholar]
- Dalgleish D. G. On the structural models of bovine casein micelles—review and possible improvements. Soft Matter 2011, 7, 2265–2272. 10.1039/C0SM00806K. [DOI] [Google Scholar]
- Fahy E.; Subramaniam S.; Brown H. A.; Glass C. K.; Merrill A. H.; Murphy R. C.; Raetz C. R. H.; Russell D. W.; Seyama Y.; Shaw W.; Shimizu T.; Spener F.; van Meer G.; VanNieuwenhze M. S.; White S. H.; Witztum J. L.; Dennis E. A. A comprehensive classification system for lipids. J. Lipid Res. 2005, 46, 839–861. 10.1194/jlr.E400004-JLR200. [DOI] [PubMed] [Google Scholar]
- Calder P. C. Functional Roles of Fatty Acids and Their Effects on Human Health. JPEN, J. Parenter. Enteral Nutr. 2015, 39, 18S–32S. 10.1177/0148607115595980. [DOI] [PubMed] [Google Scholar]
- Vlaeminck B.; Fievez V.; Cabrita A. R. J.; Fonseca A. J. M.; Dewhurst R. J. Factors affecting odd- and branched-chain fatty acids in milk: A review. Anim. Feed Sci. Technol. 2006, 131, 389–417. 10.1016/j.anifeedsci.2006.06.017. [DOI] [Google Scholar]
- Månsson H. L. Fatty acids in bovine milk fat. Food Nutr. Res. 2008, 52, 1821 10.3402/fnr.v52i0.1821. [DOI] [PMC free article] [PubMed] [Google Scholar]
- Aynié S.; Lemeste M.; Colas B.; Lorient D. Interactions between Lipids and Milk-Proteins in Emulsion. J. Food Sci. 1992, 57, 883–886. 10.1111/j.1365-2621.1992.tb14315.x. [DOI] [Google Scholar]
- Yi C.; Wambo T. O. Factors affecting the interactions between beta-lactoglobulin and fatty acids as revealed in molecular dynamics simulations. Phys. Chem. Chem. Phys. 2015, 17, 23074–23080. 10.1039/C5CP02312B. [DOI] [PMC free article] [PubMed] [Google Scholar]
- Zimet P.; Rosenberg D.; Livney Y. D. Re-assembled casein micelles and casein nanoparticles as nano-vehicles for omega-3 polyunsaturated fatty acids. Food Hydrocolloids 2011, 25, 1270–1276. 10.1016/j.foodhyd.2010.11.025. [DOI] [Google Scholar]
- Pauloin A.; Chat S.; Pechoux C.; Hue-Beauvais C.; Droineau S.; Galio L.; Devinoy E.; Chanat E. Oleate and linoleate stimulate degradation of beta-casein in prolactin-treated HC11 mouse mammary epithelial cells. Cell Tissue Res. 2010, 340, 91–102. 10.1007/s00441-009-0926-3. [DOI] [PubMed] [Google Scholar]
- Bomholt J.; Moth-Poulsen K.; Harboe M.; Karlson A. O.; Qvist K. B.; Bjornholm T.; Stamou D. G. Monitoring the Aggregation of Single Casein Micelles Using Fluorescence Microscopy. Langmuir 2011, 27, 866–869. 10.1021/la1035163. [DOI] [PubMed] [Google Scholar]
- Mishra S.; Meher G.; Chakraborty H. Conformational transition of kappa-casein in micellar environment: InSight from the tryptophan fluorescence. Spectrochim. Acta, Part A 2017, 186, 99–104. 10.1016/j.saa.2017.06.014. [DOI] [PubMed] [Google Scholar]
- Farrell H. M.; Wickham E. D.; Unruh J. J.; Qi P. X.; Hoagland P. D. Secondary structural studies of bovine caseins: temperature dependence of beta-casein structure as analyzed by circular dichroism and FTIR spectroscopy and correlation with micellization. Food Hydrocolloids 2001, 15, 341–354. 10.1016/S0268-005X(01)00080-7. [DOI] [Google Scholar]
- Aguiar J.; Carpena P.; Molina-Bolivar J. A.; Ruiz C. C. On the determination of the critical micelle concentration by the pyrene 1: 3 ratio method. J. Colloid Interface Sci. 2003, 258, 116–122. 10.1016/S0021-9797(02)00082-6. [DOI] [Google Scholar]
- Bolel P.; Halder M. Fluorescence quenching of carmoisine by viologens in neat methanol: Observation of inversion in quenching. Chem. Phys. Lett. 2011, 507, 234–239. 10.1016/j.cplett.2011.03.054. [DOI] [Google Scholar]
- Lakowicz J. R.Principles of Fluorescence Spectroscopy, 3rd ed.; Springer: New York, 2006. [Google Scholar]
- Kundu N.; Banerjee P.; Kundu S.; Dutta R.; Sarkar N. Sodium Chloride Triggered the Fusion of Vesicle Composed of Fatty Acid Modified Protic Ionic Liquid: A New Insight into the Membrane Fusion Monitored through Fluorescence Lifetime Imaging Microscopy. J. Phys. Chem. B 2017, 121, 24–34. 10.1021/acs.jpcb.6b09298. [DOI] [PubMed] [Google Scholar]
- Sen S.; Dutta P.; Mukherjee S.; Bhattacharyya K. Solvation dynamics in bile salt aggregates. J Phys. Chem. B 2002, 106, 7745–7750. 10.1021/jp0144799. [DOI] [Google Scholar]
- Pal S. K.; Mandal D.; Sukul D.; Sen S.; Bhattacharyya K. Solvation dynamics of DCM in human serum albumin. J Phys. Chem. B 2001, 105, 1438–1441. 10.1021/jp002368o. [DOI] [Google Scholar]
- Kuchlyan J.; Roy A.; Dutta R.; Sena S.; Sarkar N. Effect of the submicellar concentration of bile salts on structural alterations of β-casein micelles. RSC Adv. 2016, 6, 71989–71998. 10.1039/C6RA14804B. [DOI] [Google Scholar]
- Sasmal D. K.; Mondal T.; Sen Mojumdar S.; Choudhury A.; Banerjee R.; Bhattacharyya K. An FCS Study of Unfolding and Refolding of CPM-Labeled Human Serum Albumin: Role of Ionic Liquid. J. Phys. Chem. B 2011, 115, 13075–13083. 10.1021/jp207829y. [DOI] [PubMed] [Google Scholar]
- Mohapatra M.; Mishra A. K. Photophysical Behavior of 8-Anilino-1-Naphthalenesulfonate in Vesicles of Pulmonary Surfactant Dipalmitoylphosphatidylcholine (DPPC) and Its Sensitivity toward the Bile Salt-Vesicle Interaction. Langmuir 2013, 29, 11396–11404. 10.1021/la402355j. [DOI] [PubMed] [Google Scholar]
- Gasymov O. K.; Glasgow B. J. ANS fluorescence: potential to augment the identification of the external binding sites of proteins. Biochim. Biophys. Acta 2007, 1774, 403–411. 10.1016/j.bbapap.2007.01.002. [DOI] [PMC free article] [PubMed] [Google Scholar]
- Matulis D.; Lovrien R. 1-anilino-8-naphthalene sulfonate anion-protein binding depends primarily on ion pair formation. Biophys. J. 1998, 74, 422–429. 10.1016/S0006-3495(98)77799-9. [DOI] [PMC free article] [PubMed] [Google Scholar]
- Panja S.; Behera S.; Kundu S. C.; Halder M. Optical Spectroscopic and Morphological Characterizations of Curcuminized Silk Biomaterials: A Perspective from Drug Stabilization. ACS Omega 2017, 2, 6755–6767. 10.1021/acsomega.7b00809. [DOI] [PMC free article] [PubMed] [Google Scholar]
Associated Data
This section collects any data citations, data availability statements, or supplementary materials included in this article.


