Abstract
In computational drug discovery, ranking a series of compound analogues in the order that is consistent with the experimental binding affinities remains a challenge. Many of the computational methods available for evaluating binding affinities have adopted molecular mechanics (MM)-based force fields, although they cannot completely describe protein–ligand interactions. By contrast, quantum mechanics (QM) calculations play an important role in understanding the protein–ligand interactions; however, their huge computational costs hinder their application in drug discovery. In this study, we have evaluated the ability to rank the binding affinities of tankyrase 2 ligands by combining both MM and QM calculations. Our computational approach uses the protein–ligand binding energies obtained from a cost-effective multilayer fragment molecular orbital (MFMO) method combined with the solvation energy obtained from the MM-Poisson–Boltzmann/surface area (MM-PB/SA) method to predict the binding affinity. This approach enabled us to rank tankyrase 2 inhibitor analogues, outperforming several MM-based methods, including rescoring by molecular docking and the MM-PB/SA method alone. Our results show that this computational approach using the MFMO method is a promising tool for predicting the rank order of the binding affinities of inhibitor analogues.
Introduction
Computational approaches in structure-based drug design have become increasingly important for rational drug discovery. For these computational approaches, even if the structure of a protein–ligand complex can be accurately predicted based on X-ray crystallography data, accurate ranking of protein–ligand binding affinities using this approach is still a major challenge.
Various structure-based computational methodologies exist for the prediction or ranking of protein–ligand binding affinities. Molecular docking, which is one of the simplest methods, is a powerful tool often used for compound screening. This method uses an approximate scoring function to compute a docking score corresponding to the binding affinity. It is well-known that this method can be useful for discriminating active compounds from inactive ones, however, the ability to rank protein–ligand binding affinities is not sufficiently reliable for drug design. In addition to molecular docking, more accurate computational techniques using molecular dynamics (MD) simulations are available for estimating the binding free energy. These techniques include thermodynamic integration,1 free energy perturbation,1 linear interaction energy,2 and molecular mechanics-Poisson–Boltzmann and surface area (MM-PB/SA)3 methods. Most of these methods use classical molecular mechanics (MM) force fields. Although MM force fields have the advantage of fast energy calculations that allow efficient conformation samplings, the accuracy of the MM force field for protein and ligand molecules strongly affects the estimate of protein–ligand binding affinity. Protein–ligand systems have a variety of nonbonded interactions, such as π-stacking, charge transfer, polarization effects, and dispersion effects as well as the usual and weak hydrogen bonds, as evidenced by structural studies.4 These nonbonding interactions cannot be understood with sufficient accuracy using classical MM force fields.
By contrast, the application of first-principles (or ab initio) quantum mechanics (QM) calculations, which take into consideration such nonbonding interactions, can significantly improve the accuracy of calculations made using the MM force fields. Therefore, QM methods play an important role in understanding protein–ligand interactions. Although there has been great interest in the use of QM methods in the field of drug discovery, the huge computational costs hinder their practical use. A combined QM and MM approach,5−7 such as the QM/MM8 and ONIOM9 methods, is one of the cost-effective QM methods available for computation in biomolecular systems. In the QM/MM and ONIOM methods, a region of special interest (e.g., the active site region) is included in the QM region, and the rest of the system is treated at the MM level. The application of these methods alleviates several issues in the classical description of biomolecular interactions and enables their more accurate description at a relatively moderate computational cost.5−7 Another cost-effective QM method for treating biomolecular systems is the fragment molecular orbital (FMO) method.10−14 In this method, the electronic states of large biomolecular systems, such as proteins or DNA, can be computed through a fragment-based strategy. The biomolecular system is divided into fragments, and then the QM calculations are applied to the individual fragments. We have previously evaluated an efficient acceleration scheme15 for understanding protein–ligand interactions using a multilayer fragment molecular orbital (MFMO) method.16 The computational approach using the MFMO method can reduce the computational costs compared with the conventional FMO method, while maintaining accuracy. On the basis of these previous studies,15,16 we concluded that the MFMO method can be utilized to predict the binding affinity for protein–ligands.
In this study, we used the binding energy for an energy-minimized structure of protein–ligand complex obtained from the MFMO method for the prediction of rank-ordering of protein–ligand binding affinity. Furthermore, to obtain more accurate protein–ligand affinity, the effects of solvation, entropy, and conformational samplings need to be considered. The scoring function used for the prediction of protein–ligand binding affinity was based on the MM-PB/SA method, and the solvation energy of a single energy-minimized structure was evaluated using the MM-PB/SA method, which has been reported in previous studies to be a reasonable approach.17−19 For the entropic effect of protein–ligand association, the change in entropy of the protein and the ligand largely contributes to the binding affinity. In our scoring function, the conformational entropic change of the ligand only was estimated using the number of single rotatable bonds in the ligand. This simple estimation for ligand conformational entropy has been reported in several previous studies.20−22 In our computational approach, the effect of conformational sampling was not considered. To the best of our knowledge, this is the first report of the practical application of the MFMO method for rational structure-based drug design.
Our computational approach was applied to evaluate the binding affinities of 23 inhibitor analogues of tankyrase 2 (see Figures S1 and S2 in the Supporting Information).23 Tankyrase belongs to the family of poly(ADP-ribose) polymerases (PARPs) and modifies its substrate protein through poly-ADP-ribosylation (PARsylation) using nicotinamide adenine dinucleotide as a substrate.24 The two isoforms of tankyrase (tankyrase 1 and tankyrase 2) share overlapping functions and similar structures, including the ankyrin repeat domain, the sterile alpha molecule domain, and the PARP catalytic domain.24 They are involved in a multitude of cellular functions,25−31 including telomere homeostasis, mitotic spindle formation, vesicle transport linked to glucose metabolism, Wnt/β-catenin signaling, and viral replication. In particular, it has been shown that tankyrase proteins regulate the activity of the Wnt/β-catenin pathway in colon cancer cells through PARsylation and destabilization of the axin protein.32 Because deregulation of this pathway has been identified in many cancers, tankyrase proteins have become attractive drug targets. Several recent studies23,33−36 have identified small-molecule inhibitors of tankyrase proteins that are responsible for the stabilization of axin followed by increased degradation of β-catenin. Here, we evaluated the ranking of the binding affinities of tankyrase 2 inhibitors that had been identified by Shultz et al. because their results revealed a substantial structure–activity relationship23 (Figures S1 and S2 in the Supporting Information). Because the structures of these inhibitor analogues are all similar, it is presumed from the X-ray crystallographic information33,35 that the inhibitor analogues used in this study are accommodated in the nicotinamide binding pocket, forming hydrogen bonds with Gly1032 and Ser1068 of the tankyrase 2 protein (see Figure 1).
Figure 1.
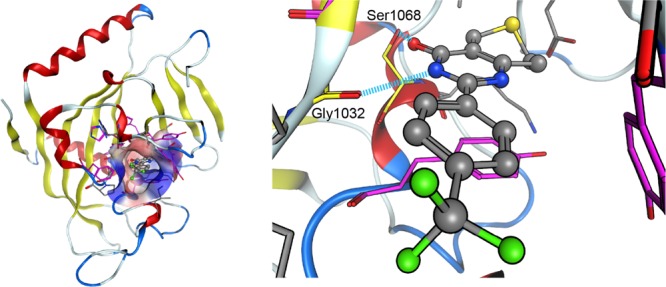
Tankyrase 2 inhibitor (C01) in the nicotinamide binding pocket. The left-hand figure shows the structure of the tankyrase 2-inhibitor (C01) complex (PDB entry: 3KR8). The molecular surface representation shows the nicotinamide binding pocket that accommodates the inhibitor. Here, the inhibitor is shown by a ball and stick model. The hydrophobic and hydrophilic regions in the binding pocket are drawn in blue and red, respectively. The amino acid residues constituting the binding pocket are shown by stick models. Among these amino acid residues, aromatic amino acid residues are drawn in purple. The right-hand figure shows the inside of the binding pocket of the left-hand figure. Gly1032 and Ser1068 in the tankyrase 2 protein form hydrogen bonds with the inhibitor. It is expected that Gly1032 and Ser1068 would form similar hydrogen bonds with other inhibitors.
Results
Rank-Ordering of Class A Ligands
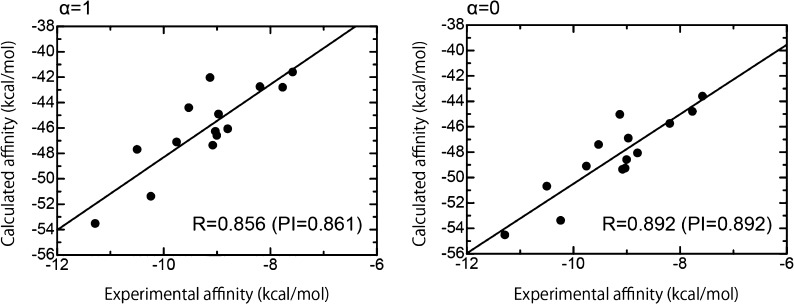
In this study, we classified all ligands into two classes, A and B, according to the structural characteristics of the ligands (see Materials and Methods section for the details and Figure 2). First, we evaluated the prediction of rank-ordering using our computational approach for the protein–ligand binding affinities of class A ligands. To assess how accurately our computed affinities described the experimentally measured binding affinities, we analyzed the correlation between our calculated affinities and the experimental affinities (Figure 3). From Figure 3, it is clear that there was a relatively high correlation between the binding affinities calculated using our scoring function and the experimental binding affinities [correlation coefficient (R) > 0.856 and predictive index (PI) > 0.861]. Values were obtained with or without the weighting factor α for the entropic term (see Materials and Methods section), although structural sampling was not performed. However, it should be noted that the absolute values of the calculated binding affinities were largely overestimated compared to the experimental values. In addition, from Figure S3 in the Supporting Information, it can be seen that the binding affinity obtained using the MFMO method was as good as that obtained using the conventional FMO method, as has been reported in our previous paper.16 Here, we also focused on the weighting factor α for the entropic term in the scoring function. As seen in Figure 3, on comparing the values obtained when α = 1 and α = 0, it was observed that the introduction of the entropic term using single rotatable bonds tends to reduce the R and PI values between our predicted affinities and the experimental affinities for class A ligands. This suggests that inclusion of the entropic term describing single rotatable bonds in the ligand does not make a suitable contribution toward predicting tankyrase 2–ligand binding affinities.
Figure 2.
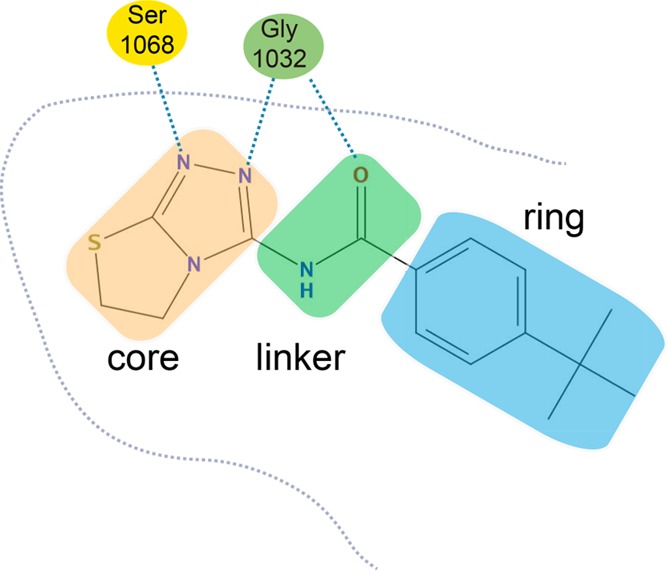
Structural feature of a tankyrase 2 inhibitor. The ligands used in this study have common structural features. The common structural feature is that each ligand consists of three parts, that is, a core, a linker, and a ring. Among these three parts, the linker and the ring affect the conformational flexibility of each ligand. Gly1032 and Ser1068 in the tankyrase 2 protein form hydrogen bonds with the core and linker regions of each ligand. Here, we show the interaction with an inhibitor (C04) as an example.
Figure 3.
Correlation between the experimental binding affinities and the calculated binding affinities using our scoring function for class A ligands. The abscissa and ordinate indicate the experimental and calculated binding affinities, respectively. The calculated binding affinities with a weighting factor of α = 1 (left-hand figure) and those with a weighting factor of α = 0 (right-hand figure) are shown.
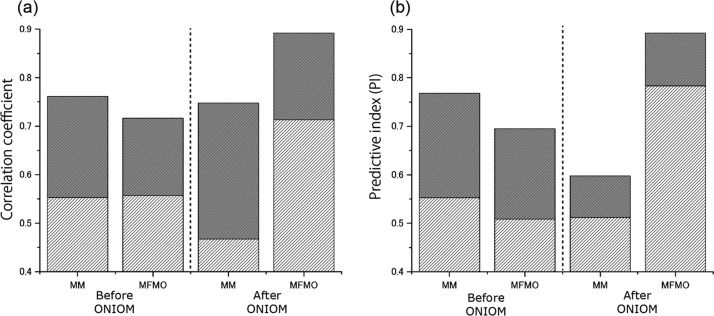
As mentioned above (see Figure 3), our scoring function using the MFMO method showed a high ability to rank ligands. This increased ranking ability was due to factors, namely, geometry refinement by the ONIOM-based QM optimization and incorporation of the solvation energy. From the structural analysis of the tankyrase 2–class A ligand complexes, we found that the averaged root-mean-square deviation for heavy atoms in the QM region before and after the ONIOM-based geometry optimization of each complex structure was 0.295 Å. An example of a typical structural difference is shown in Figure 4. Although these structural changes are relatively small, it is obvious from Figure 5 and Table 1 that the R and PI values between the binding energy, ΔEbindgas from the MFMO calculations and the experimental binding affinities are largely improved by structural refinement of the ONIOM-based geometry optimizations. On the other hand, the R and PI values between ΔEbind values obtained from the MM calculations and the experimental affinities are slightly decreased following the ONIOM-based geometry optimization. From these facts, we can point out that QM-based structural refinements are necessary for an accurate description of protein–ligand interactions using MFMO calculations. On the other hand, we also suggest that MM-based structural refinement might be suitable for the description of protein–ligand interactions using MM calculations (Figure 5).
Figure 4.
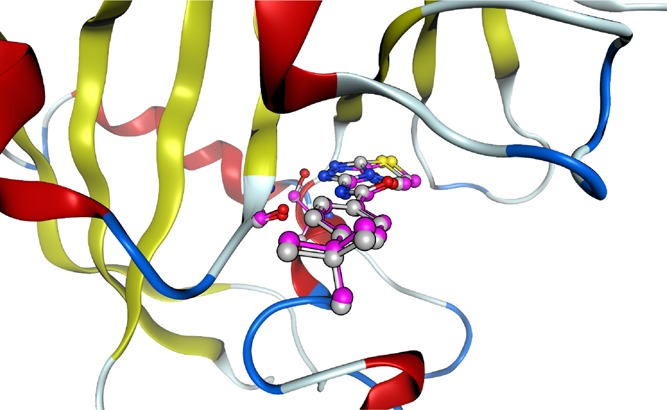
Typical structural differences before and after ONIOM geometry optimization. The figure shows a superposition of the tankyrase 2–ligand (C04) complex structures before and after ONIOM geometry optimization. The heavy atoms of the QM regions before and after ONIOM geometry optimization are shown by light gray and purple ball and stick models, respectively. For these tankyrase 2–ligand (C04) complex structures before and after ONIOM geometry optimization, the root-mean-square deviation of the heavy atoms of the structures for the QM regions is 0.311 Å.
Figure 5.
Correlation coefficient and PI values for the experimental binding affinities and the calculated affinities before and after ONIOM geometry optimization for class A ligands. The correlation coefficient R values (a) and the PI values (b) on the MM- or MFMO-based energies are shown for structures of the tankyrase 2–ligand complexes before and after ONIOM geometry optimization. R (or PI) values between the binding energies (ΔEbindgas) and the experimental binding affinities are shown in light gray boxes. In addition, R (or PI) of the sum of the binding energies (ΔEbind) and the solvation energy on protein–ligand association (Gbindsolv) are shown by light and dark gray boxes. The entropic term is not included (i.e., the weighting factor α = 0).
Table 1. Correlation Coefficient and PI Values for the Experimental Binding Affinities and the Calculated Binding Energies Before and After ONIOM Geometry Optimizationsa.
| MM | MFMO | |
|---|---|---|
| before ONIOM | 0.553 (0.553) | 0.557 (0.508) |
| after ONIOM | 0.467 (0.512) | 0.713 (0.783) |
The values in parentheses denote the PI values, whereas the others denote the correlation coefficient R values. For structures of the tankyrase 2–ligand complexes before and after ONIOM geometry optimizations, these values on the MM- or MFMO-based binding energies are shown.
In addition to structural refinements by the ONIOM calculation, the incorporation of solvation energy also improves the R and PI values, as shown in Figure 5. With regard to the effect of the solvation energy, here, we show the binding affinities using conventional FMO with the PB/SA solvation method (our scoring function in this study) and those using conventional FMO with the polarized continuum model (PCM) solvation method (see Materials and Methods). The binding affinities obtained by conventional FMO with the above two solvation methods are shown in Figures S3 and S4 in the Supporting Information. We report here the binding affinities calculated without inclusion of the entropic term (i.e., α = 0). From these data, the binding affinities using conventional FMO with the PB/SA method have a high correlation with the experimental values (R = 0.900 and PI = 0.887). On the other hand, although the binding affinities using conventional FMO with the PCM method without the nonpolar term also show a high correlation with the experimental values (R = 0.870 and PI = 0.870), the binding affinities using the full PCM solvation effects, that is, with the inclusion of polar and nonpolar solvation terms, did not show a good correlation with the experimental values (R = 0.507 and PI = 0.251) (see Figure S4 in the Supporting Information). From the energy component analysis in the full PCM solvation energy, it is obvious that the contribution of dispersion energy, ΔEdisp, made the correlation worse remarkably for our system (see Table S1 in the Supporting Information). Additionally, the ΔGsolv,nonpolar values obtained using the PCM method (14.79 to 23.29 kcal/mol) were larger than the ΔGsolv,nonpolar values obtained using the PB/SA method (−3.08 to −4.09 kcal/mol) and also have the opposite sign. This different contribution of the nonpolar solvation energy has a significant effect on the binding affinity predictions. As Söderhjelm et al. have previously pointed out,37 we can conclude that the computational method including a nonpolar term occasionally has a severe problem for the biomolecular system. As shown in Figure 3 and Figures S3 and S4 in the Supporting Information, the ability to rank order binding affinities using MFMO (or conventional FMO) with the MM-PB/SA method had almost the same order as that seen using conventional FMO with the PCM method not including the nonpolar term. Because the computational cost of the MM-PB/SA method used in our scoring function is much lower than that of the PCM solvation method, which was combined with the conventional FMO calculation, we can conclude that the solvation energy from the MM-PB/SA method is readily applicable for the ranking of protein–ligand binding affinities. From an evaluation of class A ligands, we can conclude that our scoring function can describe the experimental tankyrase 2–class A ligand affinities relatively well, although the effect of structural sampling was not considered and the component of conformational entropy for the ligand does not contribute appropriately to affinity prediction.
Evaluation of Class A and Class B Ligands
In addition to class A ligands, we also evaluated the ranking of all class B ligands with flexible linker and ring parts using our computational approach (see Figures S1 and S2 in the Supporting Information). Unlike class A ligands, multiple binding modes (two or three binding modes) for each class B ligand were considered (see Materials and Methods section). As a result, the lowest scoring value among the multiple scoring values was adopted as the calculated binding affinity.
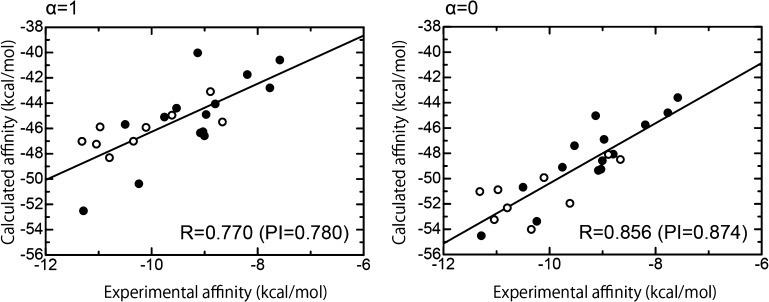
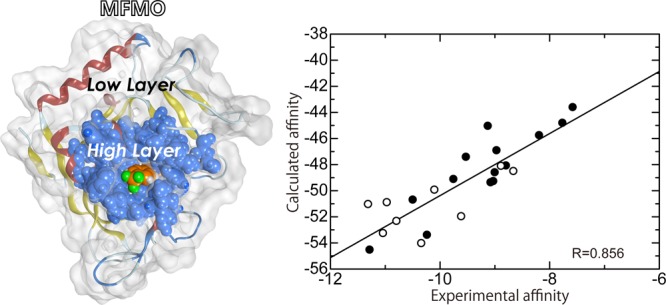
Figure 6 shows the correlation plots between the calculated binding affinities (with the weighting factor α = 1 and α = 0) and the experimental binding affinities. From this analysis, the R and PI values for the no entropic term (α = 0) were 0.856 and 0.874, respectively, which show a high ability to predict experimental binding affinities, although these are slightly lower than the result for class A ligands (see Figure 3). On the other hand, the affinity prediction including the entropic term (α = 1) had a slightly lower ability to predict affinity (R = 0.770 and PI = 0.780) compared with the result of the binding affinity prediction without the entropic term (α = 0), as shown in Figure 6. From these data, we can conclude that the entropic term using the number of single rotatable bonds in the ligand does not have a significant contribution in predicting the binding affinities of tankyrase 2 ligands in the present study. In conclusion, we only attach importance to the binding affinity predictions obtained without the use of the entropic term (α = 0).
Figure 6.
Correlation between the experimental binding affinities and the calculated binding affinities using our scoring function for both class A and class B ligands. The abscissa and ordinate indicate the experimental and calculated binding affinities, respectively. The calculated binding affinities with the weighting factor α = 1 (left-hand figure) and those with the weighting factor α = 0 (right-hand figure) are shown. The filled and open circles indicate class A ligands and class B ligands, respectively.
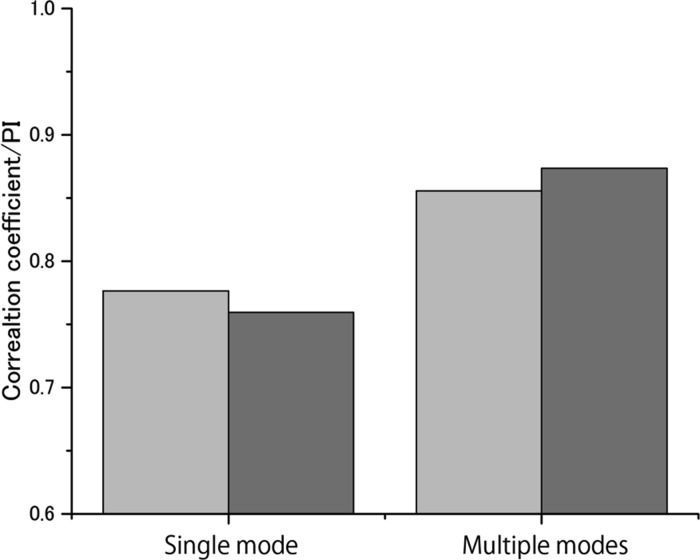
As stated above, we also analyzed the effect of using multiple binding modes for the nine class B ligands. To assess this effect, we analyzed the binding affinity prediction obtained using only the single binding mode with the lowest energy, using the LowModeMD method.38 We found that four out of nine class B ligands have different binding affinities when comparing the data from a single binding mode with data from multiple binding modes (see Figure S5 in the Supporting Information). In particular, the binding affinity for the C29 ligand showed such a large difference (Figure 7). The conformation analysis shown in Figure 7 revealed that the binding pocket structures as well as the ligand conformations were largely different. Figure 8 shows a comparison of the R and PI values for the experimental binding affinities and the calculated binding affinities for the single binding mode and multiple binding modes. It is clear that the use of multiple binding modes improves the performance of prediction as compared with that of the single binding mode, although the computational cost increases accordingly with the increase in the number of binding modes.
Figure 7.
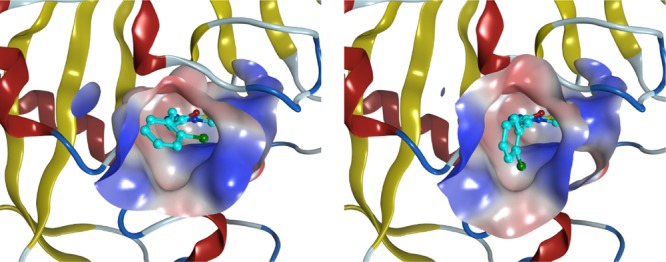
Conformations near ligand C29 used for affinity predictions of the single binding mode and multiple binding modes. The binding conformation of the single binding mode (left-hand figure) and that of the lowest binding energy among the multiple binding modes (right-hand figure) are shown. The molecular surface representation indicates the binding pocket, where the hydrophobic region in the binding pocket is drawn in blue and the hydrophilic region is drawn in red. The ligand is shown by the ball and stick model.
Figure 8.
Comparison of the correlation coefficients and PIs of the experimental binding affinities and the calculated binding affinities obtained using the single binding mode and multiple binding modes. The correlation coefficient and PI values are shown in light gray and dark gray boxes, respectively. The entropic term is not included (i.e., the weighting factor α = 0).
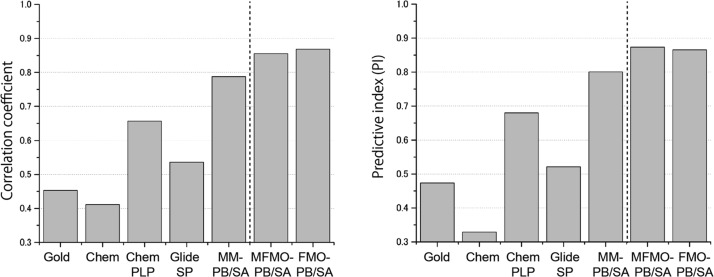
Furthermore, the binding affinity predictions using MFMO and conventional FMO methods (α = 0) were compared to those obtained with the other MM-based methods, including the scoring functions used in molecular docking programs (GoldScore, ChemScore, ChemPLP, and Glide SP) and the MM-PB/SA method, as shown in Figure 9 and Table S2. It is clear that the R and PI values of the rank-ordering of the MFMO method surpasses those of the MM-based methods. Among them, the MM-PB/SA method showed a relatively good performance (R = 0.787 and PI = 0.801). On the other hand, it is clear that the scoring functions for the molecular docking programs have insufficient ability to predict the binding affinity. In addition, the prediction obtained using our scoring function in the MFMO method has a performance equivalent to that of the conventional FMO method (R = 0.868 and PI = 0.866), in the same manner as seen for the class A ligands.
Figure 9.
Comparison of the experimental binding affinities and the calculated binding affinities obtained using the MFMO method, the conventional FMO method, the MM-PB/SA method, and the four scoring functions of molecular docking programs. The correlation coefficients and PIs are shown in the left-hand and right-hand figures, respectively. The binding affinity predictions using our scoring function based on the MFMO and the conventional FMO methods (α = 0) were compared to those of the other MM-based methods, including the scoring functions of four molecular docking programs (GoldScore, ChemScore, ChemPLP, and Glide SP) and the MM-PB/SA method. For each graph, the values to the left of the dashed line correspond to the results of the MM-based methods and the other values correspond to those of the QM-based methods.
Discussion
We evaluated the ability to rank the binding affinities of tankyrase 2 ligands by combining MM and QM calculations. In our novel computational approach (see Materials and Methods section), the protein–ligand binding energies (ΔEbindgas) obtained from the MFMO method on MM- and QM-based geometry-optimized structures of protein–ligand complexes are used to predict the binding affinity. In these protein–ligand binding energies, we previously reported that the accuracy of the binding energy obtained from the MFMO method was almost equivalent to that obtained using the conventional FMO method, in spite of a reduction in computational costs.16 In the current study, to evaluate the ability of binding affinity prediction by our computational approach, we classified all ligands used into class A and class B ligands (see Figures S1 and S2 in the Supporting Information) based on structural features and conformational flexibility. For the study of class A ligands for which the binding mode could be reliably described with reference to a crystal structure, we confirmed that our scoring function, which is composed of binding energy, solvation energy, and an entropic term, has a high ability to rank tankyrase 2–ligand binding affinities (R > 0.856 and PI > 0.861) (Figure 3), although the effect of structural sampling was not considered. In regard to the structural sampling, Liu et al. reported the calculation of binding affinities of 14 avidin-biotin analogues using the QM method.39 In their study, they used the electrostatically embedded generalized molecular fractionation with the conjugate caps method, one of the fragment-based QM approaches, with a conductor-like PCM and indicated that the use of multiple protein–ligand structures obtained from MD simulations improved the correlation coefficient between the calculated binding affinities and experimental values, as compared with the use of single protein–ligand structure. This suggests that the sampling of protein–ligand structure is effective for the prediction of protein–ligand binding affinity. This will be an interesting subject in our future study. The binding energy from the MFMO method and the solvation energy from the MM-PB/SA method largely contributed to the increased ability to predict binding affinity, however, the inclusion of the entropic term based on the number of single rotatable bonds for each ligand was not effective in predicting tankyrase 2–ligand binding affinities. With respect to the solvation energy, we also demonstrated that the solvation energy from the MM-PB/SA method also plays an important role in increasing the ability to predict the binding affinity. The detailed analysis on energy components of the solvation energy is discussed in Table S3 in the Supporting Information. However, we could not evaluate the binding affinity prediction using the MFMO method in combination with the PCM method for two principle reasons: (1) the computation of nonpolar PCM solvation implemented in the GAMMES program is not suitable for tankyrase 2–ligand system used in this study, as Söderhjelm et al. have already reported37 and (2) a poor balance of solvation energies between the low layer and high layer in the MFMO method occurs because of two factors; the region size of the high layer and/or the use of small basis set at the low layer, which makes the binding affinity prediction worse (data not shown). In addition, it is worth noting that the structural refinement of the protein–ligand complexes using the ONIOM calculations, which is one of the preprocessing processes of protein–ligand binding affinity computations using our scoring function, largely improved the correlation between the calculated binding energies and experimental affinities. This suggests that the use of a QM-based energy-minimized structure rather than an MM-based energy-minimized structure is more desirable for the evaluation of protein–ligand interaction using MFMO methods, even though these structures differ only slightly from each other. A further adjustment of the QM region might possibly lead to an adequate improvement in the description of protein–ligand interactions.
In the evaluation of all ligands, including class A and class B ligands, we demonstrated that our prediction without the entropic term had the best ability to rank tankyrase 2–ligand binding affinities. For the class B ligands with a flexible linker and ring, multiple binding conformations were used as the initial complex structures. Our evaluation indicated that the use of multiple binding modes provided more reliable tankyrase 2–ligand complex structures through MM-based and ONIOM-based QM energy minimizations, which suggest that our scoring function could provide more reliable binding affinities by adopting the lowest binding affinity from among multiple energy-minimized structures. However, the use of the multiple binding conformations in our computational approach was accompanied by an increase in the computational cost. For the 9 class B ligands, 23 ligand-binding conformations were evaluated, so that the computational cost for a class B ligand increased by about 2.5 times compared with that for a class A ligand. In this context, because the computational time required to apply the MFMO method is about 6 times less than that required for the conventional FMO method, it should be possible to perform binding affinity predictions within the actual time frame used for drug discovery research (see Materials and Methods).
The entropic term using the number of single rotatable bonds for each ligand did not contribute to an increase in the ability to rank tankyrase 2–ligand binding affinities. This could possibly be due to the fact that the degree of freedom of the rotatable bonds is lost when the ligand binds to the binding pocket. Because class B ligands, in particular, have more rotatable bonds compared with class A ligands and the degrees of freedom at each of the rotatable bonds are not all lost upon ligand binding, the conformational entropic effect of each ligand will be overestimated. Structural analysis of protein–ligand interactions suggests that single rotatable bonds in the core and linker would be relatively strongly restricted by forming hydrogen bonds with Gly1032 and Ser1068, but those of the ring region would be not restricted (see Figure 2). In such a case, the number of restricted single rotatable bonds (Nrot#) for all ligands except compound C01 becomes a constant value of two (as seen in Figures S1 and S2 in the Supporting Information). When Nrot# was used, our scoring function (α = 1) shows R = 0.855 and PI = 0.874, which are almost the same as the result of the scoring function without the entropic term (α = 0) (Figures 6 and S6 in the Supporting Information). Therefore, we think there is some room for improvement of the entropic term because the entropic term used in this study is so simple for the tankyrase 2–ligand system. Other studies have reported a good estimate of the entropic effect using the degrees of freedom lost by both the protein and ligand on binding.20,40 Improvement of the entropic term will therefore be a focus in the future.
Conclusions
We have shown the application of QM calculations in the field of drug discovery by reducing the severe problem of their computational costs. In this paper, we evaluated the ability to rank the binding affinity for tankyrase 2 ligands by combining both QM and MM methodologies. The binding affinity prediction computed by using the binding energies from the cost-effective MFMO method and the MM-based solvation energies provided a high ability to rank the binding affinities of tankyrase 2 inhibitor analogues, and the performance surpassed those of several MM-based methods. From this study, we emphasize the importance of QM-based structural refinement and the generation of initial multiple conformations for a flexible ligand to demonstrate the high ability of the binding affinity prediction using the MFMO method. This is the first report describing a practical evaluation of the MFMO method for structure-based drug design. Although the method can further be improved by the introduction of conformational sampling and a more appropriate entropic term, we think that our binding affinity prediction using the MFMO method and the MM-PB/SA method is a promising tool for predicting the rank-ordering of protein–ligand binding affinities in drug-discovery studies.
Materials and Methods
Overview of Our Computational Approach
Our computational approach to predict the rank-ordering of protein–ligand binding affinities was carried out in four stages. First, we built initial structures of the tankyrase 2–ligand complex using molecular modeling techniques. Second, the solvated systems of the tankyrase 2–ligand complexes were obtained by energy minimization using the MM force field. Third, after removing the solvent molecules, the ONIOM method was employed for geometry optimization of the ligand and only selected parts of the binding site for each MM energy-minimized structure. Last, protein–ligand binding affinities were predicted using our scoring function that is comprised of the binding energies obtained using the MFMO method, the solvation energies obtained using the MM-PB/SA method, and the conformational entropic term of the ligands only.
Tankyrase 2 Ligands Used in This Study
Twenty-three tankyrase 2 inhibitor structures and their inhibition activities (IC50) were obtained from the literature23 (see Figures S1 and S2 in the Supporting Information). The structures of these ligands are similar and have a common structural feature. The common structural feature is that each ligand consists of three parts, that is, a core, a linker, and a ring (Figure 2). Among these three parts, it is expected that the characteristics of the linker and the ring affect the conformational flexibility of each ligand. On this basis, we classified all ligands into two classes, A and B, based on the length of the linker and the number of single rotatable bonds in the ligand. For modeling the structure of the tankyrase 2–ligand complex, the specific conformation of a tankyrase 2–class A ligand complex was easily modeled based on available X-ray crystallographic information33,35 because the conformational flexibility was relatively low. However, the specific conformation of tankyrase 2–class B ligand complex was not modeled easily because of the flexibility near the linker and ring parts. Therefore, multiple binding conformations generated by modeling techniques were used as the initial conformations for tankyrase 2–class B ligand complexes (Figure S7 in the Supporting Information).
Modeling of Tankyrase 2–Ligand Complex Structures
The structure of the tankyrase 2–ligand (C01) complex was built based on the crystal structure of the ligand (C01) bound form of tankyrase 2 (PDB code: 3KR8,33 see Figure 1). For the complex structures containing ligands other than C01, the protein structure was built based on the crystal structure of the tankyrase 2–ligand (C01) complex, and the conformations of the other ligands were built by referring to the X-ray crystallographic crystal structures of the tankyrase1–ligand (C04) complex (PDB code: 4KRS(35)) because the PARP catalytic domains of tankyrase1 and tankyrase 2 are very similar in structure. For modeling of the initial structure of each tankyrase 2–class A ligand complex, only the linker and ring parts of the modeled ligand were energy-minimized. For modeling of the initial structure of each tankyrase 2–class B ligand complex, conformational samplings of only the linker and ring parts of the modeled ligand were performed using the LowModeMD method.38 The sampled multiple conformations of each class B ligand were used for the initial structure of each tankyrase 2–class B ligand complex (see Figures S2 and S7 in the Supporting Information). The addition of hydrogen atoms for the structures of the protein and inhibitors, energy minimization, and the ligand conformational search were performed using the molecular operating environment program (Chemical Computing Group Inc.).41
MM Energy Minimization
All MM energy minimizations were performed using AMBER12.42 The modeled structures of tankyrase 2–ligand complexes were solvated in a rectangular box containing TIP3P water molecules43 under periodic boundary conditions. The AMBER99SB force field44 was adopted for the receptor proteins. The parameters for the force field of the ligands were set using a general amber force field.45 Here, the partial charges for the ligands were calculated at the RHF/6-31G(d) level using the Gaussian 0946 and the restrained electrostatic potential method.47,48 In these computations, the particle mesh Ewald method49 with a cutoff distance of 8 Å was employed for electrostatic interactions, and the same cutoff distance was also applied for the van der Waals interactions. The ligand, water molecules, and protein residues that were approximately 10 Å of the active center were allowed to move, but other protein residues were fixed in all of the MM energy minimizations (see Figure 10).
Figure 10.
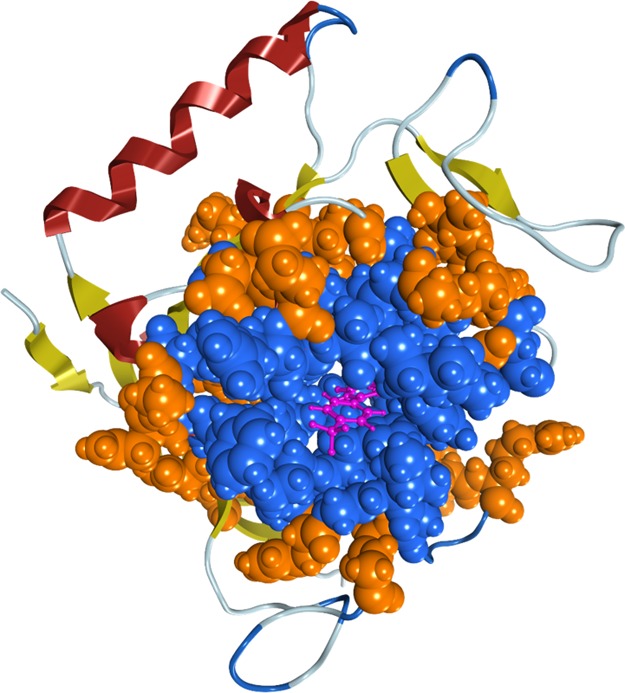
High-layer region used in the MFMO method. The high-layer region used in the MFMO method contains the ligand (purple ball and stick model) and the following amino acid residues (residue numbers: 1030–1036, 1039, 1044, 1047–1052, 1054, 1058–1065, 1068–1072, 1074–1076, and 1138–1140; blue space-filled representation). In addition, the ligand and the amino acid residues (residue numbers: 978–980, 1029–1039, 1044–1078, 1095–1101, 1125–1127, 1136–1141, and 1155), shown by the blue and orange space-filled representation, are allowed to move during the MM energy minimization.
Structure Refinement by ONIOM Calculations
The structures of tankyrase 2-inhibitor complexes determined by MM energy minimization were further refined by the ONIOM calculations to express nonbonding interactions, such as hydrogen bonds. In the present calculations, the ligand and only selected parts of the binding site, that is, the entire Gly1032 residue and the side chain of Ser1068, were included in the QM region. Gly1032 and Ser1068 correspond to the nearest neighbors to the ligand and form several hydrogen bonds with it (see Figure 1). Parts other than the QM region were defined as the MM region. In the ONIOM energy minimization, only atoms in the QM region were allowed to move during the energy minimization, and atoms in the MM region were frozen. The defined QM and MM regions were treated with the DFT/B3LYP functional50−52 using the 6-31G(d) basis set in the QM regions and the universal force field53 in the MM region, respectively. All ONIOM computations were performed using Gaussian 09.46
Protein–Ligand Binding Energy by MFMO Calculations
The protein–ligand binding energies were obtained by FMO calculations. In particular, to accelerate protein–ligand binding energy calculations, we used MFMO calculations, as reported in our previous study.16 The MFMO method introduces layers to which each of the fragments of the system is assigned. Each layer includes its own level of theory and basis set. First, in the monomer calculations, all fragments of the system are computed at the lowest layer 1 (commonly described as the lowest level of theory), and the Coulomb field of the entire system is determined at the lowest level of theory. The fragments belonging to the higher layers, such as 2, 3, and others, are then recomputed at higher levels of theory. Dimer calculations at the higher layers are performed with only the two fragments belonging to the specific layer. Thus, the MFMO method is designed to calculate the total energies at different layers with different levels of theory. In this study of tankyrase 2–ligand systems, the ligand and 35 amino acid residues were assigned as the high layer (see Figure 10), which corresponds to a cutoff distance from the ligand of around 6.0 Å. The MFMO calculations were treated with a level of theory of HF/STO-3G for the lowest layer and of MP2/6-31G(d) for the higher layer, and 2-body FMO (FMO2) with one amino acid residue per fragment, denoted as FMO2-HF/STO-3G:MP2/6-31G(s). As shown in our previous study,16 the binding energy between a protein and the ligand is evaluated from the difference between the gas-phase potential energy of the protein–ligand complex and the sum of the gas-phase potential energies of the protein and isolated ligand molecules calculated by the FMO or MFMO methods. All binding energy calculations for FMO and MFMO methods were performed using FMO program version 4.1,12 implemented in the GAMESS program package.54
The MFMO and conventional FMO calculations for tankyrase 2–ligand systems were carried out on our computer cluster with 4 nodes (16 Nehalem, 2.8 GHz cores each). The average actual time to compute the MFMO calculation was 2.5 h and that for the FMO calculation was 15 h.
Scoring Function Used for the Prediction of Protein–Ligand Binding Affinity
To predict the rank-ordering of ligands, the binding affinity, ΔGbind, was evaluated using the following scoring function. Our scoring function is based on the MM-PB/SA framework.3
| 1 |
| 2 |
| 3 |
| 4 |
| 5 |
In the above scoring function, each term is calculated from a single energy-minimized structure. Therefore, the effect of conformational sampling is not taken into account. ΔEbindgas is the gas-phase potential energy calculated from the MFMO calculation, ΔGbind is the solvation energy change occurring upon protein–ligand association, and TΔSgas is the entropy term. Here, ΔEbindgas indicates the binding energy between the protein and the ligand, which is the difference between the gas-phase potential energy of the complex and the sum of the gas-phase potential energies of the receptor and the ligand, as mentioned in our previous study.16 For the comparison with the binding energies of MFMO, ΔEbind for all ligands was also evaluated from the conventional FMO calculations and the MM calculations. The solvation energies, Gsolv values, were calculated using the MM-PB/SA method with AMBER 12. The polar solvation term, Gsolv,polar, was estimated using the PB equation, with the atomic radii optimized by Tan and Luo with respect to the reaction field energies computed in the TIP3P explicit solvents55 and AMBER charges. The grid spacing used was 0.5 Å. The dielectric constants inside and outside the molecule were 1.0 and 80.0, respectively. For the nonpolar solvation term Gsolv,nonpolar, SASA represents the solvent-accessible surface area that was calculated using Molsurf program, which is based on analytical ideas primarily developed by Mike Connolly,56 and SURFTEN and SURFOFF were 0.00542 kcal/mol Å2 and 0.92 kcal/mol, respectively. The probe radius was 1.4 Å. For the comparison with the solvation energy from the MM-PB/SA method, the PCM solvation57 method, which is implemented in the GAMESS program package,54 combined with the conventional FMO calculations was also evaluated. In the PCM calculation, the polar term is the electrostatic solvation energy, Ees, and the nonpolar term is composed of three components: the creating energy of a cavity in the solvent, Ecav, the dispersion interactions between the solute and the solvent, Edisp, and the exchange repulsion, Erep. The entropic term, TΔSbindgas, was estimated using the number of single rotatable bonds for each ligand. This is based on the idea that the degree of freedom of rotatable bonds is lost in the binding pocket. Thus, the following equation was used to obtain the TΔSbind value
| 6 |
where Nrot is the number of single rotatable bonds for each ligand and α is the weighting factor. A value of α = 1 assigns a conformational penalty of 1 kcal/mol for each single rotatable bond for the ligand. A weighting factor of 1 has been used in the previous studies.20,22 By contrast, a value of α = 0 indicates that the entropic term is not taken into account. In this study, we compared two α values, namely 1 and 0, for the scoring function. The prediction of rank-ordering of tankyrase 2–ligand binding affinities was assessed on the basis of the correlation coefficient R and the PI for the calculated affinities and the experimental affinities. The PI, which was developed by Pearlman and Charifson,58 quantifies the compatibility of the calculated affinities with the rank-ordering of the experimental affinities. This PI ranged from −1 to +1, with +1 arising from perfect predictions, −1 arising from predictions that are always incorrect, and 0 arising from predictions that are completely random.
Comparison with Other MM-Based Methods
To compare the ability of rank-ordering of the binding affinities using our computational approach with those of the other MM-based methods, we also performed rescoring of the molecular docking and MM-PB/SA methods. Rescoring of the molecular docking was performed using the Genetic Optimisation of Ligand Docking version 5.3.059 and Glide 6.960,61 for Schrödinger 2015. Four scoring functions namely GoldScore, ChemScore, ChemPLP, and Glide standard precision mode were used, and the default settings for these scoring functions were adopted. For the MM-PB/SA method, the binding energy was evaluated using AMBER12.42 The force field parameters were the same as those described in the above MM energy minimization section. For evaluation of the solvation energy, the solvation energy from the MM-PB/SA method was also used, as was the case with our scoring function.
Acknowledgments
The calculations were performed in part using the RIKEN Integrated Cluster of Clusters (RICC) and the HOKUSAI Great Wave system. This work was partly supported by the JSPS KAKENHI projects grant numbers, 22790122, 26860084, and 16KT0168.
Supporting Information Available
The Supporting Information is available free of charge on the ACS Publications website at DOI: 10.1021/acsomega.8b00175.
Information of class A and class B ligands and additional results on MFMO and conventional FMO methods (PDF)
Author Present Address
Laboratory for Computational Molecular Design, Center for Biosystems Dynamics Research (BDR), RIKEN, 6-2-4 Furuedai, Suita, Osaka 565-0874, Japan (for all authors).
The authors declare no competing financial interest.
Supplementary Material
References
- Kollman P. Free-Energy Calculations - Applications to Chemical and Biochemical Phenomena. Chem. Rev. 1993, 93, 2395–2417. 10.1021/cr00023a004. [DOI] [Google Scholar]
- Åqvist J.; Luzhkov V. B.; Brandsdal B. O. Ligand binding affinities from MD simulations. Acc. Chem. Res. 2002, 35, 358–365. 10.1021/ar010014p. [DOI] [PubMed] [Google Scholar]
- Kollman P. A.; Massova I.; Reyes C.; Kuhn B.; Huo S.; Chong L.; Lee M.; Lee T.; Duan Y.; Wang W.; Donini O.; Cieplak P.; Srinivasan J.; Case D. A.; Cheatham T. E. 3rd Calculating structures and free energies of complex molecules: combining molecular mechanics and continuum models. Acc. Chem. Res. 2000, 33, 889–897. 10.1021/ar000033j. [DOI] [PubMed] [Google Scholar]
- Raha K.; Peters M. B.; Wang B.; Yu N.; Wollacott A. M.; Westerhoff L. M.; Merz K. M. Jr. The role of quantum mechanics in structure-based drug design. Drug Discovery Today 2007, 12, 725–731. 10.1016/j.drudis.2007.07.006. [DOI] [PubMed] [Google Scholar]
- Antony J.; Grimme S.; Liakos D. G.; Neese F. Protein-ligand interaction energies with dispersion corrected density functional theory and high-level wave function based methods. J. Phys. Chem. A 2011, 115, 11210–11220. 10.1021/jp203963f. [DOI] [PubMed] [Google Scholar]
- Gräter F.; Schwarzl S. M.; Dejaegere A.; Fischer S.; Smith J. C. Protein/ligand binding free energies calculated with quantum mechanics/molecular mechanics. J. Phys. Chem. B 2005, 109, 10474–10483. 10.1021/jp044185y. [DOI] [PubMed] [Google Scholar]
- Hayik S. A.; Dunbrack R. Jr.; Merz K. M. Jr. A Mixed QM/MM Scoring Function to Predict Protein-Ligand Binding Affinity. J. Chem. Theory Comput. 2010, 6, 3079–3091. 10.1021/ct100315g. [DOI] [PMC free article] [PubMed] [Google Scholar]
- Warshel A.; Levitt M. Theoretical Studies of Enzymic Reactions - Dielectric, Electrostatic and Steric Stabilization of Carbonium-Ion in Reaction of Lysozyme. J. Mol. Biol. 1976, 103, 227–249. 10.1016/0022-2836(76)90311-9. [DOI] [PubMed] [Google Scholar]
- Dapprich S.; Komáromi I.; Byun K. S.; Morokuma K.; Frisch M. J. A new ONIOM implementation in Gaussian98. Part I. The calculation of energies, gradients, vibrational frequencies and electric field derivatives. J. Mol. Struct.: THEOCHEM 1999, 461, 1–21. 10.1016/s0166-1280(98)00475-8. [DOI] [Google Scholar]
- Fedorov D. G.; Kitaura K. Second order Moller-Plesset perturbation theory based upon the fragment molecular orbital method. J. Chem. Phys. 2004, 121, 2483–2490. 10.1063/1.1769362. [DOI] [PubMed] [Google Scholar]
- Fedorov D. G.; Kitaura K. On the accuracy of the 3-body fragment molecular orbital method (FMO) applied to density functional theory. Chem. Phys. Lett. 2004, 389, 129–134. 10.1016/j.cplett.2004.03.072. [DOI] [Google Scholar]
- Fedorov D. G.; Kitaura K. The importance of three-body terms in the fragment molecular orbital method. J. Chem. Phys. 2004, 120, 6832–6840. 10.1063/1.1687334. [DOI] [PubMed] [Google Scholar]
- Kitaura K.; Ikeo E.; Asada T.; Nakano T.; Uebayasi M. Fragment molecular orbital method: an approximate computational method for large molecules. Chem. Phys. Lett. 1999, 313, 701–706. 10.1016/s0009-2614(99)00874-x. [DOI] [Google Scholar]
- Nakano T.; Kaminuma T.; Sato T.; Akiyama Y.; Uebayasi M.; Kitaura K. Fragment molecular orbital method: application to polypeptides. Chem. Phys. Lett. 2000, 318, 614–618. 10.1016/s0009-2614(00)00070-1. [DOI] [Google Scholar]
- Fedorov D. G.; Ishida T.; Kitaura K. Multilayer formulation of the fragment molecular orbital method (FMO). J. Phys. Chem. A 2005, 109, 2638–2646. 10.1021/jp047186z. [DOI] [PubMed] [Google Scholar]
- Otsuka T.; Okimoto N.; Taiji M. Assessment and acceleration of binding energy calculations for protein-ligand complexes by the fragment molecular orbital method. J. Comput. Chem. 2015, 36, 2209–2218. 10.1002/jcc.24055. [DOI] [PubMed] [Google Scholar]
- Okimoto N.; Futatsugi N.; Fuji H.; Suenaga A.; Morimoto G.; Yanai R.; Ohno Y.; Narumi T.; Taiji M. High-performance drug discovery: computational screening by combining docking and molecular dynamics simulations. PLoS Comput. Biol. 2009, 5, e1000528 10.1371/journal.pcbi.1000528. [DOI] [PMC free article] [PubMed] [Google Scholar]
- Kuhn B.; Gerber P.; Schulz-Gasch T.; Stahl M. Validation and use of the MM-PBSA approach for drug discovery. J. Med. Chem. 2005, 48, 4040–4048. 10.1021/jm049081q. [DOI] [PubMed] [Google Scholar]
- Rastelli G.; Del Rio A.; Degliesposti G.; Sgobba M. Fast and accurate predictions of binding free energies using MM-PBSA and MM-GBSA. J. Comput. Chem. 2010, 31, 797–810. 10.1002/jcc.21372. [DOI] [PubMed] [Google Scholar]
- Raha K.; Merz K. M. Jr. A quantum mechanics-based scoring function: study of zinc ion-mediated ligand binding. J. Am. Chem. Soc. 2004, 126, 1020–1021. 10.1021/ja038496i. [DOI] [PubMed] [Google Scholar]
- Mazanetz M. P.; Ichihara O.; Law R. J.; Whittaker M. Prediction of cyclin-dependent kinase 2 inhibitor potency using the fragment molecular orbital method. J. Cheminf. 2011, 3, 2. 10.1186/1758-2946-3-2. [DOI] [PMC free article] [PubMed] [Google Scholar]
- Raha K.; Merz K. M. Jr. Large-scale validation of a quantum mechanics based scoring function: predicting the binding affinity and the binding mode of a diverse set of protein-ligand complexes. J. Med. Chem. 2005, 48, 4558–4575. 10.1021/jm048973n. [DOI] [PubMed] [Google Scholar]
- Shultz M. D.; Kirby C. A.; Stams T.; Chin D. N.; Blank J.; Charlat O.; Cheng H.; Cheung A.; Cong F.; Feng Y.; Fortin P. D.; Hood T.; Tyagi V.; Xu M.; Zhang B.; Shao W. [1,2,4]triazol-3-ylsulfanylmethyl)-3-phenyl-[1,2,4]oxadiazoles: antagonists of the Wnt pathway that inhibit tankyrases 1 and 2 via novel adenosine pocket binding. J. Med. Chem. 2012, 55, 1127–1136. 10.1021/jm2011222. [DOI] [PubMed] [Google Scholar]
- Hsiao S. J.; Smith S. Tankyrase function at telomeres, spindle poles, and beyond. Biochimie 2008, 90, 83–92. 10.1016/j.biochi.2007.07.012. [DOI] [PubMed] [Google Scholar]
- Chang W.; Dynek J. N.; Smith S. NuMA is a major acceptor of poly(ADP-ribosyl)ation by tankyrase 1 in mitosis. Biochem. J. 2005, 391, 177–184. 10.1042/bj20050885. [DOI] [PMC free article] [PubMed] [Google Scholar]
- Chi N.-W.; Lodish H. F. Tankyrase is a golgi-associated mitogen-activated protein kinase substrate that interacts with IRAP in GLUT4 vesicles. J. Biol. Chem. 2000, 275, 38437–38444. 10.1074/jbc.m007635200. [DOI] [PubMed] [Google Scholar]
- Cho-Park P. F.; Steller H. Proteasome regulation by ADP-ribosylation. Cell 2013, 153, 614–627. 10.1016/j.cell.2013.03.040. [DOI] [PMC free article] [PubMed] [Google Scholar]
- Cook B. D.; Dynek J. N.; Chang W.; Shostak G.; Smith S. Role for the related poly(ADP-Ribose) polymerases tankyrase 1 and 2 at human telomeres. Mol. Cell. Biol. 2002, 22, 332–342. 10.1128/mcb.22.1.332-342.2002. [DOI] [PMC free article] [PubMed] [Google Scholar]
- Kaminker P. G.; Kim S.-H.; Taylor R. D.; Zebarjadian Y.; Funk W. D.; Morin G. B.; Yaswen P.; Campisi J. TANK2, a new TRF1-associated poly(ADP-ribose) polymerase, causes rapid induction of cell death upon overexpression. J. Biol. Chem. 2001, 276, 35891–35899. 10.1074/jbc.m105968200. [DOI] [PubMed] [Google Scholar]
- Leung A. K. L.; Vyas S.; Rood J. E.; Bhutkar A.; Sharp P. A.; Chang P. Poly(ADP-ribose) regulates stress responses and microRNA activity in the cytoplasm. Mol. Cell 2011, 42, 489–499. 10.1016/j.molcel.2011.04.015. [DOI] [PMC free article] [PubMed] [Google Scholar]
- Smith S.; de Lange T. Tankyrase promotes telomere elongation in human cells. Curr. Biol. 2000, 10, 1299–1302. 10.1016/s0960-9822(00)00752-1. [DOI] [PubMed] [Google Scholar]
- Huang S.-M. A.; Mishina Y. M.; Liu S.; Cheung A.; Stegmeier F.; Michaud G. A.; Charlat O.; Wiellette E.; Zhang Y.; Wiessner S.; Hild M.; Shi X.; Wilson C. J.; Mickanin C.; Myer V.; Fazal A.; Tomlinson R.; Serluca F.; Shao W.; Cheng H.; Shultz M.; Rau C.; Schirle M.; Schlegl J.; Ghidelli S.; Fawell S.; Lu C.; Curtis D.; Kirschner M. W.; Lengauer C.; Finan P. M.; Tallarico J. A.; Bouwmeester T.; Porter J. A.; Bauer A.; Cong F. Tankyrase inhibition stabilizes axin and antagonizes Wnt signalling. Nature 2009, 461, 614–620. 10.1038/nature08356. [DOI] [PubMed] [Google Scholar]
- Karlberg T.; Markova N.; Johansson I.; Hammarström M.; Schütz P.; Weigelt J.; Schüler H. Structural basis for the interaction between tankyrase-2 and a potent Wnt-signaling inhibitor. J. Med. Chem. 2010, 53, 5352–5355. 10.1021/jm100249w. [DOI] [PubMed] [Google Scholar]
- Shultz M. D.; Cheung A. K.; Kirby C. A.; Firestone B.; Fan J.; Chen C. H.-T.; Chen Z.; Chin D. N.; Dipietro L.; Fazal A.; Feng Y.; Fortin P. D.; Gould T.; Lagu B.; Lei H.; Lenoir F.; Majumdar D.; Ochala E.; Palermo M. G.; Pham L.; Pu M.; Smith T.; Stams T.; Tomlinson R. C.; Toure B. B.; Visser M.; Wang R. M.; Waters N. J.; Shao W. Identification of NVP-TNKS656: the use of structure-efficiency relationships to generate a highly potent, selective, and orally active tankyrase inhibitor. J. Med. Chem. 2013, 56, 6495–6511. 10.1021/jm400807n. [DOI] [PubMed] [Google Scholar]
- Shultz M. D.; Majumdar D.; Chin D. N.; Fortin P. D.; Feng Y.; Gould T.; Kirby C. A.; Stams T.; Waters N. J.; Shao W. Structure-efficiency relationship of [1,2,4]triazol-3-ylamines as novel nicotinamide isosteres that inhibit tankyrases. J. Med. Chem. 2013, 56, 7049–7059. 10.1021/jm400826j. [DOI] [PubMed] [Google Scholar]
- Haikarainen T.; Narwal M.; Joensuu P.; Lehtiö L. Evaluation and Structural Basis for the Inhibition of Tankyrases by PARP Inhibitors. ACS Med. Chem. Lett. 2014, 5, 18–22. 10.1021/ml400292s. [DOI] [PMC free article] [PubMed] [Google Scholar]
- Söderhjelm P.; Kongsted J.; Ryde U. Ligand Affinities Estimated by Quantum Chemical Calculations. J. Chem. Theory Comput. 2010, 6, 1726–1737. 10.1021/ct9006986. [DOI] [PubMed] [Google Scholar]
- Kolossváry I.; Guida W. C. Low mode search. An efficient, automated computational method for conformational analysis: Application to cyclic and acyclic alkanes and cyclic peptides. J. Am. Chem. Soc. 1996, 118, 5011–5019. 10.1021/ja952478m. [DOI] [Google Scholar]
- Liu J.; Wang X.; Zhang J. Z. H.; He X. Calculation of protein-ligand binding affinities based on a fragment quantum mechanical method. RSC Adv. 2015, 5, 107020–107030. 10.1039/c5ra20185c. [DOI] [Google Scholar]
- Murray C. W.; Verdonk M. L. The consequences of translational and rotational entropy lost by small molecules on binding to proteins. J. Comput.-Aided Mol. Des. 2002, 16, 741–753. 10.1023/a:1022446720849. [DOI] [PubMed] [Google Scholar]
- MOE, 2016.08; Chemical Computing Group Inc., 1010 Sherbrooke St. West, Suite #910, Montreal, QC, Canada, H3A 2R7, 2016.
- Case D. A.; Darden T. A.; Cheatham T. E. r.; Simmerling C. L.; Wang J.; Duke R. E.; Luo R.; Walker R. C.; Zhang W.; Merz K. M.; Roberts B.; Hayik S.; Roitberg A.; Seabra G.; Swail J.; Götz A. W.; Kolossvary I.; Wong K. F.; Paesani F.; Vanicek J.; Wolf R. M.; Liu J.; Wu X.; Brozell S. R.; Steinbrecher T.; Gohlke H.; Cai Q.; Ye X.; Wang J.; Hsieh M.-J.; Cui G.; Roe D. R.; Mathews D. H.; Seetin M. G.; Salomon-Ferrer R.; Sugui C.; Babin V.; Luchko T.; Gusarov S.; Kovalenko A.; Kollman P. A.. AMBER 12; University of California: San Francisco, 2012.
- Jorgensen W. L.; Chandrasekhar J.; Madura J. D.; Impey R. W.; Klein M. L. Comparison of simple potential functions for simulating liquid water.. J. Chem. Phys. 1983, 79, 926–935. 10.1063/1.445869. [DOI] [Google Scholar]
- Hornak V.; Abel R.; Okur A.; Strockbine B.; Roitberg A.; Simmerling C. Comparison of multiple Amber force fields and development of improved protein backbone parameters. Proteins 2006, 65, 712–725. 10.1002/prot.21123. [DOI] [PMC free article] [PubMed] [Google Scholar]
- Wang J.; Wolf R. M.; Caldwell J. W.; Kollman P. A.; Case D. A. Development and testing of a general amber force field. J. Comput. Chem. 2004, 25, 1157–1174. 10.1002/jcc.20035. [DOI] [PubMed] [Google Scholar]
- Frisch M. J.; Trucks G. W.; Schlegel H. B.; Scuseria G. E.; Robb M. A.; Cheeseman J. R.; Scalmani G.; Barone V.; Mennucci B.; Petersson G. A.; Nakatsuji H.; Caricato M.; Li X.; Hratchian H. P.; Izmaylov A. F.; Bloino J.; Zheng G.; Sonnenberg J. L.; Hada M.; Ehara M.; Toyota K.; Fukuda R.; Hasegawa J.; Ishida M.; Nakajima T.; Honda Y.; Kitao O.; Nakai H.; Vreven T.; Montgomery J. A. Jr.; Peralta P. E.; Ogliaro F.; Bearpark M.; Heyd J. J.; Brothers E.; Kudin K. N.; Staroverov V. N.; Kobayashi R.; Normand J.; Raghavachari K.; Rendell A.; Burant J. C.; Iyengar S. S.; Tomasi J.; Cossi M.; Rega N.; Millam N. J.; Klene M.; Knox J. E.; Cross J. B.; Bakken V.; Adamo C.; Jaramillo J.; Gomperts R.; Stratmann R. E.; Yazyev O.; Austin A. J.; Cammi R.; Pomelli C.; Ochterski J. W.; Martin R. L.; Morokuma K.; Zakrzewski V. G.; Voth G. A.; Salvador P.; Dannenberg J. J.; Dapprich S.; Daniels A. D.; Farkas Ö.; Ortiz J. V.; Cioslowski J.; Fox D. J.. Gaussian 09, revision A.08; Gaussian, Inc.: Wallingford, CT, 2009. [Google Scholar]
- Bayly C. I.; Cieplak P.; Cornell W. D.; Kollman P. A. A Well-Behaved Electrostatic Potential Based Method Using Charge Restraints for Deriving Atomic Charges - the Resp Model. J. Phys. Chem. 1993, 97, 10269–10280. 10.1021/j100142a004. [DOI] [Google Scholar]
- Cornell W. D.; Cieplak P.; Bayly C. I.; Kollman P. A. Application of Resp Charges to Calculate Conformational Energies, Hydrogen-Bond Energies, and Free-Energies of Solvation. J. Am. Chem. Soc. 1993, 115, 9620–9631. 10.1021/ja00074a030. [DOI] [Google Scholar]
- Darden T.; York D.; Pedersen L. Particle Mesh Ewald - an N.Log(N) Method for Ewald Sums in Large Systems. J. Chem. Phys. 1993, 98, 10089–10092. 10.1063/1.464397. [DOI] [Google Scholar]
- Vosko S. H.; Wilk L. Influence of an Improved Local-Spin-Density Correlation-Energy Functional on the Cohesive Energy of Alkali-Metals. Phys. Rev. B: Condens. Matter Mater. Phys. 1980, 22, 3812–3815. 10.1103/physrevb.22.3812. [DOI] [Google Scholar]
- Becke A. D. Density-Functional Thermochemistry .3. The Role of Exact Exchange. J. Chem. Phys. 1993, 98, 5648–5652. 10.1063/1.464913. [DOI] [Google Scholar]
- Stephens P. J.; Devlin F. J.; Chabalowski C. F.; Frisch M. J. Ab-Initio Calculation of Vibrational Absorption and Circular-Dichroism Spectra Using Density-Functional Force-Fields. J. Phys. Chem. 1994, 98, 11623–11627. 10.1021/j100096a001. [DOI] [Google Scholar]
- Rappe A. K.; Casewit C. J.; Colwell K. S.; Goddard W. A.; Skiff W. M. Uff, a Full Periodic-Table Force-Field for Molecular Mechanics and Molecular-Dynamics Simulations. J. Am. Chem. Soc. 1992, 114, 10024–10035. 10.1021/ja00051a040. [DOI] [Google Scholar]
- Schmidt M. W.; Baldridge K. K.; Boatz J. A.; Elbert S. T.; Gordon M. S.; Jensen J. H.; Koseki S.; Matsunaga N.; Nguyen K. A.; Su S. J.; Windus T. L.; Dupuis M.; Montgomery J. A. General Atomic and Molecular Electronic-Structure System. J. Comput. Chem. 1993, 14, 1347–1363. 10.1002/jcc.540141112. [DOI] [Google Scholar]
- Tan C.; Yang L.; Luo R. How well does Poisson-Boltzmann implicit solvent agree with explicit solvent? A quantitative analysis. J. Phys. Chem. B 2006, 110, 18680–18687. 10.1021/jp063479b. [DOI] [PubMed] [Google Scholar]
- Connolly M. L. Analytical Molecular-Surface Calculation. J. Appl. Crystallogr. 1983, 16, 548–558. 10.1107/s0021889883010985. [DOI] [Google Scholar]
- Fedorov D. G.; Kitaura K.; Li H.; Jensen J. H.; Gordon M. S. The polarizable continuum model (PCM) interfaced with the fragment molecular orbital method (FMO). J. Comput. Chem. 2006, 27, 976–985. 10.1002/jcc.20406. [DOI] [PubMed] [Google Scholar]
- Pearlman D. A.; Charifson P. S. Are free energy calculations useful in practice? A comparison with rapid scoring functions for the p38 MAP kinase protein system. J. Med. Chem. 2001, 44, 3417–3423. 10.1021/jm0100279. [DOI] [PubMed] [Google Scholar]
- Verdonk M. L.; Cole J. C.; Hartshorn M. J.; Murray C. W.; Taylor R. D. Improved protein-ligand docking using GOLD. Proteins 2003, 52, 609–623. 10.1002/prot.10465. [DOI] [PubMed] [Google Scholar]
- Ferrara P.; Curioni A.; Vangrevelinghe E.; Meyer T.; Mordasini T.; Andreoni W.; Acklin P.; Jacoby E. New scoring functions for virtual screening from molecular dynamics simulations with a quantum-refined force-field (QRFF-MD). Application to cyclin-dependent kinase 2. J. Chem. Inf. Model. 2006, 46, 254–263. 10.1021/ci050289+. [DOI] [PubMed] [Google Scholar]
- Halgren T. A.; Murphy R. B.; Friesner R. A.; Beard H. S.; Frye L. L.; Pollard W. T.; Banks J. L. Glide: a new approach for rapid, accurate docking and scoring. 2. Enrichment factors in database screening. J. Med. Chem. 2004, 47, 1750–1759. 10.1021/jm030644s. [DOI] [PubMed] [Google Scholar]
Associated Data
This section collects any data citations, data availability statements, or supplementary materials included in this article.


