Abstract
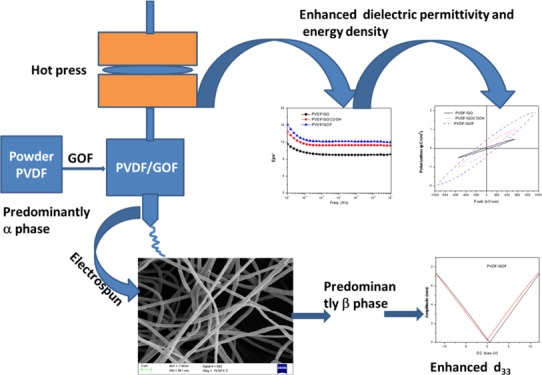
Herein, graphene oxide (GO) was suitably functionalized to obtain carboxylated and fluorinated GO (GOCOOH and GOF) derivatives, respectively, via the Hunsdiecker reaction. Electrospun mats of poly(vinylidene fluoride) (PVDF)/GO, PVDF/GOCOOH, and PVDF/GOF fibers were then prepared by electrospinning from well-dispersed GO derivatives. The piezoelectric coefficient (d33), as measured using piezoelectric force measurement (PFM), enhanced by more than 2 folds with respect to the control PVDF spun mat. The piezoelectric coefficient though enhanced upon the addition of GO and GOCOOH, however, enhanced significantly in the case of GOF. For instance, a drastic increase in piezoelectric response from 30 pm V–1(electrospun neat PVDF) to 63 pm V–1 (for electrospun PVDF/GOF) was observed as revealed from PFM results. The phase transformation in these fibers was systematically investigated by various techniques such as Fourier transform infrared spectroscopy (FTIR), wide angle X-ray diffraction (XRD), Raman spectroscopy, and PFM. FTIR and XRD results revealed that the electrospun fiber mats showed predominantly β-PVDF. Interestingly, the highest β content was obtained in the presence of GOF. The drastic enhancement in β phase is due to the presence of highly electronegative fluorine. The addition of GOCOOH and GOF in PVDF not only increases the polar β phase but also changes the piezoelectric response significantly. More interestingly, PVDF/GOF films exhibited higher energy density and dielectric permittivity when compared with the control PVDF samples. These findings will help guide the researchers working in this field from both theoretical understanding and practical view point for energy storing device and charge storage electronics.
Introduction
The ever increasing interest in electronic devices with high piezoelectric coefficient, which includes polymers, ceramics, and polymer ceramic composites, has become the focus of many research areas. These piezoelectric materials are used in many fields from sensors, capacitors, actuators, and energy storing devices. So far, polymers such as nylon-11,1 polylactic acid,2 poly(lactic-co-glycolic acid),3 and poly(vinylidene fluoride) (PVDF)4 have shown piezo- and pyroelectric properties. As compared to ceramics, polymers have advantages such as flexibility, biocompatibility, and toughness.5 Among the various piezoelectric polymers, PVDF is a semicrystalline polymer, which crystallizes in four crystalline phases namely; α, β, γ, and δ.6,7 The α phase, which is nonpolar with monoclinic TGTG conformation, is thermodynamically stable, is obtained by cooling from the melt, and does not show piezoelectric properties.8,9 The β phase, on the other hand, which is polar with all trans (TTT) conformation is thermodynamically unstable and is difficult to obtain.10 The β phase also has high dipole moment as compared to the other phases because of the conformation of hydrogen and fluorine on the opposite side of the polymer chain (nonzero dipole moment).11 Piezoelectric and pyroelectric materials with high piezoelectric coefficients are required for energy storage devices. Because the piezoelectric and pyroelectric properties of PVDF depend strongly on the structural orientation of β crystal, recent publications deal mostly with the investigation of β phase.
Various strategies have been developed to induce β phase in PVDF. The β phase in PVDF can be obtained by various strategies such as shear, uniaxial stretching,12,13 rolling,14 and polling under high electric field.15,16 It can also be facilitated by blending with an amorphous polymer such as poly(methyl methacrylate) at low concentration (<20%) under shear.17 For example, from our previous study, maximum amount of β phase was obtained by shearing PVDF at high temperature (220 °C) and isothermally crystallized at 155 °C. Here, the gap between the temperature at which the sample is sheared and the crystallization temperature played an important role in the transformation of α to β.18 A similar study on PVDF demonstrated that maximum β content of 82% and higher piezoelectric coefficient (d33 = 21 pC/N) was achieved by stretching PVDF films.19 Another study showed that the relation of β phase content and dielectric coefficient through uniaxial stretching and found that the samples with higher β phase content showed the maximum piezoelectric coefficient (d33 = 34 pC/N) because of higher oriented dipoles in β.20 Mohammadi et al. also reported a high piezoelectric coefficient of d33 = 33 pC/N for samples with a higher amount of β phase during drawing.21 At a high strain rate, the relaxation is low, leading to higher transformation of α to β and higher orientation of crystals. In general, PVDF processed by various methods lead to enhanced amount of β phase, but the piezoelectric coefficient was very less. Although blending gives a maximum amount of β phase, the dielectric coefficient was low as compared to ceramics. For example, Li et al. enhanced the dielectric coefficient (from 3.6 to 9 pC/N) by blending PVDF with polyamide (PA11) with the addition of styrene and maleic anhydride (SMA). The addition of SMA enhanced the polarization of PA11/PVDF resulting in improved dielectric coefficient.22
To increase the piezoelectric coefficient, many researchers have been focusing on the incorporation of nanoparticles in PVDF such as carbon nanotubes (CNTs) and graphene oxides (GOs). The addition of CNTs in PVDF increases the β phase because of rapid crystallization offered by nucleating agents such as multi-walled CNTs (MWCNTs).23 At 0.2 wt % MWCNT, maximum amount of β phase was obtained and, in addition, enhanced the piezoelectric coefficient for drawn and poled samples. However, agglomeration of nanotubes during processing and poor interfacial adhesion with the matrix limit their application.24 Recently, electrospinning has been used to fabricate PVDF/GO nanofibers. The fibers displayed a higher piezoelectric coefficient and an enhanced β phase at 1.0 wt % GO.25 Jiang et al. also demonstrated that the incorporation of GO in PVDF exhibits enhanced dielectric properties as compared to the neat sample.26 Another study showed enhanced ferroelectric and dielectric properties by incorporating reduced GO in PVDF. This was attributed to polarization and specific interaction of PVDF with oxygen functional groups in RGO.27 Rahman and Chung observed enhanced normalized strain and remnant polarization by adding low concentrations of RGO (0.3 wt %) in PVDF.28
Chlorine-doped carbon materials showed excellent dielectric constant and electrical conductivity. For example, chlorine doped in reduced GO/polymer enhanced dielectric constant compared to control samples. The high dipole moment and high polarization present in the C–Cl bond is responsible for the increase in dielectric property.29 Similarly, thionyl chloride (SOCl2)-treated single-wall CNTs showed both enhanced mechanical and electrical conductivity because of charge transfer complex formed by chlorination.30 Furthermore, increase in dielectric properties was reported by doping chlorine in GO/poly(vinylidene fluoride) nanocomposites.31 Although many GO-based PVDF composites for various property enhancements have been reported in the literature, the effect of GO doped with fluorine (GOF) did not receive much attention. The effects of addition of GOF on the phase transformation, piezoelectric response, energy density, and dielectric permittivity in PVDF require systematic analysis to understand the exciting properties offered by fluoro-doped GO derivatives.
In this work, GO was doped with fluorine (GOF) and was used as a nanoadditive, because of their versatile properties such as magnetic resonance imaging32 and good dielectric permittivity, efficient microwave absorber, and cathode for batteries.33 Herein, we report significant enhancement in piezoelectric coefficient, energy density, and dielectric permittivity in electrospun PVDF fibers with fluoro-doped graphene derivatives. The electrospinning process has been used to fabricate PVDF/GOF nanofibers. The conformational transformation of PVDF/GOF nanofibers was analyzed by Fourier transform infrared spectroscopy (FTIR) and X-ray diffraction (XRD). The piezoelectric coefficient for the electrospun fibers was investigated by piezoelectric force measurement (PFM).
Experimental Section
Materials
PVDF (Kynar-761, with Mw of 440 000 g/mol) was obtained from Arkema Inc. GO was procured from BT COM. Silver nitrate (AgNO3) and Selectfluor were procured from Sigma-Aldrich. All solvents [dimethylacetamide (DMAC) and acetone] used were of analytical grade and procured from S.D. Fine Chemicals (India). All the reagents were used as received without further purification.
Synthesis of GOCOOH and GOF
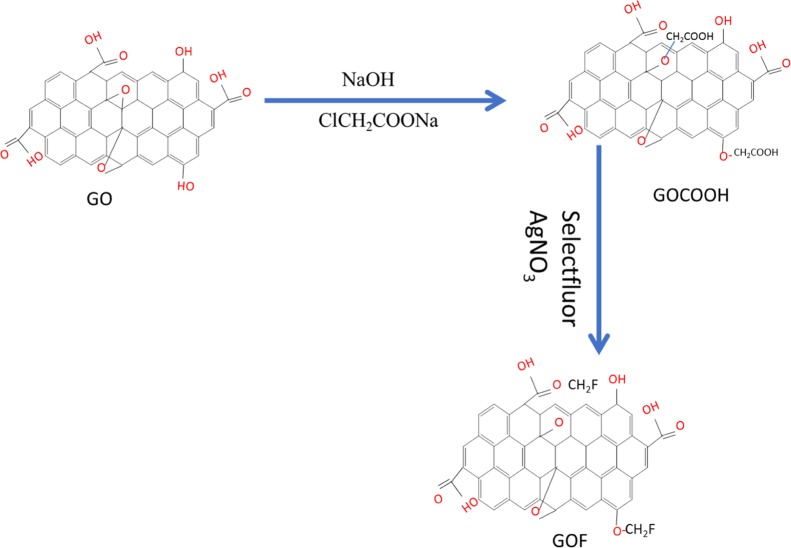
First, GOCOOH was synthesized from GO as previously reported.34 A schematic illustrating the synthesis of carboxylated and fluorine-doped graphene oxide is presented in Scheme 1. GO powder (350 mg) was dispersed in deionized water (350 mg) by sonication for 1 h, and sodium hydroxide (NaOH, 14 g) and sodium chloroacetate (ClCH2COONa, 19.6 g) were added and stirred for 1 h at room temperature. To adjust the pH dilute HCl was added. The GOCOOH colloid was centrifuged with ethanol and water. The GOCOOH sample was obtained after being freeze-dried for 24 h.
Scheme 1. Schematic Presentation of the Synthesis of Fluorine-Doped Graphene Oxide.
To synthesize GOF, we adopted a procedure that was reported previously.35 GOCOOH (300 mg) was dissolved in distilled water. Then, 1 g of selectfluor and 0.1 g silver nitrate were added. The reaction mixture was stirred for 10 h at 90 °C under an atmosphere of nitrogen. Then, the mixture was centrifuged with ethyl acetate (3 × 15 mL) and water for 15 min at 8000 rpm to remove organic impurities. After being freeze-dried for 24 h, GOF was obtained.
PVDF/GOF nanofiberes PVDF/GOF nanofiberes were obtained by dissolving in a mixture of solvents [DMAC and acetone (4:6 by v/v)]. First, PVDF powder was dissolved in these solvents under magnetic stirring for 2 h at 60 °C. GOF was sonicated and dispersed in these solvent. GOF (1 wt %) was used because it is possible to achieve maximum amount of piezoelectric β phase. Mixtures of PVDF/GOF were stirred using a magnetic stirrer for 2 h at 60 °C. For comparison, neat PVDF and PVDF/GO were similarly prepared. Electrospinning of PVDF/GOF solution was done with an injection rate of 0.5 mL/h and at a bias value of 25 kV. The distance from the needle tip to the collector was 12 cm. After spinning, the electrospun fibers were dried under vacuum at room temperature for 24 h.
For dielectric properties, different PVDF composites were prepared by using HAAKE extruder CTWS at 220 °C for 20 min with a screw speed of 60 rpm under the nitrogen atmosphere. The concentrations of the particles were similar to those of the electrospun fibers. Finally, melt mixed samples were subsequently compression-molded into thin films pressed for 5 min at 10 bar. The film thickness was about 120 μm.
Characterization of GO, GOCOOH, and GOF
Chemical structures of GO, GOCOOH, and GOF were analyzed by FTIR using an attenuated total reflectance by accumulating 16 scans in the frequency range of 4000–50 cm–1. XRD was carried out using Cu Kα radiation (40 kV), a scan rate of 0.04° s–1, and 10–60° range of 2θ. Raman spectra of the samples were performed with a LabRAM XploRA Raman spectrometer (HORIBA Jobin Yvon SAS).
Characterization of Electrospun Fibers
FTIR and XRD measurements were performed to obtain information about the conformational transformations of PVDF/GO, PVDF/GOCOOH, and PVDF/GOF fibers. The morphology of the fibers was evaluated using a ZEISS Ultra 55 field emission scanning electron microscope with an accelerating voltage of 5 kV. Electrospinning was done on the Pt/Ti coated silicon substrate. The piezoelectric coefficient (d33) was measured using a Bruker AFM in piezo-mode under the applied voltage −12 to 12 V. Dielectric measurements were performed using an Alpha-N Analyzer, Novocontrol (Germany), in a frequency range of 0.01 ≤ ω ≤ 107 Hz.
Results and Discussion
Synthesis and Characterization of GO Derivatives
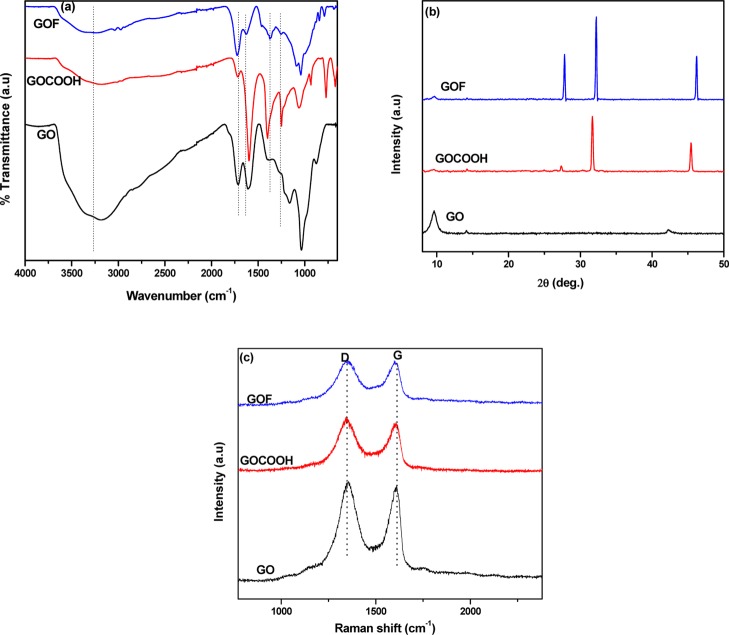
FTIR was carried on different graphene derivatives (GO, GOCOOH, and GOF). The results are presented in Figure 1a. GO indicated peaks at 3263 cm–1 (O–H group stretching vibrations), 1722 cm–1 (C=O stretching of the carboxylic functional groups), and 1035 cm–1(C–O group stretching vibrations).36 As explained in the Experimental Section, GO was activated by acetic acid to convert hydroxyl groups to carboxylic acid (COOH). Upon fluorination, GOF was obtained. As compared to GO and GOCOOH, the peak intensity at 1600 cm–1 assigned to the C=C bond decreased in GOF. This is attributed to the formation of C–F bond through the attack of carbon atom in C=C by fluorine. This can be further verified by the peak at 1090 cm–1 ascribed to the semi-ionic C–F bond.37 Therefore, this result confirms the successful fluorination of the GO.
Figure 1.
(a) FTIR spectra, (b) XRD, and (c) Raman spectra of GO, GOCOOH, and GOF Conformational transformation by FTIR and XRD electrospun fibers.
The structural differences between GO, GOCOOH, and GOF were further investigated by XRD. GOCOOH and GOF showed different characteristic peaks as compared to GO (Figure 1b). The characteristic peaks at 2θ = 31.7° and 44.6° for GOCOOH can be attributed to the interlayer spacing of 0.235 and 0.203 nm. GOF showed characteristic peaks at 2θ = 27.8°, 32.2°, and 46.3° ascribed to the interlayer spacing of 0.318, 0.276, and 0.195 nm. However, GOCOOH and GOF do not exhibit characteristic peak of GO. It is well-reported that the increase in average interlayer spacing in GOF is due to the atomic radius of F being larger than that of the oxygen atoms.
It is well-reported that the Raman spectra of pristine graphite show two peaks at 1580 cm–1 (G-band) and 1350 cm–1 (D-band).38−40 The peak at 1580 cm–1 corresponds to the E2g mode of sp2 hybridized graphitic carbon atom, and the D-band is associated with vibrations of disordered graphite carbon atoms with dangling bonds. Figure 1c illustrates the Raman spectra of GO, GOCOOH, and GOF. All the samples show two strong Raman peaks. Hence, the ratio between the intensities of G-band and D-band (ID/IG) provide valuable information on the number of defects.41,42 The values decrease from 1.09 for GO to 1.05 and 0.99 for GOCOOH and GOF, respectively. This is due to the defects introduced by carboxylic acid (COOH) and fluorine atom. An explanation for the decrease of ID/IG ratio is due to the double bond formed during the formation of GOCOOH and GOF. The decrease in the ID/IG ratio of GOF compared to that of GO and GOCOOH indicates the decrease number of aromatic rings, presumably because of the fluorination.36 Therefore, this result coincides with the FTIR and XRD, indicating the successful fluorination of GO to GOF.
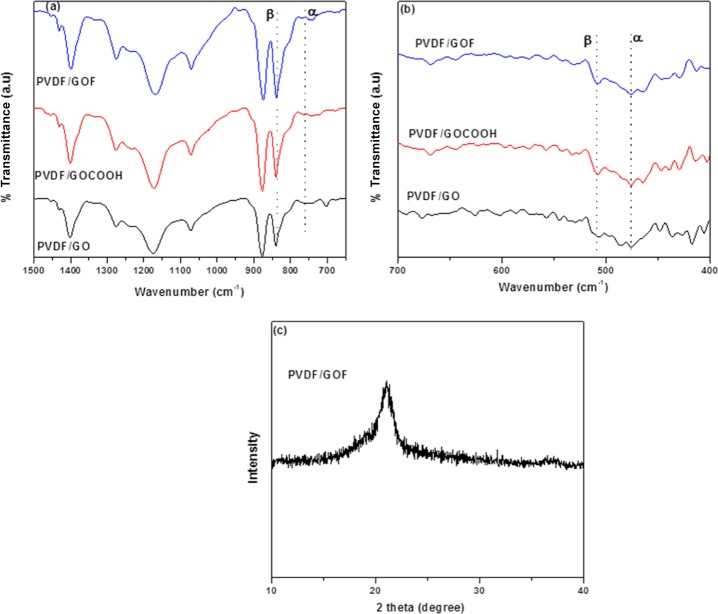
A recent study showed that the addition of GO and mechanical deformation induces β phase in PVDF. The interaction between the functional groups of GO and the −CF2 or −CH2 groups of PVDF are responsible for this phase transformation.43 For example, El Achaby et al. enhanced the β phase by incorporating GO in PVDF using the solvent casting method. This was attributed to the specific interaction between −C=O of GO and CF2 of PVDF.44 The incorporation of functionalized CNTs (MWCNTs) (functionalized with COOH, NH2, and OH) induces polar β phase in PVDF.45 Highest fraction of β phase was obtained with amino-functionalized MWCNTs. This was attributed to better dispersion and surface interaction, which led to the formation of electoactive β phase. It was also reported that polyvinylpyrrolidone-coated MWCNTs/PVDF nanocomposites promote polar β phase because of the nucleating agents of nanotubes.46 Here, GO was functionalized with COOH and fluorine, and GOCOOH and GOF were used as nanoadditives in the PVDF matrix. Conformational transformations of electrospun fibers were analyzed by FTIR. The FTIR spectra of the electrospun PVDF/GO, PVDF/GOCOOH, and PVDF/GOF are presented in Figure 2a,b. The characteristic vibration bands of the α phase appear at 480, 763 cm–1 (CF2 bending and skeletal bending), 795 cm–1 (CH2 rocking), and 975 cm–1 (CH2 twisting), while those of β phase appear at 510 cm–1 (CF2 bending) and 840 cm–1 (CH2 rocking).47,48 The α phase of PVDF has a unique IR absorption band at 763 cm–1. The presence of exclusively β phase can be observed through the presence of bands at 510 and 840 cm–1. Thus, absorption bands at 763 and 840 cm–1 have been used to evaluate the changes in the fraction of α and β phases in all the samples. From our previous work, neat PVDF without electrospinning showed a mixture of α and β phases. To ascertain the effect of electrospinning and incorporation of functionalized and unfunctionilized GO in PVDF were electrospun. From Figure 2, it is evident that all electrospun fibers showed increase in height intensity at 840 cm–1 ascribed to polar β phase and diminished peak intensity at 763 cm–1 corresponding to α phase. Moreover, this phenomenon was more pronounced in the case of PVDF/GOF composites. This shows electrospinning and addition of functionalized GO (GOCOOH and GOF) play an important role in the phase transformation from α to β phase. This can be explained as follows: the increase in the intensity of height peak for the β phase after electrospinning could be due to the elongation of the jet fluids which made it easier for the polymer chains to orient along the fiber axis to produce a more polar β-phase.49
Figure 2.
(a,b) FTIR spectra of electrospun PVDF/GO, PVDF/GOCOOH, and PVDF/GOF fibers and (c) XRD of PVDF/GOF fibers.
To quantify the fraction of β-phase in each sample, IR absorption bands at 763 and 840 cm–1 were chosen (characteristic of the α and β phases, respectively). Assuming that IR absorption follows the Lambert–Beer law, the Aα and Aβ absorbencies, at 763 and 840 cm–1, respectively, can be estimated as
| 1 |
| 2 |
where L and C refer to the sample thickness and average total monomer concentration, respectively. The incident and transmitted intensity radiations are given by I0 and I. The subscripts α and β refer to the two crystalline phases present in the sample. The Aα and Aβ values were determined by I0 and I at 763 and 840 cm–1, respectively. K is the absorption coefficient, while X represents the degree of crystallinity of each phase. Kα and Kβ are the absorption coefficients of the respective bands50 (Kα = 6.1 × 10⁴ and Kβ = 7.7 × 104 cm2/mol); Xα and Xβ are the % crystallinity of the respective phases. The relative β fraction, F(β), was calculated as
| 3 |
From FTIR, the amount of β phases (F(β)) content increases with incorporation of nanoparticles. For instance, neat PVDF showed 38% β, PVDF/GO showed 70% β, PVDF/GOCOOH showed 79% β, and PVDF/GOF showed 89% β. This implied that incorporation of GO doped with fluorine increases the content of β phases drastically. The effect of addition of CoFe2O4 coated with surfactants aided in β phase in PVDF.51 The results revealed that higher fraction of polar β phase was obtained with nanoparticles coated with negatively charged moieties. This is attributed to the interaction of highly negatively coated CoFe2O4 nanoparticles with CH2 group of the polymer. Under this frame work, we can conclude that the high fraction of electroactive β phase in PVDF/GOF is due to the presence of high electronegativity fluorine, which makes GO more electrostatically charged leading to higher interaction. In general, the electrospinning process and addition of functionalized GO by fluorine showed maximum amount of polar β phase as compared to others.
The presence of different phases was further confirmed by XRD. Figure 2b shows the XRD pattern of electrospun PVDF/GOF fibers. It is well-reported that characteristic peaks at 18.4°, 20°, and 26.2° ascribed to the diffraction peaks (020), (110), and (021) of α phase and peak at 20.8° ascribed to diffraction peak (200) for the electroactive β phase.52 From Figure 2c, electrospun PVDF/GOF showed a single peak at 2θ = 20.8°, which is the characteristic peak for the β phase. The strong β-phase observed in the PVDF/GOF composite can be attributed to the improved hydrogen bond between the GOF sheets and the PVDF chains, as well as the dipolar interaction between the C=O bonds and the F atoms. From FTIR and XRD, we established that electrospun PVDF/GOF results in the maximum β phase.
Morphology of Electrospun Fibers
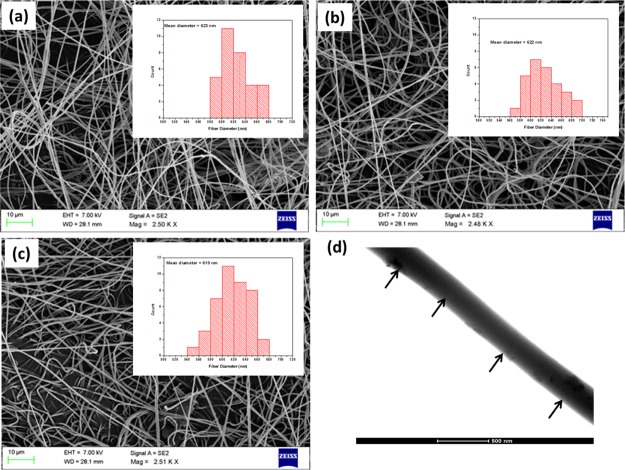
The piezoelectric response of fibers depends on the applied voltage and diameter of the fibers.53 The most important parameters influencing the diameter of the fiber are solution viscosity, temperature, surface tension, and distance between the tip and the collector.54 Le et al. found that the piezoelectric coefficient of piezoelectric materials increases with decrease in the domain size. This is attributed to many nucleation sites exposed by the fine domains, results in reduction of the coercive field.53 The microstructures and dimensions of electrospun fibers were studied using scanning electron microscopy (SEM). Figure 3a–c shows the SEM images of PVDF/GO, PVDF/GOCOOH, and PVDF/GOF fibers, respectively. From Figure 3, it is evident that the fibers are continuous and exhibit closely packed fiber morphology. No beaded fibers were observed under the applied spinning condition. The average diameters of all fibers are 600–700 nm, measured from the SEM images. The mean diameter of the fibers was shown in the inset histogram. This diameter was used to measure the piezoelectric response. Figure 3d shows the transmission electron microscopy (TEM) image of nanofiber-containing GOF. It is well-evident that GOF is present along the fiber direction.
Figure 3.
SEM images of electrospun (a) PVDF/GO, (b) PVDF/GOCOOH, and (c) PVDF/GOF (the mean diameter of fibers as deduced from the histogram is shown as an inset), and (d) TEM image of PVDF/GOF (arrows indicating the presence of GOF).
Piezoelectric Response of Electrospun Fibers
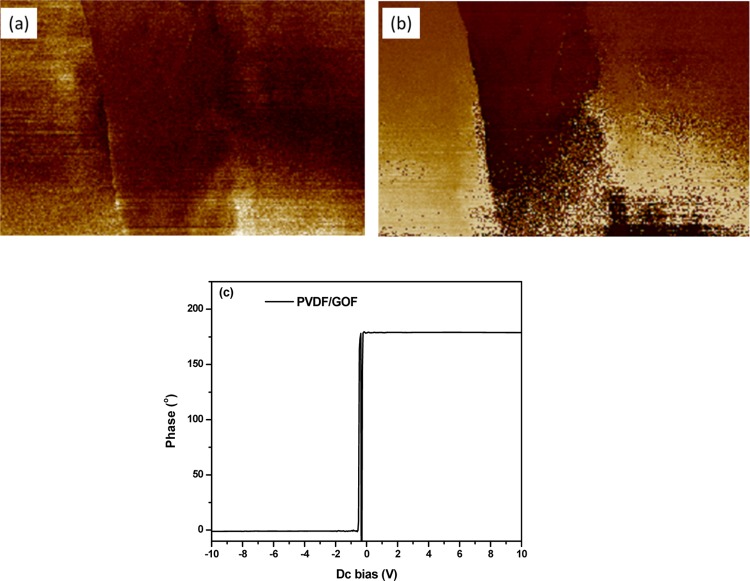
To evaluate the piezoelectric response, PFM images of the electrospun fibers were captured. The PFM tip was fixed in the electrospun fiber, and voltage was applied across the fiber. The voltage induces structural deformation within the fibers. The strain of the fiber is detected by a cantilever tip. The magnitude of the amplitude and phase obtained from piezoresponse determines the polarization and domain structure of the fibers. Figure 4a,b shows the PFM images of amplitude and phase PVDF/GOF images, respectively, on which PFM was carried out. The amplitude and phase images provide information about the magnitude of piezoelectric response and orientation of domains in the fiber, respectively.
Figure 4.
Piezoelectric force microscopy (PFM) of (a) PFM amplitude image, (b) PFM phase image PVDF/GOF fibers, and (c) PFM phase versus voltage hysteresis loop of PVDF/GOF.
The hysteresis loop obtained under the applied electric field provides information about ferroelectric properties of the material. Figure 4c illustrates the phase versus applied voltage for PVDF/GOF fibers. PVDF/GOF shows 180° switching hysteresis loop. Baji et al. explained that the 180° switching hysteresis loop is due to the stress induced by the tip, which leads to domain rearrangement and affects piezoelectric response.
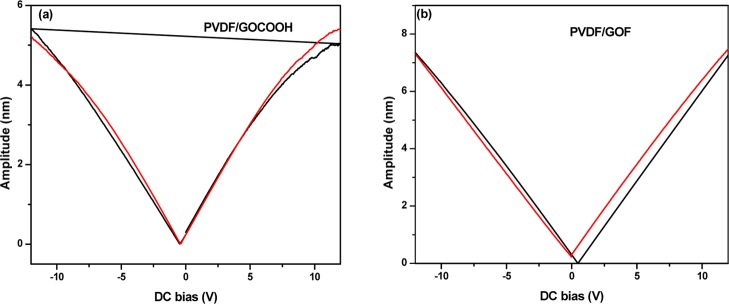
Figure 5a,b shows the piezoelectric response for the samples measured by piezoresponse force measurement (PFM). From these figures, it can be revealed that the maximum amplitude from PFM was found to be 4.8, 5.5, and 7.5 nm for PVDF/GO, PVDF/GOCOOH, and PVDF/GOF, respectively, at E = 12 V. The piezoelectric coefficient of electrospun fibers were calculated by using the following
| 4 |
where S refers to the total strain or amplitude, d33 refers to the piezoelectric coefficient, and E corresponds to the applied electric field.55
Figure 5.
PFM amplitude vs dc voltage (voltage varying from −12 to 12 V) hysteresis loops for (a) PVDF/GOCOOH and (b) PVDF/GOF.
The piezoelectric coefficient (d33) of electrospun PVDF/GO, PVDF/GOCOOH, and PVDF/GOF fibers was compared. From previous work, the piezoelectric coefficient of electrospun neat PVDF was ca. 30 pm V–1.55 From Figure 5a,b, it was revealed that the piezoelectric coefficient of PVDF/GO is 40 pm V–1 and increased to 46 pm V–1 for PVDF/GOCOOH. This result shows that the addition of GOCOOH to PVDF does not enhance the piezoelectric coefficient. Interestingly, after addition of GOF (PVDF/GOF), a drastic increase to 63 pm V–1 was observed. Baji et al. showed that maximum amount of d33 was obtained by the incorporation of BaTiO3 in PVDF. An explanation for the increase in the piezoelectric coefficient is due to the polarization effect of PVDF and BaTiO3.56 A drastic increase in dielectric permittivity of GOF as compared to GO was reported by Sudeep et al. because of the charge separation induced by fluorine which acts as a polarization center.33 From this point of view, the increase in the piezoelectric coefficient with the addition of GOF is attributed to the increase of the content of β phase as revealed by FTIR results and to the polarization effect of GOF and PVDF. Comparable values of d33 of various PVDF based fibers are presented in Table 1. The d33 value significantly enhanced in fluorine-doped GO as compared to Ag-decorated CNT and barium titanate (Table 1).
Table 1. Comparison of the Piezoelectric Coefficient (d33) for Electrospun PVDF-Based Composites.
Dielectric Properties and Energy Density
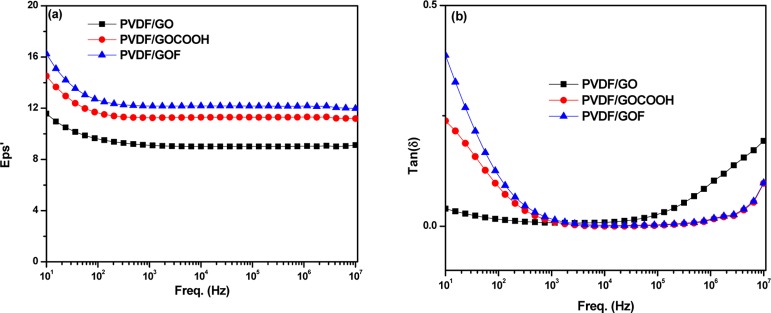
A recent study showed that incorporation of reduced graphene derivatives enhances the dielectric properties of PVDF. For instance, Zheng et al. has demonstrated that incorporation of reduced graphene derivatives exhibit enhanced dielectric permittivity and low dielectric loss as compared to samples without undergoing the reduction reaction.57 This was attributed to strong interfacial interaction between the PVDF matrix and reduced graphene derivatives. The frequency dependent dielectric constant and dielectric loss of PVDF doped with various graphene derivatives of compression-molded samples are presented in Figure 6. As shown in Figure 6a, the PVDF composite doped with fluorine exhibits enhanced dielectric constant. The result reveals that the incorporation of fluorinated GO significantly enhances the dielectric constant of PVDF composites. This can be due to the fluorine group in GOF that can trap electrons and lead to large charge accumulation at the interface. Thus, the charge separation induced by fluorine, which acts as the polarization center, leads to enhanced dielectric constant as shown in Figure 6a. Thus, the increase in the dielectric constant of PVDF/GOF is due to increase in polarization at the interface. The changes in loss tangent of compression-molded samples measured at room temperature are presented in Figure 6b. The dielectric losses for all composites are relatively low.
Figure 6.
Frequency dependence of (a) dielectric constant and (b) dielectric loss for PVDF/GO, PVDF/GOCOOH, and PVDF/GOF composites.
The P–E loop of PVDF doped with various graphene derivatives is illustrated in Figure 7. The incorporation of fluorinated GO into PVDF induces enhanced polarization. It can be seen that fluorine-doped composite (PVDF/GOF) showed highest saturation polarization as compared to PVDF/GOCOOH and PVDF/GO composites. This result also benefits the energy density and the efficiency of the composites. The energy density of PVDF/GO, PVDF/GOCOOH, and PVDF/GOF reaches value of 0.1 J/cm3 at 500 kV/cm, 0.3 J/cm3 at 500 kV/cm, and 1.2 J/cm3 at 950 kV/cm, respectively. The substantial enhancement of the energy density in the PVDF/GOF film is a result of the increase of the breakdown strength. The results illustrated that doping with fluorine is a useful way of enhancing the energy density of PVDF films.
Figure 7.
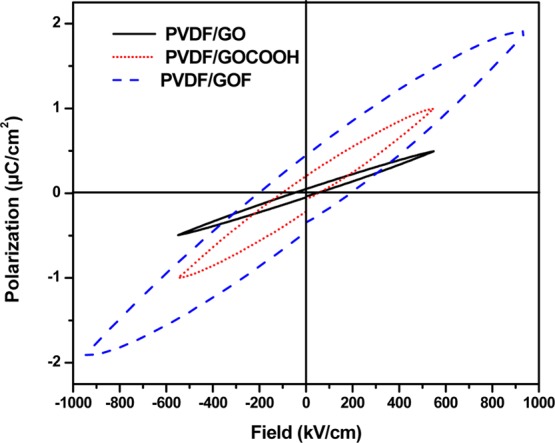
P–E loops for PVDF/GO, PVDF/GOCOOH, and PVDF/GOF at room temperature.
Conclusions
In this study, the effects of GO and functionalized GO (GOCOOH and GOF) on the piezoelectric response and crystalline structure of PVDF were investigated. Different PVDF/GO, PVDF/GOCOOH, and PVDF/GOF fibers were prepared by the electrospinning technique. The results revealed that the as-received PVDF exhibits ca. 38% β phase. However, interestingly electrospinning enhanced the amount of β phase content in PVDF in the presence of GO, GOCOOH, and GOF. Quantitatively, the amounts of β phase for PVDF/GO, PVDF/GOCOOH, and PVDF/GOF are 69, 79, and 89% respectively. The results indicate that an enhanced amount of β phase content was observed in all the fibers as compared to control PVDF samples. This fact can be explained by uniaxial stretching of the samples by the electrospinning process, which leads to the transformation of α-phase into polar β-phase aided by graphene derivatives. The effect is more pronounced in electrospun PVDF fibers in the presence of GOF as compared to GOCOOH and GO. The piezoelectric coefficient of the fiber mats increased with the addition of GO, GOCOOH, and GOF in PVDF. The pressed samples of PVDF/GOF exhibited a maximum dielectric constant of 15 and an energy density of 1.2 J/cm3. The mechanisms behind this drastic enhancement are due to the charge separation induced by fluorine, which acts as a polarization center, and due to the increase in the amount of β phase in PVDF/GOF fibers. Taken together, our study clearly demonstrates that addition of fluoro-doped graphene derivatives can offer exciting properties such as electoactive β phase, enhanced piezoelectric coefficient, and high energy density.
Acknowledgments
The authors would like to thank the Department of Science and Technology (DST) India for the financial support. G.M. would like to thank DST for the J. C. Bose fellowship. The authors would also like to acknowledge the MNCF facilities at CeNSE at IISc and would like to thank Sanjay Prasad (IPC, IISc) for his assistance in FTIR.
The authors declare no competing financial interest.
References
- Mathur S. C.; Scheinbeim J. I.; Newman B. A. Piezoelectric properties and ferroelectric hysteresis effects in uniaxially stretched nylon-11 films. J. Appl. Phys. 1984, 56, 2419–2425. 10.1063/1.334294. [DOI] [Google Scholar]
- Huang L.; Zhuang X.; Hu J.; Lang L.; Zhang P.; Wang Y.; Chen X.; Wei Y.; Jing X. Synthesis of biodegradable and electroactive multiblock polylactide and aniline pentamer copolymer for tissue engineering applications. Biomacromolecules 2008, 9, 850–858. 10.1021/bm7011828. [DOI] [PubMed] [Google Scholar]
- Bryan D. J.; Tang J. B.; Doherty S. A.; Hile D. D.; Trantolo D. J.; Wise D. L.; Summerhayes I. C. Enhanced peripheral nerve regeneration through a poled bioresorbable poly(lactic-co-glycolic acid) guidance channel. J. Neural. Eng. 2004, 1, 91–98. 10.1088/1741-2560/1/2/004. [DOI] [PubMed] [Google Scholar]
- Kawai H. The piezoelectricity of poly(vinylidene fluoride). Jpn. J. Appl. Phys. 1969, 8, 975–976. 10.1143/jjap.8.975. [DOI] [Google Scholar]
- Ramadan K. S.; Sameoto D.; Evoy S. A review of piezoelectric polymers as functional materials for electromechanical transducers. Smart Mater. Struct. 2014, 23, 033001. 10.1088/0964-1726/23/3/033001. [DOI] [Google Scholar]
- Giannetti E. Semi-crystalline fluorinated polymers. Polym. Int. 2001, 50, 10–26. . [DOI] [Google Scholar]
- Martins P.; Lopes A. C.; Lanceros-Mendez S. Electroactive phases of poly(vinylidene fluoride): Determination, processing and applications. Prog. Polym. Sci. 2014, 39, 683–706. 10.1016/j.progpolymsci.2013.07.006. [DOI] [Google Scholar]
- Prest W. M. Jr.; Luca D. J. The morphology and thermal response of high-temperature–crystallized poly(vinylidene fluoride). J. Appl. Phys. 1975, 46, 4136–4143. 10.1063/1.321438. [DOI] [Google Scholar]
- Lovinger A. J. Annealing of poly(vinylidene fluoride) and formation of a fifth phase. Macromolecules 1982, 15, 40–44. 10.1021/ma00229a008. [DOI] [Google Scholar]
- Takahashi Y.; Tadokoro H. Crystal structure of form III of poly(vinylidene fluoride). Macromolecules 1980, 13, 1317–1318. 10.1021/ma60077a057. [DOI] [Google Scholar]
- Chen S.; Yao K.; Tay F. E. H.; Liow C. L. Ferroelectric poly(vinylidene fluoride) thin films on Si substrate with the β phase promoted by hydrated magnesium nitrate. J. Appl. Phys. 2007, 102, 104108. 10.1063/1.2812702. [DOI] [Google Scholar]
- Salimi A.; Yousefi A. A. Analysis Method: FTIR studies of β-phase crystal formation in stretched PVDF films. Polym. Test. 2003, 22, 699–704. 10.1016/s0142-9418(03)00003-5. [DOI] [Google Scholar]
- Sencadas V.; Gregorio R. Jr.; Lanceros-Méndez S. α to β phase transformation and microestructural changes of PVDF films induced by uniaxial stretch. J. Macromol. Sci., Part B: Phys. 2009, 48, 514–525. 10.1080/00222340902837527. [DOI] [Google Scholar]
- Sharma M.; Madras G.; Bose S. Process induced electroactive β-polymorph in PVDF: effect on dielectric and ferroelectric properties. Phys. Chem. Chem. Phys. 2014, 16, 14792–14799. 10.1039/c4cp01004c. [DOI] [PubMed] [Google Scholar]
- Davies G. R.; Singh H. Evidence for a new crystal phase in conventionally poled samples of poly(vinylidene fluoride) in crystal form II. Polymer 1979, 20, 772–774. 10.1016/0032-3861(79)90253-2. [DOI] [Google Scholar]
- Furukawa T. Piezoelectricity and pyroelectricity in polymers. IEEE Trans. Electr. Insul. 1989, 24, 375–394. 10.1109/14.30878. [DOI] [Google Scholar]
- Gebrekrstos A.; Sharma M.; Madras G.; Bose S. Critical Insights into the Effect of Shear, Shear History, and the Concentration of a Diluent on the Polymorphism in Poly(vinylidene fluoride). Cryst. Growth Des. 2017, 17, 1957–1965. 10.1021/acs.cgd.6b01896. [DOI] [Google Scholar]
- Gebrekrstos A.; Sharma M.; Madras G.; Bose S. New physical insights into shear history dependent polymorphism in poly(vinylidene fluoride). Cryst. Growth Des. 2016, 16, 2937–2944. 10.1021/acs.cgd.6b00282. [DOI] [Google Scholar]
- Salimi A.; Yousefi A. A. Conformational changes and phase transformation mechanisms in PVDF solution-cast films. J. Polym. Sci., Part B: Polym. Phys. 2004, 42, 3487–3495. 10.1002/polb.20223. [DOI] [Google Scholar]
- Gomes J.; Nunes J. S.; Sencadas V.; Lanceros-Méndez S. Influence of the β-phase content and degree of crystallinity on the piezo- and ferroelectric properties of poly(vinylidene fluoride). Smart Mater. Struct. 2010, 19, 065010. 10.1088/0964-1726/19/6/065010. [DOI] [Google Scholar]
- Mohammadi B.; Yousefi A. A.; Bellah S. M. Effect of tensile strain rate and elongation on crystalline structure and piezoelectric properties of PVDF thin films. Polym. Test. 2007, 26, 42–50. 10.1016/j.polymertesting.2006.08.003. [DOI] [Google Scholar]
- Li R.; Xiong C.; Kuang D.; Dong L.; Lei Y.; Yao J.; Jiang M.; Li L. Polyamide 11/poly(vinylidene fluoride) blends as novel flexible materials for capacitors. Macromol. Rapid Commun. 2008, 29, 1449–1454. 10.1002/marc.200800253. [DOI] [Google Scholar]
- Kim G. H.; Hong S. M.; Seo Y. Piezoelectric properties of poly(vinylidene fluoride) and carbon nanotube blends: β-phase development. Phys. Chem. Chem. Phys. 2009, 11, 10506–10512. 10.1039/b912801h. [DOI] [PubMed] [Google Scholar]
- Burghard M. Asymmetric End-Functionalization of Carbon Nanotubes. Small 2005, 1, 1148–1150. 10.1002/smll.200500257. [DOI] [PubMed] [Google Scholar]
- Liu X.; Ma J.; Wu X.; Lin L.; Wang X. Polymeric Nanofibers with Ultrahigh Piezoelectricity via Self-Orientation of Nanocrystals. ACS Nano 2017, 11, 1901–1910. 10.1021/acsnano.6b07961. [DOI] [PubMed] [Google Scholar]
- Jiang Z. Y.; Zheng G. P.; Han Z.; Liu Y. Z.; Yang J. H. Enhanced ferroelectric and pyroelectric properties of poly(vinylidene fluoride) with addition of graphene oxides. J. Appl. Phys. 2014, 115, 204101. 10.1063/1.4878935. [DOI] [Google Scholar]
- Rahman M. A.; Lee B.-C.; Phan D.-T.; Chung G.-S. Fabrication and characterization of highly efficient flexible energy harvesters using PVDF–graphene nanocomposites. Smart Mater. Struct. 2013, 22, 085017. 10.1088/0964-1726/22/8/085017. [DOI] [Google Scholar]
- Rahman M. A.; Chung G.-S. Synthesis of PVDF-graphene nanocomposites and their properties. J. Alloys Compd. 2013, 581, 724–730. 10.1016/j.jallcom.2013.07.118. [DOI] [Google Scholar]
- Kim J.-Y.; Lee W. H.; Suk J. W.; Potts J. R.; Chou H.; Kholmanov I. N.; Piner R. D.; Lee J.; Akinwande D.; Ruoff R. S. Chlorination of reduced graphene oxide enhances the dielectric constant of reduced graphene oxide/polymer composites. Adv. Mater. 2013, 25, 2308–2313. 10.1002/adma.201300385. [DOI] [PubMed] [Google Scholar]
- Dettlaff-Weglikowska U.; Skákalová V.; Graupner R.; Jhang S. H.; Kim B. H.; Lee H. J.; Ley L.; Park Y. W.; Berber S.; Tománek D.; Roth S. Effect of SOCl2 Treatment on Electrical and Mechanical Properties of Single-Wall Carbon Nanotube Networks. J. Am. Chem. Soc. 2005, 127, 5125–5131. 10.1021/ja046685a. [DOI] [PubMed] [Google Scholar]
- Wu Y.; Lin X.; Shen X.; Sun X.; Liu X.; Wang Z.; Kim J.-K. Exceptional dielectric properties of chlorine-doped graphene oxide/poly (vinylidene fluoride) nanocomposites. Carbon 2015, 89, 102–112. 10.1016/j.carbon.2015.02.074. [DOI] [Google Scholar]
- Romero-Aburto R.; Narayanan T. N.; Nagaoka Y.; Hasumura T.; Mitcham T. M.; Fukuda T.; Cox P. J.; Bouchard R. R.; Maekawa T.; Kumar D. S.; Torti S. V.; Mani S. A.; Ajayan P. M. Fluorinated graphene oxide; a new multimodal material for biological applications. Adv. Mater. 2013, 25, 5632–5637. 10.1002/adma201301804. [DOI] [PMC free article] [PubMed] [Google Scholar]
- Sudeep P. M.; Vinayasree S.; Mohanan P.; Ajayan P. M.; Narayanan T. N.; Anantharaman M. R. Fluorinated graphene oxide for enhanced S and X-band microwave absorption. Appl. Phys. Lett. 2015, 106, 221603. 10.1063/1.4922209. [DOI] [Google Scholar]
- Sun X.; Liu Z.; Welsher K.; Robinson J. T.; Goodwin A.; Zaric S.; Dai H. Nano-graphene oxide for cellular imaging and drug delivery. Nano Res. 2008, 1, 203–212. 10.1007/s12274-008-8021-8. [DOI] [PMC free article] [PubMed] [Google Scholar]
- Xing R.; Li Y.; Yu H. Preparation of fluoro-functionalized graphene oxide via the Hunsdiecker reaction. Chem. Commun. 2016, 52, 390–393. 10.1039/c5cc08252h. [DOI] [PubMed] [Google Scholar]
- Park M.-S.; Lee Y.-S. Functionalization of graphene oxide by fluorination and its characteristics. J. Fluorine Chem. 2016, 182, 91–97. 10.1016/j.jfluchem.2015.12.011. [DOI] [Google Scholar]
- Lee Y. S.; Cho T. H.; Lee B. K.; Rho J. S.; An K. H.; Lee Y. H. Surface properties of fluorinated single-walled carbon nanotubes. J. Fluorine Chem. 2003, 120, 99–104. 10.1016/s0022-1139(02)00316-0. [DOI] [Google Scholar]
- Shen J.; Hu Y.; Shi M.; Lu X.; Qin C.; Li C.; Ye M. Fast and Facile Preparation of Graphene Oxide and Reduced Graphene Oxide Nanoplatelets. Chem. Mater. 2009, 21, 3514–3520. 10.1021/cm901247t. [DOI] [Google Scholar]
- Gupta V.; Nakajima T.; Žemva B. Raman scattering study of highly fluorinated graphite. J. Fluorine Chem. 2001, 110, 145–151. 10.1016/s0022-1139(01)00422-5. [DOI] [Google Scholar]
- Tuinstra F.; Koenig J. L. Raman spectrum of graphite. J. Chem. Phys. 1970, 53, 1126–1130. 10.1063/1.1674108. [DOI] [Google Scholar]
- Karlický F.; Kumara Ramanatha Datta K.; Otyepka M.; Zbořil R. Halogenated graphenes: rapidly growing family of graphene derivatives. ACS Nano 2013, 7, 6434–6464. 10.1021/nn4024027. [DOI] [PubMed] [Google Scholar]
- Chen X.; Huang H.; Shu X.; Liu S.; Zhao J. Preparation and properties of a novel graphene fluoroxide/polyimide nanocomposite film with a low dielectric constant. RSC Adv. 2017, 7, 1956–1965. 10.1039/c6ra25343a. [DOI] [Google Scholar]
- Jiang Z. Y.; Zheng G. P.; Zhan K.; Han Z.; Yang J. H. Formation of piezoelectric β-phase crystallites in poly(vinylidene fluoride)-graphene oxide nanocomposites under uniaxial tensions. J. Phys. D: Appl. Phys. 2015, 48, 245303. 10.1088/0022-3727/48/24/245303. [DOI] [Google Scholar]
- El Achaby M.; Arrakhiz F. Z.; Vaudreuil S.; Essassi E. M.; Qaiss A. Piezoelectric β-polymorph formation and properties enhancement in graphene oxide–PVDF nanocomposite films. Appl. Surf. Sci. 2012, 258, 7668–7677. 10.1016/j.apsusc.2012.04.118. [DOI] [Google Scholar]
- Ke K.; Pötschke P.; Jehnichen D.; Fischer D.; Voit B. Achieving β-phase poly(vinylidene fluoride) from melt cooling: Effect of surface functionalized carbon nanotubes. Polymer 2014, 55, 611–619. 10.1016/j.polymer.2013.12.014. [DOI] [Google Scholar]
- Achaby M. E.; Arrakhiz F.-E.; Vaudreuil S.; Essassi E. M.; Qaiss A.; Bousmina M. Nanocomposite films of poly(vinylidene fluoride) filled with polyvinylpyrrolidone-coated multiwalled carbon nanotubes: enhancement of β-polymorph formation and tensile properties. Polym. Eng. Sci. 2013, 53, 34–43. 10.1002/pen.23236. [DOI] [Google Scholar]
- Sun L. L.; Li B.; Zhang Z. G.; Zhong W. H. Achieving very high fraction of β-crystal PVDF and PVDF/CNF composites and their effect on AC conductivity and microstructure through a stretching process. Eur. Polym. J. 2010, 46, 2112–2119. 10.1016/j.eurpolymj.2010.09.003. [DOI] [Google Scholar]
- Lanceros-Méndez S.; Mano J. F.; Costa A. M.; Schmidt V. H. FTIR and DSC studies of mechanically deformed β-PVDF films. J. Macromol. Sci., Part B: Phys. 2001, 40, 517–527. 10.1081/mb-100106174. [DOI] [Google Scholar]
- Ahn Y.; Lim J. Y.; Hong S. M.; Lee J.; Ha J.; Choi H. J.; Seo Y. Enhanced piezoelectric properties of electrospun poly(vinylidene fluoride)/multiwalled carbon nanotube composites due to high β-phase formation in poly(vinylidene fluoride). J. Phys. Chem. C 2013, 117, 11791–11799. 10.1021/jp4011026. [DOI] [Google Scholar]
- Gregorio R. Jr.; Cestari M. Effect of crystallization temperature on the crystalline phase content and morphology of poly(vinylidene fluoride). J. Polym. Sci., Part B: Polym. Phys. 1994, 32, 859–870. 10.1002/polb.1994.090320509. [DOI] [Google Scholar]
- Martins P.; Caparros C.; Gonçalves R.; Martins P. M.; Benelmekki M.; Botelho G.; Lanceros-Mendez S. Role of Nanoparticle Surface Charge on the Nucleation of the Electroactive β-Poly(vinylidene fluoride) Nanocomposites for Sensor and Actuator Applications. J. Phys. Chem. C 2012, 116, 15790–15794. 10.1021/jp3038768. [DOI] [Google Scholar]
- Buckley J.; Cebe P.; Cherdack D.; Crawford J.; Ince B. S.; Jenkins M.; Pan J.; Reveley M.; Washington N.; Wolchover N. Nanocomposites of poly(vinylidene fluoride) with organically modified silicate. Polymer 2006, 47, 2411–2422. 10.1016/j.polymer.2006.02.012. [DOI] [Google Scholar]
- Le D.-T.; Kwon S.-J.; Yeom N.-R.; Lee Y.-J.; Jeong Y.-H.; Chun M.-P.; Nam J.-H.; Paik J.-H.; Kim B.-I.; Cho J.-H. Effects of the domain size on local d33 in tetragonal (Na0.53K0.45Li0.02)(Nb0.8Ta0.2)O3 ceramics. J. Am. Ceram. Soc. 2013, 96, 174–178. 10.1111/j.1551-2916.2012.05445.x. [DOI] [Google Scholar]
- Huang Z.-M.; Zhang Y.-Z.; Kotaki M.; Ramakrishna S. A review on polymer nanofibers by electrospinning and their applications in nanocomposites. Compos. Sci. Technol. 2003, 63, 2223–2253. 10.1016/s0266-3538(03)00178-7. [DOI] [Google Scholar]
- Sharma M.; Srinivas V.; Madras G.; Bose S. Outstanding dielectric constant and piezoelectric coefficient in electrospun nanofiber mats of PVDF containing silver decorated multiwall carbon nanotubes: assessing through piezoresponse force microscopy. RSC Adv. 2016, 6, 6251–6258. 10.1039/c5ra25671b. [DOI] [Google Scholar]
- Baji A.; Mai Y.-W.; Li Q.; Liu Y. Nanoscale investigation of ferroelectric properties in electrospun barium titanate/polyvinylidene fluoride composite fibers using piezoresponse force microscopy. Compos. Sci. Technol. 2011, 71, 1435–1440. 10.1016/j.compscitech.2011.05.017. [DOI] [Google Scholar]
- Zheng X.; Yu H.; Yue S.; Xing R.; Zhang Q.; Liu Y.; Zhang B. Functionalization of Graphene and Dielectric Property Relationships in PVDF/graphene Nanosheets Composites. Int. J. Electrochem. Sci. 2018, 13, 1–13. 10.20964/2018.01.16. [DOI] [Google Scholar]


