Abstract
The present finding deals with a simple and low-cost fabrication of surface-passivated, brightly fluorescent zinc-oxide-decorated, red-emitting excitation-independent ultrafluorescent CDs, denoted as “CZnO-Dots”. Surface doping of zinc oxide significantly improved the quantum yield by up to ∼72%, and these brightly fluorescent red-emitting CZnO-Dots have been employed for the aqueous-phase photoreduction of 100 ppm hexavalent chromium(VI) to trivalent chromium(III) under the influence of sunlight irradiation. The overall utility of the prepared CZnO-Dots can be ascertained by their recyclability over seven cycles.
Introduction
Since their discovery, carbon-based fluorescent materials as carbon dots (CDs)1 and graphene quantum dots (GQDs)2 have been explored a lot because of their wide range in the applicative sustainability.3−6 Their biocompatibility with higher values of quantum yield7 has made CDs/GQDs significantly better candidates when compared with the long-known quantum dots (QDs), especially in the field of bioimaging applications.4,8 However, at present, they are facing a few issues because of the emissive profiles situated in the narrower region of the visible spectrum (in between the blue and green regions).4,5,8 A limited number of reports state that their emission lies in the higher wavelength region [red and near-infrared (NIR) regions].9−13 The energy associated with the red and NIR regions of the spectrum is less, which can directly relate to them being lesser harmful to biological systems.14,15 Work is already in progress for the fabrication of red-emitting CDs/GQDs with higher quantum yield via the hydrothermal,16,17 solvothermal,11,18 and microwave12,19,20 methods using different precursors such as carbon9,11−13,16,18−21 and the heteroatoms22 (as the dopant material) to achieve red-imaging.12,16 Sun et al. report the synthesis of metal-doped green fluorescent ZnO and ZnS-doped/-decorated CD by the doping of zinc acetate on the surface of CD via hydrolysis by NaOH and precipitation with Na2S, respectively.23 Cheng et al. report the synthesis of yellow fluorescent CZnO-Dots via a one-step hydrothermal synthesis by mixing citric acid and zinc chloride in toluene and used them in bifunctional photonic crystal films, fluorescent microfibers, and patterns.24 Xu et al. synthesized blue-light-emitting CZnO-Dots by mixing sodium citrate and zinc chloride via the hydrothermal method and used them as a biosensor.25 ZnO/graphene quasi-core shell QDs were synthesized by Son et al., who used them in white-light-emitting diodes.26 Apart from the above-mentioned applications, CD and doped CD are used in the field of sensing (gas,27 heavy metals,28−30 microbes,31,32 etc.), optical displays,33 tunable photoluminescence,4,34 biocompatibility,33 and competitive quantum yield values7 and in the field of bioimaging (presently being explored in the red and NIR regions).9−13 Based on their vast levels of applicative sustainability CDs/doped CDs can be expected to show their potential toward world’s most serious concern, that is, contamination of water35 which increases at a very high rate because of the increase in world population and industrialization. A huge amount of wastewater is discharged routinely which contains a large amount of heavy inorganic metal ions and organic compounds generally known as dyes that subsequently degraded the overall environmental and human health. Few reports are available for the photodegradation of the organic dyes by the waste derived nano-carbons.36−39 The removal of heavy metals from wastewater has been carried out by different techniques.40−44 Red-emitting CDs can be a significant material, simply because of their lower working levels of energy which can be used for the applications related to water treatment.
Under the influence of sunlight, the present work describes a new prospect of using red-emitting CZnO-Dots apart from their routine applications. Concerning its successful usage for the aqueous-phase photoreduction of 100 ppm of Cr(VI) in dichromate water. The as-obtained CZnO-Dots showed excellent solubility and stability in aqueous media along with excellent photostability and exhibited excitation-independent red emissions with high quantum yields (∼50%). The most significant prospect of the present finding is the utilization of CZnO-Dots as a novel photocatalyst material for the aqueous-phase photo-reduction of 100 ppm hexavalent chromium [Cr(VI)].
Results and Discussion
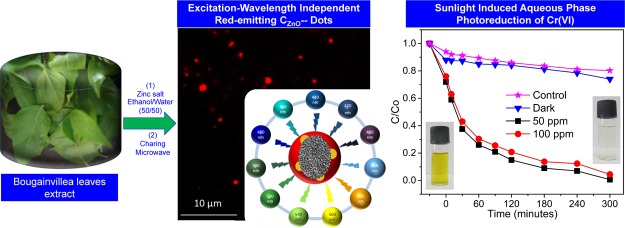
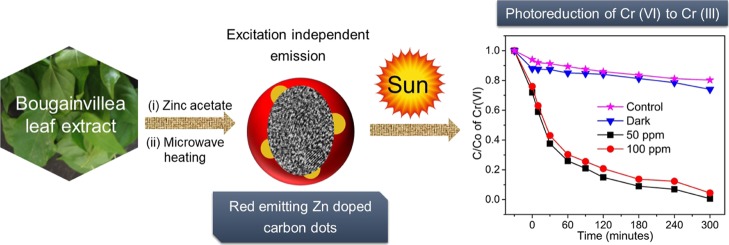
The simple methodology illustrated in Scheme 1 presents a low-cost fabrication approach for the synthesis of surface-passivated, brightly fluorescent zinc-oxide-decorated, red-emitting CZnO-Dots showing excitation-independent red emission at ∼661 nm, with excellent photostability and high quantum yield.
Scheme 1. Schematic Representation and Illustration Showing the Simple Synthesis and the Application of Red-Emitting CZnO-Dots in the Aqueous-Phase Photoreduction of Cr(VI) to Cr(III), Under the Influence of Sunlight.
Microscopic Analysis
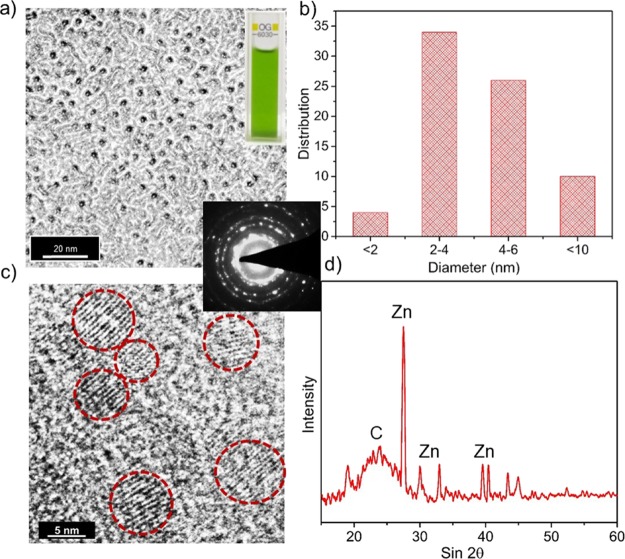
The morphology of CZnO-Dots was analyzed by transmission electron microscopy (TEM) and high-resolution TEM (HRTEM). Figure 1a shows the TEM image of CZnO-Dots with well-dispersed particles. Inset of Figure 1a shows the photographic image of CZnO-Dots. The average size of CZnO-Dots is ∼2–6 nm as observed from the size distribution shown in Figure 1b. Figure 1c displays the HRTEM image of CZnO-Dots showing the presence of graphitic dots of different shapes and sizes (red circles), and the inset of Figure 1c shows the selected-area diffraction pattern (SAED), confirming the polycrystalline characteristic of the sample. Figure 1d shows the powder X-ray diffraction (XRD) spectrum of CZnO-Dots, confirming the doping of zinc in CZnO-Dots. The 2θ at 27.6°, 30°, 33.04°, 39.6°, 43.36°, and 44.94° is compared with the JCPDS of PDF card number 00-021-1486 for ZnO and that at 23.8° for graphitic carbon.
Figure 1.
(a) TEM image showing well-dispersed CZnO-Dots; inset of (a) photographic image of the CZnO-Dots in the daylight; (b) corresponding size distribution; (c) HRTEM image marked with red circles showing CZnO-Dots with graphitic fringes; the inset of (c) shows the SAED pattern and (d) powder XRD spectrum of the CZnO-Dots sample.
UV–Visible Absorption and X-ray Photoelectron Spectroscopy (XPS) Analysis
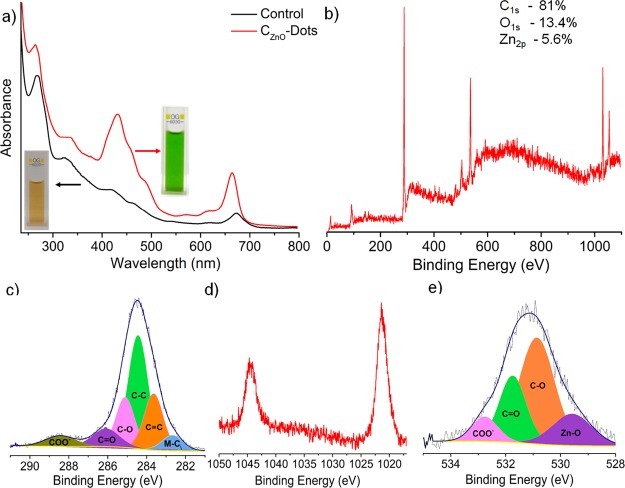
The absorption spectrum of CZnO-Dots versus the control sample (without ZnO-doped) is shown in Figure 2a. Both the CZnO-Dots and the control samples showed almost similar absorption characteristics except for an increase in the absorption peak intensities at their respective wavelengths. As observed, the CZnO-Dots exhibited a higher absorption intensity compared to the control samples (the hyperchromic effect), and the highest intensity peak at 430 nm corresponds to n−π* compared to other peaks. The inset of Figure 2a shows the photographic image of the control samples, and CZnO-Dots in daylight clearly show the changes in the color of the solution after the doping of Zn. The shift toward the lower wavelength and higher intensity of absorption peaks supports the doping of ZnO within the carbogenic surface of the control sample to yield highly emissive red-emitting CZnO-Dots. The surface attachment of the zinc material as a dopant CZnO-Dot was investigated by the XPS analysis, as described in Figure 2b–e. The XPS survey scan shows the peaks at 284.8, 532.8, 1024, and 1045 eV associated with the presence of C1s (81.0%), O1s (13.4%), and Zn2p (5.6%), as displayed in Figure 2b, confirming the existence of C, O, and Zn, within the CZnO-Dots. Moreover, the high-resolution XPS spectra over the deconvolution showed the presence of different binding sites for C, Zn, and O, as displayed in Figure 2c–e. The high-resolution XPS short scan of C1s deconvolution displayed several C-binding sites at 282.6 (C–Zn), 283.6 (C=C), 284.5 (C–C), 285.2 (C–O), 286.1 (C=O), and 288.4 eV (COO–)45,46 (Figure 2c). The short scans of Zn are shown in Figure 2d. Similarly, for the O1s deconvolution, different binding sites for C and Zn are shown in Figure 2e at 529.5 (O–Zn), 530.9 (C–O), 531.8 (C=O), and 532.9 eV (COO–).47
Figure 2.
(a) UV–vis spectra of the control and CZnO-Dots; the insets of (a) show the photographic images of the control and CZnO-Dots in daylight; (b) survey scan of CZnO-Dots; and its corresponding short scans of (c) C1s, (d) Zn2p, and (e) O1s.
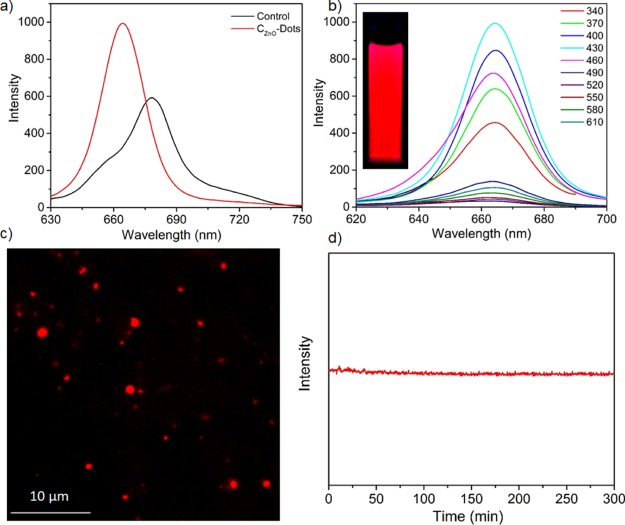
Figure 3 shows the optical property of CZnO-Dots via fluorescence spectroscopy. Figure 3a shows almost similar characteristic fluorescence spectra for CZnO-Dots and the control sample. The CZnO-Dots exhibited a relatively higher fluorescent intensity with a slight blue shift (∼17 nm) in the fluorescence spectra compared to the control. The emissive fluorescence spectra are in accordance with the observations noticed in the absorption studies (Figure 2a). The brightly fluorescent and prominent aspect concerning the excitation-independent red-emitting CZnO-Dots is shown in Figure 3b. The inset of Figure 3b displays the photographic image of CZnO-Dots under UV light illumination. Regarding the excitation-independent red emission of CZnO-Dots can be explained based on documented reports ascribed because of the incorporation/doping of heteroatoms.48,49Figure 3c displays the optical fluorescence microscopy image of CZnO-Dots with a 562 nm band-pass filter, and Figure 3d shows the excellent photostability of CZnO-Dots toward a photobleaching experiment performed for 5 h at continuous irradiation with excitation at 430 nm. The quantum yield of the as-prepared CZnO-Dots was ∼50% (compared to Nile blue), and this can be increased up to ∼72% by centrifuging it on high rpm (11 000) for the isolation of most fluorescent fraction. All the photoreduction experiments were carried out by using the as prepared CZnO-Dots.
Figure 3.
(a) Fluorescence spectra of CZnO-Dots and the control sample; (b) Fluorescence spectra excited at different wavelengths for CZnO-Dots; the inset of (b) shows the photographic image of CZnO-Dots under UV light in a UV chamber; (c) Fluorescence imaging of CZnO-Dots under the excitation of a 562 nm band-pass filter; and (d) photostability of CZnO-Dots excited continuously at 430 nm wavelength for 5 h.
CZnO-Dots in Photocatalytic Reduction of Cr(VI) to Cr(III)
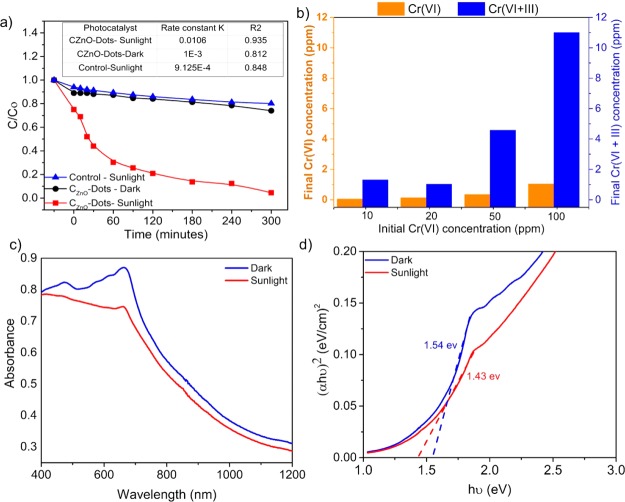
The sunlight-induced photocatalytic activity of CZnO-Dots was assessed for the aqueous-phase photoreduction of the toxic Cr(VI). The continuous decrease in the concentrations of Cr(VI) ( in terms of C/C0) as shown in Figure 4a under the influence of sunlight was determined by the absorption analysis at the 540 nm wavelength by following the 1,5-diphenyl carbazide (DPC) assay.43 Prior to the photoreduction experiment, 3 mg mL–1 of CZnO-Dots was mixed in a 100 ppm Cr(VI) stock solution and stirred continuously in the dark for 30 min, to achieve the adsorption–desorption equilibrium. The adsorption data (Figure 4a) for CZnO-Dots in the dark (black line) and sunlight (red line) including the control (blue line) showed that only 27% of Cr(VI) reduction was achieved in the 300 min dark condition. Moreover, the photocatalytic influence of sunlight in the presence of CZnO-Dots showed the highest reduction of Cr(VI) (∼99%) in 300 min, which was 75.7% higher as compared to the control sample. The increase in photoreduction efficiency for CZnO-Dots could be attributed to the high catalytic activity of ZnO that facilitates the reduction in recombination of photogenerated charge carriers.50 Moreover, another plausible reason for the high photocatalytic activity of CZnO-Dots for Cr(VI) reduction is ascribed to their high adsorption values. CZnO-Dots showed a higher Cr(VI) adsorption efficiency (∼25%, red line) compared to that of the control (∼8%, blue line), as shown in Figure 4a, which can significantly enhance the availability of Cr(VI) at the active sites of the used catalyst material as CZnO-Dots. During the process of photocatalysis, the photogenerated electrons from the photocatalyst can readily access surface-adsorbed Cr(VI) ions and thereby stimulate the reduction process [reduce Cr(VI) to Cr(III)].51,52
Figure 4.
(a) Plot of Cr(VI) photoreduction [(C/C0)] by CZnO-Dots under different conditions; the inset of (a) shows the comparative data of first-order rate constant and correlation coefficient obtained from fitting the experimental data; and (b) the final concentration of Cr(VI) and Cr(VI + III) in the aqueous phase after photoreduction at different initial Cr(VI) concentrations based on UV−vis and AAS analyses. (c) UV−vis absorption spectra and (d) Tauc plots of (αhυ)2 vs photo energy (hυ) of CZnO-Dots in the dark and sunlight-exposed samples.
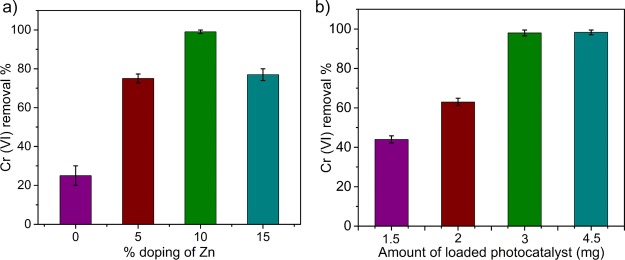
The experimental data are well-fitted with a first-order kinetic model, and the rate constant values as well as the correlation coefficient are shown in the inset of Figure 4a. However, the experimental data do not fit well with the zero-order and second-order models. Figure 4b shows the percentage of Cr(VI) and Cr(VI + III) remaining in the aqueous phase after the photoreduction process at different initial Cr(VI) concentrations (10, 20, 50, and 100 ppm) as determined from UV–vis and atomic absorption spectroscopy (AAS) analyses, respectively. To further investigate the influence of sunlight irradiation on CZnO-Dots, the change in the band gap value was analyzed by using the UV–vis diffuse reflectance spectroscopy compared to that in the dark.53−55Figure 4c shows the absorption edge near ∼661 nm, which corresponds to the band gap of CZnO-Dots. Figure 4d shows the Tauc’s plot [(αhυ)2 vs hυ];56 the band gap for CZnO-Dots was 1.54 eV while their values decreased to 1.43 eV when sensitized with sunlight. The results show that the band gap energy decreases and particularly shifts toward an efficient visible light range that enhanced the photocatalysis process for Cr(VI) reduction. The high rate constant values under sunlight irradiation as discussed earlier (Figure 4a) are consistent with the experimental observation based on diffuse reflectance. Furthermore, the effects of percentage (%) doping and the amount of photocatalyst (CZnO-Dots) loading had been studied to understand their effects on the rate of photoreduction. A separate study was performed by varying the experimental conditions related to the percentage doping of zinc (Figure 5a) and the amount of catalyst (Figure 5b). The results are shown in Figure 5, which illustrates that the maximum photoreduction [100 ppm Cr(VI)] under the influence of sunlight was obtained at 3 mg/mL amount of CZnO-Dots when they were doped with 10 wt % Zn salt as a dopant. Thus, it was inferred that the introduction of ZnO as a dopant can significantly improve the catalytic activity of CZnO-Dots and play a vital role in the photoreduction reaction on the catalyst surface.
Figure 5.
Effect of (a) % doping and (b) loading amount of the photocatalyst on the photoreduction of 100 ppm Cr(VI) in the presence of sunlight.
Photocatalytic Mechanism for Photoreduction
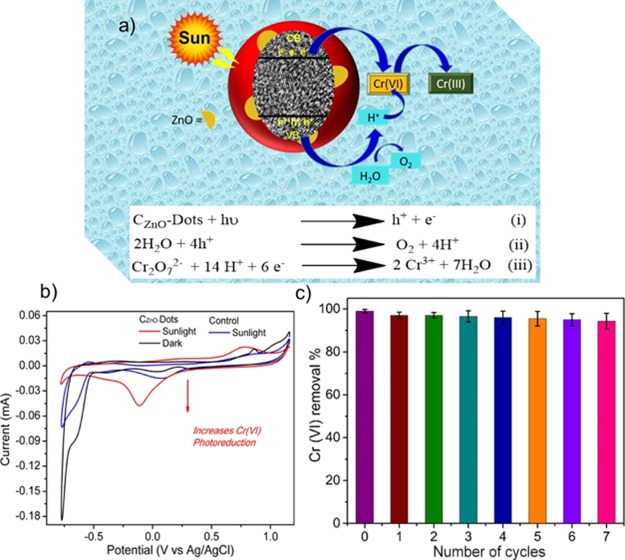
Figure 6a shows the plausible mechanism based on the experimental results. The electrons and holes in CZnO-Dots could be generated under sunlight illumination, as shown in equation (i). Then, the photogenerated hole in the valence band produced O2 and H+ as a result of reduction of H2O, as shown in equation (ii).57 Afterward, the photogenerated electrons and H+ approach Cr(VI) present in the surrounding of CZnO-Dots, for the photoreduction of Cr(VI) to Cr(III) as shown in equation (iii). Certainly, as expected, the solubility is enhanced because of the presence of defects in CZnO-Dots, which plays a critical role in the photoreduction process in approaching Cr(VI) to the active site of the CZnO-Dot surface for the redox reaction. The valance state transformation of Cr or photoreduction of Cr(VI) to Cr(III) under the influence of sunlight irradiation using CZnO-Dots was supported by a cyclic voltammetry (CV) study. The CV data presented in Figure 6b showed the cyclic voltammograms for the control and CZnO-Dots samples. The CZnO-Dots accelerate Cr(VI) to Cr(III) reduction under sunlight as observed from the increase in the peak’s current at ∼ −0.11 V, however, such reduction did not occur under the dark condition. The increase in peaks current attributes to the decomposition of Cr2O7−2 which normally did not occur, at such a low potential, but CZnO-Dots under conjugation may tune and enhance the overall process. On the other side in the case of the control sample (without doping) very insignificant reduction current occurred even under the influence of sunlight. The appearance of a single peak, broad in nature confirmed that the said reduction is a complex process for which a detailed electrochemical study is planned in the future. The reusability and stability of CZnO-Dots were also studied under sunlight irradiation, as shown in Figure 6c. The results indicate that the CZnO-Dots photocatalyst is stable up to seven cycles with the efficiency more than 90%.
Figure 6.
(a) Schematic representation of the plausible photoreduction mechanism of Cr(VI); (b) comparative CV response of the CZnO-Dot and control samples with a 100 ppm Cr(VI) solution in the dark and under sunlight irradiation; and (c) photocatalyst performance of CZnO-Dots up to seven cycles of recycling testing.
Conclusions
The doped CD with inorganic salts can apparently form a newer platform among the existing class of fluorescent optical materials such as QDs and organic dyes. The doped-soluble CD with a higher quantum yield value can provide solutions to many newer emerging and existing problems. The aqueous solutions of red-emitting brightly fluorescent CZnO-Dots with excellent photostability could compete with the already existing commercially available QDs and organic dyes for similar types of applications. Such as related to the deeper penetration ability of the fluorescent probe could directly relate the excellence of instructive image analysis. Beyond these, brightly fluorescent CZnO-Dots do have the potential for use as an excellent photocatalytic material because of their working window, which is situated in the lower wavelength region. Interestingly, further studies could reveal a vast prospective future of these soluble brightly fluorescent CZnO-Dots in the field of photocatalysis and water treatment.
Experimental Section
Materials and Reagents
All chemical reagents were of analytical grade, procured from Merck India, and used without further purification.
Instrumentation
TEM and HRTEM (Tecnai 20 G2 300 kV, STWIN model) were used for analyzing the internal characterization of the CZnO-Dots. The sonicated sample was dropped on a carbon-coated Cu grid (400 mesh size).
Optical spectroscopy: The UV–vis absorption spectra (PerkinElmer Lambda 35 spectrometer) were analyzed at room temperature.
Spectroscopy: XPS measurements were recorded on an ESCA+ omicron nanotechnology Oxford instrument.
Photoluminescence spectrometry (PerkinElmer LS55 spectrophotometer) analyses in aqueous solutions were conducted at 28 ± 1 °C (room temperature).
Fluorescence microscopy: Red-emitting particle images were obtained by fluorescence microscopy (Leica DC200, Leica microscopy system Ltd, CH-9435, Heerbrugg equipped using 561 nm band-pass filters) and supported with an RS Photometrics Sensys camera, KAF1401E G1, for image capturing.
Diffuse reflectance spectroscopy (PerkinElmer Lambda 35 spectrometer): the sample was prepared in sunlight and dark for 24 h, after which it was dried on a water bath, and the dried sample was used for the analysis.
CV: the CV studies (K-Lyte 1.2 model of Kanopy Techno Solution Pvt. Ltd.) were performed using a three-electrode cell in sunlight; a glassy carbon electrode was used as the working electrode, Pt wire and Ag/AgCl (in 0.1 M KCl) electrodes were used as counter and reference electrodes, respectively. The scan rate was 10 mV/sec and the resting potential has been 1.15 V to start the scan to sweep till -0.8V maintaining the scan window between +1.15 V to −0.8V (vs Ag/AgCl) using 0.1M KCl as supporting electrolyte. 100 ppm potassium dichromate as probe was added with the photocatalyst.
Synthesis of CZnO-Dots
CZnO-Dots were synthesized using bougainvillea plant leaves as pristine materials via the green synthesis process. Prior to use, the leaves were cleaned with deionized (DI) water to remove soluble impurities and were dried at ∼30 °C. Next, an extract of leaves was obtained by blending the chopped leaves (∼1 cm-sized pieces) using a hand blender. After this, the extract (∼10 g) was mixed in 100 mL of ethanol/water mixture [(1:1) (V/V)] solution. Zinc acetate by the 10 wt % of the extract was added into the solution and sonicated for another 10 min. The final mixture was then carbonized at 90% power of a domestic microwave oven of 1400 W for 10 min. The mixture was collected and centrifuged at ∼6000 rpm for 30 min. The residual supernatant solution was transferred to a Petri dish and dried on a water bath. The dried powder was named as red color-emitting zinc-oxide-doped CDs (CZnO-Dots). The quantum yield was measured7 for both the samples, as prepared and highly centrifuged sample separated 11 000 rpm centrifuge with reference to Nile blue.58,59 The photographic image was taken in the ethanol:water (1:1) solution as shown in the inset of Figure 2b.12 A control sample without zinc doping was prepared under conditions similar to those for CZnO-Dots from the same plant leaves.
Photocatalytic Activity Measurement
The photocatalytic activity of the CZnO-Dot samples was determined by the photoreduction of Cr(VI) in aqueous dichromate solution under direct sunlight. A stock solution of potassium dichromate containing 100 ppm of Cr(VI) was prepared in DI water for photocatalytic reduction, 1.414 g wt of potassium dichromate was dissolved in 250 mL DI water to make 1000 ppm of Cr(VI), and further concentrations were made by dilution. In a typical process, 150 mg of CZnO-Dots was added in 50 mL of the prepared Cr(VI) solution and was stirred for 30 min in the dark to attain the adsorption/desorption equilibration. The solutions were then exposed to direct sunlight. During the photocatalytic test, a fixed amount of the photoreacted solution was collected at a fixed time interval of 30 min. The collected solution was centrifuged, and the supernatant solution was analyzed for the concentration of Cr(VI), and a pink color was obtained on mixing with the standard DPC assay.60
Acknowledgments
P.K. thanks CSIR (project no. 01(2854)/16/EMRII), and A.B. thanks MNIT, Jaipur, for a doctoral fellowship. S.R.A. thanks DST, New Delhi, for funding, and G. thanks CSIR, New Delhi, for a junior research fellowship. S.K.S. thanks DST (SB/EMEQ-383/2014) and CSIR (01(2854)/16/EMR-II) for funding. S.K.S. thanks Material Research Centre (MRC), MNIT, Jaipur, for material characterization.
Author Contributions
† P.K. and A.B. contributed equally to this work.
The authors declare no competing financial interest.
References
- Sun Y.-P.; Zhou B.; Lin Y.; Wang W.; Fernando K. A. S.; Pathak P.; Meziani M. J.; Harruff B. A.; Wang X.; Wang H.; Luo P. G.; Yang H.; Kose M. E.; Chen B.; Veca L. M.; Xie S.-Y. Quantum-Sized Carbon Dots for Bright and Colorful Photoluminescence. J. Am. Chem. Soc. 2006, 128, 7756–7757. 10.1021/ja062677d. [DOI] [PubMed] [Google Scholar]
- Shen J.; Zhu Y.; Yang X.; Li C. Graphene Quantum Dots: Emergent Nanolights For Bioimaging, Sensors, Catalysis and Photovoltaic Devices. Chem. Commun. 2012, 48, 3686–3699. 10.1039/c2cc00110a. [DOI] [PubMed] [Google Scholar]
- Li X.; Rui M.; Song J.; Shen Z.; Zeng H. Carbon and Graphene Quantum Dots for Optoelectronic and Energy Devices: A Review. Adv. Funct. Mater. 2015, 25 (31), 4929–4947. 10.1002/adfm.201501250. [DOI] [Google Scholar]
- Luo P. G.; Sahu S.; Yang S.-T.; Sonkar S. K.; Wang J.; Wang H.; LeCroy G. E.; Cao L.; Sun Y.-P. Carbon "quantum" dots for optical bioimaging. J. Mater. Chem. B 2013, 1 (16), 2116–2127. 10.1039/c3tb00018d. [DOI] [PubMed] [Google Scholar]
- Luo P. G.; Yang F.; Yang S.-T.; Sonkar S. K.; Yang L.; Broglie J. J.; Liu Y.; Sun Y.-P. Carbon-based quantum dots for fluorescence imaging of cells and tissues. RSC Adv. 2014, 4 (21), 10791–10807. 10.1039/c3ra47683a. [DOI] [Google Scholar]
- Song Y.; Zhu S.; Yang B. Bioimaging Based On Fluorescent Carbon Dots. RSC Adv. 2014, 4, 27184–27200. 10.1039/c3ra47994c. [DOI] [Google Scholar]
- Wang X.; Cao L.; Yang S.-T.; Lu F.; Meziani M. J.; Tian L.; Sun K. W.; Bloodgood M. A.; Sun Y.-P. Bandgap-Like Strong Fluorescence in Functionalized Carbon Nanoparticles. Angew. Chem., Int. Ed. 2010, 122, 5310–5314. 10.1002/anie.201000982. [DOI] [PMC free article] [PubMed] [Google Scholar]
- Yuan X.; Jing Q.; Chen J.; Li L. Photocatalytic Cr(VI) Reduction by Mixed Metal Oxide Derived from ZnAl Layered Double Hydroxide. Appl. Clay Sci. 2017, 143, 168–174. 10.1016/j.clay.2017.03.034. [DOI] [Google Scholar]
- Cao L.; Wang X.; Meziani M. J.; Lu F.; Wang H.; Luo P. G.; Lin Y.; Harruff B. A.; Veca L. M.; Murray D.; Xie S.-Y.; Sun Y.-P. Carbon Dots for Multiphoton Bioimaging. J. Am. Chem. Soc. 2007, 129 (37), 11318–11319. 10.1021/ja073527l. [DOI] [PMC free article] [PubMed] [Google Scholar]
- Gao T.; Wang X.; Yang L.-Y.; He H.; Ba X.-X.; Zhao J.; Jiang F.-L.; Liu Y. Red, Yellow, and Blue Luminescence by Graphene Quantum Dots: Syntheses, Mechanism, and Cellular Imaging. ACS Appl. Mater. Interfaces 2017, 9, 24846–24856. 10.1021/acsami.7b05569. [DOI] [PubMed] [Google Scholar]
- Jiang K.; Sun S.; Zhang L.; Lu Y.; Wu A.; Cai C.; Lin H. Red, Green, and Blue Luminescence by Carbon Dots: Full-Color Emission Tuning and Multicolor Cellular Imaging. Angew. Chem., Int. Ed. 2015, 54, 5360–5363. 10.1002/anie.201501193. [DOI] [PubMed] [Google Scholar]
- Kumawat M. K.; Thakur M.; Gurung R. B.; Srivastava R. Graphene Quantum Dots from Mangifera indica: Application in Near-Infrared Bioimaging and Intracellular Nanothermometry. ACS Sustainable Chem. Eng. 2017, 5, 1382–1391. 10.1021/acssuschemeng.6b01893. [DOI] [Google Scholar]
- Liu Y.; Duan W.; Song W.; Liu J.; Ren C.; Wu J.; Liu D.; Chen H. Red Emission B, N, S-co-Doped Carbon Dots for Colorimetric and Fluorescent Dual Mode Detection of Fe3+ Ions in Complex Biological Fluids and Living Cells. Angew. Chem., Int. Ed. 2017, 9, 12663–12672. 10.1021/acsami.6b15746. [DOI] [PubMed] [Google Scholar]
- Amiot C.; Xu S.; Liang S.; Pan L.; Zhao J. Near-Infrared Fluorescent Materials for Sensing of Biological Targets. Sensors 2008, 8, 3082. 10.3390/s8053082. [DOI] [PMC free article] [PubMed] [Google Scholar]
- Hong G.; Antaris A. L.; Dai H. Near-infrared Fluorophores for Biomedical Imaging. Nat. Biomed. Eng. 2017, 1, 0010. 10.1038/s41551-016-0010. [DOI] [Google Scholar]
- Chen J.; Wei J.-S.; Zhang P.; Niu X.-Q.; Zhao W.; Zhu Z.-Y.; Ding H.; Xiong H.-M. Red-Emissive Carbon Dots for Fingerprints Detection by Spray Method: Coffee Ring Effect and Unquenched Fluorescence in Drying Process. ACS Appl. Mater. Interfaces 2017, 9, 18429–18433. 10.1021/acsami.7b03917. [DOI] [PubMed] [Google Scholar]
- Ding H.; Yu S.-B.; Wei J.-S.; Xiong H.-M. Full-Color Light-Emitting Carbon Dots with a Surface-State-Controlled Luminescence Mechanism. ACS Nano 2016, 10, 484–491. 10.1021/acsnano.5b05406. [DOI] [PubMed] [Google Scholar]
- Ding H.; Ji Y.; Wei J.-S.; Gao Q.-Y.; Zhou Z.-Y.; Xiong H.-M. Facile Synthesis of Red-Emitting Carbon Dots from Pulp-Free Lemon Juice for Bioimaging. J. Mater. Chem. B 2017, 5, 5272–5277. 10.1039/c7tb01130j. [DOI] [PubMed] [Google Scholar]
- Sun S.; Zhang L.; Jiang K.; Wu A.; Lin H. Toward High-Efficient Red Emissive Carbon Dots: Facile Preparation, Unique Properties, and Applications as Multifunctional Theranostic Agents. Chem. Mater. 2016, 28, 8659–8668. 10.1021/acs.chemmater.6b03695. [DOI] [Google Scholar]
- Wang C.; Jiang K.; Wu Q.; Wu J.; Zhang C. Green Synthesis of Red-Emitting Carbon Nanodots as a Novel “Turn-on” Nanothermometer in Living Cells. Chem.—Eur. J. 2016, 22, 14475–14479. 10.1002/chem.201602795. [DOI] [PubMed] [Google Scholar]
- Miao X.; Yan X.; Qu D.; Li D.; Tao F. F.; Sun Z. Red Emissive Sulfur, Nitrogen Codoped Carbon Dots and Their Application in Ion Detection and Theraonostics. ACS Appl. Mater. Interfaces 2017, 9, 18549–18556. 10.1021/acsami.7b04514. [DOI] [PubMed] [Google Scholar]
- Pirkarami A.; Olya M. E. Removal of Dye From Industrial Wastewater with an Emphasis on Improving Economic Efficiency and Degradation Mechanism. J. Saudi Chem. Soc. 2017, 21, S179–S186. 10.1016/j.jscs.2013.12.008. [DOI] [Google Scholar]
- Sun Y.-P.; Wang X.; Lu F.; Cao L.; Meziani M. J.; Luo P. G.; Gu L.; Veca L. M. Doped Carbon Nanoparticles as a New Platform for Highly Photoluminescent Dots. J. Phys. Chem. C 2008, 112, 18295–18298. 10.1021/jp8076485. [DOI] [PMC free article] [PubMed] [Google Scholar]
- Cheng J.; Wang C.-F.; Zhang Y.; Yang S.; Chen S. Zinc ion-doped Carbon Dots with Strong Yellow Photoluminescence. RSC Adv. 2016, 6 (43), 37189–37194. 10.1039/C5RA27808B. [DOI] [Google Scholar]
- Xu Q.; Liu Y.; Su R.; Cai L.; Li B.; Zhang Y.; Zhang L.; Wang Y.; Wang Y.; Li N.; Gong X.; Gu Z.; Chen Y.; Tan Y.; Dong C.; Sreeprasad T. S. Highly Fluorescent Zn-Doped Carbon Dots as Fenton Reaction-Based Bio-Sensors: an Integrative Experimental-Theoretical Consideration. Nanoscale 2016, 8, 17919–17927. 10.1039/c6nr05434j. [DOI] [PubMed] [Google Scholar]
- Son D. I.; Kwon B. W.; Park D. H.; Seo W.-S.; Yi Y.; Angadi B.; Lee C.-L.; Choi W. K. Emissive ZnO–graphene quantum dots for white-light-emitting diodes. Nat. Nanotechnol. 2012, 7, 465. 10.1038/nnano.2012.71. [DOI] [PubMed] [Google Scholar]
- Wang R.; Li G.; Dong Y.; Chi Y.; Chen G. Carbon Quantum Dot-Functionalized Aerogels for NO2 Gas Sensing. Anal. Chem. 2013, 85, 8065–8069. 10.1021/ac401880h. [DOI] [PubMed] [Google Scholar]
- Zhu A.; Qu Q.; Shao X.; Kong B.; Tian Y. Carbon-Dot-Based Dual-Emission Nanohybrid Produces a Ratiometric Fluorescent Sensor for In Vivo Imaging of Cellular Copper Ions. Angew. Chem. 2012, 124, 7297–7301. 10.1002/ange.201109089. [DOI] [PubMed] [Google Scholar]
- Liu S.; Tian J.; Wang L.; Zhang Y.; Qin X.; Luo Y.; Asiri A. M.; Al-Youbi A. O.; Sun X. Hydrothermal Treatment of Grass: A Low-Cost, Green Route to Nitrogen-Doped, Carbon-Rich, Photoluminescent Polymer Nanodots as an Effective Fluorescent Sensing Platform for Label-Free Detection of Cu(II) Ions. Adv. Mater. 2012, 24, 2037–2041. 10.1002/adma.201200164. [DOI] [PubMed] [Google Scholar]
- Zhang J.; Yu S.-H. Carbon Dots: Large-Scale Synthesis, Sensing and Bioimaging. Mater. Today 2016, 19, 382–393. 10.1016/j.mattod.2015.11.008. [DOI] [Google Scholar]
- Kong B.; Zhu A.; Ding C.; Zhao X.; Li B.; Tian Y. Carbon Dot-Based Inorganic–Organic Nanosystem for Two-Photon Imaging and Biosensing of pH Variation in Living Cells and Tissues. Adv. Mater. 2012, 24, 5844–5848. 10.1002/adma.201202599. [DOI] [PubMed] [Google Scholar]
- Baig M. M. F.; Chen Y.-C. Bright Carbon Dots as Fluorescence Sensing Agents for Bacteria and Curcumin. J. Colloid Interface Sci. 2017, 501, 341–349. 10.1016/j.jcis.2017.04.045. [DOI] [PubMed] [Google Scholar]
- Singh A.; Khare P.; Verma S.; Bhati A.; Sonker A. K.; Tripathi K. M.; Sonkar S. K. Pollutant Soot for Pollutant Dye Degradation: Soluble Graphene Nanosheets for Visible Light Induced Photodegradation of Methylene Blue. ACS Sustain. Chem. Eng. 2017, 5, 8860–8869. 10.1021/acssuschemeng.7b01645. [DOI] [Google Scholar]
- Babar D. G.; Sonkar S. K.; Tripathi K. M.; Sarkar S. P2O5 Assisted Green Synthesis of Multicolor Fluorescent Water Soluble Carbon Dots. J. Nanosci. Nanotechnol. 2014, 14, 2334–2342. 10.1166/jnn.2014.8487. [DOI] [PubMed] [Google Scholar]
- Saud P. S.; Pant B.; Alam A.-M.; Ghouri Z. K.; Park M.; Kim H.-Y. Carbon Quantum Dots Anchored TiO2 Nanofibers: Effective Photocatalyst for Waste Water Treatment. Ceram. Int. 2015, 41, 11953–11959. 10.1016/j.ceramint.2015.06.007. [DOI] [Google Scholar]
- Cao L.; Wang X.; Meziani M. J.; Lu F.; Wang H.; Luo P. G.; Lin Y.; Harruff B. A.; Veca L. M.; Murray D.; Xie S.-Y.; Sun Y-P. Carbon Dots for Multiphoton Bioimaging. J. Am. Chem. Soc. 2007, 129 (37), 11318–11319. 10.1021/ja073527l. [DOI] [PMC free article] [PubMed] [Google Scholar]
- Bhati A.; Singh A.; Tripathi K. M.; Sonkar S. K. Sunlight-Induced Photochemical Degradation of Methylene Blue by Water-Soluble Carbon Nanorods. Int. J. Photoenergy 2016, 2016, 2583821. 10.1155/2016/2583821. [DOI] [Google Scholar]
- Khare P.; Singh A.; Verma S.; Bhati A.; Sonker A. K.; Tripathi K. M.; Sonkar S. K. Sunlight-Induced Selective Photocatalytic Degradation of Methylene Blue in Bacterial Culture by Pollutant Soot Derived Nontoxic Graphene Nanosheets. ACS Sustain. Chem. Eng. 2018, 6, 579–589. 10.1021/acssuschemeng.7b02929. [DOI] [Google Scholar]
- Mishra Y. K.; Modi G.; Cretu V.; Postica V.; Lupan O.; Reimer T.; Paulowicz I.; Hrkac V.; Benecke W.; Kienle L.; Adelung R. Direct Growth of Freestanding ZnO Tetrapod Networks for Multifunctional Applications in Photocatalysis, UV Photodetection, and Gas Sensing. ACS Appl. Mater. Interfaces 2015, 7, 14303–14316. 10.1021/acsami.5b02816. [DOI] [PubMed] [Google Scholar]
- Wen T.; Fan Q.; Tan X.; Chen Y.; Chen C.; Xu A.; Wang X. A Core-Shell Structure of Polyaniline Coated Protonic Titanate Nanobelt Composites for Both Cr(VI) and Humic Acid Removal. Polym. Chem. 2016, 7, 785–794. 10.1039/c5py01721a. [DOI] [Google Scholar]
- Zou Y.; Wang X.; Khan A.; Wang P.; Liu Y.; Alsaedi A.; Hayat T.; Wang X. Environmental Remediation and Application of Nanoscale Zero-Valent Iron and Its Composites for the Removal of Heavy Metal Ions: A Review. Environ. Sci. Technol. 2016, 50, 7290–7304. 10.1021/acs.est.6b01897. [DOI] [PubMed] [Google Scholar]
- Santhosh C.; Nivetha R.; Kollu P.; Srivastava V.; Sillanpää M.; Grace A. N.; Bhatnagar A. Removal Of Cationic And Anionic Heavy Metals From Water By 1D And 2D-Carbon Structures Decorated With Magnetic Nanoparticles. Sci. Rep. 2017, 7, 14107. 10.1038/s41598-017-14461-2. [DOI] [PMC free article] [PubMed] [Google Scholar]
- Khare P.; Yadav A.; Ramkumar J.; Verma N. Microchannel-Embedded Metal–Carbon–Polymer Nanocomposite As A Novel Support For Chitosan For Efficient Removal Of Hexavalent Chromium From Water Under Dynamic Conditions. Chem. Eng. J. 2016, 293, 44–54. 10.1016/j.cej.2016.02.049. [DOI] [Google Scholar]
- Wen T.; Wang J.; Yu S.; Chen Z.; Hayat T.; Wang X. Magnetic Porous Carbonaceous Material Produced from Tea Waste for Efficient Removal of As(V), Cr(VI), Humic Acid, and Dyes. ACS Sustain. Chem. Eng. 2017, 5, 4371–4380. 10.1021/acssuschemeng.7b00418. [DOI] [Google Scholar]
- Tripathi K. M.; Bhati A.; Singh A.; Sonker A. K.; Sarkar S.; Sonkar S. K. Sustainable Changes in the Contents of Metallic Micronutrients in First Generation Gram Seeds Imposed by Carbon Nano-onions: Life Cycle Seed to Seed Study. ACS Sustain. Chem. Eng. 2017, 5, 2906–2916. 10.1021/acssuschemeng.6b01937. [DOI] [Google Scholar]
- Tripathi K. M.; Singh A.; Bhati A.; Sarkar S.; Sonkar S. K. Sustainable Feasibility of the Environmental Pollutant Soot to Few-Layer Photoluminescent Graphene Nanosheets for Multifunctional Applications. ACS Sustain. Chem. Eng. 2016, 4, 6399–6408. 10.1021/acssuschemeng.6b01045. [DOI] [Google Scholar]
- Tripathi K. M.; Bhati A.; Singh A.; Gupta N. R.; Verma S.; Sarkar S.; Sonkar S. K. From The Traditional Way Of Pyrolysis To Tunable Photoluminescent Water Soluble Carbon Nano-Onions For Cells Imaging And Selective Sensing Of Glucose. RSC Adv. 2016, 6, 37319–37340. 10.1039/C6RA04030F. [DOI] [Google Scholar]
- Yang C.; Zhu S.; Li Z.; Li Z.; Chen C.; Sun L.; Tang W.; Liu R.; Sun Y.; Yu M. Nitrogen-doped Carbon Dots with Excitation-Independent Long-Wavelength Emission Produced by a Room-Temperature Reaction. Chem. Commun. 2016, 52 (80), 11912–11914. 10.1039/C6CC06673A. [DOI] [PubMed] [Google Scholar]
- Ke C.-C.; Yang Y.-C.; Tseng W.-L. Synthesis of Blue-, Green-, Yellow-, and Red-Emitting Graphene-Quantum-Dot-Based Nanomaterials with Excitation-Independent Emission. Part. Part. Syst. Char. 2016, 33, 132–139. 10.1002/ppsc.201500196. [DOI] [Google Scholar]
- Karthik P.; Vinoth R.; Selvam P.; Balaraman E.; Navaneethan M.; Hayakawa Y.; Neppolian B. A Visible-Light Active Catechol-Metal Oxide Carbonaceous Polymeric Material for Enhanced Photocatalytic Activity. J. Mater. Chem. A 2017, 5, 384–396. 10.1039/c6ta07685h. [DOI] [Google Scholar]
- Neppolian B.; Bruno A.; Bianchi C. L.; Ashokkumar M. Graphene oxide based Pt–TiO2 photocatalyst: Ultrasound Assisted Synthesis, Characterization and Catalytic Efficiency. Ultrason. Sonochem. 2012, 19, 9–15. 10.1016/j.ultsonch.2011.05.018. [DOI] [PubMed] [Google Scholar]
- Chenthamarakshan C. R.; Rajeshwar K.; Wolfrum E. J. Heterogeneous Photocatalytic Reduction of Cr(VI) in UV-Irradiated Titania Suspensions: Effect of Protons, Ammonium Ions, and Other Interfacial Aspects. Langmuir 2000, 16, 2715–2721. 10.1021/la9911483. [DOI] [Google Scholar]
- Pan X.; Yi Z. Graphene Oxide Regulated Tin Oxide Nanostructures: Engineering Composition, Morphology, Band Structure, and Photocatalytic Properties. ACS Appl. Mater. Interfaces 2015, 7, 27167–27175. 10.1021/acsami.5b07858. [DOI] [PubMed] [Google Scholar]
- Zhao Y.; Zhang Y.; Liu A.; Wei Z.; Liu S. Construction of Three-Dimensional Hemin-Functionalized Graphene Hydrogel with High Mechanical Stability and Adsorption Capacity for Enhancing Photodegradation of Methylene Blue. ACS Appl. Mater. Interfaces 2017, 9, 4006–4014. 10.1021/acsami.6b10959. [DOI] [PubMed] [Google Scholar]
- Umrao S.; Sharma P.; Bansal A.; Sinha R.; Singh R. K.; Srivastava A. Multi-layered graphene quantum dots derived photodegradation mechanism of methylene blue. RSC Adv. 2015, 5, 51790–51798. 10.1039/c5ra07310c. [DOI] [Google Scholar]
- Yu H.; Irie H.; Hashimoto K. Conduction Band Energy Level Control of Titanium Dioxide: Toward an Efficient Visible-Light-Sensitive Photocatalyst. J. Am. Chem. Soc. 2010, 132, 6898–6899. 10.1021/ja101714s. [DOI] [PubMed] [Google Scholar]
- Wu J.; Liu B.; Ren Z.; Ni M.; Li C.; Gong Y.; Qin W.; Huang Y.; Sun C. Q.; Liu X. CuS/RGO Hybrid Photocatalyst for Full Solar Spectrum Photoreduction From UV/Vis to Near-Infrared Light. J. Colloid Interface Sci. 2018, 517, 80–85. 10.1016/j.jcis.2017.09.042. [DOI] [PubMed] [Google Scholar]
- Resch-Genger U.; Rurack K. Determination of the photoluminescence quantum yield of dilute dye solutions (IUPAC Technical Report). Pure Appl. Chem. 2013, 85, 2005–2013. 10.1351/pac-rep-12-03-03. [DOI] [Google Scholar]
- Sens R.; Drexhage K. H. Fluorescence Quantum Yield of Oxazine and Carbazine Laser Dyes. J. Lumin. 1981, 24–25, 709–712. 10.1016/0022-2313(81)90075-2. [DOI] [Google Scholar]
- Verma N. K.; Khare P.; Verma N. Synthesis Of Iron-Doped Resorcinol Formaldehyde-Based Aerogels For The Removal Of Cr(VI) From Water. Green Process. Synth. 2015, 4, 37–46. 10.1515/gps-2014-0072. [DOI] [Google Scholar]


