Abstract

Pure and Tb-doped nanocrystalline KY3F10 specimens were synthesized by coprecipitation, and portions of the samples underwent further heat treatment at 600 °C in a fluorinated atmosphere. Synchrotron X-ray diffraction patterns acquired at 30 keV allowed to determine both long- and short-range ordered structures by Rietveld and pair distribution function (PDF) analyses, respectively. PDF examination of the as-synthesized sample allowed to discern a slight deviation from the basic cubic building unit because the Y–F bond lengths could be explained in S.G. I4/mmm with cell parameters a = 8.1520(9) Å and c = 11.5876(29) Å, whereas Rietveld analysis could equally well fit both the cubic and tetragonal descriptions for the heat-treated specimens. Also, PDF revealed that the as-synthesized sample exhibited less structural coherence than the heat-treated one.
Introduction
Luminescent nanoparticles have been intensively studied recently due to their potential applications in high-performance magnets, luminescent devices, catalysts, photovoltaics, radiation detectors, and solid-state dosimeters, among other functional materials.1−3
In previous works,4−6 the synthesis of KY3F10 nanocrystals—doped with rare-earth ions—from coprecipitation in aqueous solutions of NH4HF2 was optimized and studied in detail. Studies of nanocrystalline KY3F10 doped with Tb (Tb:KY3F10) have shown satisfactory thermoluminescence properties, qualifying this material to be used in high-dose radiation dosimetry.4 The analysis of Tb:KY3F10 nanocrystals structure over multiple length scales is of utmost importance because their electronic structure, surface energy, and chemical reactivity are directly related to the crystal structure. Besides, structural effects can occur in the nanoparticles due to their small sizes because surface driving forces can induce an additional pressure, causing disorder and fluctuations in the crystalline field as well as contraction or expansion in the unit cell7 and even changes in the crystalline structure.8,9
Another interesting aspect of this compound—not being the main subject of this work though—is its electrical conductivity, especially at high temperatures.10 Its conduction mechanism has been described in terms of anion Frenkel defects to explain the fluorine vacancy mobility.10,11
Arguably, these detailed structural variables can only be procured by X-ray or neutron diffraction techniques.12 In this work, we have applied the so-called pair distribution function (PDF) analysis13 in combination with Rietveld method to probe both the average and local structure of Tb:KY3F10. This approach allows us to first study the average structure (by Rietveld method) and then compare it with the information acquired from a short-range structural probe (PDF analysis). The PDF is more sensitive to local distortions of the structure and very sensitive to the range of structural coherence in the material. The combination of these techniques allows us to obtain a very detailed picture of the structure of Tb:KY3F10.
In this study, because the luminescence efficiency improves after heat treatment,5,14−16 two batches were analyzed: as synthesized (AS) and heat treated (HT). Pure and Tb-doped KY3F10 were investigated in parallel, probing both local and average structures to verify if partial substitution by Tb and synthesis route had any influence in the crystalline order.
Methods
The average crystal structure was first probed through Rietveld refinement of the powder diffraction data. However, as it is well known, Rietveld analysis is based solely on the Bragg peaks, so if the sample being analyzed has very broadened peaks, as for nanocrystalline materials for example, or there is an important contribution of diffuse scattering to the diffraction profile, Rietveld analysis may not be the best choice. To overcome such situation, a method called pair distribution function (PDF), first described by Zernike and Prins,13 can be applied. This kind of analysis has proven to be a powerful tool to study the atomic arrangement of nanocrystals and materials that exhibit substantial disordering.
PDF analysis permits the simultaneous analysis of Bragg peaks and diffuse scattering. To achieve this, the information contained in the whole reciprocal space, over a wide range of the scattering vector Q⃗, must be extracted and therefore a Fourier transform of the diffraction data needs to be performed for the obtention of the pair distribution function G(r).17
Crystal Structure Description
The KY3F10 structure under ambient conditions presents a face-centered cubic crystal structure (fluorite-type structure) belonging to the Fm3̅m space group, with a = 11.553(1) Å.18 The structure description is shown in Table 1.
Table 1. Distribution of KY3F10 Atoms in Space Group Fm3̅m (No. 225)a,b.
| name | species | mW | x | y | z |
|---|---|---|---|---|---|
| Y1 | Y3+ | 24e | xY1 | 0 | 0 |
| F1 | F– | 32f | xF1 | xF1 | xF1 |
| F2 | F– | 48i | 1/2 | yF2 | yF2 |
| K | K+ | 8c | 1/4 | 1/4 | 1/4 |
Z = 8.
Every site is represented by its multiplicity (m) and Wyckoff position (W).
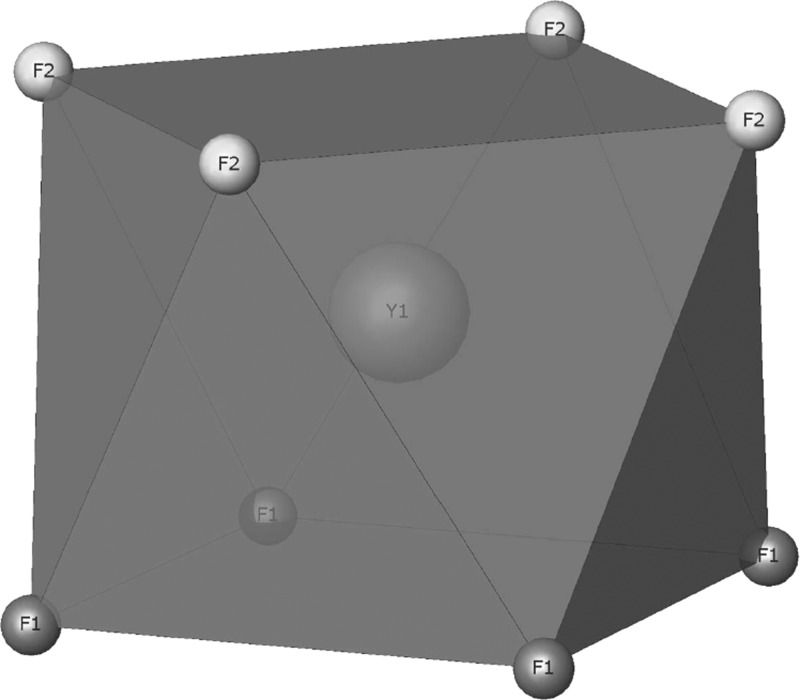
The structure has been traditionally described as a 2 × 2 × 2 fluorite superstructure, with two ionic groups [KY3F8]2+ and [KY3F12]2– alternating along the three crystallographic directions.10,11,18,19 However, as pointed out in refs (18, 20), and (21), the basic unit of the structure is a square antiprism composed of a central atom of yttrium linked to two squares of fluorine atoms, one of them containing four F1 atoms and the other containing four F2 atoms (Figure 1).
Figure 1.
Basic unit of the structure. A central Y atom linked to eight F atoms. The coordination polyhedron is a square antiprism.
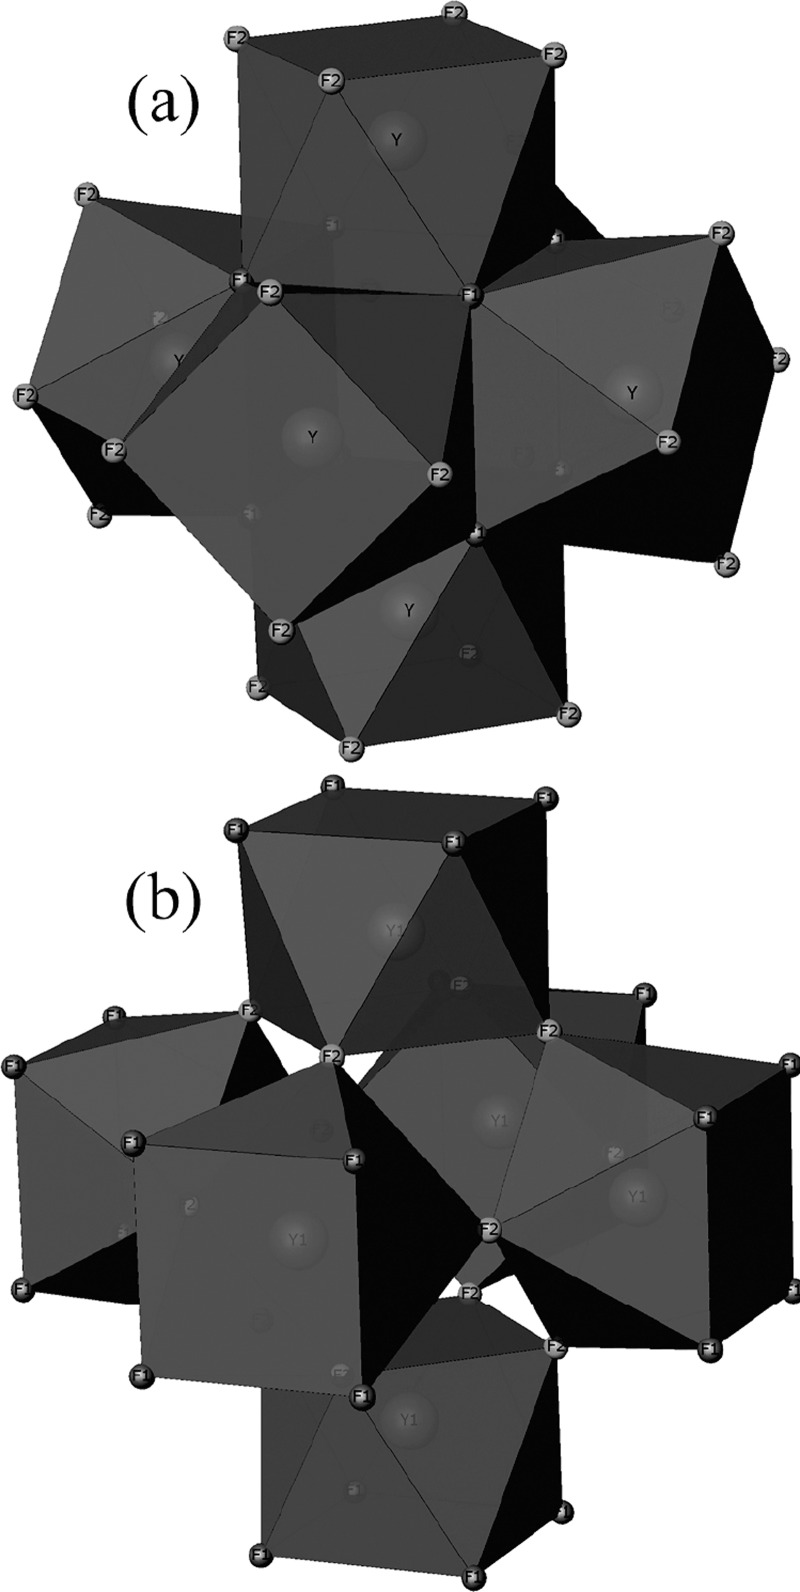
The basic cluster assemblage is composed of six antiprisms. However, there are two alternative ways of describing the arrangement, centered around either an empty cube or an empty cuboctahedron (see Figure 2). In either case, the basic formula of the assemblage is [Y6F20]2–.18,20
Figure 2.
Two alternative views of the basic assemblages [Y6F20]2– composed of six cubic antiprisms: (a) around an empty cube formed by eight F1 atoms and (b) around an empty cuboctahedron formed by 12 F2 atoms. Potassium atoms are omitted for clarity.
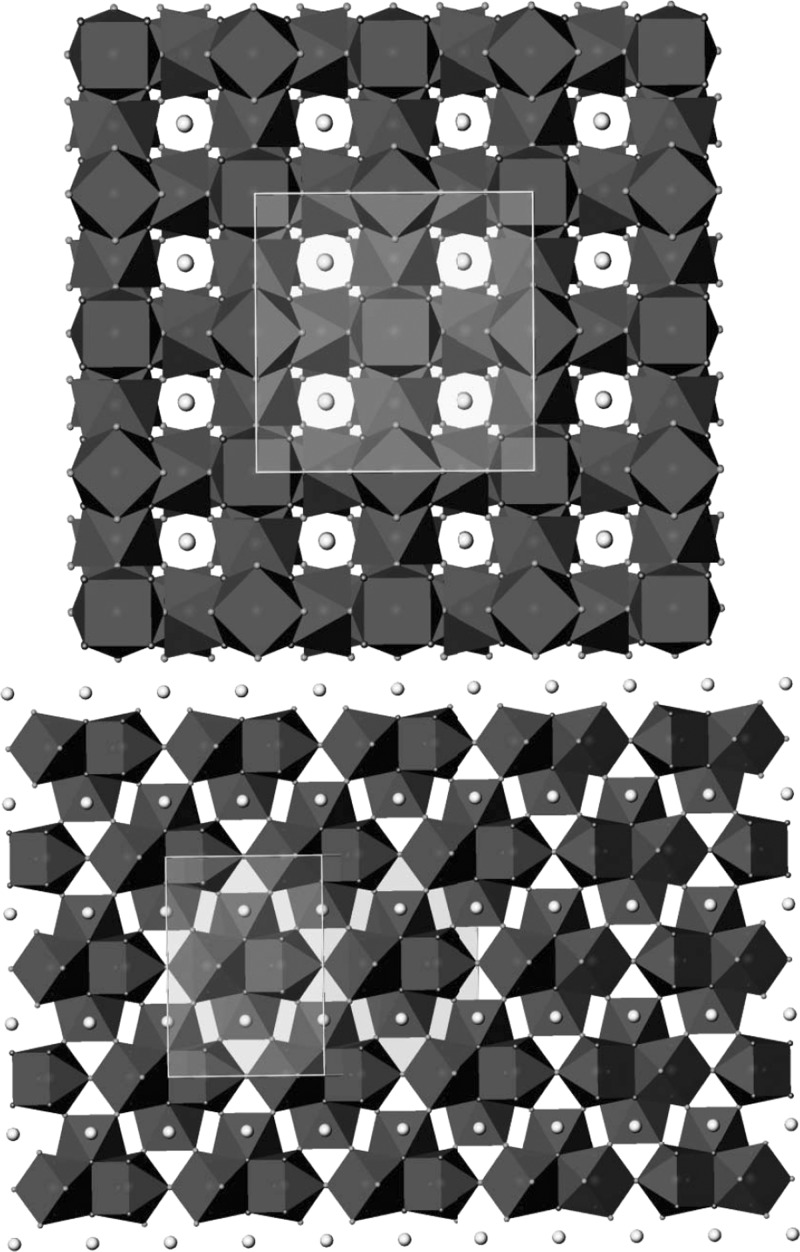
The antiprisms around empty cubes share edges, and those around empty octahedra share corners. The fluorine atoms link contiguous antiprisms; F1 is shared by three, whereas F2 is shared by two, as can be seen in Figure 2. The empty cubes are located on the vertices and the middle of the faces of the unit cell, whereas the empty cuboctahedra are situated at the center of the unit cell and on the middle of its edges. The three-dimensional representation of the structure can be described as layers of [Y6F20]2– empty cube-centered assemblages stacked along a, b, and c axes (see Figure 3 (top)). The potassium atoms are distributed along channels running parallel to the a, b, and c axes. See Figure 3 (bottom) for the global structure.
Figure 3.
KY3F10 global structure along [1 0 0] on top and along [1 1 0] at the bottom part. The connections between the [Y6F20]2– assemblages are shown with the unit cell highlighted inside the rectangles.
Results and Discussion
Previously, emission properties studies depending on the dopant combined with X-ray diffraction (XRD) analysis of rare-earth-doped KY3F10 were carried out as described elsewhere.5,6 It was shown using Rietveld analysis that crystallite sizes remain around 8–14 nm after thermal treatments and that luminescence efficiency strongly increases, reaching up to 20%. Such behavior comes from the ion distribution within the nanoparticle, which plays a very important role in the luminescence dynamics. The crystallite size growth induces an ion-concentration gradient toward the surface of the nanoparticle, which is responsible for the increase in the luminescence efficiency. Besides, when doped with Tb (Tb:KY3F10), the material also exhibits interesting thermoluminescence properties, allowing its use in high-dose radiation dosimetry, as discussed elsewhere.4 Such properties may come from local and average structure features that need to be investigated in detail. So first, the average structure was studied using Rietveld analysis. As a reference, the values from inorganic crystal structure database crystallographic information file (ICSD CIF) File No. 40964318 were used. Cell parameters (a), atomic positions, and isotropic atomic displacement parameters (Uiso) were refined.
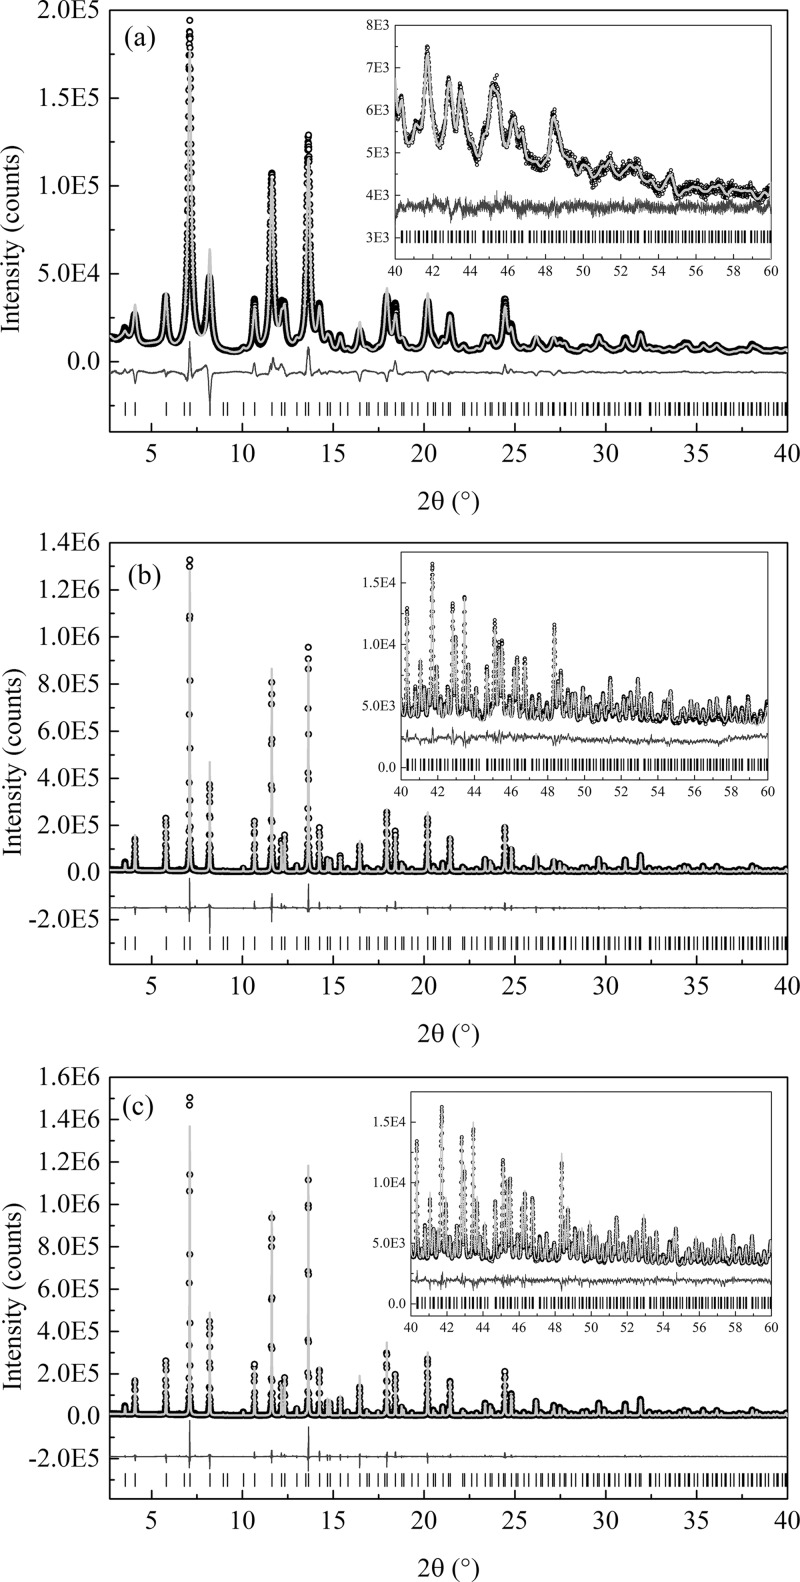
The model was refined for the cubic space group Fm3̅m, according to the atomic distribution described in Table 1. Three samples were analyzed: Tb:KY3F10 as synthesized, Tb:KY3F10 heat treated, and a pure KY3F10 heat treated. The pure sample was analyzed for comparison with the doped samples, to probe possible structural distortions stemming from the dopant. The results are summarized in Table 2, and the fits can be visualized in Figure 4.
Table 2. Rietveld Refinements Results for Tb-Doped and Pure Specimens, As Synthesized (AS) and Heat Treated (HT)a,b.
| Tb:AS | Tb:HT | pure:HT | CIF reference | |
|---|---|---|---|---|
| lattice (a) | 11.5424 (4) | 11.5475 (1) | 11.5465 (3) | 11.553 (1) |
| K (Uiso) | 0.03009 (95) | 0.01979 (37) | 0.01983 (34) | 0.0202 (7) |
| Y (Uiso) | 0.00567 (18) | 0.00404 (5) | 0.00371 (5) | 0.0029 (3) |
| F1 (Uiso) | 0.01795 (84) | 0.00815 (41) | 0.00667 (40) | 0.0078 (7) |
| F2 (Uiso) | 0.00898 (69) | 0.00929 (36) | 0.00895 (37) | 0.0170 (10) |
| xY1 | 0.16319 (16) | 0.16550 (9) | 0.16560 (9) | 0.1657 (2) |
| xF1 | 0.24040 (8) | 0.24048 (3) | 0.24041 (3) | 0.2403 (6) |
| yF2 | 0.11566 (23) | 0.11207 (9) | 0.11191 (9) | 0.1118 (2) |
| Rwp | 6.6 | 7.4 | 7.8 |
The lattice constants are expressed in angstrom; the Debye–Waller factors, in angstrom; and the Rietveld statistics factors, in percent.
The values are compared with the ones of ICSD CIF file No. 409643.18
Figure 4.
Experimental (symbols) and calculated (black solid line) synchrotron powder diffraction profiles. The profiles were calculated with Rietveld refinement for the (a) as-synthesized Tb:KY3F10, (b) heat-treated Tb:KY3F10, and (c) pure KY3F10 samples. Below the profiles (gray solid line) is the difference between calculated and experimental values. The position of the Bragg peaks is given by the vertical bars at the bottom of the plots.
In Figure 4, it can be seen that the cubic structure gives a good fit to the experimental data. Table 3 shows that almost all values are comparable to that of the reference ICSD CIF file No. 409643.18 For the doped samples, Uiso values for Y and F1 are higher when compared to the values for the pure heat-treated sample and for the CIF file. These higher Uiso values can be explained by the presence of the dopant Tb, which occupies Y position. Because Tb has an ionic radius slightly bigger than Y (1.040 Å for Tb and 1.019 Å for Y22), one should expect Uiso to increase. Later, Tb was included in the model; however, no significant improvement in the Rietveld refinement was observed, which implies that the effect of the dopant Tb on the average structure can be neglected.
Table 3. Distribution of KY3F10 Atoms in Space Group I4/mmm (No. 139)a,b.
| name | species | mW | x | y | z |
|---|---|---|---|---|---|
| Y1 | Y3+ | 8h | xY1 | xY1 | 0 |
| Y2 | Y3+ | 4e | 0 | 0 | zY2 |
| F1 | F– | 16n | xF1 | 0 | zF1 |
| F2 | F– | 16m | xF2 | xF2 | zF2 |
| F3 | F– | 8i | xF3 | 0 | 0 |
| K | K+ | 4d | 1/2 | 0 | 3/4 |
Z = 4.
Every site is represented by its multiplicity (m) and Wyckoff position (W).
Local Structure
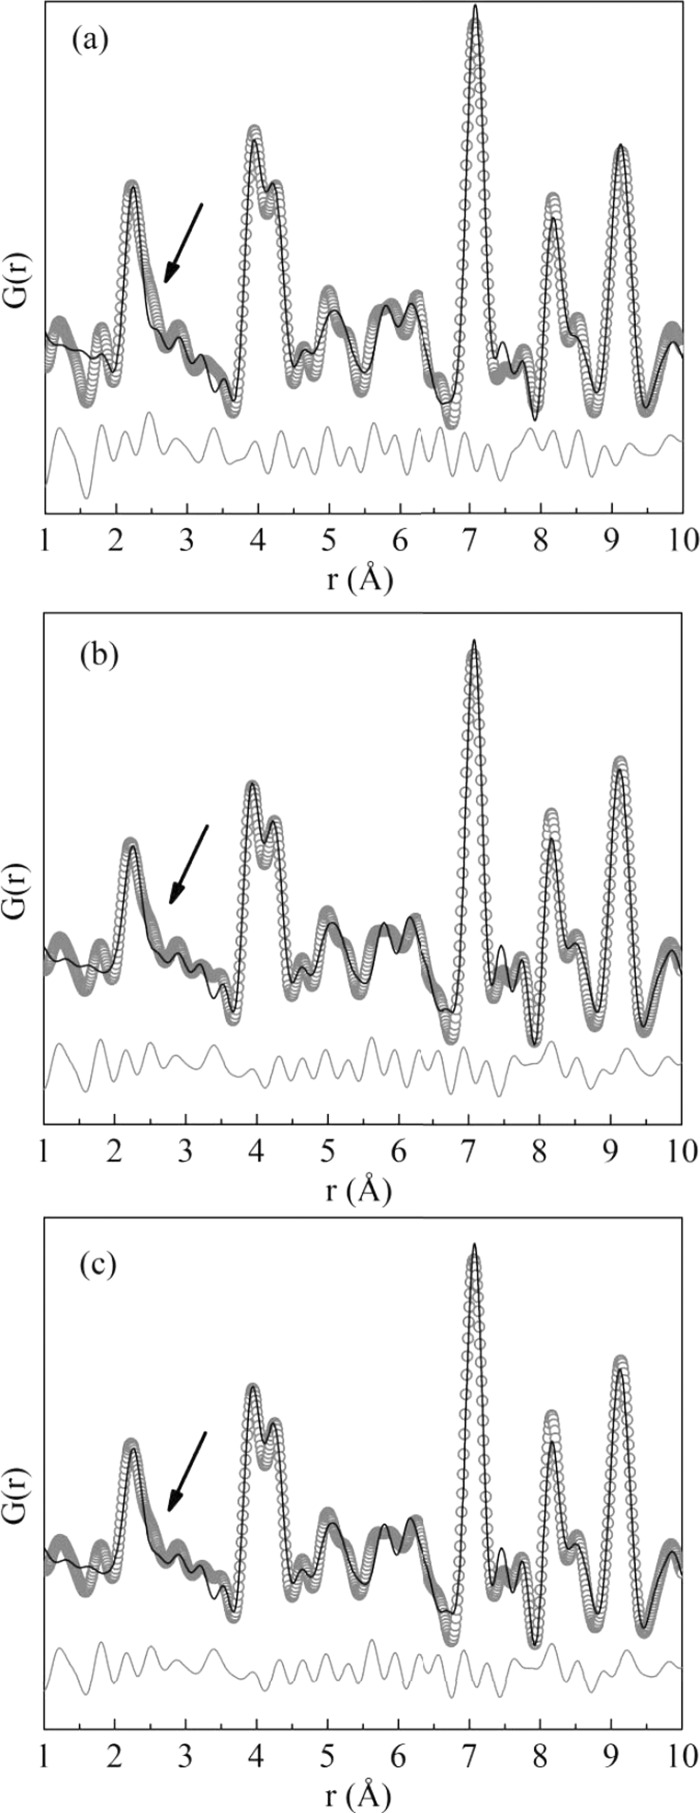
Pair distribution function (PDF) analysis is particularly sensitive to distortions that might occur locally. The local structure probed by the experimental PDF shows that the average structure does not reflect the local ordering. A “split” in the first PDF peak is observed, which is not reproduced by the average structure (pointed out by the arrows in Figure 5). Since the PDF plots were obtained using a Qmax of 20 Å−1, this permits us to discard that the observed split might be due to a nonreliable G(r) attainment, as ripples effect from the termination of the data at finite Q. Also, NIST Si 640d standard PDF data were modeled up to 500 Å to obtain Qdamp and Qbroad (parameters that describe experimental resolution effects). The PDF data modeling for the standard leads to values of 0.002857 and 0.002897 for Qdamp and Qbroad, respectively. In the PDF modeling, cell parameters, isotropic atomic displacement parameters, atomic positions, and correlated atomic motion effects (in PDFgui,23 these effects can be modeled through delta2 parameter) were refined.
Figure 5.
Experimental (symbols) and calculated (black solid line) atomic pair distribution functions G(r) of synchrotron powder diffraction data. Below the functions (gray solid line) is the difference between calculated and experimental values. PDF modeling was performed through PDFgui23 using the cubic structure for (a) Tb:KY3F10 as-synthesized, (b) Tb:KY3F10 heat-treated, and (c) pure KY3F10 heat-treated samples. The arrows indicate a mismatch in the first PDF peak.
The split clearly indicates the existence of at least one additional yttrium–fluorine interatomic distance, which can be observed for the three samples. As performed in the average structure analysis, a pure KY3F10 heat-treated sample was analyzed because one could state that the Tb doping could be locally distorting the structure. However, as can be seen in Figure 5, the pure sample also presents the splitting, which permit us to rule out the fact that the doping process is causing a local distortion.
This observation, the deviation from the reported average structure, is therefore an intrinsic characteristic of the crystal structure that is not affected by the doping. It should be mentioned that it might be relevant to understand the conductivity properties of the undoped sample and other applications in the doped compounds. This anisotropy might affect the distribution of Frenkel pairs, which ultimately explains the conduction mechanism of KY3F10 as reported by Ayala et al.10
To fit the deviations from the ideal cubic symmetry observed, compatible space groups were sought. On the basis of the Bilbao Crystallographic Server (www.cryst.ehu.es),24 the MAXSUB tool was used to find possible compatible lower-symmetry space groups. Only two noncubic space groups were found: I4/mmm (No. 139) and R3̅m (No. 166). Both symmetries were tested, but the rhombohedral was discarded because it did not improve the fitting. Therefore, the tetragonal space group was kept for modeling the local deviations. This new tetragonal structural description implies only subtle changes. Global features still hold, and only local variations of symmetry and ion redistributions in different sites must be considered (see Table 3). Here, it is worth to mention that a tetragonal cell for Eu-doped KY3F10 has been recently described.3
This tetragonal symmetry involves a different
unit cell definition;
the c axis remains the same, but  and
and  are reformulated according to
  and
and  , respectively.
Also, this implies that the new at parameter
is equal to  . The atomic distribution can be found in Table 3.
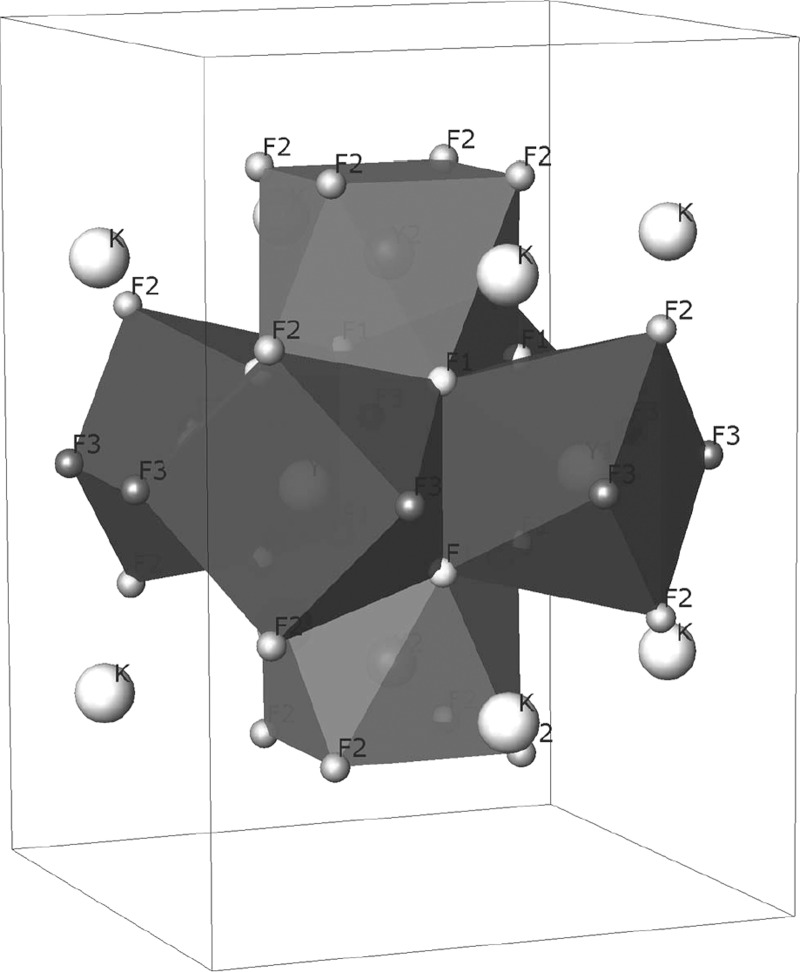
Basically, now yttrium atoms are split in two crystallographic sites and fluorine atoms are accommodated in three sites. Potassium atoms remain in a unique position with fixed coordinates. The local distribution of the antiprisms comprising the assemblages can be appreciated in Figure 6. Now the coordination polyhedra are pictured in different grayscales to distinguish the two sites for yttrium. Also, the three types of fluorine sites are pictured differently. Y1 yttrium atoms are linked to four F1, two F2, and two F3 atoms, whereas Y2 yttrium atoms are linked to four F1 and four F3 atoms. A consequence of this new description is that the assemblages exhibit a slight distortion. In Figure 6, the geometry in relation to the unit cell can be appreciated. Another outcome of this change of symmetry consists in a new distribution of Y–F distances. In the cubic case, there were two distances, whereas in the tetragonal description, there are five distances: Y1 linked to F1, F2, and F3, and Y2 linked to F1 and F3. The potassium atoms remain in fixed positions.
Figure 6.
Assemblage of [Y6F20]2– inside the tetragonal cell. Antiprisms with different inner yttrium atoms are colored differently: Y1, dark gray; Y2, light gray.
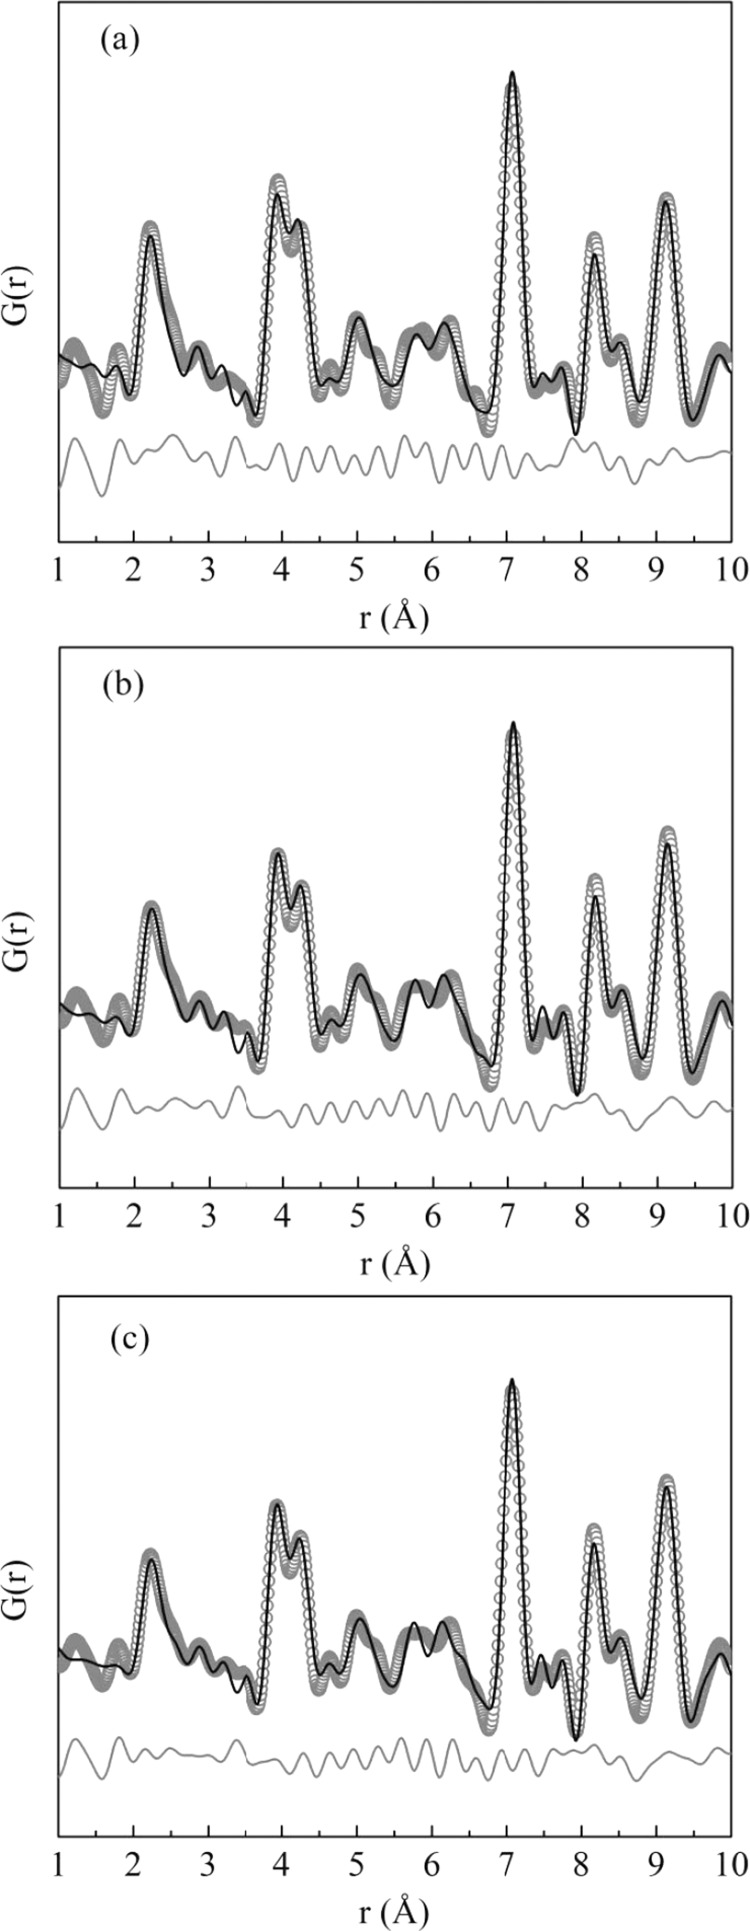
Consequently, the experimental PDF was modeled again considering the tetragonal structure. As can be seen in Figure 7, the split in the first PDF peak was better modeled for all samples and the refinement improved within the first 10 Å range.
Figure 7.
Experimental (symbols) and calculated (black solid line) atomic pair distribution functions G(r) of synchrotron powder diffraction data. Below the functions (gray solid line) is the difference between calculated and experimental. The PDF modeling was performed through PDFgui23 using the tetragonal structure for (a) Tb:KY3F10 as-synthesized, (b) Tb:KY3F10 heat-treated, and (c) pure KY3F10 heat-treated samples.
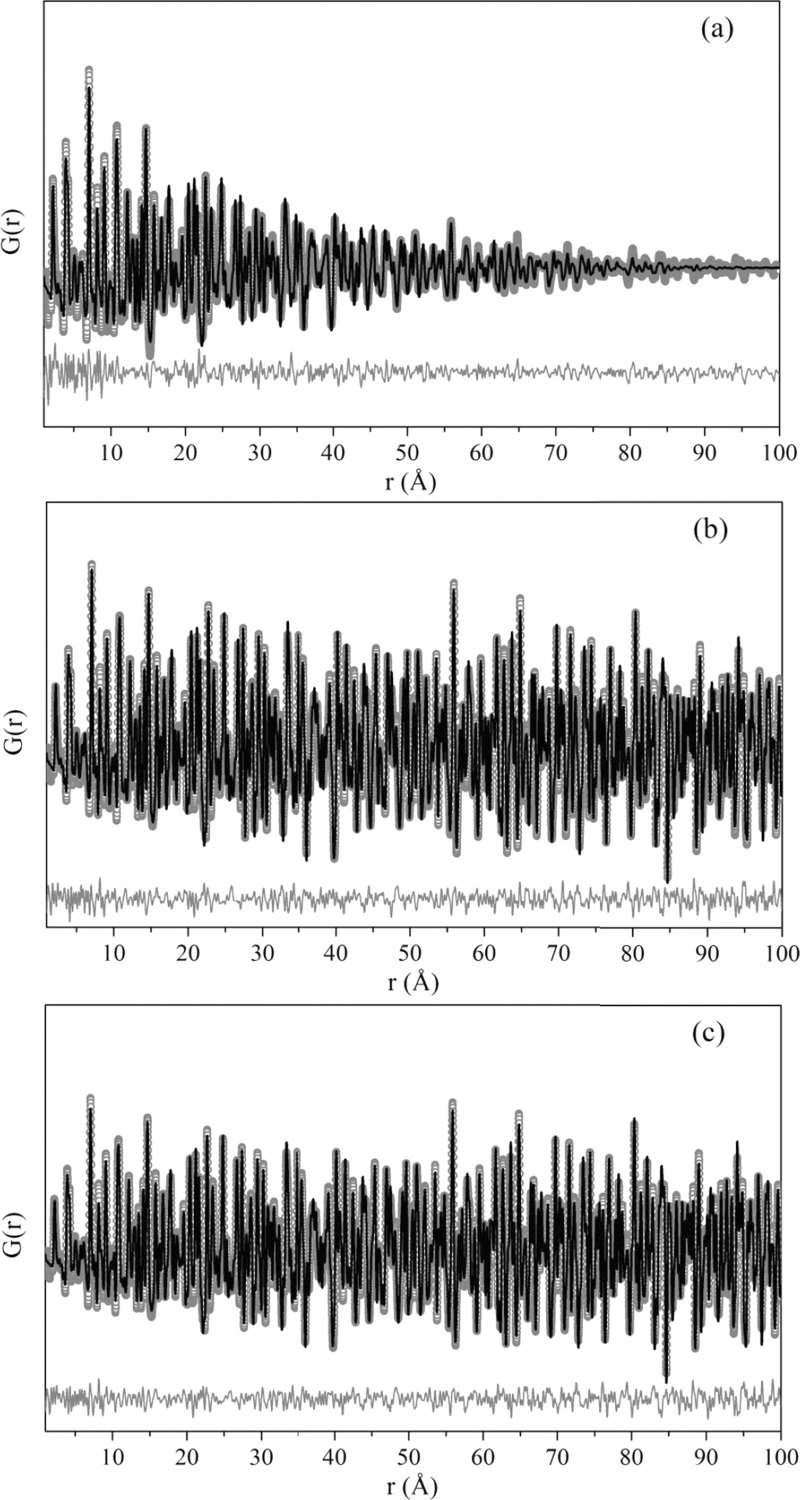
Larger r ranges of the experimental PDF were also successfully fitted using the tetragonal symmetry; in Figure 8 it is possible to see the experimental PDF fitted up to 100 Å.
Figure 8.
Experimental (symbols) and calculated (black solid line) atomic pair distribution functions G(r) of synchrotron powder diffraction data fitted up to 100 Å. Below the functions (gray solid line) is the difference between calculated and experimental values. The PDF modeling was performed through PDFgui23 using the tetragonal structure for (a) Tb:KY3F10 as-synthesized, (b) Tb:KY3F10 heat-treated, (c) pure KY3F10 heat-treated samples.
The unit cell parameters and Rwp of the PDF refinements fitted in different ranges, from 10 to 100 Å, are presented in Tables 4–6.
Table 4. Unit Cell Parameters (Å) and Rwp (%) Values of the PDF Refinements in Ranges (Å) up to 100 Å, Using Cubic and Tetragonal Symmetry for the As-Synthesized Tb:KY3F10 Sample.
| cubic |
tetragonal |
|||||
|---|---|---|---|---|---|---|
| range | a | Rwp | a | c | c/a√2 | Rwp |
| 10 | 11.5485 (44) | 19.7 | 8.1106 (98) | 11.6672 (260) | 1.0172 (26) | 18.6 |
| 20 | 11.5502 (17) | 20.4 | 8.1395 (39) | 11.6229 (110) | 1.0097 (11) | 15.7 |
| 30 | 11.5472 (11) | 17.0 | 8.1495 (31) | 11.5935 (86) | 1.0059 (8) | 16.3 |
| 40 | 11.5475 (9) | 17.9 | 8.1489 (20) | 11.5949 (58) | 1.0061 (6) | 18.1 |
| 50 | 11.5478 (8) | 18.6 | 8.1517 (17) | 11.5891 (48) | 1.0053 (5) | 18.2 |
| 60 | 11.5478 (7) | 19.5 | 8.1531 (15) | 11.5852 (44) | 1.0048 (4) | 18.7 |
| 70 | 11.5477 (7) | 20.4 | 8.1527 (13) | 11.5855 (38) | 1.0048 (4) | 20.4 |
| 80 | 11.5477 (7) | 21.2 | 8.1536 (12) | 11.5831 (38) | 1.0045 (4) | 20.8 |
| 90 | 11.5477 (6) | 21.9 | 8.1532 (11) | 11.5847 (34) | 1.0047 (3) | 21.6 |
| 100 | 11.5477 (6) | 22.4 | 8.1528 (11) | 11.5858 (32) | 1.0049 (3) | 21.6 |
Table 6. Unit Cell Parameters (Å) and Rwp (%) Values of the PDF Refinements in Ranges (Å) up to 100 Å, Using Cubic and Tetragonal Symmetry for the Heat-Treated Pure KY3F10 Sample.
| cubic |
tetragonal |
|||||
|---|---|---|---|---|---|---|
| range | a | Rwp | a | c | c/a√2 | Rwp |
| 10 | 11.5489 (70) | 18.0 | 8.1461 (120) | 11.5999 (320) | 1.0069 (31) | 16.0 |
| 20 | 11.5517 (24) | 14.1 | 8.1548 (72) | 11.5884 (200) | 1.0048 (19) | 12.9 |
| 30 | 11.5499 (11) | 13.3 | 8.1575 (39) | 11.5772 (110) | 1.0035 (11) | 12.7 |
| 40 | 11.5499 (8) | 13.8 | 8.1581 (22) | 11.5775 (63) | 1.0035 (6) | 13.0 |
| 50 | 11.5499 (6) | 13.8 | 8.1593 (14) | 11.5733 (40) | 1.0030 (4) | 13.0 |
| 60 | 11.5502 (4) | 13.6 | 8.1608 (11) | 11.5696 (32) | 1.0025 (3) | 12.9 |
| 70 | 11.5498 (3) | 14.0 | 8.1603 (7) | 11.5696 (21) | 1.0025 (2) | 13.1 |
| 80 | 11.5498 (3) | 14.6 | 8.1617 (7) | 11.5663 (20) | 1.0021 (2) | 12.9 |
| 90 | 11.5498 (2) | 15.5 | 8.1606 (4) | 11.5695 (12) | 1.0025 (1) | 13.8 |
| 100 | 11.5498 (2) | 16.4 | 8.1608 (3) | 11.5686 (10) | 1.0024 (1) | 14.4 |
The cell parameters obtained using the cubic structure are comparable to the ones reported in the literature (11.553 (1) Å18), especially considering high r ranges, which can be better visualized for the heat-treated samples (Tables 5 and 6). For the as-synthesized sample, the unit cell parameter obtained using the cubic symmetry oscillates around 11.5477 Å.
Table 5. Unit Cell Parameters (Å) and Rwp (%) Values of the PDF Refinements in Ranges (Å) up to 100 Å, Using Cubic and Tetragonal Symmetry for the Heat-Treated Tb:KY3F10 Sample.
| cubic |
tetragonal |
|||||
|---|---|---|---|---|---|---|
| range | a | Rwp | a | c | c/a√2 | Rwp |
| 10 | 11.5484 (58) | 18.1 | 8.1388 (110) | 11.6059 (270) | 1.0083 (27) | 16.1 |
| 20 | 11.5516 (20) | 14.3 | 8.1547 (68) | 11.5878 (180) | 1.0048 (18) | 13.6 |
| 30 | 11.5502 (10) | 13.7 | 8.1556 (28) | 11.5829 (76) | 1.0043 (7) | 13.0 |
| 40 | 11.5502 (7) | 14.4 | 8.1573 (16) | 11.5809 (46) | 1.0039 (4) | 13.4 |
| 50 | 11.5503 (5) | 14.6 | 8.1608 (17) | 11.5700 (50) | 1.0025 (5) | 12.6 |
| 60 | 11.5505 (4) | 14.5 | 8.1619 (13) | 11.5672 (39) | 1.0021 (4) | 12.7 |
| 70 | 11.5502 (3) | 15.1 | 8.1615 (9) | 11.5672 (26) | 1.0022 (3) | 12.6 |
| 80 | 11.5502 (2) | 15.8 | 8.1617 (7) | 11.5663 (20) | 1.0021 (2) | 12.9 |
| 90 | 11.5503 (2) | 16.9 | 8.1615 (5) | 11.5675 (15) | 1.0022 (1) | 13.2 |
| 100 | 11.5503 (2) | 18.0 | 8.1616 (4) | 11.5672 (12) | 1.0022 (1) | 13.6 |
Comparing the Rwp values of the as-synthesized sample for the PDF refinements, it is possible to see that when a larger range is considered, the Rwp values for both cubic and tetragonal symmetries are prone to converge. This may suggest a more locally distorted structure for the as-synthesized sample. On the contrary, the Tb-doped heat-treated sample does not exhibit such behavior, the Rwp differences are maintained throughout the different fitting ranges, and the tetragonal model fits better than the cubic one.
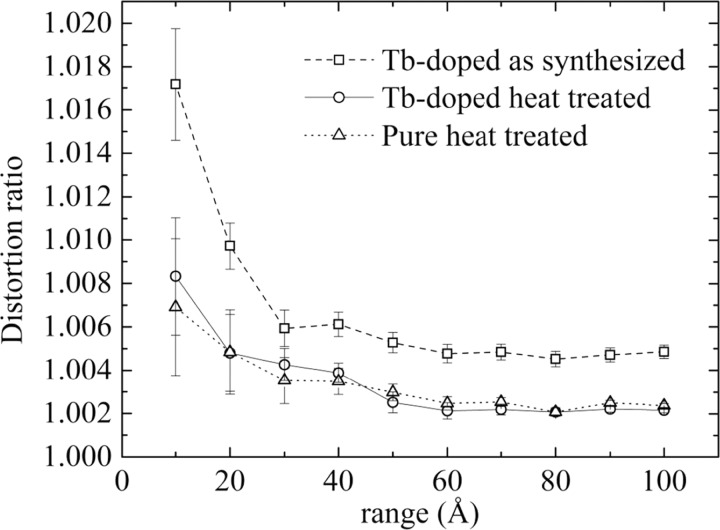
This behavior indicates that when the local structure distortion fades away, as r increases, the average cubic symmetry describes better the structure. Perhaps a better way to understand this local structure variation is by analyzing the distortion ratio, or deviation from the cubic symmetry, defined by c/a√2. Indeed, a value equal to 1 would indicate a purely cubic symmetry, whereas progressively larger values of this ratio would point out at more important deviation from cubic symmetry. In Figure 9, these distortion ratios are shown.
Figure 9.
Distortion ratio evolution with fitting r range of the PDF for the three samples.
By analyzing the three sets of data, a tendency to get smaller distortions as the range increases seems to emerge. For a range value of 10 Å, the three specimens present a high distortion ratio to regularly descend afterward. However, the heat-treated samples exhibit a smaller distortion rate and, bearing in mind the associated errors, decrease following the same path, but always with a difference between 0.0001 and 0.0002 units in the distortion ratio. This might implicate that the as-synthesized sample is composed of very small tetragonal domains up to larger r domains, compared to those of the heat-treated ones, and only for larger r values, it exhibits more distinctly the average cubic symmetry.
Also, it should be noticed that the Rwp value for the as-synthesized sample is always higher than that of the heat-treated one. This could be possibly attributed to the presence of other defects in the nontreated specimen that the model is not considering.
In terms of the interatomic distances, it is possible to see that the distance differences between yttrium/potassium and fluorine are similar, as presented in Table 7. This can be explained by the coordination polyhedra that were kept, when lowering the symmetry to tetragonal. In this sense, differences lie in the edges of each coordination polyhedron, leading to a slightly distorted square antiprism and consequently to a slightly distorted [Y6F20]2– assemblage. The local distribution of assemblages in the tetragonal symmetry can be appreciated in Figure 6, where the two different antiprisms containing Y1 and Y2 are clearly differentiated by different grayscales. All this comprises a very small distortion of the tetragonal lattice in respect to the cubic one; the differences between the symmetries are small and can only be quantified by analyzing locally the interatomic distances within clusters (distances ≈ 9 Å). This distortion is so small that only one work cited earlier3 has reported it.
Table 7. Selected Interatomic Distances (Å) for the Tetragonal Symmetry Calculated Using PDF and for Cubic Symmetry Calculated Using Rietvelda.
| method |
||||||
|---|---|---|---|---|---|---|
| Rietveld | ||||||
| symmetry |
||||||
| tetragonal | cubic | |||||
| sample |
||||||
| Tb:AS | Tb:HT | pure:HT | Tb:AS | Tb:HT | pure:HT | |
| Y1–F1 | 2.359 (5) | 2.354 (3) | 2.354 (4) | 2.370 (1) | 2.356 (7) | 2.355 (6) |
| Y1–F2 | 2.206 (3) | 2.198 (2) | 2.197 (3) | 2.194 (8) | 2.198 (5) | 2.199 (5) |
| Y1–F3 | 2.122 (4) | 2.199 (2) | 2.199 (3) | |||
| Y2–F1 | 2.297 (4) | 2.355 (3) | 2.354 (4) | |||
| Y2–F2 | 2.237 (5) | 2.203 (4) | 2.203 (5) | |||
| K1–F1 | 2.941 (5) | 2.764 (3) | 2.764 (5) | 2.711 (4) | 2.757 (2) | 2.762 (2) |
| K1–F2 | 3.187 (8) | 3.197 (3) | 3.197 (4) | 3.202 (1) | 3.200 (7) | 3.199 (6) |
| K1–F3 | 3.227 (4) | 3.204 (6) | 3.203 (8) | |||
AS and HT stand for as-synthesized and heat-treated samples, respectively.
Rietveld refinement was performed again considering the tetragonal symmetry. However, no significant improvement in the fitting was observed (see Table 8).
Table 8. Rietveld Refinements Results for Tb-Doped and Pure Specimens, As Synthesized (AS) and Heat Treated (HT), Using Tetragonal Symmetry, S.G. I4/mmma.
| Tb:AS | Tb:HT | pure:HT | |
|---|---|---|---|
| a | 8.1480 (5) | 8.1633 (1) | 8.1631 (1) |
| c | 11.5800 (15) | 11.5537 (2) | 11.5515 (2) |
| c/a√2 | 1.0049 (10) | 1.0008 (1) | 1.0006 (1) |
| K (Uiso) | 0.02457 (120) | 0.01914 (41) | 0.01902 (35) |
| Y1 (Uiso) | 0.00716 (47) | 0.00379 (24) | 0.00404 (20) |
| Y2 (Uiso) | 0.00364 (66) | 0.00522 (52) | 0.00514 (44) |
| F1 (Uiso) | 0.01500 (127) | 0.00766 (45) | 0.00691 (39) |
| F2 (Uiso) | 0.00009 (100) | 0.00904 (150) | 0.0095 (108) |
| F3 (Uiso) | 0.01432 (323) | 0.00550 (257) | 0.00367 (162) |
| xY1 | 0.23860 (19) | 0.24074 (12) | 0.24076 (11) |
| zY2 | 0.24408 (41) | 0.23992 (25) | 0.23970 (21) |
| xF1 | 0.22473 (81) | 0.22633 (81) | 0.22642 (66) |
| zF1 | 0.12674 (103) | 0.11036 (76) | 0.10972 (60) |
| xF2 | 0.17052 (83) | 0.16399 (114) | 0.16235 (77) |
| zF2 | 0.16543 (85) | 0.16501 (84) | 0.16459 (69) |
| xF3 | 0.30175 (149) | 0.33533 (202) | 0.33911 (118) |
| Rwp | 6.4 | 4.6 | 7.0 |
The lattice constants are expressed in Å, the Debye–Waller factors in Å2, and the Rietveld statistics factors in percent.
This indicates that small tetragonal domains must be within the nanoparticles, as PDF analysis has shown. However, this corresponds to such a small distortion that the average structure can be described by the cubic symmetry. This is corroborated by the distortion ratios shown in Table 8 and Figure 9, where distortion ratio tends to 1 for the heat-treated samples, whereas for the as-synthesized sample, it agrees with the ratio found in the PDF analysis: 1.0049 (3) (see Table 4) versus 1.0049 (10) for Rietveld.
Conclusions
High-energy synchrotron diffraction data gave access to the atomic pair distribution function, G(r), and revealed for all samples studied an unambiguous split of the Y–F bond length that indicated a clear divergence from the usually adopted cubic Fm3̅m space group, which could be better explained in terms of tetragonal symmetry (S.G. I4/mmm).
The PDF refinements for r varying from 10 to 100 Å did show that the nanocrystalline Tb-doped sample presented a distortion from the cubic symmetry defined as c/a√2 that steadily declined to reach a minimum threshold at approximately 10 nm. This value of 1.0049 (3) considering the error margin was corroborated by Rietveld analysis that provides values for the long-order or average structure. The heat-treated, pure, and Tb-doped samples presented a similar behavior with a progressive decrease to 1.0023 (1) for 10 nm range and 1.0007 (1) for the average structure obtained from Rietveld analysis and arguably could be equally well described within Fm3̅m for the long range or average order. The nanocrystalline specimen presented a more pronounced deviation from the cubic symmetry, as compared to the heat-treated ones, and even for the average structure, the more adequate symmetry describing the arrangement should be considered as tetragonal. This fact is important because it may have implications on the interpretation of luminescence properties of rare-earth-doped KY3F10.
This work highlights the potential of PDF analysis, being capable of providing clues to detect subtle local symmetry distortions from the average structure usually obtained from conventional methods, such as Rietveld analysis, and provides a good example of the possibilities opened to materials science applications.
Finally, as this work has been done at room temperature, it is worth mentioning that further work on this subject is under way. Synchrotron experimental data at higher energies and at different temperatures are already collected and will be the subject of a future publication.
Experimental and Data Treatment
Synthesis
Tb:KY3F10 (0.4 mol %) was obtained by coprecipitation.25,26 Under stirring, the rare-earth oxides (99.9%, Y2O3 and Tb2O3; Aldrich) were dissolved in concentrated hydrochloric acid (37%) and then a boiling aqueous solution of potassium fluoride (99.9%, KF; Merck), 200% excess, was slowly added. After this, a boiling ammonium hydrogen fluoride aqueous solution (98%, NH4HF2; Aldrich), 100% excess, was added. The resulting solution was maintained at 80 °C with continuous stirring for 2 h. The nanocrystals were washed and separated by centrifugation and dried on a hot plate at 40 °C for 48 h. A portion of the obtained white powder was treated at 600 °C in a resistive furnace for 6 h under argon (99.995%; White Martins) and hydrofluoric acid (99.99%; Matheson) flow in a 2:1 proportion. The pure KY3F10 sample was synthesized in the same way as the Tb:KY3F10 sample (0.4 mol %), and the only difference is that just Y2O3 was dissolved in concentrated hydrochloric acid.
Synchrotron X-ray Diffraction
Room-temperature powder
diffraction data were collected at a photon energy of 30 keV in the
materials science powder diffraction (MSPD) beamline at ALBA Synchrotron
light source. The specimens were introduced in 0.8 mm diameter Lindemann
capillary tubes and kept rotating during the acquisition. The detector
system used was a Mythen II27 of six modules.
The profile was measured over 1.005–123.693° angular range
(0.3–26.8 Å–1, in Q-range) with resolution  . Three samples were measured: as-synthesized
and heat-treated Tb-doped KY3F10 and a pure
heat-treated KY3F10 sample.
Data Processing
For the PDF analyses, the programs PDFgetX328 and PDFgui22 were used for converting the X-ray diffraction data to atomic pair distribution functions and PDF data modeling, respectively. Rietveld analysis was accomplished with the help of TOPAS 4.2.29 Crystal structure drawings were executed with ATOMS.30
Acknowledgments
R.U.I. acknowledges the scholarship granted by CNPq (Process number 206983/2014-0) within the Ciência sem Fronteiras Brazilian program and CAPES grant. The XRD experiment was performed at MSPD beamline at ALBA Synchrotron with the collaboration of ALBA staff. H.M.S.M.D.L. and S.L.B. acknowledge CNPq for financial support (Photonics National Institute for Science and Technology). X.T. acknowledges financial support from the Spanish MINECO projects MAT2015-67593-P and BIA2014-57658-C2-1-R.
The authors declare no competing financial interest.
References
- Kui H. W.; Lo D.; Tsang Y. C.; Khaidukov N. M.; Makhov V. N. Thermoluminescence properties of double potassium yttrium fluorides singly doped with Ce3+, Tb3+, Dy3+ and Tm3+ in response to α and β irradiation. J. Lumin. 2006, 117, 29. 10.1016/j.jlumin.2005.03.012. [DOI] [Google Scholar]
- Zhu L.; Cao X. Q.; Yang D. W. Facile Synthesis of Monodisperse KY3F10 Nanospheres. Adv. Mater. Res. 2011, 233–235, 2736. 10.4028/www.scientific.net/AMR.233-235.2736. [DOI] [Google Scholar]
- Cao C.; Yang H. K.; Moon B. K.; Choi B. C.; Jeong J. H.; Kim K. H. Hydrothermal synthesis, phase evolution, and optical properties of Eu3+-doped KF–YF3 system materials. J. Mater. Res. 2012, 27, 2988. 10.1557/jmr.2012.331. [DOI] [Google Scholar]
- Linhares H. M. S. M. D.Síntese de nanocristais de KY3F10 pelo método de co-precipitação visando aplicações ópticas. Ph.D. Thesis, Universidade de São Paulo, São Paulo, Brazil, 2014. [Google Scholar]
- Gomes L.; Linhares H. M. S. M. D.; Ichikawa R. U.; Martinez L. G.; Ranieri I. M. Luminescence properties of Yb:Nd:Tm:KY3F10 nanophosphor and thermal treatment effects. J. Lumin. 2015, 157, 285. 10.1016/j.jlumin.2014.08.048. [DOI] [Google Scholar]
- Gomes L.; Linhares H. M. S. M. D.; Ichikawa R. U.; Martinez L. G.; Baldochi S. L. Luminescence properties of Yb:Er:KY3F10 nanophosphor and thermal treatment effects. Opt. Mater. 2016, 54, 57. 10.1016/j.optmat.2016.02.010. [DOI] [Google Scholar]
- Winterer M.; Nitsche R.; Hahn H. Local structure in nanocrystalline ZrO2 and Y2O3 by EXAFS. Nanostruct. Mater. 1997, 9, 397. 10.1016/S0965-9773(97)00092-5. [DOI] [Google Scholar]
- Nicolas D.; Masenelli B.; Mélinon P.; Bernstein E.; Dujardin C.; Ledoux G.; Esnouf C. Structural transition in rare earth oxide clusters. J. Chem. Phys. 2006, 125, 171104 10.1063/1.2390693. [DOI] [PubMed] [Google Scholar]
- Nièpce J. C.Structure and Phase Transitions in Nanocrystals. In Nanomaterials and Nanochemistry; Brechignac C., Houdy P., Lahmani M., Eds.; Springer-Verlag, 2007; pp 35–54. [Google Scholar]
- Ayala A. P.; Oliveira M. A. S.; Gesland J.-Y.; Moreira R. L. Electrical and dielectric investigations of the conduction processes in KY3F10 crystals. J. Phys.: Condens. Matter 1998, 10, 5161. 10.1088/0953-8984/10/23/016. [DOI] [Google Scholar]
- Grzechnik A.; Crichton W. A.; Gesland J.-Y. Potassium triyttrium decafluoride, KY3F10, synthesized at high pressures and high temperatures. Solid State Sci. 2003, 5, 757. 10.1016/S1293-2558(03)00094-3. [DOI] [Google Scholar]
- Gateshki M.; Petkov V.; Pradhan S. K.; Vogt T. Structure of nanocrystalline MgFe2O4 from X-ray diffraction, Rietveld and atomic pair distribution function analysis. J. Appl. Crystallogr. 2005, 38, 772. 10.1107/S0021889805024477. [DOI] [Google Scholar]
- Zernike F.; Prins J. A. Die Beugung von Röntgenstrahlen in Flüssigkeiten als Effekt der Molekülanordnung. Z. Phys. A: Hadrons Nucl. 1927, 41, 184. 10.1007/BF01391926. [DOI] [Google Scholar]
- Berdowski P. A. M.; Lammers M. J. J.; Blasse G. 5D3–5D4 cross-relaxation of Tb3+ in α-GdOF. Chem. Phys. Lett. 1985, 113, 387–390. 10.1016/0009-2614(85)80387-0. [DOI] [Google Scholar]
- Lawrence T. A.; Murra K. A.; May P. S. Temperature dependence of rate constants for Tb3+(5D3) cross relaxation in symmetric Tb3+ pairs in Tb-doped CsCdBr3, CsMgBr3, CsMgCl3. J. Phys. Chem. B 2003, 107, 4002. 10.1021/jp0270248. [DOI] [Google Scholar]
- Shinde K.; Dhoble S.; Swart H.; Park K.. Phosphate Phosphors for Solid-State Lighting; Springer: Berlin, 2012; pp 173–180. [Google Scholar]
- Egami T.; Billinge S. J. L.. Underneath the Bragg Peaks. Structural Analysis of Complex Materials, 2nd ed.; Pergamon/Elsevier: Oxford, 2012; pp 1–23. [Google Scholar]
- Grzechnik A.; Nuss J.; Friese K.; Gesland J.-Y.; Jansen M. Refinement of the crystal structure of potassium triyttrium decafluoride, KY3F10. Z. Kristallogr. – New Cryst. Struct. 2002, 217, 460. 10.1524/ncrs.2002.217.1.460. [DOI] [Google Scholar]
- Friese K.; Krüger H.; Kahlenberg V.; Balić-Zunić T.; Emerich H.; Gesland J.-Y.; Grzechnik A. Study of the temperature dependence of the structure of KY3F10. J. Phys.: Condens. Matter 2006, 18, 2677. 10.1088/0953-8984/18/9/007. [DOI] [Google Scholar]
- Bevan D. J. M.; Greis O.; Strähle J. A new structural principle in anion-excess fluorite-related superstructures. Acta Crystallogr., Sect. A: Found. Crystallogr. 1980, 36, 889. 10.1107/S0567739480001878. [DOI] [Google Scholar]
- Grzechnik A.; Friese K. Reversible pressure-induced first-order phase transitions in anion-excess fluorite KY3F10 studied with single-crystal X-ray diffraction. Solid State Sci. 2014, 30, 61. 10.1016/j.solidstatesciences.2014.02.012. [DOI] [Google Scholar]
- Shannon R. D. Revised effective ionic radii and systematic studies of interatomic distances in halides and chalcogenides. Acta Crystallogr., Sect. A: Found. Crystallogr. 1976, 32, 751. 10.1107/s0567739476001551. [DOI] [Google Scholar]
- Farrow C. L.; Juhás P.; Liu J. W.; Bryndin D.; Božin E. S.; Bloch J.; Proffen Th.; Billinge S. J. L. PDFfit2 and PDFgui: computer programs for studying nanostructure in crystals. J. Phys.: Condens. Matter 2007, 19, 335219 10.1088/0953-8984/19/33/335219. [DOI] [PubMed] [Google Scholar]
- Aroyo M. I.; Perez-Mato J. M.; Capillas C.; Kroumova E.; Ivantchev S.; Madariaga G.; Kirov A.; Wondratschek H. Bilbao crystallographic server I: Databases and crystallographic computing programs. Z. Kristallogr. – Cryst. Mater. 2006, 221, 15. 10.1524/zkri.2006.221.1.15. [DOI] [Google Scholar]
- Mullin J. W.Crystallization, 4th ed.; Butterworth-Heinemann: Oxford, U.K., 2001; pp 315–342. [Google Scholar]
- Sassoye C.; Patriarche G.; Mortier M. High yield syntheses of reactive fluoride K1–x(Y,Ln)xF1+2x nanoparticles. Opt. Mater. 2009, 31, 1177. 10.1016/j.optmat.2008.12.013. [DOI] [Google Scholar]
- Fauth F.; Peral I.; Popescu C.; Knap M. The new materials science and powder diffraction beamline at ALBA synchrotron. Powder Diffr. 2013, 28, S360. 10.1017/S0885715613000900. [DOI] [Google Scholar]
- Juhás P.; Davis T.; Farrow C. L.; Billinge S. J. L. PDFgetX3: a rapid and highly automatable program for processing powder diffraction data into total scattering pair distribution functions. J. Appl. Crystallogr. 2013, 46, 560. 10.1107/S0021889813005190. [DOI] [Google Scholar]
- Bruker AXS GmbHUser’s Manual, Topas v4.2; Bruker AXS GmbH, 2009.
- Dowty E.ATOMS; Shape Software: Kingsport, Tennessee, 2006. [Google Scholar]


