

Summary
The lack of functional understanding of most mutations in cancer, combined with the nondruggability of most proteins, challenge genomics-based identification of oncology drug targets. We implemented a machine learning-based approach (idTRAX), which relates cell-based screening of small-molecule compounds to their kinase inhibition data, to directly identify effective and readily druggable targets. We applied idTRAX to triple-negative breast cancer cell lines and efficiently identified cancer-selective targets. For example, we found that inhibiting AKT selectively kills MFM-223 and CAL148 cells, while inhibiting FGFR2 only kills MFM-223. Since the effects of catalytically inhibiting a protein can diverge from those of reducing its levels, targets identified by idTRAX frequently differ from those identified through gene knockout/knockdown methods. This is critical if the purpose is to identify targets specifically for small-molecule drug development, whereby idTRAX may produce fewer false positives. The rapid nature of the approach suggests that it may be applicable in personalizing therapy.
eTOC blurb
Gautam et al. utilize a combined chemogenomics and machine learning approach to identify cell model-selective anticancer drug targets. The method is geared towards revealing targets for small-molecule drugs. As such, the identified targets diverge from those identified with functional genomics methods, and show better validation with small-molecule probes.
Graphical Abstract
Introduction
Kinases are regarded as attractive drug targets for neoplastic diseases due to their pivotal role in signal transduction and regulation of most cellular activities, frequent activation in cancers, and inherent tractability for small-molecule drug approaches. Consequently, small molecule kinase inhibitors have gained tremendous attention in cancer drug discovery in past two decades. The FDA approval of a BCR-ABL1 inhibitor imatinib (Gleevec, Novartis) against chronic myeloid leukemia (CML) in 2001 served as the first confirmation that targeting kinases with small molecules is a viable therapeutic approach. Currently, 130 out of 518 enzymatically active human protein kinases have been proposed as potential therapeutic targets (Rask-Andersen et al., 2014). To date, 55 small molecule kinase inhibitors have been approved for therapeutic use and around 250 are being investigated for clinical use (Wu et al., 2015, Yang et al., 2016, Wu et al., 2016, Klaeger et al., 2017).
Even though extensive studies have been carried out to target the human kinome, they are mostly limited to a small subset of human kinases, typically to tyrosine kinases (TK). The kinome contains six additional kinase classes, namely tyrosine kinase-like (TKL); homologs of yeast Sterile 7, Sterile 11, Sterile 20 kinase (STE); Casein kinase (CK1); containing protein kinase A, G and C families (AGC); calcium/calmodulin-dependent protein kinase (CAMK); containing CDK, MAPK, GSK3, CLK families (CMGC) and a few atypical kinases, including the PI3K family of lipid and protein kinases. The vast majority of approved kinase inhibitors target TK and only a few approved inhibitors target kinases, including BRAF from TKL, MEK1/2 from STE, CDK4/6 from CMGC and PI3Kα, PI3Kδ and MTOR from PI3K. This highlights the opportunity to explore kinases of other classes as potential anti-cancer targets. With the availability of Published Kinase Inhibitor Set (PKIS) from GlaxoSmithKline (GSK), it has been possible to explore the kinases of other classes as well (Knapp et al., 2013, Drewry et al., 2014, Drewry et al., 2017). PKIS has broad kinome coverage going beyond TKs where the activities of the compounds are assayed against 224 kinases including 23 disease related mutant kinases (Elkins et al., 2016).
Six small molecule kinase inhibitors, namely lapatinib, neratinib (HER2 inhibitors) palbociclib, ribociclib, abemaciclib (CDK4/6 inhibitors) and everolimus (mTOR inhibitor) have received accelerated FDA approval due to their efficacy against advanced stage breast cancer (Schwartzberg et al., 2010, Sherrill et al., 2010, Katsumi et al., 1989, Beck et al., 2014). Lapatinib (Tykerb, GSK) and neratinib (Nerlynx, Puma Biotechnology) were approved for HER2-positive metastatic breast cancer and palbociclib (Ibrance, Pfizer), ribociclib (Kisqali, Novartis), abemaciclib (Verzenio, Eli Lilly) and everolimus (Afinitor, Novartis) for hormone-receptor-positive, HER2-negative breast cancer. Triple negative breast cancer (TNBC), devoid of hormone-receptors and HER2, remains a clinical challenge with no approved targeted therapies except for the PARP inhibitor olaparib for BRCA mutant metastatic TNBC. TNBC is a highly heterogeneous and aggressive group of cancers that accounts for 15–20% of breast cancer cases. Approximately 75% of all kinases are expected to be expressed in any given breast cancer cell (Manning et al., 2002). The identification of cell context-specific kinase dependencies therefore poses a great potential for establishing therapeutic strategies against TNBC.
Most small-molecule kinase inhibitors target the highly conserved ATP binding pocket of kinases, which results in varying degrees of target promiscuity (Anastassiadis et al., 2011). Such target promiscuity can result in undesirable off-target effects. Sometimes, however, it may instead enhance the efficacy by targeting compensatory, redundant or synergistic therapeutic pathways (polypharmacology) (Knight et al., 2010). Generally, the promiscuity of kinase inhibitors makes it challenging to pin-point the key target(s) through which an individual compound exerts its phenotypic response.
Using a machine learning approach to de-convolve cell line-selective kinase dependencies from drug sensitivities
The genetic complexity of cancer, combined with poor functional understanding of most cancer mutations, has made it difficult to identify oncological drug targets based on mutational analyses alone. This is further compounded by the fact that knocking down a protein can yield effects that diverge from pharmacologically engaging it with a small-molecule or biologic (Weiss et al., 2007). Finally, the majority of the proteome is predicted to be undruggable, which means that most potential drug targets identified using genetic methods are challenging to translate to pharmacological drug development. We explored an approach that identifies effective and readily druggable targets in a more direct manner, starting from a cellular model of disease (Al-Ali et al., 2015).
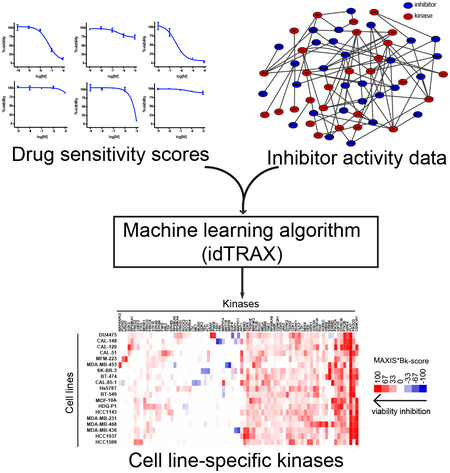
The experimental-computational approach begins by screening a highly annotated collection of kinase inhibitors in the cell-based assay (476 inhibitors; see Figure 1), and then identifying the compounds that produce the desirable phenotype (for example, death of cancer cells), as well as compounds that produce the undesirable phenotype (for example, survival or proliferation of cancer cells). We used a machine learning-based algorithm, that relates the activity of compounds in the cell-based assay to their kinase inhibition profiles, and identifies kinases whose inhibition are likely to mediate the desirable phenotypic outcome (targets), as well as kinases whose inhibition are likely to mediate the undesirable phenotypic outcome (anti-targets).
Figure 1:

Illustration of the kinase dependency deconvolution approach. Cell line-selective kinase dependencies are predicted using a machine learning algorithm (idTRAX) that maps the activity of compounds in the cell-based assay (DSS) to their kinase inhibition profiles (target activity data).
In this study, we applied our previously established approach of combining machine learning and information theory with cell-based drug screening to identify such mechanistic kinase targets with anti-cancer potential (Al-Ali et al., 2015). We generated selective kinase dependency profiles for 19 breast cancer cell lines covering the six major transcriptomic based subtypes (Lehmann et al., 2011).
Results
TNBC exhibits diverse kinase dependencies
We applied idTRAX, an application of the method described in [18] currently developed by Truvitech LLC, to 16 triple negative breast cancer (TNBC) cell lines, in comparison to 3 non-TNBC cell lines. TNBC can be sub-classified into six subtypes based on transcriptomic analysis; basal like 1 (BL1), basal like 2 (BL2), mesenchymal like (M), mesenchymal stem like (MSL), immune-modulators (IM) and luminal androgen receptor (LAR) (Lehmann et al., 2011) (figure 2A). On performing a clustering analysis of cell lines based on their kinase dependency profiles derived from idTRAX analysis, we found that the kinase dependency-based grouping of cell lines does not match with the gene expression-based subtypes, similar to what we have previously found with our broader compound profiling (Gautam et al., 2016). This further highlights the need for target identification and personalized medicine approaches that address the disconnection between standard molecular profiling methods and functional cellular responses of cancer in general, and in TNBC in particular.
Figure 2:

Breast cancer cell lines exhibit diverse kinase dependency patterns. A) Table representing list of breast cancer cell lines used in the study, 16 TNBC cell lines along with 1 non-cancerous triple negative (TN) epithelial cell line (MCF-10A) and 2 HER2 (ERBB2) -amplified cell lines (SK-BR-3 and BT-474). The color of the cell line represents the transcriptomics-based TNBC subtypes (Lehmann et al., 2011) and non-TNBC cell lines are marked with black label. B) Heat map of kinase dependency profile of the cell lines based on MAXIS*Bk score representing cell lines clustering horizontally and kinases vertically. Red color in the heat map indicates that inhibition of that kinase results in anti-proliferative effect whereas blue indicates that inhibition might lead to the pro-proliferative effect. Generic and known cell line-selective kinase dependencies are highlighted as dark green boxes.
The idTRAX approach effectively captured known generic kinase dependencies, such as mitotic kinase PLK1 and pivotal lipid kinase PI3K essentiality for all the cell lines screened (figure 2B, dark green boxes). Additionally, we also identified well-established cell line-selective kinase dependencies, for example BRAF in DU4475, carrying an activating BRAF (V600E mutation). Similarly, three cell lines, BT-474, SK-BR-3 and MDA-MB-453, harboring HER2 amplification and overexpression showed markedly selective dependency towards the HER family of kinases (EGFR, HER2 & ERBB4). Moreover, KRAS mutant MDA-MB-231 cells exhibited dependency towards MAP2K1 and NTRK3 mutant MFM-223 cells dependency towards the NTRK family. Additionally, our algorithm predicted many cell line-selective kinase dependencies which represent currently understudied kinases that may have high therapeutic potential. Examples of such cell line-selective dependencies include FGFR2 in MFM-223, AKT in MFM223 and CAL-148, MELK in CAL-85–1, MAPKAPK3 in MDA-MB-453, MAPK14 in CAL-85–1, PI4KB in DU4475, SGK3 in CAL-120, and TSSK1B in HDQ-P1.
MFM-223 is selectively addicted to FGFR2
To validate the idTRAX predictions, we tested a unique dependency of FGFR2 predicted for MFM-223 cell line both with pharmacological inhibition and gene silencing techniques, in comparison to two other cell lines, CAL-120 and MDA-MB-231, which had low FGFR family MAXIS*Bk scores (figure 3A). For pharmacological validation, we tested well-known pan-FGFR inhibitors erdafitinib, AZD4547 and lucitanib. As predicted, all three inhibitors exhibited strong selective viability inhibition on MFM-223, with negligible effect on CAL-120 and MDA-MB-231 (figure 3B). We performed siRNA-based knockdown of the four FGFR isoforms (1–4) to confirm the FGFR2 specific dependency towards MFM-223. FGFR2 silencing had significant viability inhibiting effect, whereas silencing the other isoforms had a negligible effect on viability of MFM-223 cells (figure 3C). The silencing of FGFR family genes had no effect on the viability of CAL-120 and MDA-MB-231 cells (figure 3C). Our findings support a previous report showing association of FGFR2 with the cellular toxicity of MFM-223 (Fink et al., 2015).
Figure 3:

FGFR2 dependency in MFM-223. A) Heat map based on MAXIS*Bk score, predicting selective FGFR2 dependency in MFM-223 cell line. CAL-120 and MDA-MB-231 were predicted to be resistant to FGFR inhibition. B) Validation of FGFR dependency with three FGFR inhibitors; mean ± SME, n=3. C) Bar plot illustrating the effect of siRNA-based knockdown of four different FGFR isoforms in the three cell lines. One-way ANOVA, mean ± SME, n=5, p<0.0001 (****).
idTRAX identifies pharmacologically effective targets not detected by RNAi
Besides FGFR2, we also tested AKT dependency across the cell lines. We focused on two cell lines, MFM-223 and CAL-148, predicted to be dependent on AKT kinases, and two control cell lines, CAL-120 and MDA-MB-231, predicted to be unaffected with AKT inhibition (figure 4A). Three AKT selective inhibitors afuresertib, uprosertib and ipatasertib were tested against the cell lines. In line with the idTRAX predictions, AKT inhibition resulted in strong reduction of the viability of MFM-223 and CAL-148 cell lines, whereas there was no effect on CAL-120 and MDAMB-231 cell lines (figure 4B). We also performed gene knockdown experiment with siRNA for the three AKT isoforms: AKT1, AKT2 and AKT3. To our surprise, AKT gene knockdowns did not reciprocate the effect seen with AKT inhibitors in the MFM-223 cell line. This result suggests that a compound screening approach yields more directly translatable result than loss-of-expression screenings.
Figure 4:

Cell line selective sensitivity towards catalytic inhibition of AKT. A) Heat map based on MAXIS*Bk score, predicting selective AKT dependency in MFM-223 and CAL-148 cell lines. CAL-120 and MDA-MB-231 were predicted to be unaffected by AKT inhibition. B) Effect of three selective AKT inhibitors on the viability of the cell lines; mean ± SME, n=3. C) siRNA-based knockdown of three different AKT isoforms fails to validate susceptibility to AKT inhibition. Oneway ANOVA, mean ± SME, n=5, p<0.0001 (****).
In certain instances, kinase dependencies revealed through gene silencing cannot be reproduced by pharmacological kinase inhibition. For example, based on both siRNA and shRNA screens (Campbell et al., 2016, Marcotte et al., 2016) AURKA is selected as an essential kinase for maintaining viability of MFM-223 cells. However, idTRAX analysis predicted that AURKA inhibition has no effect on MFM-223 cells (figure 5A). In validation experiments, the AURKA selective inhibitor alisertib had no effect on MFM-223 cells in our validation experiments (figure 5B). However, knocking down AURKA using siRNAs had strong viability inhibition effect on MFM-223 (figure 5C). We further validated knockdown result using AURKA siRNAs from two different companies, Ambion and Qiagen, and both caused marked inhibition of MFM-223 cell viability. This result highlights the relevance of our approach to identifying and developing pharmacological drug targets.
Figure 5:

Cell line selective sensitivity towards transcriptional knockdown and pharmacologic inhibition of Aurora A. A) Heat map representing AURKA dependency on MFM-223 based on two gene silencing studies (siRNA (z-score) (Campbell et al., 2016) and shRNA (z-GARP score) (Marcotte et al., 2016)) and pharmacological inhibition prediction based on MAXIS*Bk score. B) Dose response curve of AURKA selective inhibitor alisertib against MFM-223; mean ± SME, n=4. C) Effect on viability of MFM-223 with siRNA-based knockdown of AURKA. siRNAs from two different companies Qiagen (Q) and Ambion (A) were used in the study and both showed significant viability inhibition. One-way ANOVA, mean ± SME, n=5, p-value< 0.0001 (****).
Discordance within kinase dependency profiles generated by different gene silencing approaches and idTRAX
To further explore the observed discordance between the cell line-selective kinase dependencies acquired from kinase silencing and pharmacological inhibition, we conducted a systematic comparison of kinase dependency profiles obtained from complementary functional genomics screening approaches with our kinase specific dependency estimates derived from idTRAX analysis from kinase inhibitor sensitivity screens. Specifically, we obtained kinase dependency scores for breast cancer cell lines from a high-throughput short interfering RNA (siRNA) screening performed by Campbell et al (Campbell et al., 2016). Further, we obtained kinase dependency scores based on genome-wide short-hairpin RNA (shRNA) screen, performed by Marcotte et al (Marcotte et al., 2016), for overlapping sets of kinases in the breast cancer cell lines profiled in both of the studies.
Strikingly, we did not observe much agreement between the siRNA and shRNA screening datasets [average rank correlation (ρ)=0.03, p=0.221] (figure 6A). Moreover, we observed negligible agreement between idTRAX derived kinase-dependency scores with siRNA-based kinase dependency scores [ρ=0.04, p=0.068] or shRNA-based kinase dependency scores [ρ=0.04, p=0.02] (figure 6A). Furthermore, comparison of the kinase dependency estimates obtained from genome-wide CRISPR knockout screens (Meyers et al., 2017) with the other scores also yielded poor correlation estimates, suggesting a lack of agreement between these gene-silencing approaches. Among the different gene silencing methods, siRNA and CRISPR data matched better [ρ=0.19, p<0.0001). These observations were more evident while focusing in one cell line (MDA-MB-231) data (figure 6B) Based on these results, none of the gene silencing approaches as such could replicate the cell line-selective kinase dependencies acquired from our pharmacologically-based idTRAX analysis.
Figure 6:

Correlation between kinase dependencies assimilated using different screening approaches (drug, siRNA, shRNA, and CRISPR screening). siRNA screening data (z-score), shRNA data (z-GARP scores) and CRISPR data (CERES score) were extracted from Campbell et al (Campbell et al., 2016), Marcotte et al (Marcotte et al., 2016) and from Meyers et al (Meyers et al., 2017) studies, respectively. MAXIS*Bk score represents kinase dependency profile based on compound screening. Only kinases common to all datasets (n=179) were used in the analysis. A) Dot plot comparing correlation (Spearman rank correlation) between different functional profiling approaches. For each comparison, only the cell lines that are common between the two data sets were incorporated. Colors indicate individual cell lines. B) Scatter plot comparing scores from different methods in a representative cell line MDA-MB-231. The points correspond to the common kinases between the data sets used in the analysis.
Discussion
Clinically investigated kinase inhibitors are limited to a small group of kinase targets. A large number of kinases remain to be explored for their utility as pharmacological targets of small-molecule drugs. Inhibitor promiscuity is often observed with kinase inhibitors, as most of them target the highly conserved ATP-binding pocket (Anastassiadis et al., 2011). Such promiscuity can lead to detrimental off-target effects, but it can – and sometimes does - lead to favorable therapeutic outcome by targeting compensatory pathways (Knight et al., 2010). Therefore, it is highly important to deconvolve the kinase dependencies for the development of effective targeted therapies and drug combination strategies. However, pinpointing such specific kinase dependency is challenging, thereby requiring computational approaches to identify cancer selective kinase dependencies. In order to address this issue, we developed a more direct approach starting from cellular model of disease to identify effective and readily druggable targets (Al-Ali et al., 2015). We implemented our machine learning algorithm idTRAX, which integrates the activity of compounds in the cell-based assay to their kinase inhibition target profiles, to identify the cell line-selective kinases whose inhibition mediates reduced cell viability (desirable outcome) or increased cell proliferation (undesirable outcome).
Our approach predicted many cell line-selective potential kinase dependencies not described before, such as PI4KB in DU4475, SGK3 in CAL-120, and TSSK1B in HDQ-P1. The sensitivity of our approach was validated by its ability to identify well-established kinase dependencies. Altogether, our study underscores the heterogeneity of kinase dependencies in TNBC, therefore suggesting a more effective approach to tackle this heterogeneous disease is a personalized medicine approach.
However, the power of predictability of idTRAX is limited by the compound set used for the training and how well the inhibitors can discriminate between different kinases. For that reason, it is important to develop even better sets of well profiled inhibitors with broader target ranges and higher level of selectivity and it is promising that such efforts are moving ahead (Drewry et al., 2017, Muller et al., 2018). We are also putting our efforts in compilation of high-quality consistent database for drug target interaction which we call Drug Target Commons (DTC; https://drugtargetcommons.fimm.fi) (Tang et al., 2018), this kind of extensive dataset will definitely serve better for target deconvolution approaches. With further optimization of compound collections with greater diversity in terms of target spectra and chemical backbones, the method can be further explored to evaluate or predict the co-target dependencies and drug combinations effective against cancer cells. In our previous study (Al-Ali et al., 2015), we explored the approach to predict the additive and synergistic kinase inhibitors combinations that leads to enhanced neurite outgrowth as compared to single inhibition. In the study, we tested the hits (kinase dependencies) co-treated them with inhibitors that have differing hit kinase inhibition profiles and distinct chemical structure and thereby were able to establish synergistic inhibitor combinations. Therefore, further exploration of the method by co-targeting the cell model selective kinase dependencies with inhibitors having unrelated chemical structure and unique kinase inhibition profile holds the potential to predict additive or synergistic drug combinations against cancer cells.
Additionally, when comparing our results to RNAi-mediated silencing of kinases, we saw great differences in responses. In the case of the predicted AKT dependencies in MFM-223 and CAL-148 cells, we could confirm that additional AKT inhibitors strongly affected viability of the cells, but siRNAs against individual AKT isoforms had minimal effect on cell viability. This indicates that there may be redundancy between the AKT isoforms in these cells and that blocking more than one isoform is needed to reach the effect. Conversely, transcriptomic silencing of AURKA had been reported to induce strong inhibition effect on MFM-223 cells, but we showed that selective kinase inhibition of AURKA had no effect on MFM-223 cell viability, suggesting that the sensitivity to AURKA knockdown is not strictly kinase dependent and highlighting that knockdown approaches often overestimate the impact of pharmacological inhibition of an enzyme. Further analysis and comparison of the overall kinase dependency predicted by idTRAX with those from published gene silencing screening approaches also yielded discordant results. To our surprise, most kinase dependencies identified from kinase inhibition screens were not recapitulated in either RNAi or CRISPR screens and vice versa. Most often, only generic dependencies such as PLK1 or very strong oncogenic drivers such as HER2 in HER2-amplified breast cancer cell lines matched between the kinase inhibition and RNAi/CRISPR screens.
Taken together, our results show that it is challenging to identify druggable targets with genomic or knockdown approaches only. Although, genome/kinome wide knockout and knockdown screening has helped us to appreciate the potential of kinases as therapeutic targets, the findings emerging from such studies have often not been possible to turn to drug targets, perhaps because the hits that come out of these screens may not be predictable of the efficacy of pharmacological kinase inhibition. Our data suggest that a chemogenomics-based target deconvolution strategy may result in fewer false positives than genomics-based approaches. Therefore, the type of approach we present holds promise as an alternate method for identifying cancer drug targets that are readily tractable with pharmacological therapies.
Significance
Functional target profiling, using a combination of chemical probes, phenotypic screening, and machine learning might fill a translational void that exists in omics and gene editing approaches. In this study, profiling a collection of kinase inhibitors in drug sensitivity assays allowed us to directly and efficiently identify cancer-selective drug targets. The rapid and robust nature of the approach suggests that it will have high utility for identifying the cancer selective targets that could be explored for precision therapy. The robustness of the platform derives from the fact that it identifies targets based on aggregated data from hundreds of compounds, as opposed to other methods that test one gene at a time, making them more susceptible to noise, and false positive hits. In this proof-of-principle study, we efficiently captured breast cancer-selective pharmacological targets, which included both previously known genetic driver kinases as well as kinase dependencies that were not predicted as drivers by genetic means. Applying this approach in the future to ex vivo patient samples may better predict cancer-selective drug targets at an individual patient level, thereby constituting a valuable guide for development of precision medicine approaches and rational design of therapies to suit individual patients’ cancer vulnerabilities.
STAR★Methods
CONTACT FOR REAGENT AND RESOURCE SHARING
Further information and request for the reagents and resources should be directed to and will be fulfilled by the Lead contact, Prson Gautam (prson.gautam@helsinki.fi)
EXPERIMENTAL MODELS AND SUBJECT DETAILS
Cell lines
Human breast cancer cell lines used in this study are listed in Table S1. The cell lines were purchased from ATCC or DSMZ collections and maintained in their respective culture medium at 37°C with 5% CO2 in a humidified incubator, according to provideŕs instructions. DMEM (Cat#12800–058), McCoy (Cat#M9309) and RPMI (Cat#12–167F) media were purchased from Life Technologies, Sigma-Aldrich and Lonza respectively. The identity of all the cell lines used in this study were authenticated using the GenePrint 10 System (Promega) and were tested negative to be mycoplasma free. Mycoplasma test was based on the method described by Choppa et al, 1998 (Vojdani et al., 1998) and was performed as a service by the sample management laboratory of THL Biobank, Helsinki, Finland.
METHOD DETAILS
Inhibitors
Two sets of kinase inhibitors were utilized in this study. The first was the Published Kinase Inhibitor Set (PKIS-1) consisting of 356 compounds (listed in Table S2), which was provided by GlaxoSmithKline (GSK) (Knapp et al., 2013, Drewry et al., 2014). These compounds have previously been target annotated against 200 wild type kinases and 24 mutant kinase variants (Elkins et al., 2016). The compounds were dissolved in DMSO and stored in pressurized Storage Pods (Roylan Developments Ltd.) filled with inert nitrogen gas according to the manufacturer’s instructions.
Second, in-house drug sensitivity data for another set of compounds consisting of 116 kinase inhibitors that had previously target-annotated the same way as the PKIS-1 set was utilized for the analysis ((Gautam et al., 2016, Anastassiadis et al., 2011) Table S3). Beside those 116 kinase inhibitors, four more inhibitors were used in validation experiments, which included two FGFR inhibitors: lucitanib and erdafitinib, and two AKT inhibitors: uprosertib and afuresertib. (Table S3, inhibitors used in validation experiments are highlighted in yellow).
Drug Sensitivity and Resistance Testing
The drug screening and resistance testing platform that has been described previously (Gautam et al., 2016) was applied on the breast cancer cell lines. The compounds were plated to white clear bottom 384-well plates (Corning #3712) in 5 concentrations in 10-fold dilution steps covering a 10,000-fold concentration range (1 nM to 10 μM for PKIS compounds) using an Echo 550 Liquid Handler (Labcyte). Cell killing benzethonium chloride (BzCl, 100 M) and compound vehicle dimethyl sulfoxide (DMSO, 0.1%) were used as positive and negative controls, respectively. All subsequent liquid handling was performed using a MultiDrop dispenser (Thermo Scientific). The pre-dispensed compounds were dissolved in 5 μl of culture media for 30 min at ambient temperature on an orbital shaker. Twenty microliter cell suspension containing optimal number of cells respective to cell lines (defined in Table S1) per well were seeded in the treatment plates. After 72 h incubation, 2.5 μL of viability measurement reagent CellTiter-Blue (Promega) was dispensed in the plates. After incubation for 2 h at 37°C, fluorescence was measured with a PHERAstar FS plate reader (BMG Labtech). Each cell line was screened once.
The raw fluorescence data were analyzed in Breeze software, an in-house developed data analysis and management software, to generate normalized (%cell viability inhibition) data points and dose-response curves. No data points were excluded for the analysis. Drug sensitivity score (DSS), a modified area under the dose-response curve measure was calculated for each drug using the DSSR software package (https://sourceforge.net/projects/dss-calculation/) (Yadav et al., 2014). All DSS values are available in Table S5 and normalized drug screening data used to compute DSS are available in Table S6.
To validate the predicated druggable targets FGFR and AKT, three different compounds for each target (two of which were not included in the target deconvolution analysis; FGFR inhibitors: lucitanib and erdafitinib, AKT inhibitors: uprosertib and afuresertib) were tested (Figure 3 & 4, highlighted yellow in Table S3). The compounds were tested in 6 concentrations with 10-fold dilution steps as described before with a slight modification. Each concentration point was tested in triplicate and cell viability was measured using CellTiter-Glo (Promega) after 72 h of incubation. The drug screening data were normalized to positive and negative controls (BzCl and DMSO respectively) to generate % cell viability inhibition and subsequently mean± SME values were used to generate dose response curves in GraphPad Prism.
siRNA Screening
Silencer Select siRNAs from Ambion were used for this study (Table S4). Kinase-targeting siRNAs along with scrambled non-targeting siRNAs and Allstars Hs Cell Death Control siRNAs (10 nM final concentration, Qiagen) were transferred to 384 well plates (Corning #3712) with an Echo 550 Liquid Handler (Labcyte). Three different siRNAs against each target were pooled together in equal concentrations to obtain final concentration of 10 nM (3.33 nM each). 5 μl of Opti-MEM (Life Technologies, Cat# 31985070) containing 50 nl of Lipofectamine RNAiMAX Transfection Reagent (Life Technologies) was added to each well of plates with pre-dispensed siRNA using a MultiDrop Combi nl dispenser (Thermo Scientific) and incubated at ambient temperature for 20 min on an orbital shaker. Twenty microliters of cell suspension (500 cells per 20 μl) were seeded on the siRNA plate and the plates were maintained in culture for 96 h. The viability of cells after siRNA treatments was assessed with CellTiter-Glo (Promega). The luminescence measurements were converted to percent inhibition compared to the positive and negative controls. The siRNAs screens were performed in 5 technical replicates and their effects were evaluated as mean±SME.
Target deconvolution analysis
Target deconvolution analysis was performed as previously described (Al-Ali et al., 2015). Briefly, cell-based activities, expressed as DSS (Yadav et al., 2014) (Table S5), were used to stratify compounds into one of two classes: hits (DSS ≥ 5) and non-hits (DSS ≤ 0.5). Kinase activity profiles for the stratified compounds were acquired from previously published datasets (Al-Ali et al., 2015, Anastassiadis et al., 2011, Arrowsmith et al., 2015, Davis et al., 2011, Drewry et al., 2017, Drewry et al., 2014), and integrated with additional activity data obtained from PubChem and ChEMBL (http://dx.doi.org/10.6019/CHEMBL1961873). In total, 200 non-mutant kinases were included in the analysis. The mutual information for each kinase within the compound classes was calculated and used to prioritize a subset of potentially relevant target kinases for each cell line (maximum relevance algorithm, MR, (Al-Ali et al., 2015)) A rule-based selection algorithm using support vector machine (SVM) was then used to identify the smallest number of kinases that can predict the hit class of compounds (maximum information set, MAXIS, (Al-Ali et al., 2015)). This analysis was performed 100 times, each time using a different combination of hits and non-hits as the starting set (90% of total, randomly selected, with hits to non-hits ratios preserved). The overall scheme is abbreviated as MR-SVM. In the end, each kinase received a MAXIS score ranging between 0 and 100, reflective of how many times it was selected by the algorithm into MAXIS over the 100 runs. The inhibition bias of each kinase (Bk) by the hits or the non-hits was also quantified using the metric previously described in (Al-Ali et al., 2015). A positive Bk (more inhibition by hits) value suggests that the kinase is a target (inhibition results in the cell viability inhibition), while a negative Bk (more inhibition by non-hits) suggests that the kinase is an anti-target (inhibition results in cell proliferation). The product of MAXIS score and Bk constituted the combined score for every kinase for each cell line. A scaling function was used to adjust combined kinase scores to a range of [-100, +100] and to de-emphasize the scores for low inhibition bias (i.e. to emphasize kinases whose inhibition shows high correlation with cellular outcome). Finally, kinases that have high likelihood of being co-inhibited by the same compounds were grouped into pharmacologically linked groups as previously described (Al-Ali et al., 2015). The MAXIS score and Bk for the groups were calculated as the means of the MAXIS scores and Bks (Table S7) of the individual kinase members, respectively. The combined MAXIS*Bk scores were then used to rank order the groups. The whole process is termed idTRAX (Identification of Drug TaRgets and Anti-targets by Cellular and Molecular Cross-referencing). A high positive MAXIS*Bk score indicates that a group contains one or more targets, while a low negative score indicates that a group contains one or more anti-targets. In this study, we used an implementation of idTRAX generated by Truvitech LLC through a collaboration with the company, though the method can also be recreated from the methods described in Al-Ali et al., 2015 (Al-Ali et al., 2015).
Published Data sets and Analysis
siRNA screening dataset:
Campbell et al (Campbell et al., 2016) performed a kinome-wide plate-array based siRNA screening on a compendium of 115 cancer cell lines to quantify the effect of inhibition of each kinase on the proliferation. Robust z-scores estimating the dependency of each kinase in breast cancer cell lines was extracted from this dataset. Eleven cell lines used in our study were common to Campbell et al study; BT-474, BT-549, CAL-120, CAL-51, DU4475, Hs578T, MDA-MB-231, MDA-MB-436, MDA-MB-453, MFM-223, SK-BR-3.
shRNA screening dataset:
Marcotte et al. (Marcotte et al., 2016) performed a genome-wide shRNA screen on 77 breast cancer cell lines to estimate the dependency of each gene for cell proliferation. Z-scaled Gene Activity Rank Profile (z-GARP scores) of the kinases overlapping with Campbell et al. were extracted from this dataset for comparison. All 19 cell lines used in our study were also shRNA-profiled in the Marcotte et al study.
CRISPR screening dataset:
Meyers et al. (Meyers et al., 2017) performed a genome-wide CRISPR knockout screen on 342 cancer cell lines and applied the CERES algorithm to quantify the gene dependency scores. We extracted the dependency scores for all kinases that were overlapping with the Campbell et al. dataset. Eleven cell lines used in our study were common to Meyers et al study; BT-549, CAL-51, DU4475, HCC1143, HCC1937, Hs578T, MDA-MB-231, MDA-MB-436, MDA-MB-453, MDAMB-468, SK-BR-3.
Analysis methods:
For comparison of the gene dependency scores from each data type, we extracted the data for breast cancer cell lines that were commonly profiled between the aforementioned datasets and restricted the analysis to the kinases which were shared across the all the datasets (Table S8). Spearman rank correlation between the overlapping datasets was calculated for estimating the strength of agreement between each data type. MAXIS*Bk scores were reversed to match the direction of the siRNA, shRNA and CRISPR scores.
QUANTIFICATION AND STATISTICAL ANALYSIS
All the dose-response curves, bar plots and scatter plots were made with GraphPad Prism software and subsequent statistical analysis was also carried out using the same software. One-way ANOVA was performed to test the effect of siRNAs, and Dunnett’s multiple comparison test was performed to evaluate the statistical significance.
DATA AND SOFTWARE AVAILABILITY
All normalized drug screening data is available in Table S5 and S6. All MAXIS*BK scores for the 198 kinases evaluated in the study are listed in Table S7. For calculation of MAXIS*BK scores, we used an implementation of idTRAX generated by Truvitech LLC through a collaboration with the company.
Supplementary Material
Table S1. Related to Figure 2 (STAR Methods Section, EXPERIMENTAL MODELS AND SUBJECT DETAILS, Cell Lines): Information on the cell lines used in the study.
Table S2. (STAR Methods Section, METHOD DETAILS, Inhibitors): List of GSK PIKS compounds used in this study.
Table S3. (STAR Methods Section, METHOD DETAILS, Inhibitors): List of additional 120 well-annotated kinase inhibitors.
Table S4. Related to Figure 3, 4 & 5 (STAR Methods Section, METHOD DETAILS, siRNA Screening): Information on siRNAs used in the study.
Table S5. (STAR Methods Section, METHOD DETAILS, Drug Sensitivity and Resistance Testing): Drug sensitivity score (DSS) calculated for the compounds screened against each cell lines used in the study.
Table S6. (STAR Methods section, METHOD DETAILS, Drug Sensitivity and Resistance Testing): Normalized drug screening data for each compound concentrations tested against 19 breast cancer cell lines.
Table S7. Related to Figure 2, 3, 4, 5 & 6 (STAR Methods Section, METHOD DETAILS, Target deconvolution analysis): MAXIS*BK scores computed for 198 kinases for each cell lines used in the study.
Table S8. Related to Figure 6 (STAR Methods Section, METHOD DETAILS, Published Data sets and Analysis): Compiled file with published Z-GARP score (shRNA data), Z-score (siRNA data), CERES score (CRISPR-CAS9 data) and computed MAXIS*BK score
Highlights.
Efficient AI-driven identification of cancer-selective kinase dependencies
Chemogenomically-identified targets diverge from RNAi/CRISPR-identified targets
Identified targets are readily druggable and suitable for drug development
Strategy potentially applicable to precision cancer therapy
Acknowledgements
We sincerely thank Laura Turunen, Janni Saarela, Karoliina Laamanen and other members of High Throughput Biomedicine unit of the FIMM Technology Centre (supported by University of Helsinki/Biocenter Finland research infrastructure funds) for technical assistance. This project was supported by grants from Academy of Finland (277293, KW), (292611, 295504, 310507, 313267 to TA), Sigrid Juselius Foundation (KW, TA), Cancer Society of Finland (KW, TA, PG), Novo Nordisk Foundation (Novo Nordisk Foundation Center for Stem Cell Biology, DanStem; grant NNF17CC0027852, KW), H.A. was supported by grants from the NIH (1R41TR002293), the Wallace H Coulter Center (University of Miami), and the Miami Project to Cure Paralysis.
Footnotes
Publisher's Disclaimer: This is a PDF file of an unedited manuscript that has been accepted for publication. As a service to our customers we are providing this early version of the manuscript. The manuscript will undergo copyediting, typesetting, and review of the resulting proof before it is published in its final citable form. Please note that during the production process errors may be discovered which could affect the content, and all legal disclaimers that apply to the journal pertain.
Declaration of interests
Hassan Al-Ali is co-founder and Chief Scientific/Operating Officer of Truvitech, LLC, a startup company based on intellectual property used in this study. He is also an inventor on a patent application filed by the University of Miami to cover the target deconvolution method (U.S. Patent Application No. US 15/360,428). Krister Wennerberg and Tero Aittokallio have received research funding from Novartis Pharma AG for projects unrelated to this study. Prson Gautam is funded part-time by Bayer as a study manager trainee.
References
- AL-ALI H, LEE DH, DANZI MC, NASSIF H, GAUTAM P, WENNERBERG K, ZUERCHER B, DREWRY DH, LEE JK, LEMMON VP & BIXBY JL 2015. Rational Polypharmacology: Systematically Identifying and Engaging Multiple Drug Targets To Promote Axon Growth. ACS Chem Biol, 10, 1939–51. [DOI] [PMC free article] [PubMed] [Google Scholar]
- ANASTASSIADIS T, DEACON SW, DEVARAJAN K, MA H & PETERSON JR 2011. Comprehensive assay of kinase catalytic activity reveals features of kinase inhibitor selectivity. Nat Biotechnol, 29, 1039–45. [DOI] [PMC free article] [PubMed] [Google Scholar]
- ARROWSMITH CH, AUDIA JE, AUSTIN C, BAELL J, BENNETT J, BLAGG J, BOUNTRA C, BRENNAN PE, BROWN PJ, BUNNAGE ME, BUSERDOEPNER C, CAMPBELL RM, CARTER AJ, COHEN P, COPELAND RA, CRAVATT B, DAHLIN JL, DHANAK D, EDWARDS AM, FREDERIKSEN M, FRYE SV, GRAY N, GRIMSHAW CE, HEPWORTH D, HOWE T, HUBER KV, JIN J, KNAPP S, KOTZ JD, KRUGER RG, LOWE D, MADER MM, MARSDEN B, MUELLER-FAHRNOW A, MULLER S, O’HAGAN RC, OVERINGTON JP, OWEN DR, ROSENBERG SH, ROTH B, ROSS R, SCHAPIRA M, SCHREIBER SL, SHOICHET B, SUNDSTROM M, SUPERTIFURGA G, TAUNTON J, TOLEDO-SHERMAN L, WALPOLE C, WALTERS MA, WILLSON TM, WORKMAN P, YOUNG RN & ZUERCHER WJ 2015. The promise and peril of chemical probes. Nat Chem Biol, 11, 536–41. [DOI] [PMC free article] [PubMed] [Google Scholar]
- BECK JT, HORTOBAGYI GN, CAMPONE M, LEBRUN F, DELEU I, RUGO HS, PISTILLI B, MASUDA N, HART L, MELICHAR B, DAKHIL S, GEBERTH M, NUNZI M, HENG DY, BRECHENMACHER T, EL-HASHIMY M, DOUMA S, RINGEISEN F & PICCART M 2014. Everolimus plus exemestane as first-line therapy in HR(+), HER2(-) advanced breast cancer in BOLERO-2. Breast Cancer Res Treat, 143, 459–67. [DOI] [PMC free article] [PubMed] [Google Scholar]
- CAMPBELL J, RYAN CJ, BROUGH R, BAJRAMI I, PEMBERTON HN, CHONG IY, COSTA-CABRAL S, FRANKUM J, GULATI A, HOLME H, MILLER R, POSTELVINAY S, RAFIQ R, WEI W, WILLIAMSON CT, QUIGLEY DA, TYM J, ALLAZIKANI B, FENTON T, NATRAJAN R, STRAUSS SJ, ASHWORTH A & LORD CJ 2016. Large-Scale Profiling of Kinase Dependencies in Cancer Cell Lines. Cell Rep, 14, 2490–501. [DOI] [PMC free article] [PubMed] [Google Scholar]
- DAVIS MI, HUNT JP, HERRGARD S, CICERI P, WODICKA LM, PALLARES G, HOCKER M, TREIBER DK & ZARRINKAR PP 2011. Comprehensive analysis of kinase inhibitor selectivity. Nat Biotechnol, 29, 1046–51. [DOI] [PubMed] [Google Scholar]
- DREWRY DH, WELLS CI, ANDREWS DM, ANGELL R, AL-ALI H, AXTMAN AD, CAPUZZI SJ, ELKINS JM, ETTMAYER P, FREDERIKSEN M, GILEADI O, GRAY N, HOOPER A, KNAPP S, LAUFER S, LUECKING U, MICHAELIDES M, MULLER S, MURATOV E, DENNY RA, SAIKATENDU KS, TREIBER DK, ZUERCHER WJ & WILLSON TM 2017. Progress towards a public chemogenomic set for protein kinases and a call for contributions. PLoS One, 12, e0181585. [DOI] [PMC free article] [PubMed] [Google Scholar]
- DREWRY DH, WILLSON TM & ZUERCHER WJ 2014. Seeding collaborations to advance kinase science with the GSK Published Kinase Inhibitor Set (PKIS). Curr Top Med Chem, 14, 340–2. [DOI] [PMC free article] [PubMed] [Google Scholar]
- ELKINS JM, FEDELE V, SZKLARZ M, ABDUL AZEEZ KR, SALAH E, MIKOLAJCZYK J, ROMANOV S, SEPETOV N, HUANG XP, ROTH BL, AL HAJ ZEN A, FOURCHES D, MURATOV E, TROPSHA A, MORRIS J, TEICHER BA, KUNKEL M, POLLEY E, LACKEY KE, ATKINSON FL, OVERINGTON JP, BAMBOROUGH P, MULLER S, PRICE DJ, WILLSON TM, DREWRY DH, KNAPP S & ZUERCHER WJ 2016. Comprehensive characterization of the Published Kinase Inhibitor Set. Nat Biotechnol, 34, 95–103. [DOI] [PubMed] [Google Scholar]
- FINK LS, BEATTY A, DEVARAJAN K, PERI S & PETERSON JR 2015. Pharmacological profiling of kinase dependency in cell lines across triple-negative breast cancer subtypes. Mol Cancer Ther, 14, 298–306. [DOI] [PMC free article] [PubMed] [Google Scholar]
- GAUTAM P, KARHINEN L, SZWAJDA A, JHA SK, YADAV B, AITTOKALLIO T & WENNERBERG K 2016. Identification of selective cytotoxic and synthetic lethal drug responses in triple negative breast cancer cells. Mol Cancer, 15, 34. [DOI] [PMC free article] [PubMed] [Google Scholar]
- KATSUMI Y, HONMA T & NAKAMURA T 1989. Analysis of cervical instability resulting from laminectomies for removal of spinal cord tumor. Spine (Phila Pa 1976), 14, 1171–6. [DOI] [PubMed] [Google Scholar]
- KLAEGER S, HEINZLMEIR S, WILHELM M, POLZER H, VICK B, KOENIG PA, REINECKE M, RUPRECHT B, PETZOLDT S, MENG C, ZECHA J, REITER K, QIAO H, HELM D, KOCH H, SCHOOF M, CANEVARI G, CASALE E, DEPAOLINI SR, FEUCHTINGER A, WU Z, SCHMIDT T, RUECKERT L, BECKER W, HUENGES J, GARZ AK, GOHLKE BO, ZOLG DP, KAYSER G, VOODER T, PREISSNER R, HAHNE H, TONISSON N, KRAMER K, GOTZE K, BASSERMANN F, SCHLEGL J, EHRLICH HC, AICHE S, WALCH A, GREIF PA, SCHNEIDER S, FELDER ER, RULAND J, MEDARD G, JEREMIAS I, SPIEKERMANN K & KUSTER B 2017. The target landscape of clinical kinase drugs. Science, 358. [DOI] [PMC free article] [PubMed] [Google Scholar]
- KNAPP S, ARRUDA P, BLAGG J, BURLEY S, DREWRY DH, EDWARDS A, FABBRO D, GILLESPIE P, GRAY NS, KUSTER B, LACKEY KE, MAZZAFERA P, TOMKINSON NC, WILLSON TM, WORKMAN P & ZUERCHER WJ 2013. A public-private partnership to unlock the untargeted kinome. Nat Chem Biol, 9, 3–6. [DOI] [PubMed] [Google Scholar]
- KNIGHT ZA, LIN H & SHOKAT KM 2010. Targeting the cancer kinome through polypharmacology. Nat Rev Cancer, 10, 130–7. [DOI] [PMC free article] [PubMed] [Google Scholar]
- LEHMANN BD, BAUER JA, CHEN X, SANDERS ME, CHAKRAVARTHY AB, SHYR Y & PIETENPOL JA 2011. Identification of human triple-negative breast cancer subtypes and preclinical models for selection of targeted therapies. J Clin Invest, 121, 2750–67. [DOI] [PMC free article] [PubMed] [Google Scholar]
- MANNING G, WHYTE DB, MARTINEZ R, HUNTER T & SUDARSANAM S 2002. The protein kinase complement of the human genome. Science, 298, 1912–34. [DOI] [PubMed] [Google Scholar]
- MARCOTTE R, SAYAD A, BROWN KR, SANCHEZ-GARCIA F, REIMAND J, HAIDER M, VIRTANEN C, BRADNER JE, BADER GD, MILLS GB, PE’ER D, MOFFAT J & NEEL BG 2016. Functional Genomic Landscape of Human Breast Cancer Drivers, Vulnerabilities, and Resistance. Cell, 164, 293–309. [DOI] [PMC free article] [PubMed] [Google Scholar]
- MEYERS RM, BRYAN JG, MCFARLAND JM, WEIR BA, SIZEMORE AE, XU H, DHARIA NV, MONTGOMERY PG, COWLEY GS, PANTEL S, GOODALE A, LEE Y, ALI LD, JIANG G, LUBONJA R, HARRINGTON WF, STRICKLAND M, WU T, HAWES DC, ZHIVICH VA, WYATT MR, KALANI Z, CHANG JJ, OKAMOTO M, STEGMAIER K, GOLUB TR, BOEHM JS, VAZQUEZ F, ROOT DE, HAHN WC & TSHERNIAK A 2017. Computational correction of copy number effect improves specificity of CRISPR-Cas9 essentiality screens in cancer cells. Nat Genet, 49, 1779–1784. [DOI] [PMC free article] [PubMed] [Google Scholar]
- MULLER S, ACKLOO S, ARROWSMITH CH, BAUSER M, BARYZA JL, BLAGG J, BOTTCHER J, BOUNTRA C, BROWN PJ, BUNNAGE ME, CARTER AJ, DAMERELL D, DOTSCH V, DREWRY DH, EDWARDS AM, EDWARDS J, ELKINS JM, FISCHER C, FRYE SV, GOLLNER A, GRIMSHAW CE, A IJ, HANKE T, HARTUNG IV, HITCHCOCK S, HOWE T, HUGHES TV, LAUFER S, LI VM, LIRAS S, MARSDEN BD, MATSUI H, MATHIAS J, O’HAGAN RC, OWEN DR, PANDE V, RAUH D, ROSENBERG SH, ROTH BL, SCHNEIDER NS, SCHOLTEN C, SINGH SAIKATENDU K, SIMEONOV A, TAKIZAWA M, TSE C, THOMPSON PR, TREIBER DK, VIANA AY, WELLS CI, WILLSON TM, ZUERCHER WJ, KNAPP S & MUELLER-FAHRNOW A 2018. Donated chemical probes for open science. Elife, 7. [DOI] [PMC free article] [PubMed] [Google Scholar]
- RASK-ANDERSEN M, ZHANG J, FABBRO D & SCHIOTH HB 2014. Advances in kinase targeting: current clinical use and clinical trials. Trends Pharmacol Sci, 35, 604–20. [DOI] [PubMed] [Google Scholar]
- SCHWARTZBERG LS, FRANCO SX, FLORANCE A, O’ROURKE L, MALTZMAN J & JOHNSTON S 2010. Lapatinib plus letrozole as first-line therapy for HER-2+ hormone receptor-positive metastatic breast cancer. Oncologist, 15, 122–9. [DOI] [PMC free article] [PubMed] [Google Scholar]
- SHERRILL B, AMONKAR MM, SHERIF B, MALTZMAN J, O’ROURKE L & JOHNSTON S 2010. Quality of life in hormone receptor-positive HER-2+ metastatic breast cancer patients during treatment with letrozole alone or in combination with lapatinib. Oncologist, 15, 944–53. [DOI] [PMC free article] [PubMed] [Google Scholar]
- TANG J, TANOLI ZU, RAVIKUMAR B, ALAM Z, REBANE A, VAHA-KOSKELA M, PEDDINTI G, VAN ADRICHEM AJ, WAKKINEN J, JAISWAL A, KARJALAINEN E, GAUTAM P, HE L, PARRI E, KHAN S, GUPTA A, ALI M, YETUKURI L, GUSTAVSSON AL, SEASHORE-LUDLOW B, HERSEY A, LEACH AR, OVERINGTON JP, REPASKY G, WENNERBERG K & AITTOKALLIO T 2018. Drug Target Commons: A Community Effort to Build a Consensus Knowledge Base for Drug-Target Interactions. Cell Chem Biol, 25, 224–229 e2. [DOI] [PMC free article] [PubMed] [Google Scholar]
- VOJDANI A, CHOPPA PC, TAGLE C, ANDRIN R, SAMIMI B & LAPP CW 1998. Detection of Mycoplasma genus and Mycoplasma fermentans by PCR in patients with Chronic Fatigue Syndrome. FEMS Immunol Med Microbiol, 22, 355–65. [DOI] [PubMed] [Google Scholar]
- WEISS WA, TAYLOR SS & SHOKAT KM 2007. Recognizing and exploiting differences between RNAi and small-molecule inhibitors. Nat Chem Biol, 3, 739–44. [DOI] [PMC free article] [PubMed] [Google Scholar]
- WU P, NIELSEN TE & CLAUSEN MH 2015. FDA-approved small-molecule kinase inhibitors. Trends Pharmacol Sci, 36, 422–39. [DOI] [PubMed] [Google Scholar]
- WU P, NIELSEN TE & CLAUSEN MH 2016. Small-molecule kinase inhibitors: an analysis of FDA-approved drugs. Drug Discov Today, 21, 5–10. [DOI] [PubMed] [Google Scholar]
- YADAV B, PEMOVSKA T, SZWAJDA A, KULESSKIY E, KONTRO M, KARJALAINEN R, MAJUMDER MM, MALANI D, MURUMAGI A, KNOWLES J, PORKKA K, HECKMAN C, KALLIONIEMI O, WENNERBERG K & AITTOKALLIO T 2014. Quantitative scoring of differential drug sensitivity for individually optimized anticancer therapies. Sci Rep, 4, 5193. [DOI] [PMC free article] [PubMed] [Google Scholar]
- YANG H, QIN C, LI YH, TAO L, ZHOU J, YU CY, XU F, CHEN Z, ZHU F & CHEN YZ 2016. Therapeutic target database update 2016: enriched resource for bench to clinical drug target and targeted pathway information. Nucleic Acids Res, 44, D1069–74. [DOI] [PMC free article] [PubMed] [Google Scholar]
Associated Data
This section collects any data citations, data availability statements, or supplementary materials included in this article.
Supplementary Materials
Table S1. Related to Figure 2 (STAR Methods Section, EXPERIMENTAL MODELS AND SUBJECT DETAILS, Cell Lines): Information on the cell lines used in the study.
Table S2. (STAR Methods Section, METHOD DETAILS, Inhibitors): List of GSK PIKS compounds used in this study.
Table S3. (STAR Methods Section, METHOD DETAILS, Inhibitors): List of additional 120 well-annotated kinase inhibitors.
Table S4. Related to Figure 3, 4 & 5 (STAR Methods Section, METHOD DETAILS, siRNA Screening): Information on siRNAs used in the study.
Table S5. (STAR Methods Section, METHOD DETAILS, Drug Sensitivity and Resistance Testing): Drug sensitivity score (DSS) calculated for the compounds screened against each cell lines used in the study.
Table S6. (STAR Methods section, METHOD DETAILS, Drug Sensitivity and Resistance Testing): Normalized drug screening data for each compound concentrations tested against 19 breast cancer cell lines.
Table S7. Related to Figure 2, 3, 4, 5 & 6 (STAR Methods Section, METHOD DETAILS, Target deconvolution analysis): MAXIS*BK scores computed for 198 kinases for each cell lines used in the study.
Table S8. Related to Figure 6 (STAR Methods Section, METHOD DETAILS, Published Data sets and Analysis): Compiled file with published Z-GARP score (shRNA data), Z-score (siRNA data), CERES score (CRISPR-CAS9 data) and computed MAXIS*BK score
Data Availability Statement
All normalized drug screening data is available in Table S5 and S6. All MAXIS*BK scores for the 198 kinases evaluated in the study are listed in Table S7. For calculation of MAXIS*BK scores, we used an implementation of idTRAX generated by Truvitech LLC through a collaboration with the company.