

Abstract
Aminolevulinic acid (ALA) is a prodrug that is metabolized in the heme biosynthesis pathway to produce protoporphyrin IX (PpIX) for tumor fluorescence detection and photodynamic therapy (PDT). The iron chelator deferoxamine (DFO) has been widely used to enhance PpIX accumulation by inhibiting the iron-dependent bioconversion of PpIX to heme, a reaction catalyzed by ferrochelatase (FECH). Tumor response to DFO treatment is known to be highly variable and some tumors even show no response. Given the fact that tumors often exhibit reduced FECH expression/enzymatic activity, we examined how reducing FECH level affected the DFO enhancement effect. Our results showed that reducing FECH level by silencing FECH in SkBr3 breast cancer cells completely abrogated the enhancement effect of DFO. Although DFO enhanced ALA-PpIX fluorescence and PDT response in SkBr3 vector control cells, it caused a similar increase in MCF10A breast epithelial cells, resulting in no net gain in the selectivity towards tumor cells. We also found that DFO treatment induced less increase in ALA-PpIX fluorescence in tumor cells with lower FECH activity (MDA-MB-231, Hs 578T) than in tumor cells with higher FECH activity (MDA-MB-453). Our study demonstrates that FECH activity is an important determinant of tumor response to DFO treatment.
Keywords: Aminolevulinic acid (ALA), protoporphyrin IX (PpIX), photodynamic therapy (PDT), ferrochelatase (FECH), deferoxamine (DFO), Iron chelators
Graphical Abstract
Iron chelator deferoxamine (DFO) significantly augmented ALA-mediated PpIX fluorescence and PDT response in MCF10A breast epithelial cells and SkBr3 breast cancer cells. Reducing FECH level by silencing FECH expression completely abolished the enhancement effect of DFO.
INTRODUCTION
Aminolevulinic acid (ALA) and its ester derivatives are clinically used for superficial skin cancers and are currently under clinical investigation for other types of cancers including breast, lung and esophageal cancers (1). As a prodrug, ALA and its derivatives are metabolically converted to protoporphyrin IX (PpIX), a porphyrin metabolite with red fluorescence and photosensitizing activity upon light exposure, in the heme biosynthesis pathway. Preferential ALA-mediated PpIX production in tumor tissues followed by aimed light activation leads to selective tumor destruction by photodynamic therapy (PDT), a treatment modality combining the use of a photosensitizer and laser light illumination to induce oxidative tissue damage (2). The bright red fluorescence of PpIX enables the use of ALA for PpIX fluorescence-guided tumor resection. This application has been well demonstrated in the resection of brain and bladder tumors with improved resection rates and better surgical outcomes (3–5). As an intraoperative imaging probe, ALA has been approved in Europe and was recently approved by the US FDA for guiding brain tumor resection.
However, clinical application of ALA can be hampered by insufficient and heterogeneous PpIX production in the target tissue (6). Tumor PpIX level is known to vary greatly after ALA application, which causes a significant variation in PDT response (7–9). Low or variable PpIX fluorescence also reduces the chance of complete tumor removal in PpIX fluorescence-guided tumor resection (10, 11). To enhance PpIX fluorescence, strategies including increasing PpIX biosynthesis, reducing PpIX bioconversion and inhibiting PpIX efflux have been evaluated (12). As an intermediate metabolite in the heme biosynthesis pathway, PpIX is further converted to heme, which itself has neither fluorescence nor photosensitizing activity (13). This bioconversion is catalyzed by ferrochelatase (FECH), the terminal enzyme in the pathway that inserts ferrous iron (Fe2+) into PpIX to produce heme. Genetic silencing of FECH has been shown to increase ALA-PpIX fluorescence and PDT response both in vitro (14–17) and in vivo (18), indicating that inhibition of PpIX bioconversion can be an effective strategy for enhancing ALA applications.
Pharmacological inhibition of the conversion of PpIX to heme includes the use of FECH inhibitors (19, 20) or, more commonly, iron chelators (21). By removing the labile iron, chelators reduce the substrate concentration and therefore inhibit the conversion of PpIX to heme. Prolonged application of iron chelation may lead to a direct inhibition of FECH activity by reducing the biosynthesis of [2Fe-2S] clusters, an important iron-containing functional unit of FECH (22). Ethylenediaminetetraacetic acid (EDTA) was the first chelator shown to enhance ALA-PpIX fluorescence in vitro (23, 24). More lipophilic chelators such as deferoxamine (DFO) (25) and CP94 (26) increased ALA-PpIX fluorescence with greater efficacy possibly due to increased cell membrane permeation. However, clinical studies of chelators have yielded mixed results. Both EDTA (27) and DFO (7) did not increase ALA-PpIX fluorescence in human skin tumors, but CP94 was shown to improve ALA-PDT response in skin cancer patients (28). The reason for such discrepancies is not known.
FECH is known to exhibit reduced expression/enzymatic activity in a variety of tumors including liver (29), gastric (14), and colorectal (30, 14) cancers. According to Human Protein Atlas, weak FECH protein level has also been detected in breast, pancreatic, and skin cancers with some cancer tissues even exhibiting a negative staining (https://www.proteinatlas.org). How reduced FECH expression affects the efficacy of chelators for the enhancement of ALA-PpIX/PDT has never been studied. To answer this question, we knocked down FECH in SkBr3 human breast cancer cells to generate FECH-deficient cells. We evaluated PpIX fluorescence and PDT response in vector control and FECH-knockdown SkBr3 cells as well as MCF10A breast epithelial cells after treatment with ALA alone or in combination with iron chelator DFO. We found that FECH knockdown significantly increased ALA-PpIX fluorescence and PDT response in SkBr3 cells. Treatment with DFO effectively enhanced ALA-PpIX fluorescence and PDT response in MCF10A and vector control SkBr3 cells, but not in FECH-knockdown SkBr3 cell lines. Similarly, breast cancer cell lines with lower FECH activity (e.g., MDA-MB-231 and Hs-578T) showed less ALA-PpIX fluorescence increase after DFO treatment than breast cancer cells with higher FECH activity (e.g., MDA-MB-453). Our study indicates that FECH activity is important for determining the enhancement effect of iron chelator DFO, and cells with low FECH activity are less likely to benefit from DFO treatment.
MATERIALS & METHODS
Chemicals.
Delta-aminolevulinic acid hydrochloride (ALA) from Frontier Scientific Inc. (Logan, UT) was dissolved in phosphate buffered saline (PBS) solution. Deferoxamine (DFO) from Sigma (St. Louis, MO) was dissolved in DMSO. All chemicals were sterilized through 0.22-µm filters and stored in a −20°C freezer.
Cell culture.
MCF10A human breast epithelial cells (ATCC, Manassas, VA) were maintained in Dulbecco’s Modified Eagle Medium (DMEM)/Ham’s F-12 (50/50) medium supplemented with 5% horse serum (Atlanta Biologicals, Flowery Branch, GA), insulin (10 μg mL−1), epidermal growth factor (20 ng mL−1), cholera toxin (100 ng mL−1), hydrocortisone (0.5 μg mL−1), and 1% antibiotics (penicillin & streptomycin) and antimycotics (amphotericin B) solution (Mediatech, Manassas, VA). SkBr3, MDA-MB-453, MCF-7, MDA-MB-231 and Hs 578T human breast cancer cells (ATCC) were routinely maintained in complete Dulbecco’s Modified Eagle Medium (DMEM) supplemented with 9% fetal bovine serum (Atlanta Biologicals) and 1% penicillin and streptomycin solution. All cell culture media were purchased from Mediatech (Manassas, VA). Cells were cultured at 37°C in a humidified 5% CO2 incubator.
FECH silence by lentiviral shRNA.
SkBr3 cells were transduced with human pLKO.1 lentiviral shRNAs purchased from Open Biosystems (Lafayette, CO) to silence FECH expression. To increase knockdown efficiency and avoid off-target effect, five different shRNA variants were evaluated. The sequence of shRNA variants are shFECH1 (GCTTTGCAGATCATATTCTAA), shFECH2 (CCAAGGAGTGTGGAGTTGAAA), shFECH3 (GCTATTGCTTTCACACAGTAT), shFECH4 (GACCATATTGAAACGCTGTAT) and shFECH5 (CAGGGAGACTAAATCCTTCTT). Lentiviruses were prepared by transient co-transfection of lentiviral vector encoding shRNA targeting sequence with viral packaging vectors into HEK 293T cells using calcium phosphate precipitation according to the manufacturer’s instruction. Briefly, HEK 293T cells were incubated with FECH shRNA or GFP shRNA (for vector control) and viral packaging vectors in complete DMEM at 37°C for 6 h. After shRNA containing media were removed, cells were incubated with fresh DMEM for another 36 h. Media were then collected and filtered through 0.45-µm filters to obtain virus particles. SkBr3 cells were infected at approximately 70% confluence in complete DMEM supplemented with 8 µg/mL of polybrene. After 48 h incubation, the medium was changed to complete DMEM. FECH silencing efficiency was verified by Western blot.
Western blot.
Cells were lysed at 70–80% confluency in NP40 lysis buffer supplemented with protease and phosphatase inhibitors as described previously (31). Cell lysates were separated by sodium dodecyl sulfate polyacrylamide gel electrophoresis (SDS-PAGE) and electrophoretically transferred to polyvinylidene fluoride (PVDF) membranes (Millipore). Blots were incubated with primary antibodies for heme biosynthesis enzymes including ALA synthase (ALAS-H, Cat No. sc-365153), porphobilinogen synthase (PBGS, Cat No. sc-271585), porphobilinogen deaminase (PBGD, Cat No. sc-166788), uroporphyrinogen III synthase (UROS, Cat No. sc-365120), uroporphyrinogen III decarboxylase (UROD, Cat No. sc-365297), coproporphyrinogen III oxidase (CPOX, Cat No. sc-99858), protoporphyrinogen IX oxidase (PPOX, Cat No. sc-271768), FECH (Cat No. ab137042) and heme degradation enzyme heme oxygenase (HO-1, Cat No. sc-10789). Except for the FECH antibody (from Abcam, Cambridge, MA), all other heme enzyme antibodies were purchased from Santa Cruz Biotechnology (Dallas, TX). After the incubation with horseradish peroxidase-conjugated secondary antibody (Cell Signaling, Danvers, MA), immunoblots were incubated with SuperSignal West Dura extended duration substrate (Thermo Scientific) and immunoreactive bands were captured with GE Amersham Imager 600 (GE Healthcare Bio-Sciences, Piscataway, NJ). The band density of different heme enzymes and loading control (actin) was quantified with NIH ImageJ software and normalized to the intensity of corresponding enzymes in vector control cells.
Spectrofluorometric analysis.
Cells were implanted in 6-well cell culture plates in complete medium and allowed to grow for two days. Cells were treated with ALA alone, DFO alone or ALA combined with DFO in the complete medium for 4 h. After the drug-containing medium was removed, cells were rinsed with PBS and lysed in 1% SDS solution. Cell lysates were collected and centrifuged to obtain supernatants. Fluorescence emission spectra of supernatants were measured with Fluoromax-3 fluorescence spectrometer (Horiba JY, Edison, NJ) with excitation wavelength at 400 ± 2.5 nm.
Confocal microscopic imaging.
Cells were implanted in glass bottom cell culture dishes (MatTek, Ashland, MA) and allowed to grow for two days. Cells were treated with or without ALA (1 mM) in serum-free DMEM medium for 4 h. After ALA-containing media were removed, cells were rinsed with PBS twice and incubated in serum free DMEM medium for confocal imaging. Live-cell imaging was performed on a Nikon TiE (Eclipse) confocal microscope using a 60× 1.40 NA oil immersion objective as described previously (32). PpIX fluorescence was imaged with 405 nm excitation, 700 ± 37.5 nm emission and an exposure time of 500 ms. Differential interference contrast (DIC) images were acquired using exposure times in the range of 100 to 200 ms at the same magnification.
Flow cytometry.
Cells were implanted in 60-mm dishes and allowed to grow for two days. Cells were incubated with complete media containing no drug (for control), ALA alone, DFO alone or ALA combined with DFO for 4 h. After the incubation, cells were rinsed with PBS, trypsinized and suspended in PBS. Cell suspensions were centrifuged and cell pellets were re-suspended in fresh PBS. PpIX fluorescence was measured with a FACSCalibur flow cytometer (BD Biosciences) in the FL3 channel (488 nm excitation, 650 nm long-pass emission). About 20,000 cells were measured and recorded for each experiment. Experiments were repeated at least three times.
PDT treatment & cytotoxicity assay.
Cells were implanted in 96-well plates and allowed to grow for two days to reach around 70% confluency. Cells were incubated with complete medium containing no drug (for control), ALA alone, DFO alone or ALA in combination with DFO for 4 h. Cells were then treated with 5 mW/cm2 irradiance of 633 nm light for 10 min, which results in a light fluence of 3.0 J/cm2. Light illumination was provided by a diode laser system (High Power Devices Inc., North Brunswick, NJ) coupled to a 600 µm core diameter optical fiber fitted with a microlens at the end of fiber to achieve homogeneous irradiation. Light intensity was measured with an optical power meter (Thorlabs, Inc., North Newton, NJ). Immediately after light treatment, drug-containing media were replaced with fresh media. Cell viability was determined at 24 h after treatment by CellTiter 96 Aqueous Non-Radioactive Cell Proliferation Assay (MTS assay, Promega, Madison, WI) following manufacturer’s instruction. Experiments were repeated at least three times.
FECH activity assay.
FECH activity was determined as described with modification (14). About 2 million cells were lysed with 0.1% Triton X-100 in PBS containing 200 µM palmitic acid. After centrifugation at 900 × g for 10 min, cell lysates were taken and incubated with 100 nM PpIX and 5 µM zinc acetate for 10 min at 37°C. The resultant zinc protoporphyrin IX (Zn PpIX) was detected with Fluoromax-3 fluorescence spectrometer with 400 ± 2.5 nm excitation. Zn PpIX fluorescence (emission at 590 nm-550 nm) was quantified using the Zn PpIX standard curve. FECH activity was expressed as the amount of Zn PpIX produced by one gram of cell lysate protein per minute (nmol/g protein/min).
Statistical analysis.
One-way or two-way ANOVA with posttests were used to determine statistical differences between groups and statistical significance was accepted at P < 0.05. Statistical analysis was performed using GraphPad Prism software (La Jolla, CA).
RESULTS
FECH knockdown resulted in PpIX accumulation in SkBr3 cells
FECH was silenced in SkBr3 cells using five shRNA variants targeting different FECH gene sequences. Western blots were performed to examine the protein level of heme biosynthesis enzymes including ALAS-H, PBGS, PBGD, UROS, UROD, CPOX, PPOX, FECH, and heme degradation enzyme HO-1 in vector control and five FECH-knockdown cell lines (Figure 1A). ALAS-H is the first and rate-limiting enzyme in the pathway that catalyzes the formation of ALA from glycine and succinyl coenzyme A (13). Quantification of Western blot bands showed a significant difference in ALAS-H (Figure 1B) and FECH (Figure 1C) levels between FECH-knockdown cell lines and vector control cells. Compared with vector control cells, FECH protein levels in shFECH1–5 cells were reduced to about 22%, 26%, 21%, 4% and 8%, respectively. The level of ALAS-H was significantly increased in shFECH4 and 5 cells and a trend of increase was also seen in shFECH1–3 cell lines. The silence of FECH resulted in PpIX accumulation in SkBr3 cells, as indicated by the characteristic PpIX fluorescence emission detected in the cell lysates of all knockdown cell lines but not in vector control cell lysate (Figure 1D). Incubation with ALA induced PpIX fluorescence in vector control cells and caused greater PpIX accumulation in FECH-knockdown cells (Figure 1E), further demonstrating that PpIX was the predominant porphyrin metabolite in FECH-knockdown cells. Although some porphyrin metabolites such as uroporphyrins and coproporphyrins are also fluorescent, the maximum emission wavelengths of these porphyrins are about 10 nm less than the peak emission wavelength of PpIX (see Supporting Information). In agreement with spectrofluorometric measurements, confocal microscopic imaging showed a detectable PpIX fluorescence in FECH-knockdown cells without ALA (shFECH4 and 5 in particular), but not in vector cells (Figure 2). Stimulation with ALA resulted in increased fluorescence in both vector control and FECH-knockdown cells.
Figure 1.
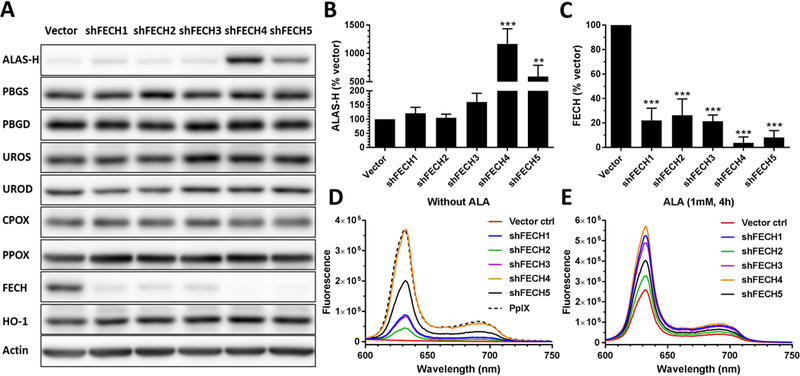
FECH knockdown resulted in the accumulation of PpIX. (A) Western blot images showing the level of heme biosynthesis enzymes in vector control and FECH-knockdown SkBr3 cells. (B, C) The band intensity of ALAS-H (B) and FECH (C) was quantified and shown (n=3). Bars represent the standard deviation (SD). ** P < 0.01, *** P < 0.001, compared with vector control. (D, E) Fluorescence emission spectra of PpIX standard (125 ng/mL) and cell lysates without (D) or with (E) ALA (1 mM for 4 h). All fluorescence spectra were measured using 400 ± 2.5 nm excitation.
Figure 2.

Confocal microscopic images of PpIX fluorescence and corresponding DIC. Cells with or without ALA (1 mM, 4 h) stimulation were imaged with a confocal microscope. Fluorescence images of vector control and shFECH1–3 without ALA were adjusted to the same background level in order to make fluorescence in shFECH1–3 cells visible. All other fluorescence images were not adjusted. Bars, 20 µm.
FECH knockdown increased PpIX fluorescence and ALA-PDT response in SkBr3 cells
The PpIX fluorescence intensity with or without ALA stimulation in vector control and FECH-knockdown cells was measured by flow cytometry (Figure 3A). Knockdown of FECH caused a significant increase in the basal PpIX fluorescence intensity (P < 0.05, Figure 3B). With the lowest FECH level, shFECH4 cells exhibited the highest basal PpIX fluorescence, and shFECH5 cells, with the second lowest FECH level, exhibited the second highest basal PpIX fluorescence. A similar basal fluorescence was detected in shFECH1–3 cell lines that had a similar level of FECH protein. ALA stimulation induced a dose-dependent increase in PpIX fluorescence in both vector control and FECH-knockdown cells. Compared with vector control cells, PpIX fluorescence in FECH-knockdown cells increased more sharply with the initial increase of ALA dose (0.05, 0.1 and 0.2 mM) and reached a plateau at a lower ALA dose. Two-way ANOVA test indicates that shFECH4 cells had a significantly higher PpIX fluorescence than other knockdown cells at all ALA doses (P < 0.001), and all FECH-knockdown cell lines exhibited a significantly higher PpIX fluorescence than vector control cells after incubation with ALA doses ranging from 0.1–2.0 mM (P < 0.05).
Figure 3.

FECH knockdown enhanced PpIX fluorescence and ALA-PDT response. (A) Cells were incubated with or without ALA for 4 h and PpIX fluorescence was measured with a flow cytometer (n=3). Basal fluorescence without ALA is shown in (B). Bars represent SD. * P < 0.05, *** P < 0.001, compared with vector control by one-way ANOVA. (C) Cell viability after ALA-PDT. Cells were incubated with different doses of ALA for 4 h and treated with 3 J/cm2 light of 633 nm. Cell viability was determined by the MTS assay at 24 h after treatment and presented as a percentage of untreated dark control in the corresponding cell line (n=3). Bars represent SD.
Light treatment (633 nm, 3 J/cm2) alone (without ALA) caused a slight decrease in cell viability in shFECH4 and 5 cells, but not in other cell lines (Figure 3C). ALA alone (without light) at a dose range of 0.1 to 4.0 mM had no significant effect on cell viability in all cell lines (data not shown). ALA-PDT induced a dose-dependent decrease in cell viability in both vector control and FECH-knockdown cells. However, cell viability appeared to decrease more rapidly in FECH-knockdown cells than in vector control cells after PDT with increasing doses of ALA. Two-way ANOVA test indicates that shFECH4 cells were more sensitive to ALA-PDT than other knockdown cells at all ALA doses (P < 0.05), and all FECH-knockdown cell lines showed a higher response to PDT than vector control cells at ALA doses ranging from 0.5–4.0 mM (P < 0.01).
Treatment with DFO increased ALA-PpIX fluorescence in SkBr3 and MCF10A cells, but not in FECH-knockdown cell lines
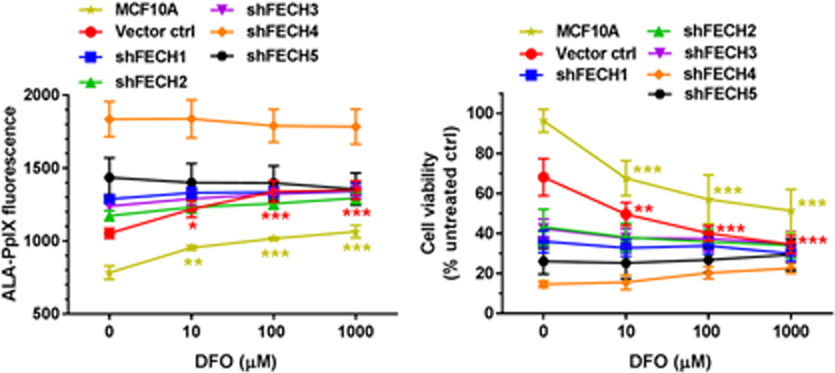
Effects of iron chelator DFO on ALA-PpIX fluorescence emission were examined with a spectrofluorometer in MCF10A, FECH-knockdown and vector control SkBr3 cells. Typical PpIX fluorescence spectra were detected in the lysates of all cell lines treated with ALA alone or ALA in combination with different doses of DFO, confirming that PpIX is the major porphyrin metabolite after DFO treatment (see Supporting Information). Effects of DFO on ALA-PpIX fluorescence were quantified with flow cytometry and shown in Figure 4. At doses of 10, 100 and 1000 µM, DFO significantly increased ALA-PpIX fluorescence in MCF10A and SkBr3 vector control cells (Figure 4A, 4B). However, DFO treatment had no significant effect on ALA-PpIX fluorescence in all FECH-knockdown SkBr3 cell lines. To indicate the PpIX fluorescence ratio between SkBr3 and MCF10A cells after DFO treatment, the fluorescence intensity of vector control cells and FECH-knockdown SkBr3 cells was divided by that of MCF10A cells. Treatment with DFO did not change the PpIX fluorescence ratio in SkBr3 vector control cells, which maintained at about 1.3 regardless of DFO treatment (Figure 4C). However, DFO treatment caused a significant reduction in the PpIX fluorescence ratio in all FECH-knockdown SkBr3 cell lines (P < 0.05).
Figure 4.

Effects of DFO on ALA-PpIX fluorescence. Cells were incubated with ALA (1 mM) alone or in combination with DFO for 4 h. (A) PpIX fluorescence was measured with a flow cytometer and shown. (B) PpIX fluorescence intensity after ALA in combination with DFO was normalized to the fluorescence intensity after ALA treatment alone to show the percent change caused by DFO treatment. (C) PpIX fluorescence intensity of vector control and FECH-knockdown SkBr3 cells was divided by the fluorescence intensity of MCF10A cells to show the fluorescence ratio. Compared with the corresponding ALA treatment alone, DFO caused a significant decrease in the PpIX fluorescence ratio in all FECH-knockdown cell lines (Asterisks are not shown in the figure for clarity). Data are presented as mean ± SD from 3 or 4 experiments. ** P < 0.01, *** P < 0.001, compared with the corresponding ALA treatment alone.
Treatment with DFO increased ALA-PDT response in SkBr3 and MCF10A cells, but not in FECH-knockdown SkBr3 cell lines
Effects of DFO on cell viability reduction induced by ALA-PDT were examined. ALA-PDT alone significantly reduced cell viability in vector control and FECH-knockdown SkBr3 cells, but it did not decrease cell viability in MCF10A cells (Figure 5A). DFO treatment sensitized MCF10A and SkBr3 vector control cells to ALA-PDT, resulting in a greater reduction in cell viability. However, it had no significant effect on ALA-PDT in all FECH-knockdown cell lines. To indicate treatment selectivity toward tumor cells, a selectivity index was calculated by dividing the cell viability of MCF10A cells by the tumor cell survival after ALA-PDT alone or in combination with DFO. A treatment that selectively reduces tumor cell viability without decreasing normal cell survival would lead to a high selectivity index. Treatment with DFO did not change the selectivity index of ALA-PDT in vector control SkBr3 cells (Figure 5B), but it reduced the selectivity index in all FECH-knockdown cells particularly in shFECH4 and 5 cells. The dark toxicity of ALA alone, DFO alone, and ALA in combination with DFO is shown in Figure 5C. Neither ALA alone nor DFO alone in dark caused any significant decrease in cell viability. ALA combined with 1000 µM DFO induced a slight reduction in cell viability in all FECH-knockdown cell lines.
Figure 5.

Effects of DFO on ALA-PDT response. Cells were incubated with ALA (1 mM) alone or in combination with DFO for 4 h and treated with 3 J/cm2 light of 633 nm. (A) Cell viability was determined by the MTS assay at 24 h after treatment and presented as a percentage of untreated dark control in the corresponding cell line (A). PDT selectivity index was calculated by dividing the cell viability of MCF10A cells by the viability of tumor cells (B). ** P < 0.01, *** P < 0.001, compared with the corresponding ALA treatment alone. (C) Dark toxicity of ALA alone, DFO alone and ALA combined with DFO. ** P < 0.01, *** P < 0.001, compared with untreated dark controls in the corresponding cell lines. All data are presented as mean ± SD from 3 experiments.
Treatment with DFO induced less enhancement of ALA-PpIX fluorescence in tumor cells with lower FECH activity.
The enzymatic activity of FECH was determined in 4 human breast cancer cell lines including estrogen receptor-positive MCF-7 cells, human epidermal growth factor receptor 2 (HER2)-positive MDA-MB-453 cells, and triple negative MDA-MB-231 and Hs 578T cells. As shown in Figure 6A, different tumor cell lines exhibited a significant difference in FECH activity. MDA-MB-453 cells showed the highest FECH activity, which was significantly higher than MDA-MB-231 and Hs 578T cells. There was no significant difference between MDA-MB-453 and MCF-7 cells in FECH activity (P > 0.05). The effect of DFO (1 mM) on the enhancement of ALA-PpIX fluorescence was examined by flow cytometry and shown in Figure 6B. Treatment with DFO had varied effects on the enhancement of ALA-PpIX fluorescence in different tumor cell lines. It induced the highest fluorescence increase in MDA-MB-453 cells. Compared with MDA-MB-453 cells, DFO-induced PpIX fluorescence increase was significantly less in MDA-MB-231 and Hs 578T cells.
Figure 6.

(A) FECH activity in different human breast cancer cell lines. (B) Effects of DFO on ALA-PpIX fluorescence. Cells were incubated with ALA (1 mM) in combination with DFO (1 mM) for 4 h. The intensity of PpIX fluorescence was measured with a flow cytometer. * P < 0.05, ** P < 0.01, *** P < 0.001. All data are presented as mean ± SD from at least 3 experiments.
DISCUSSION
Attempts to improve the use of ALA for PDT and fluorescence-guided tumor resection have been focused on enhancing tumor cellular PpIX level, which is dependent on PpIX biosynthesis and bioconversion at any given time after ALA administration (12). Inhibition of FECH-mediated PpIX conversion with clinical iron chelator DFO was widely explored for the enhancement of ALA-PpIX/PDT. However, both preclinical (33, 34) and clinical (7, 35) studies have shown that tumor response to the combination of ALA and DFO is highly variable and some tumors exhibit no enhancement at all. Considering that reduced or even negative FECH expression has been reported in a variety of tumors, we hypothesized that the variation in tumor FECH expression or activity may contribute to the heterogeneity in tumor response to DFO. Using FECH-knockdown cells and wild-type cancer cell lines with varied FECH activity, we demonstrated in the present study that FECH activity played an important role in determining tumor response to the enhancement of DFO.
To reduce FECH level, we used shRNA to generate FECH-knockdown cells. Silencing FECH caused a remarkable increase in both basal and ALA-stimulated PpIX fluorescence in SkBr3 cells. The increase in PpIX fluorescence correlated well with the reduction of FECH in knockdown cell lines, underscoring the importance of FECH in controlling cellular PpIX concentration. The decrease of FECH (thereby reducing the production of heme) induced an upregulation of ALAS-H (a rate-limiting enzyme in the heme biosynthesis pathway), demonstrating a negative feedback regulation (13). Incubation with ALA resulted in a dose-dependent increase in PpIX fluorescence in both FECH-knockdown and vector control SkBr3 cells. However, PpIX fluorescence increase was much greater in FECH-knockdown cells than in vector control cells, rendering knockdown cells more sensitive to ALA-PDT. These results, in agreement with previous reports (14–18), demonstrate that inhibiting PpIX bioconversion by reducing tumor FECH level greatly enhanced ALA-PpIX fluorescence and PDT response.
Interestingly, FECH deficiency in FECH-knockdown cells completely abolished the enhancement effect of DFO. Since DFO did enhance ALA-PpIX/PDT in vector control cells, the loss of enhancement effect in knockdown cells suggests the involvement of FECH in determining the efficacy of DFO enhancement. We further evaluated FECH activity and ALA-PpIX fluorescence enhancement by DFO in wild-type cancer cell lines. Our results showed that different cancer cell lines exhibited a significant variation in FECH activity and response to DFO treatment. Importantly, we found that cancer cell lines with lower FECH activity were significantly less responsive to DFO treatment than cancer cells with higher FECH activity. Why DFO treatment effectiveness is dependent on a robust FECH activity remains an open question. This phenomenon could be due to the saturation of FECH enzyme, which renders iron level reduction by DFO ineffective for further PpIX fluorescence increase. Cell lines with low FECH activity are more likely to have FECH enzyme activity saturation after ALA treatment, thus making them less sensitive to the enhancement by DFO.
To evaluate the selectivity of DFO treatment, we compared the effects of DFO on ALA-PpIX and PDT in SkBr3 breast cancer cells versus MCF10A breast epithelial cells. By chelating ferrous iron, DFO is known to reduce iron-mediated oxidative stress (36). However, when DFO is used in combination with ALA, chelation with iron may increase PpIX accumulation by inhibiting PpIX conversion to heme, resulting in the enhancement of PpIX fluorescence and PDT effects. DFO has been shown to enhance ALA-PpIX/PDT in PC-3 prostate (37) and U251 glioma (38) tumor models. Here, we found that DFO significantly increased ALA-PpIX fluorescence and PDT response in SkBr3 breast cancer cells. However, similar enhancement was also seen in MCF10A cells, resulting in no net increase in the selectivity towards SkBr3 tumor cells. In FECH-deficient SkBr3 cells, the combination of ALA and DFO even led to a reduced selectivity because DFO sensitized MCF10A cells, but not FECH-deficient tumor cells, to ALA. Since successful use of ALA for either PDT or fluorescence-guided tumor resection depends on selective PpIX accumulation in tumor cells, effects of DFO treatment on normal cells need to be considered with its effects on tumor cells to achieve an optimal tumor response.
Despite observations of DFO-induced ALA-PpIX/PDT enhancement in some tumors, it is clear that not all tumors respond to this enhancement treatment (33, 34). For tumors with FECH deficiency, DFO in combination with ALA even reduced the selectivity of ALA treatment alone as shown in this study. Heterogeneity in tumor response to DFO treatment is also evident in clinical trials. For instance, although overall negative results were reported in a pilot clinical trial, 3 out of 8 patients showed more than 50% increase in ALA-PpIX fluorescence after DFO treatment (7). Thus, a patient stratification biomarker is needed to identify patients who would benefit from this treatment. Our finding that FECH activity plays an important role in determining tumor response to the combination of ALA and DFO suggests the use of FECH activity as a biomarker for predicting tumor response to this combination therapy. Future studies should focus on correlating tumor FECH activity with tumor response to ALA in combination with DFO in a large set of tumor samples.
Supplementary Material
Acknowledgements
We would like to thank Dr. Chenguang Wang, Dr. Xue Yang, Neil Patel, Juliana Restrepo and Ashvin Iyer for helpful discussions and experimental assistance. This study was supported in part by NIH grant R15EB026208.
Footnotes
SUPPORTING INFORMATION
Additional supporting information may be found online in the Supporting Information section at the end of the article:
REFERENCES
- 1.Nokes B, Apel M, Jones C, Brown G and Lang JE (2013) Aminolevulinic acid (ALA): photodynamic detection and potential therapeutic applications. J Surg Res 181, 262–271. [DOI] [PubMed] [Google Scholar]
- 2.Agostinis P, Berg K, Cengel KA, Foster TH, Girotti AW, Gollnick SO, Hahn SM, Hamblin MR, Juzeniene A, Kessel D, Korbelik M, Moan J, Mroz P, Nowis D, Piette J, Wilson BC and Golab J (2011) Photodynamic therapy of cancer: an update. CA Cancer J Clin 61, 250–281. [DOI] [PMC free article] [PubMed] [Google Scholar]
- 3.Stummer W, Tonn JC, Goetz C, Ullrich W, Stepp H, Bink A, Pietsch T and Pichlmeier U (2014) 5-Aminolevulinic acid-derived tumor fluorescence: the diagnostic accuracy of visible fluorescence qualities as corroborated by spectrometry and histology and postoperative imaging. Neurosurgery 74, 310–319; discussion 319–320. [DOI] [PMC free article] [PubMed] [Google Scholar]
- 4.Jichlinski P and Leisinger HJ (2001) Photodynamic therapy in superficial bladder cancer: past, present and future. Urol Res 29, 396–405. [DOI] [PubMed] [Google Scholar]
- 5.Daneshmand S, Bazargani ST, Bivalacqua TJ, Holzbeierlein JM, Willard B, Taylor JM, Liao JC, Pohar K, Tierney J, Konety B and Blue G Light Cystoscopy with Cysview Registry (2018) Blue light cystoscopy for the diagnosis of bladder cancer: Results from the US prospective multicenter registry. Urol Oncol 36, 361e361–361e366. [DOI] [PubMed] [Google Scholar]
- 6.Anand S, Ortel BJ, Pereira SP, Hasan T and Maytin EV (2012) Biomodulatory approaches to photodynamic therapy for solid tumors. Cancer Lett 326, 8–16. [DOI] [PMC free article] [PubMed] [Google Scholar]
- 7.Choudry K, Brooke RC, Farrar W and Rhodes LE (2003) The effect of an iron chelating agent on protoporphyrin IX levels and phototoxicity in topical 5-aminolaevulinic acid photodynamic therapy. Br J Dermatol 149, 124–130. [DOI] [PubMed] [Google Scholar]
- 8.Kanick SC, Davis SC, Zhao Y, Hasan T, Maytin EV, Pogue BW and Chapman MS (2014) Dual-channel red/blue fluorescence dosimetry with broadband reflectance spectroscopic correction measures protoporphyrin IX production during photodynamic therapy of actinic keratosis. J Biomed Opt 19, 75002. [DOI] [PMC free article] [PubMed] [Google Scholar]
- 9.Palasuberniam P, Yang X, Kraus D, Jones P, Myers KA and Chen B (2015) ABCG2 transporter inhibitor restores the sensitivity of triple negative breast cancer cells to aminolevulinic acid-mediated photodynamic therapy. Sci Rep 5, 13298. [DOI] [PMC free article] [PubMed] [Google Scholar]
- 10.Valdes PA, Leblond F, Kim A, Harris BT, Wilson BC, Fan X, Tosteson TD, Hartov A, Ji S, Erkmen K, Simmons NE, Paulsen KD and Roberts DW (2011) Quantitative fluorescence in intracranial tumor: implications for ALA-induced PpIX as an intraoperative biomarker. J Neurosurg 115, 11–17. [DOI] [PMC free article] [PubMed] [Google Scholar]
- 11.Kamp MA, Fischer I, Buhner J, Turowski B, Cornelius JF, Steiger HJ, Rapp M, Slotty PJ and Sabel M (2016) 5-ALA fluorescence of cerebral metastases and its impact for the local-in-brain progression. Oncotarget 7, 66776–66789. [DOI] [PMC free article] [PubMed] [Google Scholar]
- 12.Yang X, Palasuberniam P, Kraus D and Chen B (2015) Aminolevulinic Acid-Based Tumor Detection and Therapy: Molecular Mechanisms and Strategies for Enhancement. Int J Mol Sci 16, 25865–25880. [DOI] [PMC free article] [PubMed] [Google Scholar]
- 13.Ponka P (1999) Cell biology of heme. Am J Med Sci 318, 241–256. [DOI] [PubMed] [Google Scholar]
- 14.Kemmner W, Wan K, Ruttinger S, Ebert B, Macdonald R, Klamm U and Moesta KT (2008) Silencing of human ferrochelatase causes abundant protoporphyrin-IX accumulation in colon cancer. FASEB J 22, 500–509. [DOI] [PubMed] [Google Scholar]
- 15.Miyake M, Ishii M, Kawashima K, Kodama T, Sugano K, Fujimoto K and Hirao Y (2009) siRNA-mediated knockdown of the heme synthesis and degradation pathways: modulation of treatment effect of 5-aminolevulinic acid-based photodynamic therapy in urothelial cancer cell lines. Photochem Photobiol 85, 1020–1027. [DOI] [PubMed] [Google Scholar]
- 16.Teng L, Nakada M, Zhao SG, Endo Y, Furuyama N, Nambu E, Pyko IV, Hayashi Y and Hamada JI (2011) Silencing of ferrochelatase enhances 5-aminolevulinic acid-based fluorescence and photodynamic therapy efficacy. Br J Cancer 104, 798–807. [DOI] [PMC free article] [PubMed] [Google Scholar]
- 17.Yang X, Li W, Palasuberniam P, Myers KA, Wang C and Chen B (2015) Effects of Silencing Heme Biosynthesis Enzymes on 5-Aminolevulinic Acid-mediated Protoporphyrin IX Fluorescence and Photodynamic Therapy. Photochem Photobiol 91, 923–930. [DOI] [PubMed] [Google Scholar]
- 18.Wan K, Ebert B, Voigt J, Wang Q, Dai Y, Haag R and Kemmner W (2012) In vivo tumor imaging using a novel RNAi-based detection mechanism. Nanomedicine 8, 393–398. [DOI] [PubMed] [Google Scholar]
- 19.Beale SI and Foley T (1982) Induction of delta-Aminolevulinic Acid Synthase Activity and Inhibition of Heme Synthesis in Euglena gracilis by N-Methyl Mesoporphyrin IX. Plant Physiol 69, 1331–1333. [DOI] [PMC free article] [PubMed] [Google Scholar]
- 20.Gupta V, Liu S, Ando H, Ishii R, Tateno S, Kaneko Y, Yugami M, Sakamoto S, Yamaguchi Y, Nureki O and Handa H (2013) Salicylic acid induces mitochondrial injury by inhibiting ferrochelatase heme biosynthesis activity. Mol Pharmacol 84, 824–833. [DOI] [PubMed] [Google Scholar]
- 21.Curnow A and Pye A (2007) Biochemical manipulation via iron chelation to enhance porphyrin production from porphyrin precursors. J Environ Pathol Toxicol Oncol 26, 89–103. [DOI] [PubMed] [Google Scholar]
- 22.Wu CK, Dailey HA, Rose JP, Burden A, Sellers VM and Wang BC (2001) The 2.0 A structure of human ferrochelatase, the terminal enzyme of heme biosynthesis. Nat Struct Biol 8, 156–160. [DOI] [PubMed] [Google Scholar]
- 23.Sassa S, Schwartz S and Ruth G (1981) Accumulation of protoporphyrin IX from delta-aminolevulinic acid in bovine skin fibroblasts with hereditary erythropoietic protoporphyria. A gene-dosage effect. J Exp Med 153, 1094–1101. [DOI] [PMC free article] [PubMed] [Google Scholar]
- 24.Malik Z, Kostenich G, Roitman L, Ehrenberg B and Orenstein A (1995) Topical application of 5-aminolevulinic acid, DMSO and EDTA: protoporphyrin IX accumulation in skin and tumours of mice. J Photochem Photobiol B 28, 213–218. [DOI] [PubMed] [Google Scholar]
- 25.Berg K, Anholt H, Bech O and Moan J (1996) The influence of iron chelators on the accumulation of protoporphyrin IX in 5-aminolaevulinic acid-treated cells. Br J Cancer 74, 688–697. [DOI] [PMC free article] [PubMed] [Google Scholar]
- 26.Pye A and Curnow A (2007) Direct comparison of delta-aminolevulinic acid and methyl-aminolevulinate-derived protoporphyrin IX accumulations potentiated by desferrioxamine or the novel hydroxypyridinone iron chelator CP94 in cultured human cells. Photochem Photobiol 83, 766–773. [DOI] [PubMed] [Google Scholar]
- 27.Peng Q, Warloe T, Moan J, Heyerdahl H, Steen HB, Nesland JM and Giercksky KE (1995) Distribution of 5-aminolevulinic acid-induced porphyrins in noduloulcerative basal cell carcinoma. Photochem Photobiol 62, 906–913. [DOI] [PubMed] [Google Scholar]
- 28.Campbell SM, Morton CA, Alyahya R, Horton S, Pye A and Curnow A (2008) Clinical investigation of the novel iron-chelating agent, CP94, to enhance topical photodynamic therapy of nodular basal cell carcinoma. Br J Dermatol 159, 387–393. [DOI] [PubMed] [Google Scholar]
- 29.Dailey HA and Smith A (1984) Differential interaction of porphyrins used in photoradiation therapy with ferrochelatase. Biochem J 223, 441–445. [DOI] [PMC free article] [PubMed] [Google Scholar]
- 30.Van Hillegersberg R, Van den Berg JW, Kort WJ, Terpstra OT and Wilson JH (1992) Selective accumulation of endogenously produced porphyrins in a liver metastasis model in rats. Gastroenterology 103, 647–651. [DOI] [PubMed] [Google Scholar]
- 31.Fateye B, Li W, Wang C and Chen B (2012) Combination of phosphatidylinositol 3-kinases pathway inhibitor and photodynamic therapy in endothelial and tumor cells. Photochem Photobiol 88, 1265–1272. [DOI] [PubMed] [Google Scholar]
- 32.Yang X, Palasuberniam P, Myers KA, Wang C and Chen B (2016) Her2 oncogene transformation enhances 5-aminolevulinic acid-mediated protoporphyrin IX production and photodynamic therapy response. Oncotarget 7, 57798–57810. [DOI] [PMC free article] [PubMed] [Google Scholar]
- 33.de Souza AL, Marra K, Gunn J, Samkoe KS, Kanick SC, Davis SC, Chapman MS, Maytin EV, Hasan T and Pogue BW (2016) Comparing desferrioxamine and light fractionation enhancement of ALA-PpIX photodynamic therapy in skin cancer. Br J Cancer 115, 805–813. [DOI] [PMC free article] [PubMed] [Google Scholar]
- 34.Yang J, Xia Y, Liu X, Jiang S and Xiong L (2010) Desferrioxamine shows different potentials for enhancing 5-aminolaevulinic acid-based photodynamic therapy in several cutaneous cell lines. Lasers Med Sci 25, 251–257. [DOI] [PubMed] [Google Scholar]
- 35.Fijan S, Honigsmann H and Ortel B (1995) Photodynamic therapy of epithelial skin tumours using delta-aminolaevulinic acid and desferrioxamine. Br J Dermatol 133, 282–288. [DOI] [PubMed] [Google Scholar]
- 36.Umemura M, Kim JH, Aoyama H, Hoshino Y, Fukumura H, Nakakaji R, Sato I, Ohtake M, Akimoto T, Narikawa M, Tanaka R, Fujita T, Yokoyama U, Taguri M, Okumura S, Sato M, Eguchi H and Ishikawa Y (2017) The iron chelating agent, deferoxamine detoxifies Fe(Salen)-induced cytotoxicity. J Pharmacol Sci 134, 203–210. [DOI] [PubMed] [Google Scholar]
- 37.Fukuhara H IK, Kurabayashi A, Furihata M, Fujita H, Utsumi K, Sasaki J, Shuin T (2013) The inhibition of ferrochelatase enhances 5-aminolevulinic acid-based photodynamic action for prostate cancer. Photodiagnosis Photodyn Ther 10, 399–409. [DOI] [PubMed] [Google Scholar]
- 38.Valdes PA, Samkoe K, O’Hara JA, Roberts DW, Paulsen KD and Pogue BW (2010) Deferoxamine iron chelation increases delta-aminolevulinic acid induced protoporphyrin IX in xenograft glioma model. Photochem Photobiol 86, 471–475. [DOI] [PMC free article] [PubMed] [Google Scholar]
Associated Data
This section collects any data citations, data availability statements, or supplementary materials included in this article.