

Abstract
Living South Asians have low lean tissue mass relative to height, which contributes to their elevated type 2 diabetes susceptibility, particularly when accompanied by obesity. While ongoing lifestyle transitions account for rising obesity, the origins of low lean mass remain unclear. We analysed proxies for lean mass and stature among South Asian skeletons spanning the last 11,000 years (n = 197) to investigate the origins of South Asian low lean mass. Compared with a worldwide sample (n = 2,003), South Asian skeletons indicate low lean mass. Stature-adjusted lean mass increased significantly over time in South Asia, but to a very minor extent (0.04 z-score units per 1,000 years, adjusted R2 = 0.01). In contrast stature decreased sharply when agriculture was adopted. Our results indicate that low lean mass has characterised South Asians since at least the early Holocene and may represent long-term climatic adaptation or neutral variation. This phenotype is therefore unlikely to change extensively in the short term, so other strategies to address increasing non-communicable disease rates must be pursued.
Subject terms: Biological anthropology, Type 2 diabetes
Introduction
Non-communicable diseases (NCDs) accounted for 60% of global deaths in 2012 and place a growing burden of morbidity and mortality on populations worldwide1. India has been described as a ‘diabetes capital of the world’2 due to its large population and their elevated susceptibility to NCDs. In 2017, 10% of Indian adults (73 million people) had type 2 diabetes (T2D), second only to China in absolute terms, and India is projected to rank first by 2045 as population, lifespans and urbanisation increase3. Other South Asian countries (broadly Pakistan, Sri Lanka Bangladesh, and Nepal) show a similar emerging disease profile3,4. While lifestyle factors (dietary trends, more sedentary lifestyles) and obesity clearly play an important role in NCD susceptibility, inter-population variation is not fully explained by such exposures. Within specific settings, people of South Asian ancestry have an elevated risk of T2D compared with other groups5,6. For example, South Asians in London, UK, had 2–3 times greater T2D risk compared with those of European ancestry, with onset typically 5 years earlier and at a lower body mass index (by 5 kg/m2)7. Here, we investigate the origins of a key factor implicated in this elevated susceptibility: low lean mass. When and why this phenotype originated is currently unknown, and understanding the origins of South Asian low lean mass may have important implications for how we address the growing burden of NCDs in this population.
Contemporary South Asians typically have lower lean mass (organ and muscle mass) relative to stature and total body mass than Europeans8, which may partly explain why they develop NCDs at a lower BMI than other populations. South Asian low lean mass is present at birth, and this difference becomes more pronounced after adjusting for their low average birth weight9. Neonatal low lean mass persists even four or five generations after migration to other parts of the world including the UK10,11, Netherlands12 and Surinam13, despite changes in diet and environment. This suggests the phenotype is heritable in the broader sense, but whether by genetic or epigenetic mechanisms is unknown. Lower lean mass is associated with lower glucose clearance and possibly earlier beta-cell exhaustion14, so is thought to contribute causally to elevated diabetes risk15 in the context of obesity. Contemporary South Asians are also generally characterised by relatively short stature16, which is associated with lower glucose tolerance independently of body mass17 and may act as a marker of T2D susceptibility, including during pregnancy2,18.
The temporal and causal origins of low lean mass among South Asians are unknown but various hypotheses have been proposed (reviewed in2). Briefly, on the longest timescale, adaptation to a predominantly hot, equatorial climate19 may have led to selection for lower body mass (which generates less heat and increases heat loss through a greater surface area to volume ratio) to reduce thermal load. The oldest Homo sapiens remains from South Asia date to ~38,000 years ago, but modern human occupation of the region may date back even further20, demonstrating a long population history in the region. Climatic unpredictability might also have selected for lower lean mass as an adaptation to unreliable food resources (though this does not equate with small being ‘healthy’ - see21). South Asia is affected by the unpredictable El Niño Southern Oscillation (ENSO), causing an erratic resource base. During the first half of the Holocene, the ENSO phenomenon was much less frequent or absent, while the current ENSO pattern was established about 5,000 years ago22.
The transition from hunting and gathering to food production may also have selected for smaller lean mass and stature among South Asians. Height decreased in many parts of the world with the agricultural transition23,24 including South Asia25,26, as populations became more vulnerable to famine, seasonal shortages, nutrient deficiencies and infectious diseases associated with sedentary communities23. The transition to food production in South Asia began broadly around 9,000 years before present (BP) in the north west of the region and spread south and east, reaching the extreme south by ~4,600 years BP27. The more recent adoption of vegan or vegetarian diets may also be implicated in the ontogenetic development of low lean mass28. Such diets are widespread today in South Asia, and may date back to at least the third century BCE according to documentary evidence29, although archaeological evidence suggests that meat consumption was widespread until a few centuries ago29,30. On the shortest timescale, societal pressures in the context of unpredictable ecological conditions may explain the South Asian phenotype. Repeated, severe famines affected South Asia in the 19th and first half of the 20th centuries, which were exacerbated by British colonial policy and were associated with high mortality from starvation31. This might have selected for genes associated with low lean mass, or might have reduced lean mass through mechanisms of trans-generational plasticity2.
Here, we investigate the temporal origins of South Asian low lean mass by inferring trends in relative lean mass and stature over the last 11,000 years using archaeological and recent South Asian adult skeletons (n = 197, Fig. 1: sufficiently preserved skeletons predating 11,000 years BP are yet to be discovered in South Asia). We use skeletal proxies for lean mass and stature in the context of variation among a global sample of terminal Pleistocene and Holocene adult Homo sapiens skeletons (n = 2,003, Fig. 2). We hypothesise that if low lean mass is a long term climatic adaptation it will be evident throughout the last 11,000 years, while if it originates from more recent dietary change or societal pressures, a change in relative lean mass should be expected that coincides temporally with these events. Understanding the timing of the origin of low lean mass and shorter stature among South Asians may offer novel insights into the relative impacts of the natural and social environments on human body size, growth and health, and have implications for devising effective strategies to tackle the growing burden of NCDs in this population32. If low lean mass is a recent characteristic, it may recover over the next few generations, while a long term adaptation will take longer to reverse, so the two have different implications for devising effective preventive strategies32.
Figure 1.

Map of South Asia showing location of study samples.
Figure 2.

World map showing location of comparative Late Pleistocene and Holocene data used in this study.
Results
Inter-population variation in inferred lean mass relative to stature
Relative to stature (indicated by mean bone length z-scores for each individual) South Asian skeletons demonstrate low lean mass (low individual mean bone breadth z-scores) compared with other worldwide populations, since most individuals fall below the reduced major axis (RMA) regression line for the total dataset (Fig. 3). Considering the South Asian data by broad time periods, the Mesolithic hunter gatherers typically have higher length z-scores than more recent South Asians (i.e., taller stature), but in all groups, individuals have relatively low breadth z-scores in relation to length z-scores, indicating that low lean mass relative to stature characterised South Asians throughout the past 11,000 years.
Figure 3.
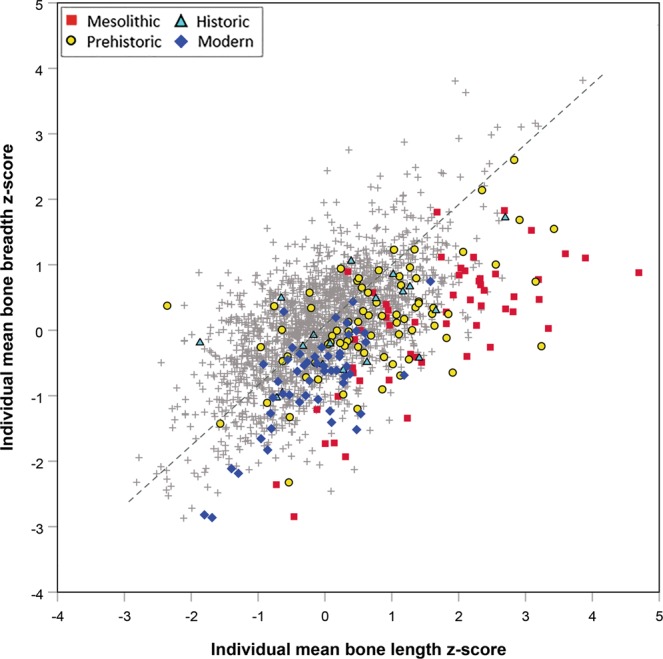
Plot of individual mean bone breadth z-score against individual mean bone length z-score in South Asian archaeological and modern skeletons from the last 11,000 years (n = 197) compared with a worldwide sample of terminal Pleistocene and Holocene humans (n = 2,003: grey crosses) demonstrating that South Asians throughout the study period typically have low lean mass (bone breadth z-score) relative to stature (bone length z-score). Reduced major axis regression line fitted to the whole dataset shown as grey dashed line.
Temporal trends in South Asian lean mass
In the South Asian dataset, breadth z-score adjusted for length z-score and latitude (to account for geographic patterning in the data) showed a slight significant increase through time (Fig. 4, Supplementary Table 1: trend for date in linear regression model, p = 0.02), indicating that there was an increase in relative lean mass of South Asians over this period, albeit small in magnitude (0.04 z-score units per 1,000 years, standard error = 0.02), and explaining only 1% of the variance in bone breadth z-score.
Figure 4.
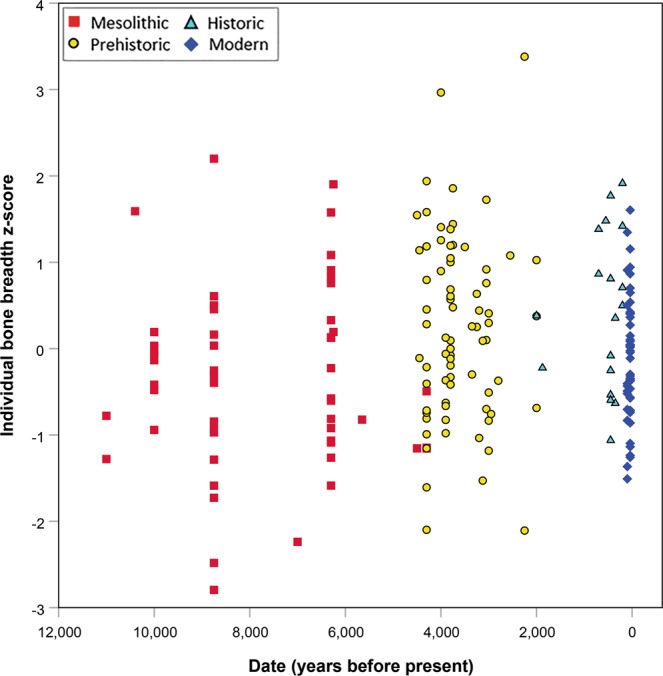
Individual mean bone breadth z-score (adjusted for latitude and bone length z-score) plotted against date of site, illustrating a minor temporal trend in relative lean mass among South Asians (n = 197) over the last 11,000 years.
Temporal trends in South Asian stature
Stature (length z-score) fell by 1.2 units (p < 0.001) between Mesolithic hunter-gatherers and all later populations once agriculture was adopted (Fig. 5). This step change was followed by a slower, linear decline from 5,000 years BP up to the 20th century. Restricted to the last 5,000 years, regression of bone length z-score on date, adjusting for latitude, indicated a decline of 0.22 (standard error = 0.05) z-score units per thousand years (adjusted R2 = 0.12, p < 0.001). To put this in context, the standard deviations of femur length are 30.1 mm and 26.5 mm for males and females respectively, and using stature prediction equations33, one z-score difference in femur length equate to 7.5 cm and 7.0 cm difference in estimated stature for males and females respectively. Thus we might predict total average declines in stature from Mesolithic hunter-gatherers to later populations of 8.5 cm and 7.7 cm in males and females respectively, and a decline of the same magnitude across the 5,000 years since agriculture was adopted.
Figure 5.
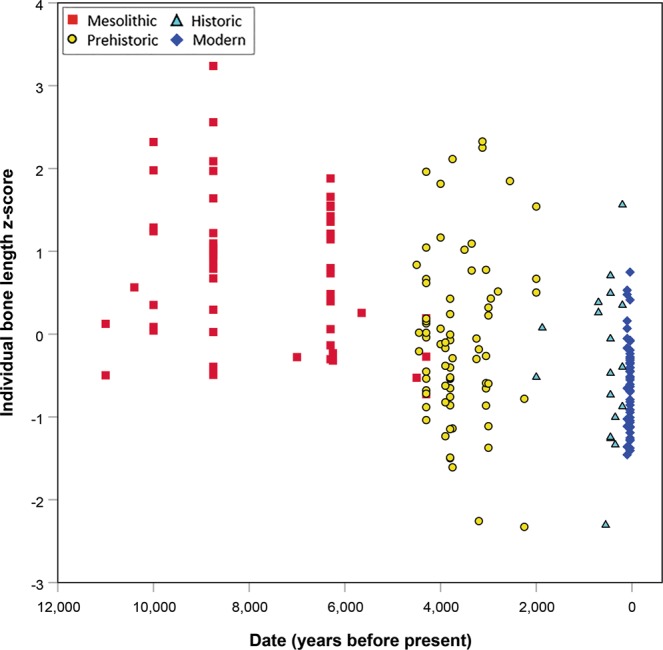
Individual mean bone length z-score (adjusted for latitude) plotted against date of site, illustrating temporal trends in inferred stature among South Asians (n = 197) over the last 11,000 years. There is a major decrease between the Mesolithic and Prehistoric samples (n = 54 and 75 respectively), followed by a slower decline from the Prehistoric period through to the 20th century.
Discussion
This analysis of South Asian adult skeletal material demonstrates that compared with a worldwide sample of terminal Pleistocene and Holocene skeletal variation, South Asians have persistently low bone breadth z-score relative to length z-score, indicating relatively low lean mass for stature. Bone breadth z-score (adjusted for length z-score and latitude) among South Asians showed statistically significant increase through time, albeit of very small magnitude and explaining less than 1% of the variation, so relative low lean mass appears to have been a constant characteristic of South Asians across the last 11,000 years. Adjusted for latitude, South Asian bone length z-scores decreased between the Mesolithic and later periods by 1.2 z-scores, indicating a marked fall in stature with the adoption of agriculture, followed by a more gradual decline in stature through to the 20th century.
Our finding that South Asian low lean mass has ancient origins would be most consistent with long-term adaptations to ecological pressures, rather than more recent dietary change or the impacts of 19th–20th century famines exacerbated by British colonial policy. The lack of well-preserved postcranial remains predating 11,000 years BP prevents us from examining earlier trends in South Asian lean mass. Other researchers have noted the relatively “gracile” bones (narrow relative to their length) of Mesolithic South Asians compared with more robust hunter-gatherers34–36 and have also attributed this slight build to climatic adaptation35,36. Our data show that this characteristic persists into recent times.
Interestingly, skeletal remains of East Africans and native Australians show similar patterns of low bone breadth relative to length, and by inference low lean mass35. Like South Asians, native Australians have an elevated incidence of NCDs37, relatively low lean mass, a higher proportion of body fat for a given BMI, and a tendency towards abdominal obesity38,39, although their relatively long limbs attenuate some of these contrasts40. South Asia and Australia were both colonised relatively early by dispersals of modern humans, and both subsequently had long periods (tens of thousands of years) for in situ development with relatively low levels of gene flow41–43. Whether there is a similar link between low lean mass and T2D susceptibility among South Asians and native Australians, and whether such phenotypic similarities reflect common ecological factors (equatorial climates susceptible to ENSO effects) or potentially neutral processes/shared ancestry could not be addressed here and are questions for future investigation.
Evidence that South Asian low lean mass is strongly heritable might indicate a still-unidentified genetic basis. There is evidence for natural selection near the Myostatin (MSTN or GDF-8) gene among South Asians44, which decreases skeletal muscle mass in fetal and postnatal life, but the nature and effect of any changes to this gene in South Asians remain to be clarified. In a sample of north Indian adults, variants at this locus were associated with variability in lean mass and (abdominal) obesity45. Alternatively, the heritability of low lean mass may originate from an intense cycle of inter-generational plasticity that is hard to break: low maternal lean mass may be the strongest predictor of low offspring lean mass at birth46, and low birth weight (associated with lower lean mass) predicts low adult lean mass47. Fifty generations of undernutrition in a rat model led to the development of a similar phenotype (including low birth weight, central adiposity, insulin resistance, and vitamin B12 and folate deficiency) in the absence of genetic change48. The phenotype largely persisted for 2 generations after returning the offspring to a standard diet (although birth weight and fat mass did show partial recovery), indicating that the South Asian phenotype might plausibly result from multigenerational undernutrition. Our study is unable to shed light on the heritable basis of low lean mass of South Asians but does indicate that it is a longstanding characteristic.
Other factors are also likely to contribute to elevated NCD susceptibility among South Asians. Genetic loci associated with obesity and/or T2Ds have been identified among South Asians49,50, while the impacts of early life environment on later growth and metabolic function may also be partly responsible51,52. Low birth weight is particularly common in India53 and is associated with reduced ‘metabolic capacity’ in adulthood (including muscle mass, pancreatic beta cell mass, and renal nephron number)54,55. Especially under conditions of elevated ‘metabolic load’ (high sugar and fat diets in a context of low activity levels) individuals with lower capacity are more susceptible to obesity and associated NCDs56. All these factors appear to link low lean mass and excess adiposity to NCD risk, and differ on the timescales on which they operate15.
A key component of NCD susceptibility is excess adiposity. Unfortunately, at present there are no methods to reliably estimate body fat from skeletal dimensions57–59 so we were unable to investigate temporal trends in fat mass alongside lean mass. Since fat mass is highly plastic, contingent on local environment, age, diet and activity, and largely a result of modernisation, this component of NCD risk is a distinct phenomenon. Lean mass is low in South Asians compared with other populations across the range of BMI8,60 i.e., regardless of obesity status, and thus patterns of lean mass variation are of greater importance for understanding the origin of baseline disease susceptibility.
Unlike the temporal stability in relative lean mass, the marked decrease in mean long bone length z-scores (proxies for stature) between the Mesolithic and subsequent periods coincides with changing patterns of niche construction associated with agriculture, and echoes other studies of South Asia25,26 and other parts of the world23,24. This decline in stature in South Asia following the adoption of food production is estimated elsewhere to be ~9 cm in males26, similar to our results. The decline in stature with the adoption of agriculture appears to have been particularly marked in South Asia (e.g., compare24), although uneven spatial and temporal distribution of the data in different world regions complicates any direct comparison. Decreased stature may indicate an additional increase in underlying NCD susceptibility among South Asians on top of that resulting from low lean mass. Short stature is thought to be associated with T2D susceptibility because, like low lean mass, it is linked to poor early life conditions (potentially across multiple generations), which are also known to increase NCD susceptibility18,61. Interestingly, the relationship between T2D risk and stature is reportedly strongest in Asians and native Australians compared to other populations62.
Although Mesolithic South Asians were generally tall, 4 out of the 5 Sri Lankans, one individual from Damdama and one from Deulga Hills, India63 (the latter could not be included in this study due to poor preservation), had very low bone length z-scores before latitude adjustment. This may indicate some interesting variation in hunter-gatherer body size within South Asia, whereby some populations were extremely short while others very tall. The potential causes of this variation require future investigation.
The continued gradual decline since agriculture was adopted is consistent with previous analyses of skeletal and anthropometric data25,64 and may reflect the ongoing impact of agriculture, exacerbated by more recent societal pressures in a context of severe famines. The limited size and diversity in geography and social status of available skeletal samples for South Asia means there may have been more recent, shorter-term variation in stature and lean mass that we were unable to detect. Therefore the transition to food production or repeated famines may still have influenced relative lean mass in South Asian populations. Nonetheless, unlike the clear decrease in stature with the adoption of food production, relative lean mass does not appear to have altered significantly over the last 11,000 years. This pattern, whereby stature appears to relate more to nutritional factors, while physique (bone breadth and body mass) appears to reflect ecological (climatic) pressures, is consistent with theoretical models and empirical data concerning variation in human skeletal size and proportions65,66.
A limitation of our analyses is that we could not investigate and control for genetic, environmental and other sources of variation across the extensive geographic region of South Asia, which is widely recognised for its genetic, morphological, linguistic and cultural diversity67. Recent studies evaluating large-scale geographic variation in human morphology have incorporated genetic and morphological data to tease apart neutral and adaptive influences on phenotype (e.g.68,69). In the case of South Asia, ancient DNA studies have generally failed due to unfavourable preservation conditions, making links between ancient and modern populations in the region uncertain. Therefore any attempt to replicate combined genetic and skeletal morphological approaches, especially in the light of the small and fragmentary archaeological skeletal samples available, is problematic at present. While variation in T2D rates70, stature25,71 and obesity72 across contemporary South Asia has been documented in association with environmental factors (e.g. urban vs. rural location), the contributions of genetic and geographic influences on this variation are not well understood, and variation in low lean mass in this region is poorly documented. Thus, any attempt to relate the archaeological data with this modern variation would be speculative and has not been attempted here. In vivo body composition data confirm that low lean mass is widespread across the region today, and as South Asians do share a deep common ancestry (see above), a large scale regional approach is justified. We look forward to the time when improved data will facilitate a more nuanced and detailed analysis of intra-regional variation and its causes.
The use of proxies for stature and lean mass is clearly another source of potential error in the dataset, but one that cannot be avoided given that skeletal remains are our only available data source for prehistoric South Asian phenotypes. The proxies we used are well established (as discussed in the Methods), and the use of z-scores rather than estimation equations avoid adding a further step that could introduce further error. Another limitation of the study is that we combined published and novel data because of limited availability of archaeological collections for new study. While this may have added noise to the data due to inter-observer error in the skeletal measurements, we selected only published data collected using methods comparable to our own to limit this effect. Furthermore, inter-observer error in such measurements is generally low73. The preponderance of males in our South Asian samples may have affected the outcomes if any changes in stature or lean mass were stronger in one sex than the other. The use of sex-specific z scores accounts for differences in body size between males and females, and we are not aware of any evidence for sex differences in the relationship between lean mass and type 2 diabetes. Low lean mass characterises contemporary South Asians regardless of sex. It remains possible that patterns of change in lean mass may have differed between the sexes, but the size of the available skeletal sample does not permit us to investigate this question at present. Finally, there are limitations to the accuracy of the sample chronology, as few samples have been directly dated with modern radiometric methods and many rely on older radiocarbon dates calibrated by various methods, or by relative dating using established regional cultural sequences (see Methods for more detail). Again, while this may lead to some noise in the data, the relative age of the different skeletal samples should be robust. All the above factors may have led to more conservative results, but we would not expect them to be sufficient to invalidate our findings (see Methods for further discussion).
In conclusion, our analyses suggest that the low lean mass phenotype characteristic of contemporary people of South Asian ancestry has existed for at least 11,000 years. The available data have insufficient resolution to show whether or not there were further small changes in proportional lean mass since the adoption of food production, or as a consequence of more recent famines. Given the antiquity of this phenotype, the most likely explanations for low lean mass in South Asia appears to be either climatic adaptation or neutral evolutionary processes, but the available data do not allow us to distinguish between these hypotheses at present. Consistent with previous work, our data indicate that stature, which is also associated with elevated T2D susceptibility, fell sharply with the transition to food production, and continued to decline more slowly until the 20th century. The implication of our results is that South Asian low lean mass, and associated NCD susceptibility, may have a genetic basis and is unlikely to change in the short term, so that other strategies (such as behavioural and/or dietary intervention) are required to address the epidemic of NCDs that is particularly acute in South Asia.
Methods
The sample comprises all adult skeletons for which data could be collected or gathered from publications from archaeological sites or historically-collected specimens from India, Sri Lanka, Pakistan and Bangladesh (n = 197, 59 female and 138 male: see Fig. 1 and Supplementary Table 2). It is unknown whether there is currently geographical variation in the low lean mass phenotype within South Asia. Like many quantitative traits, it is likely to show a clinal distribution rather than distinct geographical limits. While other Asian populations show a tendency towards proportionally lower lean mass, this is less marked than among South Asians74. Particularly low lean mass and elevated T2D risk has been reported among geographically distant Pakistani, Bangladeshi, Sri Lankan and Indian populations or people with origins in those countries10,75, and although data are sparse, in Indian tribal and caste groups alike76. Thus skeletal collections from these countries were sought and included.
VMT and EP measured all available adult skeletons (assessed by full epiphyseal closure with the exception of the medial clavicle, third molar eruption, and/or fusion of the spheno-occipital synchondrosis) curated in the archaeological collections at Deccan College Post-Graduate and Research Institute, Pune (n = 35) and a mean of their measurements was used. Additional data were collected by EP and JTS (n = 2) or from published sources (n = 120) where access to the collections was not possible. Data were added to the database only where we could be confident that the measurement definitions used by the authors matched those used for this study.
Data were also collected by EP (n = 40) from teaching skeletons at the University of Toronto (St George and Mississauga campuses) that are of recent individuals from India. They were obtained in the second half of the 20th century from suppliers in Kolkata (S. Pfeiffer, pers. comm. 2016), similar to teaching collections in numerous US and UK institutions77. While such collections can be problematic due to mixing elements from multiple individuals before or after sale, each skeleton was examined to ensure that limb and pelvic bones were consistent with belonging to a single individual through limb proportions and joint congruity, and elements which did not fit or individuals deemed extensively mixed were excluded. Such skeletons were typically obtained from relatively poor, low status individuals77. Therefore the sample is unlikely to be phenotypically or genetically representative of the Indian subcontinent in the 20th century. Nonetheless, our results for stature are consistent with previous analyses of long-term trends in South Asian stature based on estimates from archaeological skeletons and modern anthropometric data25,26,64. Given the care taken in measuring and assessing the integrity of modern skeletons used in our study and concordance with previous work, we can be confident that our findings are broadly reliable.
The combination of measurements from multiple observers (including from publications) raises questions concerning inter-observer error on the data. We selected published measurements carefully to ensure they were taken in an equivalent manner to ours, but we are unable to quantify the magnitude of inter-observer error in our final dataset. Previous research suggests postcranial measurements can be relatively reliable across different observers74, though any inter-observer error will have resulted in more conservative results.
To put the data in the context of worldwide skeletal variation we used a dataset of Late Pleistocene and Holocene adult skeletons (n = 2,003: Fig. 2) composed of the Goldman Dataset (n = 1,527)78,79 and a database of global hunter-gatherer skeletal data collected by JTS (n = 476: Fig. 2). Climatic influences on preservation, a relatively limited density of archaeological excavations, and past mortuary practices (widespread cremation) limit the availability of data from South Asian archaeological skeletons. Consequently, to maximise sample size we used both long bone joint and shaft breadths as proxies for lean mass and long bone lengths as proxies for stature from all available major limb bones (Table 1). Measurements were selected based on availability in published sources and comparative datasets.
Table 1.
Skeletal measurements used in the study.
| Bone | Lengths | Breadths |
|---|---|---|
| Humerus | Maximum (#1) | Supero-inferior head diameter (#10) |
| Antero-posterior head diameter*98 | ||
| Distal epicondylar breadth (#2) | ||
| Ulna | Maximum (#1)* | |
| Radius | Maximum (#1) | |
| Femur | Maximum (#1) | Supero-inferior head diameter (#18) |
| Antero-posterior head diameter (#19)* | ||
| Supero-inferior neck diameter (#15)* | ||
| Subtrochanter medio-lateral diameter (#9)* | ||
| Midshaft medio-lateral diameter (#7) | ||
| Distal epicondylar breadth (#21) | ||
| Distal joint surface breadth99 | ||
| Tibia | Maximum (#1a) | Proximal joint surface breadth (#3) |
| Tibia midshaft medio-lateral breadth (#9) | ||
| Distal epiphyseal breadth (#6) |
Joint surface dimensions, particularly femoral head diameter, are widely used to estimate body mass79,80. They do not respond to altered loading due to activity levels or body mass during adulthood, but are widely considered to be fixed at the end of growth at a size proportional to body mass57,81, and thus represent what we might consider early adult (or ‘peak’) phenotype. We can expect joint dimensions to act as a reliable proxy for lean mass because: (1) in past populations excess adiposity is assumed to have been uncommon; (2) excess weight gain in more traditional societies typically occurs from middle adulthood82 after joint diameters are fixed; (3) lean mass is the major component of total body mass83; (4) joint dimensions show a closer relationship to lean mass than fat or total body mass57,59; and (5) joint dimensions are unaffected by age at death or changes in lifestyle during adulthood.
Unlike joint dimensions, shaft dimensions respond to changes in loading (both from activity and body mass) during life and are affected by age84,85. Activity levels also influence muscularity and thus lean mass, so variation in behaviour could confound estimates of lean mass derived from bone shaft diameters. However, we can still expect bone shaft dimensions to be reliable indicators of lean mass for several reasons. Body mass is the major determinant of long bone cross-sectional properties, accounting for approximately 80% of observed variation86. Consequently, analyses of activity patterns adjust shaft cross-sectional properties for body mass87 and body mass estimation equations based on cross-sectional geometry have been previously derived for non-adults88. Particularly in past, presumably relatively lean and active populations, lean mass would be the major determinant of total body mass. In fact, there is evidence that both joint and shaft diameters are more strongly related to lean mass than to total body mass, and correlate poorly with fat mass58,59,89. While these data derive from contemporary populations whose diets and lifestyles likely differ significantly from those of many of the archaeological samples included in our study, the concordance of evidence from diverse samples (European varsity level athletes and controls, rural-urbanising South Asian young adults, and elderly Afro-Caribbean males) would suggest this link between lean mass and bone shaft dimensions is valid. Shaft diameters of both upper and lower limb bones are similarly related to lean mass58 justifying the inclusion of bone shaft properties from both limbs. Finally, although bone cross-sections do respond to changes in loading with age, they are thought to mainly reflect loading in late adolescence/early adulthood84.
Thus while the use of bone shaft diameters may introduce some noise into our data on inferred lean mass, the benefits of greater sample size from including such measures, given limited skeletal preservation, are likely to outweigh any disadvantage. The evidence suggests that shaft dimensions should still be good indicators of lean mass, and excluding skeletons without joint breadth measurements reduces the sample size from 197 to 139. Nonetheless, to be cautious we repeated all analyses using only joint surface diameters to confirm the results. These restricted analyses demonstrate broadly the same pattern of results, the main difference being that the temporal trend in inferred lean mass is no longer significant, perhaps as a result of small sample size. This gives confidence in our approach and findings (see Supplementary Information online for these results and further discussion of our skeletal proxies for lean mass).
As stature is a major determinant of absolute lean mass, we analysed geographic and temporal patterns in bone breadths relative to long bone lengths, as a proxy for stature. Limb bone lengths are widely used to estimate stature (e.g.90,91) and give relatively reliable results (standard errors of estimates 2–4 cm). The relationship between bone lengths and total stature varies temporally and geographically between populations due to variation in body proportions92, as well as between individuals. At present it is unclear whether available equation sets are broadly applicable to South Asian skeletons33,93. The same problem applies to many of the other populations in the worldwide dataset. Therefore limb bone lengths were used as a stature proxy. It is widely acknowledged that lower limb bones are better indicators of stature than upper limb bones, and that variation in torso length also contributes to stature variation94. As limb bone lengths show greater sensitivity to environmental conditions than trunk length95 they are likely to be the most variable component of stature, and thus a reliable proxy for stature variation. Furthermore, upper limb long bones are widely used in stature estimation where lower limb bones are unavailable as they are still reliable estimators of stature. Therefore we consider our approach to be justified in order to make optimal use of the limited available data.
To further maximise use of the limited available data, we calculated sex-specific z-scores for each long bone measurement separately, and then averaged them across long bones within individuals. Z-scores express measurements in standard deviation units, and permit measurements of differing magnitudes (e.g., from different skeletal elements) to be directly combined or compared. The use of sex-specific scores also allowed the sexes to be pooled. The worldwide dataset was used for the calculation of z-scores to prevent small sample sizes resulting in stochastic variation in the z-scores. For each individual skeleton, the mean of the available bone breadth z-scores and the mean of the available bone length z-scores were taken to represent the individual’s lean mass and stature respectively. To be included in the dataset, an individual required at least one length and one breadth measurement. While the combination of variables into a geometric mean to represent size is more common in anthropology, the high frequency of missing data in the sample made this approach unreliable and the z-scores were preferred to maximise statistical power and permit the combination of data from fragmentary individuals of both sexes.
Statistical analyses
Analyses were conducted in SPSS for Windows v. 25.0 (IBM Corp., Chicago, USA) with p ≤ 0.05 considered statistically significant. The relationship between inferred lean mass and stature among South Asian skeletons relative to the worldwide dataset was assessed visually using scatterplots. An RMA regression line was fitted to the full sample in order to characterise the relationship between length and breadth z-scores, and to demonstrate when individuals had greater or less inferred lean mass relative to stature. RMA regression was chosen since the aim of this analysis was to describe the relationship between the variables, without assuming the direction of causation or the aim of producing prediction equations, and because both variables were measured with error79,96.
Temporal trends in South Asian inferred lean mass were assessed using ordinary least squares (OLS) regression. OLS regression was selected in this case because the dependent variable is expected to be restricted, limited or determined by the independent variable96. Site dates were taken from relevant publications (Supplementary Table 2). Dating methods varied widely by site, and only included direct radiometric dating of the remains themselves or their immediate contexts in a minority of cases. As most sites were dated based on cultural associations with reference to established regional chronologies, published date ranges were used and no attempt was made to re-calibrate published radiocarbon dates, which are few for any one site and unlikely to represent the full range of ages of the associated skeletons. While this may introduce some error when trying to identify temporal patterns in lean mass and stature, longer-term trends should still be evident. For analyses, site date ranges were converted to years before present and the midpoint of any range taken as the representative date for that sample.
Within the South Asian sample, mean individual bone breadth z-score was regressed on site date, adjusting for length z-score, latitude and longitude. Stature is known to decrease from north to south and west to east in South Asia71, so latitude and longitude were included in the initial models to account for potential geographical variation in height. Longitude was subsequently removed as it was not statistically significant. To assess temporal trends in stature, we regressed length z-score on latitude, and plotted the standardised residual against site date. We did not fit a line to the length z-score data since linear, curvilinear or LOWESS regression methods did not provide a visually convincing fit to the data across the full 11,000 years (that is, while the models could be fitted, plotting the resulting models onto the data did not provide a satisfactory correspondence between the model and the data suggesting the models were not appropriate). OLS regression was used to assess the trend in length z-score over the last 5,000 years where a straight line provided a convincing fit, and a two-tailed t-test was used to compare mean length z-scores before and after the change observed at around 5,000 years ago.
Supplementary information
Acknowledgements
This research was supported by the following grants: Leverhulme Trust Early Career Fellowship (EP); British Academy International Partnership and Mobility Scheme Grant (VMT and EP); FP7 Ideas: European Research Council (FP/2007-2013)/ERC Grant Agreement n.617627 (JTS); Medical Research Council grant MR/R010692/1 (TJC). Discussions as part of the UCL DIABETES Network (funded by University College London) helped to shape some of the ideas discussed here. Thanks to Professor Subhash Walimbe for his help and advice, and to Professor Susan Pfeiffer and Cathy David at the Department of Anthropology, University of Toronto (St George Campus) and to Dr Heather Miller and Dr Trevor Orchard University of Toronto at Mississauga for access to and assistance with collections. Thanks also to Oshan Wedage, Nimal Perera, Siran Deraniyagala and Mike Petraglia for access to materials from Fa Hien and Kuragala, Sri Lanka. Finally, we thank Professor John Lukacs and three anonymous reviewers and their valuable feedback that helped to significantly improve the manuscript.
Author Contributions
E.P., J.C.K.W. and J.T.S. conceived the study; E.P., V.M.T. and J.T.S. collected data; E.P. analysed the data; T.J.C. advised on statistical analyses and data interpretation; E.P. drafted the manuscript, and all authors reviewed the text and approved the final version.
Data Availability
All data generated or analysed during this study are included in this published article (and its Supplementary Information Files). The original Goldman Dataset is freely available online at https://web.utk.edu/~auerbach/GOLD.htm.
Competing Interests
The authors declare no competing interests.
Footnotes
Publisher’s note: Springer Nature remains neutral with regard to jurisdictional claims in published maps and institutional affiliations.
Jonathan C. K. Wells and Jay T. Stock contributed equally.
Supplementary information
Supplementary information accompanies this paper at 10.1038/s41598-019-46960-9.
References
- 1.WHO. Global action plan for the prevention and control of noncommunicable diseases 2013–2020. World Health Organization (2013).
- 2.Wells JC, Pomeroy E, Walimbe SR, Popkin BM, Yajnik CS. The elevated susceptibility to diabetes in India: an evolutionary perspective. Front. Public Health. 2016;4:145. doi: 10.3389/fpubh.2016.00145. [DOI] [PMC free article] [PubMed] [Google Scholar]
- 3.International Diabetes Federation. IDF Diabetes Atlas, 8th Edition edn. International Diabetes Federation. Available online at, www.diabetesatlas.org accessed 29/06/2018 (2017).
- 4.Jayawardena R, et al. Prevalence and trends of the diabetes epidemic in South Asia: a systematic review and meta-analysis. BMC Public Health. 2012;12:380. doi: 10.1186/1471-2458-12-380. [DOI] [PMC free article] [PubMed] [Google Scholar]
- 5.Gujral UP, Pradeepa R, Weber MB, Narayan KMV, Mohan V. Type 2 diabetes in South Asians: similarities and differences with white Caucasian and other populations. Ann. New York Acad. Sci. 2013;1281:51–63. doi: 10.1111/j.1749-6632.2012.06838.x. [DOI] [PMC free article] [PubMed] [Google Scholar]
- 6.Razak F, et al. Ethnic differences in the relationships between obesity and glucose-metabolic abnormalities: a cross-sectional population-based study. Int. J. Obes. Relat. Metab. Disord. 2005;29:656–667. doi: 10.1038/sj.ijo.0802937. [DOI] [PubMed] [Google Scholar]
- 7.Tillin T, et al. Ethnicity-specific obesity cut-points in the development of Type 2 diabetes – a prospective study including three ethnic groups in the United Kingdom. Diabetic Med. 2015;32:226–234. doi: 10.1111/dme.12576. [DOI] [PMC free article] [PubMed] [Google Scholar]
- 8.Rush EC, Freitas I, Plank LD. Body size, body composition and fat distribution: comparative analysis of European, Maori, Pacific Island and Asian Indian adults. Br. J. Nutr. 2009;102:632–641. doi: 10.1017/S0007114508207221. [DOI] [PubMed] [Google Scholar]
- 9.Yajnik CS, et al. Neonatal anthropometry: the thin-fat Indian baby. The Pune Maternal Nutrition Study. Int. J. Obes. Relat. Metab. Disord. 2003;27:173–180. doi: 10.1038/sj.ijo.802219. [DOI] [PubMed] [Google Scholar]
- 10.West J, et al. UK-born Pakistani-origin infants are relatively more adipose than white British infants: findings from 8704 mother-offspring pairs in the Born-in-Bradford prospective birth cohort. J. Epidemiol.Community Health. 2013;67:544–551. doi: 10.1136/jech-2012-201891. [DOI] [PMC free article] [PubMed] [Google Scholar]
- 11.Stanfield KM, Wells JC, Fewtrell MS, Frost C, Leon DA. Differences in body composition between infants of South Asian and European ancestry: the London Mother and Baby Study. Int. J. Epidemiol. 2012;41:1409–1418. doi: 10.1093/ije/dys139. [DOI] [PMC free article] [PubMed] [Google Scholar]
- 12.Karamali NS, et al. Thin–fat insulin-resistant phenotype also present in South Asian neonates born in the Netherlands. J. Dev. Orig. Health Dis. 2015;6:47–52. doi: 10.1017/S204017441400052X. [DOI] [PubMed] [Google Scholar]
- 13.van Steijn L, et al. Neonatal anthropometry: thin-fat phenotype in fourth to fifth generation South Asian neonates in Surinam. Int. J. Obes. 2009;33:1326–1329. doi: 10.1038/ijo.2009.154. [DOI] [PubMed] [Google Scholar]
- 14.Unni US, et al. Muscle mass and functional correlates of insulin sensitivity in lean young Indian men. Eur. J. Clin. Nutr. 2009;63:1206–1212. doi: 10.1038/ejcn.2009.32. [DOI] [PubMed] [Google Scholar]
- 15.Wells JCK. Body composition and susceptibility to type 2 diabetes: an evolutionary perspective. Eur. J. Clin. Nutr. 2017;71:881–889. doi: 10.1038/ejcn.2017.31. [DOI] [PubMed] [Google Scholar]
- 16.Risk NCD. Factor Collaboration. A century of trends in adult human height. eLife. 2016;5:e13410. doi: 10.7554/eLife.13410. [DOI] [PMC free article] [PubMed] [Google Scholar]
- 17.Yajnik CS, et al. Higher glucose, insulin and insulin resistance (HOMA-IR) in childhood predict adverse cardiovascular risk in early adulthood: the Pune Children’s Study. Diabetologia. 2015;58:1626–1636. doi: 10.1007/s00125-015-3602-z. [DOI] [PMC free article] [PubMed] [Google Scholar]
- 18.Brite J, et al. Height and the risk of gestational diabetes: variations by race/ethnicity. Diabetic Med. 2014;31:332–340. doi: 10.1111/dme.12355. [DOI] [PMC free article] [PubMed] [Google Scholar]
- 19.Kottek M, Grieser J, Beck C, Rudolf B, Rubel F. World Map of the Köppen-Geiger climate classification updated. Meteorol. Z. 2006;15:259–263. doi: 10.1127/0941-2948/2006/0130. [DOI] [Google Scholar]
- 20.Bae, C. J., Douka, K. & Petraglia, M. D. On the origin of modern humans: Asian perspectives. Science358 (2017). [DOI] [PubMed]
- 21.Pelto GH, Pelto PJ. Small but Healthy? An Anthropological Perspective. Hum. Organ. 1989;48:11–15. doi: 10.17730/humo.48.1.eu7v81qn71w172tu. [DOI] [Google Scholar]
- 22.Markgraf, V. & Diaz, H. F. The past ENSO record: A synthesis. In El Niño and the Southern Oscillation: Multiscale Variability and Global and Regional Impacts in El Niño and the Southern Oscillation: Multiscale Variability and Global and Regional Impact (eds Diaz, H. F. & Markgraf, V.). (Cambridge University Press, 2000).
- 23.Cohen, M. N. & Armelagos, G. J. (eds) Paleopathology at the Origins of Agriculture. (Academic Press, 1984).
- 24.Mummert A, Esche E, Robinson J, Armelagos GJ. Stature and robusticity during the agricultural transition: Evidence from the bioarchaeological record. Econ. Hum. Biol. 2011;9:284–301. doi: 10.1016/j.ehb.2011.03.004. [DOI] [PubMed] [Google Scholar]
- 25.Baernstein A, Kennedy KAR. Stature variability in prehistoric and modern South Asian populations: a bio-cultural approach. J. Hum. Ecol. 1990;1:81–108. doi: 10.1080/09709274.1990.11907664. [DOI] [Google Scholar]
- 26.Lukacs, J. R. Human biological diversity in ancient India: Dr Irawati Karve and contemporary issues in biological anthropology in Anthropology for archaeology: proceedings of the Professor Irawati Karve birth centenary seminar (eds Walimbe, S. R., Joglekar, P. P. & Basa, K. K.). (Deccan College Post-Graduate and Reseaech Institute, 2007).
- 27.Murphy, C. A. & Fuller, D. Q. The Transition to Agricultural Production in India in A Companion to South Asia in the Past (eds Robbins-Schug, G. & Walimbe, S. R.). (John Wiley & Sons, Inc, 2016).
- 28.Yajnik CS, et al. Vitamin B12 and folate concentrations during pregnancy and insulin resistance in the offspring: the Pune Maternal Nutrition Study. Diabetologia. 2008;51:29–38. doi: 10.1007/s00125-007-0793-y. [DOI] [PMC free article] [PubMed] [Google Scholar]
- 29.Sen, C. T. Feasts and Fasts: A History of Food in India. (Reaktion Books, 2014).
- 30.Joglekar PP. Domestic animals in ancient India in the light of literary and archaeological evidence. Bharati. 1995;21:1–19. [Google Scholar]
- 31.Davis, M. Late Victorian Holocausts: El Niño Famines and the Making of the Third World. (Verso, 2002).
- 32.Wells JCK. Maternal capital and the metabolic ghetto: An evolutionary perspective on the transgenerational basis of health inequalities. Am. J. H. Biol. 2010;22:1–17. doi: 10.1002/ajhb.20994. [DOI] [PubMed] [Google Scholar]
- 33.Pomeroy Emma, Mushrif-Tripathy Veena, Wells Jonathan C. K., Kulkarni Bharati, Kinra Sanjay, Stock Jay T. Stature estimation equations for South Asian skeletons based on DXA scans of contemporary adults. American Journal of Physical Anthropology. 2018;167(1):20–31. doi: 10.1002/ajpa.23596. [DOI] [PubMed] [Google Scholar]
- 34.Kennedy KAR. Climatic events and environmental adaptations relating to the Mesolithic hominids of the Gangetic Plain. Quatern. Int. 2008;192:14–19. doi: 10.1016/j.quaint.2007.06.017. [DOI] [Google Scholar]
- 35.Pearson OM. Activity, climate, and postcranial robusticity - Implications for modern human origins and scenarios of adaptive change. Curr. Anthropol. 2000;41:569–607. [PubMed] [Google Scholar]
- 36.Lukacs JR, Pal JN. Skeletal variation among Mesolithic People of the Ganga Plains: New evidence of habitual activity and adaptation to climate. Asian Perspect. 2003;42:329–351. doi: 10.1353/asi.2003.0042. [DOI] [Google Scholar]
- 37.Wang Z, Hoy WE, Si D. Incidence of type 2 diabetes in Aboriginal Australians: an 11-year prospective cohort study. BMC Public Health. 2010;10:487. doi: 10.1186/1471-2458-10-487. [DOI] [PMC free article] [PubMed] [Google Scholar]
- 38.Piers LS, Rowley KG, Soares MJ, O’Dea K. Relation of adiposity and body fat distribution to body mass index in Australians of Aboriginal and European ancestry. Eur. J. Clin. Nutr. 2003;57:956–963. doi: 10.1038/sj.ejcn.1601630. [DOI] [PubMed] [Google Scholar]
- 39.Kondalsamy-Chennakesavan S, et al. Anthropometric measurements of Australian Aboriginal adults living in remote areas: Comparison with nationally representative findings. Am. J. Hum. Biol. 2008;20:317–324. doi: 10.1002/ajhb.20729. [DOI] [PubMed] [Google Scholar]
- 40.Norgan NG. Relative sitting height and the interpretation of the body mass index. Ann. Hum Biol. 1994;21:79–82. doi: 10.1080/03014469400003092. [DOI] [PubMed] [Google Scholar]
- 41.Majumder PP, Basu A. A Genomic View of the Peopling and Population Structure of India. Cold Spring Harb. Perspect. Biol. 2015;7:a008540. doi: 10.1101/cshperspect.a008540. [DOI] [PMC free article] [PubMed] [Google Scholar]
- 42.Reyes-Centeno H, et al. Genomic and cranial phenotype data support multiple modern human dispersals from Africa and a southern route into Asia. Proc. Natl. Acad. Sci. USA. 2014;111:7248–7253. doi: 10.1073/pnas.1323666111. [DOI] [PMC free article] [PubMed] [Google Scholar]
- 43.Stock, J. T., Lahr, M. M. & Kulatilake, S. Cranial diversity in South Asia relative to modern human dispersals and global patterns of human variation in The Evolution and History of Human Populations in South Asia (eds Petraglia, M.& Allchin, B.). (Springer Netherlands, 2007).
- 44.Metspalu M, et al. Shared and unique components of human population structure and genome-wide signals of positive selection in South Asia. Am. J. Hum. Genet. 2011;89:731–744. doi: 10.1016/j.ajhg.2011.11.010. [DOI] [PMC free article] [PubMed] [Google Scholar]
- 45.Bhatt SP, et al. Association of the myostatin gene with obesity, abdominal obesity and Low lean body mass and in non-diabetic Asian Indians in North India. PLOS ONE. 2012;7:e40977. doi: 10.1371/journal.pone.0040977. [DOI] [PMC free article] [PubMed] [Google Scholar]
- 46.Kulkarni B, Shatrugna V, Balakrishna N. Maternal lean body mass may be the major determinant of birth weight: a study from India. Eur. J. Clin. Nutr. 2006;60:1341. doi: 10.1038/sj.ejcn.1602461. [DOI] [PubMed] [Google Scholar]
- 47.Singhal A, Wells J, Cole TJ, Fewtrell M, Lucas A. Programming of lean body mass: a link between birth weight, obesity, and cardiovascular disease? Am. J.Clin. Nutr. 2003;77:726–730. doi: 10.1093/ajcn/77.3.726. [DOI] [PubMed] [Google Scholar]
- 48.Hardikar Anandwardhan A, et al. Multigenerational undernutrition increases susceptibility to obesity and diabetes that is not reversed after dietary recuperation. Cell Metab. 2015;22:312–319. doi: 10.1016/j.cmet.2015.06.008. [DOI] [PubMed] [Google Scholar]
- 49.Janipalli CS, et al. Analysis of 32 common susceptibility genetic variants and their combined effect in predicting risk of Type 2 diabetes and related traits in Indians. Diabetic Med. 2012;29:121–127. doi: 10.1111/j.1464-5491.2011.03438.x. [DOI] [PubMed] [Google Scholar]
- 50.Sanghera DK, et al. Impact of nine common type 2 diabetes risk polymorphisms in Asian Indian Sikhs: PPARG2 (Pro12Ala), IGF2BP2, TCF7L2 and FTOvariants confer a significant risk. BMC Medical Genetics. 2008;9:1–9. doi: 10.1186/1471-2350-9-59. [DOI] [PMC free article] [PubMed] [Google Scholar]
- 51.Hales CN, et al. Fetal and infant growth and impaired glucose tolerance at age 64. Br. Med. J. 1991;303:1019–1022. doi: 10.1136/bmj.303.6809.1019. [DOI] [PMC free article] [PubMed] [Google Scholar]
- 52.Fall C, et al. Size at birth, maternal weight, and type 2 diabetes in South India. Diabetic Med. 1998;15:220–227. doi: 10.1002/(SICI)1096-9136(199803)15:3<220::AID-DIA544>3.0.CO;2-O. [DOI] [PubMed] [Google Scholar]
- 53.World Health Organization. Low birth weight: a tabulation of available information. World Health Organization (1992).
- 54.Kensara OA, et al. Fetal programming of body composition: relation between birth weight and body composition measured with dual-energy X-ray absorptiometry and anthropometric methods in older Englishmen. Am. J. Clin. Nutr. 2005;82:980–987. doi: 10.1093/ajcn/82.5.980. [DOI] [PubMed] [Google Scholar]
- 55.Mañalich R, Reyes L, Herrera M, Melendi C, Fundora I. Relationship between weight at birth and the number and size of renal glomeruli in humans: A histomorphometric study. Kidney Int. 2000;58:770–773. doi: 10.1046/j.1523-1755.2000.00225.x. [DOI] [PubMed] [Google Scholar]
- 56.Wells JCK. The thrifty phenotype: An adaptation in growth or metabolism? Am. J. Hum. Biol. 2011;23:65–75. doi: 10.1002/ajhb.21100. [DOI] [PubMed] [Google Scholar]
- 57.Ruff CB, Scott WW, Liu AY. Articular and diaphyseal remodeling of the proximal femur with changes in body mass in adults. Am. J. Phys. Anthropol. 1991;86:397–413. doi: 10.1002/ajpa.1330860306. [DOI] [PubMed] [Google Scholar]
- 58.Pomeroy E, Macintosh A, Wells JCK, Cole TJ, Stock JT. Relationship between body mass, lean mass, fat mass, and limb bone cross‐sectional geometry: Implications for estimating body mass and physique from the skeleton. Am. J. Phys. Anthropol. 2018;166:56–69. doi: 10.1002/ajpa.23398. [DOI] [PMC free article] [PubMed] [Google Scholar]
- 59.Pomeroy Emma, Mushrif-Tripathy Veena, Kulkarni Bharati, Kinra Sanjay, Stock Jay T., Cole Tim J., Shirley Meghan K., Wells Jonathan C. K. Estimating body mass and composition from proximal femur dimensions using dual energy x-ray absorptiometry. Archaeological and Anthropological Sciences. 2018;11(5):2167–2179. doi: 10.1007/s12520-018-0665-z. [DOI] [PMC free article] [PubMed] [Google Scholar]
- 60.Marwaha RK, et al. Normative data of body fat mass and its distribution as assessed by DXA in Indian adult population. J. Clin. Densitom. 2014;17:136–142. doi: 10.1016/j.jocd.2013.01.002. [DOI] [PubMed] [Google Scholar]
- 61.Wells JCK, Chomtho S, Fewtrell MS. Programming of body composition by early growth and nutrition. Proc. Nutr. Soc. 2007;66:423–434. doi: 10.1017/S0029665107005691. [DOI] [PubMed] [Google Scholar]
- 62.Janghorbani M, Momeni F, Dehghani M. Hip circumference, height and risk of type 2 diabetes: systematic review and meta-analysis. Obes. Rev. 2012;13:1172–1181. doi: 10.1111/j.1467-789X.2012.01030.x. [DOI] [PubMed] [Google Scholar]
- 63.Walimbe SR, Behera PK, Mushrif V. A human skeleton discovered from the rock shelter site of Deulga Hills (District Sambalpur), Orissa. Man Env. 2001;26:99–107. [Google Scholar]
- 64.Brennan L, McDonald J, Shlomowitz R. Toward an anthropometric history of Indians under British rule. Res. Econ. Hist. 1997;17:185–246. [Google Scholar]
- 65.Ruff CB. Morphological adaptation to climate in modern and fossil hominids. Am. J. Phys. Anthropol. 1994;37:65–107. doi: 10.1002/ajpa.1330370605. [DOI] [Google Scholar]
- 66.Tanner JM. Growth as a mirror of the condition of society: secular trends and class distinctions. Pediatr. Int. 1987;29:96–103. doi: 10.1111/j.1442-200X.1987.tb00015.x. [DOI] [PubMed] [Google Scholar]
- 67.Petraglia, M. D. & Allchin, B. The Evolution and History of Human Populations in South Asia: Inter-disciplinary Studies in Archaeology, Biological Anthropology, Linguistics and Genetics. (Springer Netherlands, 2007).
- 68.Roseman CC, Auerbach BM. Ecogeography, genetics, and the evolution of human body form. J. Hum. Evol. 2015;78:80–90. doi: 10.1016/j.jhevol.2014.07.006. [DOI] [PubMed] [Google Scholar]
- 69.Betti L, von Cramon-Taubadel N, Manica A, Lycett SJ. The interaction of neutral evolutionary processes with climatically-driven adaptive changes in the 3D shape of the human os coxae. J. Hum. Evol. 2014;73:64–74. doi: 10.1016/j.jhevol.2014.02.021. [DOI] [PubMed] [Google Scholar]
- 70.Akhtar S, Dhillon P. Prevalence of diagnosed diabetes and associated risk factors: Evidence from the large-scale surveys in India. J. Soc. Health Diabetes. 2017;5:28–36. doi: 10.4103/2321-0656.194001. [DOI] [Google Scholar]
- 71.Guntupalli AM, Baten J. The development and inequality of heights in North, West, and East India 1915–1944. Explor. Econ. Hist. 2006;43:578–608. doi: 10.1016/j.eeh.2005.05.005. [DOI] [Google Scholar]
- 72.Raj SM, et al. Variation at diabetes- and obesity-associated loci may mirror neutral patterns of human population diversity and diabetes prevalence in India. Ann. Hum. Genet. 2013;77:392–408. doi: 10.1111/ahg.12028. [DOI] [PubMed] [Google Scholar]
- 73.Adams B, Byrd J. Interobserver variation of selected postcranial skeletal measurements. J. Forensic Sci. 2002;47:1193–1202. [PubMed] [Google Scholar]
- 74.Deurenberg-Yap M, Schmidt G, van Staveren WA, Deurenberg P. The paradox of low body mass index and high body fat percentage among Chinese, Malays and Indians in Singapore. Int. J. Obesity Rel. Metab. Disord. 2000;24:1011–1017. doi: 10.1038/sj.ijo.0801353. [DOI] [PubMed] [Google Scholar]
- 75.Shaikh S, et al. Excessive adiposity at low BMI levels among women in rural Bangladesh. J. Nutr. Sci. 2016;5:e11. doi: 10.1017/jns.2015.32. [DOI] [PMC free article] [PubMed] [Google Scholar]
- 76.Lau SL, et al. Healthcare planning in north-east India: A survey on diabetes awareness, risk factors and health attitudes in a rural community. J. Assoc. Physicians India. 2009;57:305–309. [PubMed] [Google Scholar]
- 77.Hefner JT, Spatola BF, Passalacqua NV, Gocha TP. Beyond Taphonomy: Exploring Craniometric Variation Among Anatomical Material. J. Forensic Sci. 2016;61:1440–1449. doi: 10.1111/1556-4029.13177. [DOI] [PubMed] [Google Scholar]
- 78.Auerbach, B. http://web.utk.edu/~auerbach/GOLD.htm, accessed 30/05/2015.
- 79.Auerbach BM, Ruff CB. Human body mass estimation: a comparison of “morphometric” and “mechanical” methods. Am. J. Phys. Anthropol. 2004;125:331–342. doi: 10.1002/ajpa.20032. [DOI] [PubMed] [Google Scholar]
- 80.Will M, Stock JT. Spatial and temporal variation of body size among early Homo. J. Hum. Evol. 2015;82:15–33. doi: 10.1016/j.jhevol.2015.02.009. [DOI] [PubMed] [Google Scholar]
- 81.Lieberman DE, Devlin MJ, Pearson OM. Articular area responses to mechanical loading: effects of exercise, age, and skeletal location. Am. J. Phys. Anthropol. 2001;116:266–277. doi: 10.1002/ajpa.1123. [DOI] [PubMed] [Google Scholar]
- 82.Hruschka DJ, Hadley C, Brewis A. Disentangling basal and accumulated body mass for cross-population comparisons. Am. J. Phys. Anthropol. 2014;153:542–550. doi: 10.1002/ajpa.22452. [DOI] [PubMed] [Google Scholar]
- 83.Wells, J. C. K. The Evolutionary Biology of Human Body Fatness: Thrift and Control. (Cambridge University Press, 2010).
- 84.Ruff CB, Holt B, Trinkaus E. Who’s afraid of the big bad Wolff?: “Wolff’s law” and bone functional adaptation. Am. J. Phys. Anthropol. 2006;129:484–498. doi: 10.1002/ajpa.20371. [DOI] [PubMed] [Google Scholar]
- 85.Feik SA, Thomas CDL, Bruns R, Clement JG. Regional variations in cortical modeling in the femoral mid-shaft: Sex and age differences. Am. J. Phys. Anthropol. 2000;112:191–205. doi: 10.1002/(SICI)1096-8644(2000)112:2<191::AID-AJPA6>3.0.CO;2-3. [DOI] [PubMed] [Google Scholar]
- 86.Davies, T. Cross-sectional variation in the human femur and tibia: The influence of physique and habitual mobility on diaphyseal morphology. PhD thesis, Department of Archaeology and Anthropology, University of Cambridge (2013).
- 87.Ruff, C. B. Biomechanical analyses of archaeological human skeletons in Biological Anthropology of the Human Skeleton (eds Katzenberg, M. A. & Saunders, S. R.). 2nd edn. Wiley-Liss (2008).
- 88.Robbins G, Sciulli PW, Blatt SH. Estimating body mass in subadult human skeletons. Am. J. Phys. Anthropol. 2010;143:146–150. doi: 10.1002/ajpa.21320. [DOI] [PubMed] [Google Scholar]
- 89.Semanick LM, et al. Association of Body Composition and Physical Activity with Proximal Femur Geometry in Middle-Aged and Elderly Afro-Caribbean Men. Calcif. Tissue Int. 2005;77:160–166. doi: 10.1007/s00223-005-0037-4. [DOI] [PubMed] [Google Scholar]
- 90.Trotter M, Gleser GC. Estimation of stature from long bones of American whites and negroes. Am. J. Phys. Anthropol. 1952;10:463–514. doi: 10.1002/ajpa.1330100407. [DOI] [PubMed] [Google Scholar]
- 91.Ruff CB, et al. Stature and body mass estimation from skeletal remains in the European Holocene. Am. J. Phys. Anthropol. 2012;148:601–617. doi: 10.1002/ajpa.22087. [DOI] [PubMed] [Google Scholar]
- 92.Auerbach BM, Ruff CB. Stature estimation formulae for indigenous North American populations. Am. J. Phys. Anthropol. 2010;141:190–207. doi: 10.1002/ajpa.21131. [DOI] [PubMed] [Google Scholar]
- 93.Lukacs JR, Pal JN, Nelson GC. Stature in Holocene foragers of North India. Am. J. Phys. Anthropol. 2014;153:408–416. doi: 10.1002/ajpa.22439. [DOI] [PubMed] [Google Scholar]
- 94.Raxter MH, et al. Stature estimation in ancient Egyptians: A new technique based on anatomical reconstruction of stature. Am. J. Phys. Anthropol. 2008;136:147–155. doi: 10.1002/ajpa.20790. [DOI] [PubMed] [Google Scholar]
- 95.Bogin B, Varela-Silva MI. Leg length, body proportion, and health: a review with a note on beauty. Int. J. Env. Res. Public Health. 2010;7:1047–1075. doi: 10.3390/ijerph7031047. [DOI] [PMC free article] [PubMed] [Google Scholar]
- 96.Smith RJ. Use and misuse of the reduced major axis for line-fitting. Am. J. Phys. Anthropol. 2009;140:476–486. doi: 10.1002/ajpa.21090. [DOI] [PubMed] [Google Scholar]
- 97.Martin, R. & Saller, K. Lehrbuch der Anthropologie. (Fischer, 1957).
- 98.Corruccini RS, Ciochon RL. Morphometric affinities of the human shoulder. Am. J. Phys. Anthropol. 1976;45:19–37. doi: 10.1002/ajpa.1330450104. [DOI] [PubMed] [Google Scholar]
- 99.Pearson, O. M. Postcranial morphology and the origin of modern humans. Unpublished Ph.D. Thesis, State University of New York, Stoney Brook (1977).
Associated Data
This section collects any data citations, data availability statements, or supplementary materials included in this article.
Supplementary Materials
Data Availability Statement
All data generated or analysed during this study are included in this published article (and its Supplementary Information Files). The original Goldman Dataset is freely available online at https://web.utk.edu/~auerbach/GOLD.htm.