

Abstract
Background
Extracellular vesicles (EVs) harbor thousands of proteins that hold promise for biomarker development. Usually difficult to purify, EVs in urine are relatively easily obtained and have demonstrated efficacy for kidney disease prediction. Herein, we further characterize the proteome of urinary EVs to explore the potential for biomarkers unrelated to kidney dysfunction, focusing on Parkinson's disease (PD).
Methods
Using a quantitative mass spectrometry approach, we measured urinary EV proteins from a discovery cohort of 50 subjects. EVs in urine were classified into subgroups and EV proteins were ranked by abundance and variability over time. Enriched pathways and ontologies in stable EV proteins were identified and proteins that predict PD were further measured in a cohort of 108 subjects.
Findings
Hundreds of commonly expressed urinary EV proteins with stable expression over time were distinguished from proteins with high variability. Bioinformatic analyses reveal a striking enrichment of endolysosomal proteins linked to Parkinson's, Alzheimer's, and Huntington's disease. Tissue and biofluid enrichment analyses show broad representation of EVs from across the body without bias towards kidney or urine proteins. Among the proteins linked to neurological diseases, SNAP23 and calbindin were the most elevated in PD cases with 86% prediction success for disease diagnosis in the discovery cohort and 76% prediction success in the replication cohort.
Interpretation
Urinary EVs are an underutilized but highly accessible resource for biomarker discovery with particular promise for neurological diseases like PD.
Keywords: Biomarkers, Neurodegeneration, Extracellular vesicles, Parkinson's disease, Alzheimer's disease
Research in context.
Evidence before this study
Urinary extracellular vesicles (EVs) have been studied primarily in kidney disease, with the underlying assumption that the majority of the EV pool is composed of extracellular vesicles secreted from kidney cells. Recent experiments demonstrate that EVs have broad access across the body in biofluids and that most, if not all, cells secrete different kinds of EVs. Although thousands of proteins have previously been detected by mass spectrometry in urinary EVs, there have been few attempts to measure urinary EV protein relative abundance, variability over time, and overall potential to better understand disorders unrelated to kidney dysfunction.
Added value of this study
Herein we characterize urinary EVs proteomes obtained from specimens biobanked under the auspices of the Parkinson's Disease Biomarker Program in clinically well-characterized subjects that lack kidney disease. Bioinformatic and statistical approaches demonstrate that urinary EVs harbor a very stable set of proteins commonly expressed among different subjects that are enriched in proteins associated with neurological diseases. In demonstrating the potential of this source of proteins for biomarkers of possible utility in neurological diseases, we demonstrate that two proteins in urinary EVs, calbindin and SNAP23, may be useful for predicting PD.
Implications of all the available evidence
Our findings warrant the collection and biobanking of urine in suitable quantities for EV recovery in clinical studies that involve neurological disorders, especially neurodegenerative diseases, for discovery and validation of biomarkers important in disease. Further, calbindin and SNAP23 may be prioritized for measurements in EVs isolated from PD cases in longitudinal collections and different biofluids to explore the potential of these two proteins in predicting PD susceptibility and progression.
Alt-text: Unlabelled Box
1. Introduction
Extracellular vesicles (EVs) are a subset of small vesicles (40-200 nm) derived from the endolysosomal system and released into biofluids by almost all cell types. EVs play a role in cell-cell communication and are involved in several diseases [[1], [2], [3]]. Recent studies demonstrate EVs mediating some types of immunological responses [[4], [5], [6]], cancer progression and metastasis [[7], [8], [9], [10], [11]], blood coagulation [12,13], and neurodegenerative diseases [1,3,14,15]. Further, emerging studies demonstrate that EVs, especially intraluminal vesicles from multi-vesicular bodies (i.e., exosomes), can readily cross the blood brain barrier and access tissues throughout the body [[16], [17], [18]]. The specific sources and relative contributions of different types of cells through the body to the EV pool in different biofluids remains almost completely unknown.
Compared to proteins and nucleic acids not enveloped in lipid bilayers in the extracellular space, EVs shelter biomolecules from external nucleases, proteases, and other degradative enzymes. EVs in biofluids can be enriched with little bias using ultracentrifugation or size exclusion approaches [19,20]. Thousands of proteins not usually secreted through canonical pathways have been observed in proteomic studies in purified EV fractions [[21], [22], [23], [24]]. Because of the stability of EV proteins in biofluids and diversity in proteomic composition, EVs are under evaluation for biomarker development for application in diagnostic and prognostic approaches in numerous diseases [19,24,25].
While EVs are ubiquitous in biofluids, they are also in very low relative concentration compared to more abundant secreted proteins such as immunoglobins, albumins, and lipoproteins. Higher volume collections of biofluids required for reliable measurement of EV proteins in cerebral spinal fluid, saliva, and plasma present technical challenges in routine clinical settings for biomarker discovery. In contrast, urine can be routinely collected in the hundreds of milliliters in a non-invasive manner without risk. Urinary EV proteins have shown strong promise for kidney diseases including Gitelman syndrome, familial renal hypomagnesemia, urogenital cancers, and acute kidney injury [20,[26], [27], [28]].
Given the polydispersity and recently recognized ability of some EVs to spread throughout the body, herein, we systematically evaluated the proteomic composition in urinary EVs collected in several well-characterized clinical cohorts to understand variability over time and differences in disease states unrelated to kidney dysfunction. We identified urinary EV proteins that vary little between individuals over time, as well as proteins that are greatly different in groups and change dramatically over time. Unbiased bioinformatics analysis reveals enrichment in neurological disease-linked proteins, but not kidney-disease associated proteins, consistent with the polydispersity and multi-organ representation of urinary EV pools. As a case study, we identified several proteins with biomarker potential in a neurological disease, Parkinson's disease (PD), unrelated to kidney disease. Overall these results show that urinary EVs may have broad biomarker potential in numerous diseases and may be an underutilized resource in clinical research.
2. Materials and methods
2.1. Clinical samples
Biobanked urine and blood was obtained from the Movement Disorder Clinic at the University of Alabama at Birmingham enrolled in the Parkinson's Disease Biomarker Program [29]. All protocols were approved by an institutional review board. A discovery cohort for this study was collected in 2014 included 50 participants (28 PD and 22 neurologically normal controls). An independent replication cohort was collected in 2015 and 2016 and included 108 participants (57 PD and 51 healthy controls). All samples were coded with unique identifiers and group identification was assigned after final data curation. Demographic information for both cohorts is listed in Supplemental Tables 1 and 2.
All participants were genotyped (NeuroX array) to screen for known pathogenic mutations for neurological diseases. For all subjects included in the study, medical records were evaluated for a lack of kidney disease, glomerular filtration rates were measured from blood creatinine levels and confirmed as normal. Clinical urinalysis was confirmed normal in all subjects. Clinical data (Supplemental Tables 1 and 2) were collected during the same visit as biospecimen deposition.
2.2. Extracellular vesicle (EV) isolation
~80 mL of urine samples previously biobanked in two 50 mL polypropylene centrifuge tubes (Corning orange-caps) were quick-thawed from −80 °C storage with a shaking 42 °C water bath and placed on ice immediately after thawing. Samples were centrifuged at 10,000 ×g for 30 min at 4 °C and supernatant was transferred and then centrifuged at 100,000 ×g for 1 h at 4 °C. Resultant EV pellets were washed in 1 mL PBS and centrifuge a final time at 100,000 ×g for 1 h at 4 °C. Representative EV isolations and analyses are given in Supplemental Fig. 1a.
2.3. Single-particle tracking and light scattering
Some urine EV pellets were re-suspended in 1 mL phosphate-buffered saline (PBS) after washing and analyzed using Nanosight NS300 single particle tracking. Representative vesicle size and concentrations given were recorded over five tracking runs, 60 s per run.
2.4. Mass spectrometry
Urinary EV pellets resultant from ~40 mL of urine were reconstituted in 400 μL of M-PER Mammalian Protein Extraction Buffer (Thermo) supplemented with 1× Halt Protease Inhibitors (Thermo) and sonicated in an ultrasonic water bath for 15 min. Lysates were exchanged into ~40 μL of 100 mM triethylammonium bicarbonate using Amicon Ultra-0.5, 3 k columns (Millipore). Resultant lysates were quantified using EZQ (Invitrogen) and ~10 μg of protein per sample were diluted in 35 μL of LDS sample buffer (Invitrogen). Proteins were reduced with addition of 5 mM dithiothreitol (DTT) and denatured at 70 °C for 10 min prior to loading into NuPAGE 10% Bis-Tris gels (Invitrogen), with electrophoresis of samples to maximum ~1 cm from the wells. Gels were stained overnight with Colloidal Blue dye (Invitrogen) and following de-staining each lane was excised and equilibrated into 100 mM ammonium bicarbonate (AmBc) with digestion overnight with Trypsin Gold, Mass Spectrometry Grade (Promega). Peptides were finally reconstituted into 0.1% formic acid to a concentration of 0.1 μg μL−1.
For the discovery cohort (see Supplemental Table 1), peptides were injected into a 1260 Infinity nHPLC (Agilent) with separation from a Jupiter C-18 column, 300 Å, 5 μm, Phenomenex) in line with a LTQ XL ion trap mass spectrometer, or for the time-course study, peptides injected into a Thermo Orbitrap Velos Pro (Thermo), both equipped with a nano-electrospray source (Thermo). All fragmentation data were collected in CID mode. The nHPLC was configured with binary mobile phases that included solvent A (0.1% formic acid), and solvent B (0.1% formic acid, 85% acetonitrile) as follows; 10 min at 5% B, 180 min (LTQ XL) or 90 min (Orbitrap) @ 5%–40%B (linear: 0.5 nL/ min, analyze), 5 min @ 70%B (2 μL/ min, wash), 10 min @ 0%B (2 μL/min, equilibrate).
The LTQ XL operated in data-dependent triple play mode, with a survey scan range of 300-1200 m/z, followed by a zoom scan for charge state determination, and an MS2 scan, both carried out with 2.0 da isolation widths on the three most intense ions. Data were collected in profile modes for all scan types. Charge state screening and dynamic exclusion were enabled with a minimum signal intensity of 2000, a repeat count of two, and exclusion duration of 90 s for ions +/− 1.5 m/z of the parent ion. The automatic gain control and scan time settings were set to default modes for both instruments. Activation times, activation Q, and normalized collision energies were set at 30 ms, 0.25, and 35% respectively for both instruments. Spray voltages were set at 1.9 kV, with a capillary temperature of 170 °C. Injections in both the LTQ and Velos Pro were performed in duplicate for all samples with average values utilized for analysis.
XCalibur RAW files were centroided and converted to MzXML and the MGF files were created using both ReAdW and MzXML2Search respectively (http://sourceforge.net/projects/sashimi/). Data were analyzed with SEQUEST (v.27 rev12, .dta files), set for two missed cleavages, a precursor mass window of 0.45 da for LTQ-XL data, and 20 ppm for Orbitrap Velos Pro data, tryptic enzyme, variable modification M @ 15.9949, and static modifications C at 57.0293. Searches were performed with UniRef100 database which includes common contaminants like digestion enzymes and human keratins.
The longitudinal mass spectrometry peptide identifications were filtered using Bio Inquire, the discovery cohort mass spectrometry peptide identifications were filtered using Scaffold (Protein Sciences). For both programs, the analysis was performed as described before [30]. In short, peptides were filtered and quantified using ProteoIQ (Premierbiosoft, Palo Alto, CA). Filter cut-offs were set with charge state of ≥2+ and minimum peptide length of 6 amino acids with no MH + 1 charge state, with peptide probabilities of >80% C.I., and with the number of peptides per protein two or more. Protein probabilities were set to a > 99.0% C.I. with FDR < 1.0 [[31], [32], [33]]. Relative quantification across experiments were then performed via spectral counting as described, which compares the number of MS/MS spectra assigned to each protein [34,35], and when relevant, spectral count abundances were then normalized between samples [36].
The longitudinal mass spectrometry proteomics data have been deposited to the ProteomeXchange Consortium via the PRIDE [37,38] partner repository with the dataset identifier PXD013700. The discovery cohort mass spectrometry proteomics data have been deposited to the ProteomeXchange Consortium via the PRIDE [37,38] partner repository with the dataset identifier PXD013710 and https://doi.org/10.6019/PXD013710
2.5. Cryo-EM
EVs were resuspended in water and applied to Quantifoil holey film (Quantifoil MicroTools, Jena, Germany) and plunge frozen using an FEI Vitrobot. The samples were observed in an FEI Tecnai F20 200 kV field-emission gun microscope equipped with a high-sensitivity Gatan Ultrascan 4000 CCD camera.
2.6. Quantitative immunoblots
EV pellets were lysed in 100 μL of 1× Lamelli buffer (2% SDS, 10% glycerol, 120 mM Tris pH 6.8, 40 mM NaF) freshly supplemented with 50 mg mL−1 DTT. A pool sample was generated by combining 10% w/v of each sample and included in each analytical run and replicate as an internal normalization control. Samples were electrophoresed on 4–20% TGX gradient gels (BioRad) and transferred onto PVDF membranes. Membranes were blocked using LI-COR blocking buffer (LI-COR) for 1 h at room temperature and then cut in half at a ~37 kDa mark. Signals were measured using the Li-COR system with all protein abundance normalized to pool samples between runs. Primary monoclonal antibodies were Hsc70 (StressMarq Bioscience Inc., #SMC-104A/B), SNAP23 (Santa Cruz, #sc-166,244), and Calbindin antibody (Cell Signaling, #13176). All primary antibodies were used at 1:1000 dilutions in LICOR blocking buffer. IRDye 800CW Donkey anti Mouse IgG (H + L) secondary antibodies (LI-COR, #926–32,212) and IRDye 680LT Donkey anti Rabbit IgG (H + L) secondary antibodies (LI-COR, #926–68,023) were both used at 1:20,000 dilutions in LICOR blocking buffer. For stain-free whole protein detection, EV pellets were lysed and electrophoresed on 4–20% Mini-PROTEAN TGX stain-free gradient gels (Bio-Rad). Fluorescent signals were UV-induced for 5 min and detected using Chemi-Doc imaging systems (Bio-Rad). Signals were quantified in ImageLab using default settings.
2.7. Statistical analysis
Student 2-tailed t-test or Mann-Whitney tests were used for two-group comparisons. P values resultant from protein data were analyzed using limma-moderated t-statistics and Bonferroni-corrected with significant set at 0.05. Spearman's r (ρ) was used for correlation analysis. Fisher's 2-tailed exact test and Mann-Whitney tests were used to assess clinical information in demographic table. PANTHER classification database, DAVID Bioinformatics Resources 6.8, and Gene Set Enrichment Analysis (GSEA) databases were used for enrichment analyses. All statistical analyses were performed using JMP Pro version 13.1.0, GraphPad Prism 5.0, and R statistical environment (R Core Team 2016) version 3.5.0.
3. Results
3.1. Identification of distinct subclasses of urinary extracellular vesicles
Using a differential ultra-centrifugation approach to access the extracellular vesicle (EVs) pool in urine from biobanked human urine samples (Fig. 1a), we first characterized the samples using single-nanoparticle tracking. Two distinct and abundant EV populations emerge in the 30–70 nm range as well as larger vesicles that peak in relative abundance at ~125 nm (Fig. 1b). Using cryo-electron microscopy to visualize the native morphology of the vesicles, the small vesicle population consists of well-defined dense-core vesicles consistent with the canonical features of EVs derived from multivesicular bodies, otherwise known as exosomes (Fig. 1c). Medium-sized vesicles of ~125 nm, on the other hand, have varied morphologies that include single dense-core vesicles (Fig. 1 c2), vesicles that harbor smaller (~25–50 nm) empty vesicles (Fig. 1 c3), and finally coated vesicles reminiscent of clathrin coats that are lightly filled with cargo (Fig. 1 c4). Vesicles ~80–100 nm with an intraluminal small vesicle were empty in the EV fraction of urine (Fig. 1 c5). Larger vesicles >200 nm and more rarely up to 280–300 nm size are coated vesicles, lack intraluminal vesicles, and show striated densities of cargo throughout the vesicle body, clearly different from the internal cargo of other vesicles (Fig. 1 c6). These results highlight the rich polydispersity of EVs in urine that cannot be attributed to one class of vesicle, such as exosomes originating from multivesicular bodies [26,39].
Fig. 1.

Characterization of urinary extracellular vesicles (EVs). (a). Graphical scheme of urine EV sample preparation. (b). Representative combined nanoparticle tracking analysis (NTA) showing the relative distribution of vesicle size as a function of total concentration. Dashed lines at ~20 nm and ~500 nm represent quality cut-offs for accurate size measure and relative quantification. Bars show S.E.M. from five measurements, 60 s per measure. (c). Representative images of different vesicle populations as observed in cryo-electron microscopy. Scale bar is 50 nm.
3.2. Urinary EV proteins link to neurological disease
Early studies with urinary EVs presume the major source of the vesicles to be the kidney, specifically collecting duct cells. Further, many previous studies assume the major fraction of vesicles in urinary EV purifications to be exosomes, a subset of vesicles derivative of multi-vesicular bodies in parental cells. The polydispersity of EVs we define here in urine suggests the possible contribution of a variety of different cells and tissues responding to a multitude of cell signaling events, potentially those related to disease. Most studies exploring urinary EVs for changes linked to disease have focused on kidney disease or metastatic cancers. To explore the urinary EV proteome outside of these conditions, we recruited a discovery cohort of fifty participants (see Methods and references (29, 40)). Fig. 2 illustrates the study design. To ensure the discovery cohort was free from kidney disease that might confound analysis, we characterized glomerular filtration rates and determined these were not different between those participants affected with PD and those neurologically normal (see Supplemental Table 1). Participants with and without PD were matched for sex, age, height, weight, and biobanked urine was collected between 8 AM and 10 AM. A shotgun proteomic evaluation of EV pellets from these fifty samples identified the thousand most abundant proteins in EVs based on a label-free normalized spectral count approach, with 695 of these proteins (70%) measured in at least ten subjects in the cohort (20%), with 448 proteins (45%) measured from >50% of the subjects in the cohort (Supplemental Table 3). Supplemental Fig. 1 demonstrates representative repeat-reliability in EV isolation and protein quantification with respect to abundance. Supplemental Fig. 2 demonstrates randomly selected chromatograms versus ion currents from the study.
Fig. 2.
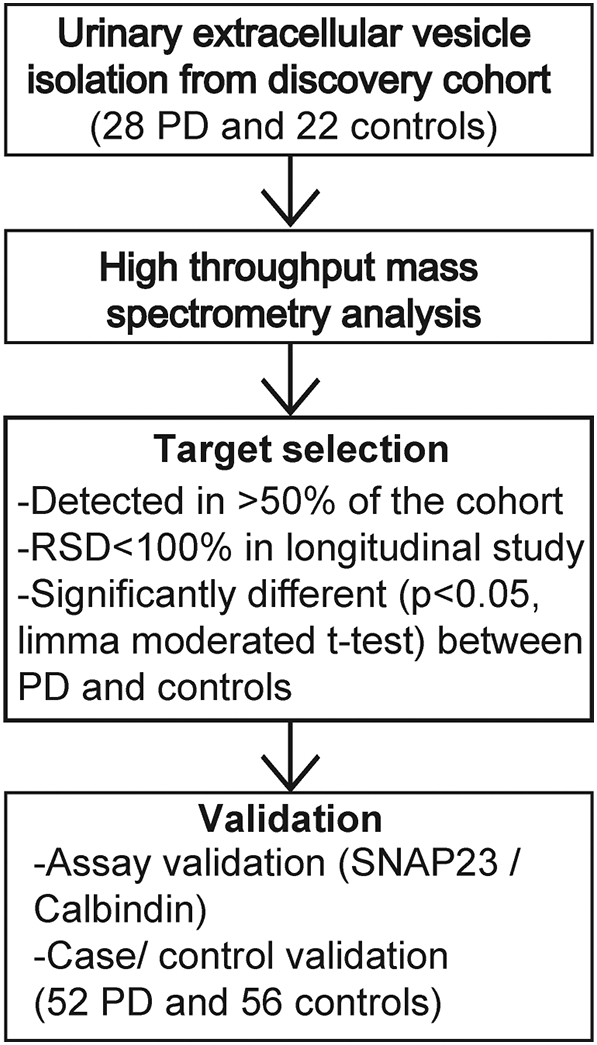
Diagram of study design. Urinary extracellular vesicles (EV) isolated from bio-banked discovery cohort (28 PD and 22 controls) are measured using high throughput mass spectrometry. Targets are screened under three criteria mentioned and best targets were validated with an independent cohort (52 PD and 56 controls) using an orthogonal protein quantification method LICOR.
As expected, the most abundant proteins in the cohort were clearly enriched in proteins involved in vesicle transport, localization, and vesicle biogenesis (Fig. 3a). However, network analysis of the complete list of urinary EV proteins for tissue and biofluid enrichment shows that the kidney does not over-represent the contribution of EV proteins compared to other organs like the liver, colon, skin and brain (Fig. 3b and Supplemental Table 4). Further, restriction of the analysis to biofluid sources of proteins reveals near-equivalent percent overlap with proteins that demarcate bile, milk, saliva, and plasma fluids, with no particular enrichment of urinary proteins. These results are consistent with emerging biological data that demonstrate relatively unrestricted access for EVs in circulation in the body. As opposed to the most abundant EV proteins that are involved in vesicle biogenesis, proteins within the lower quartile of expression steeply drop off in pathway significance with nominal enrichments of proteins involved in biological processes, quality, and stimuli. Taken together, these results show that urinary EVs sample from across the body and delve deeply into the proteome to assess a diversity of biological pathways.
Fig. 3.

Proteomic analysis of pathways and tissues enriched in urinary EVs. (a). Pathway analysis of proteins unambiguously identified in the EV proteome (PANTHER version 13.1). Proteins were divided into four quartiles based on their abundance, with the ~250 most abundant proteins representing quartile one. Output from (b). tissue enrichment analysis (DAVID bioinformatics resources 6.8.), (c). pathway analysis (PANTHER version 13.1), and (d). disease association analysis (GAD, DAVID) of all proteins identified in urine EVs. (e). Scaled ranking of relative mean-protein intensity (red dots, proteins that are significantly (p,0.05, limma moderated t-test) different between PD and controls groups in discovery cohort; blue dots, proteins that are associated with Parkinson's disease pathway; green dot, proteins that are associated with Parkinson's disease and are also significantly different between PD and control groups in discovery cohort). (For interpretation of the references to colour in this figure legend, the reader is referred to the web version of this article.)
To determine whether there may be human disease linked proteins specifically enriched in urinary EVs (e.g., from genes linked to disease through genome-wide association studies), PANTHER classification analysis unexpectedly reveals two of the top five disease pathways with proteins linked to disease are related to neurodegenerative disorders (Fig. 3c and Supplemental Table 5). Parkinson's disease achieves the highest enrichment (+5.1 fold, Fisher's Exact FDR 4.5 × 10⁻⁷) followed by Huntington's disease (+4.0 fold-enrichment, Fisher's Exact FDR 2.3 × 10⁻⁶). Notably proteins identified in the enrichment of proteins linked to neurological disease includes DJ-1, ApoE, Syntaxin-7, Tyrosine-protein kinases- Yes, Lyn, FRK and HCK, proteasome subunits alpha type-7, all seven 14–3-3 protein isoforms, casein kinase I, and numerous (25 different) Rab proteins (Fig. 2D and E). Independent pathway analysis with DAVID also highlights top links to neurological disease that includes Parkinson's disease (2.6 fold-enrichment, p = .013 Fisher's Exact FDR corrected) and Alzheimer's disease (2.2 fold-enrichment, p = .009, Fisher's Exact FDR corrected, Fig. 3d). Broad Gene set analysis (GSEA) further reveals a prominent link to Alzheimer's disease with 10.4% of the genes known to be down-regulated in the brains from patients with Alzheimer's disease identified in urinary EVs (Fisher's Exact FDR corrected p = 2.2 × 10⁻²³, Supplemental Table 6).
Enrichments in neurological disease-linked proteins in the EV samples may have been caused by the inclusion of neurodegenerative disease (Parkinson's disease) in half the discovery cohort, given the broad representation of EVs from sources likely across the body. In evaluation of the mean abundance of proteins in the PD group versus the healthy control group, SNAP23, Rab7a, calbindin, and FRK trended towards elevation in the PD group versus controls (all uncorrected p < .05, limma moderated t-tests), but were not significant after proteome-wide correction for multiple testing (one-thousand proteins). PD-linked genes range from some of the most abundant proteins (e.g., Rab10 and DJ-1) to the proteins in the lowest quartile of expression (γ-synuclein, Fig. 3e). In narrowing the analysis from one-thousand proteins to proteins identified by PANTHER analysis as linked to neurodegenerative disease, only SNAP23 survives a conservative multiple testing correction (Bonferroni, 1.8-fold elevation in PD cases, corrected p = .005, Supplemental Table 7). Overall, these results show that urinary EVs successfully capture many proteins linked to neurological disease and may be a convenient non-invasive source for proteomic biomarker discovery.
3.3. Longitudinal assessment of urinary EV proteins in biobanked samples
To date, there have been few studies to understand the variability and reliability of individual protein markers in urinary EVs since initial studies typically focus on single cross-sections of subjects that lack follow-up or repeated measures. To understand repeat variability of the urinary EV proteome defined here, two healthy control volunteers contributed weekly urine samples over the course of two months. Relative-standard deviations were calculated for the most abundant 973 proteins (identified from the 1000 proteins in the discovery cohort). Approximately half of the proteins (41% in subject 1 and 56% in subject 2) changed in relative abundance >50% across the two months and were classified as highly variable. Several examples of both high and low abundance EV proteins demonstrate RSDs >200% (Fig. 4a). Overall, proteins in the lower quartile of expression tend to be more variable in abundance from week to week (ρ = −0.71, p < .0001, Spearman's ρ). As expected, the proteomic overlap is high between subjects with only 19 (1%) of proteins detected in one subject and not the other, with a strong correlation for individual protein variability between the two participants (ρ =0.58, p < .0001, Spearman's ρ, Fig. 4b). Analysis with DAVID and PANTHER enrichments with consideration of variability demonstrates that most of the proteins linked to neurological diseases are also among the proteins with the highest stability in levels from week to week (i.e., RSD < 50%, Supplemental Fig. 3 and Supplemental Table 8). These results demonstrate that a major fraction of proteins within urinary EVs from routine morning urine collections (non-fasting) can be very stable in relative abundance within an individual from week to week, and many of these are linked to neurological disease.
Fig. 4.

Inter- and intra-individual variation of the urinary EV proteome. (a). Correlation of relative standard deviation (RSD, %) and mean intensity between each protein measured from healthy volunteers over eight weeks. (b). RSD comparison between the two volunteers. (c). Correlation between RSD and mean intensity of each protein detected among all 50 individuals in discovery cohort. Correlation values are Spearman's ρ.
To better understand inter-individual variability of the urinary EV proteome, RSDs from the 695 EV proteins detected in most samples from the 50 subjects of the discovery cohort (Supplemental Table 1) demonstrate that only 85 proteins (~12%) varied more than two-fold in relative abundance between individuals. For the 50 EV proteins that vary the greatest between individuals in the cohort, most are highly abundant secreted proteins in blood and are not commonly associated with EV pathways (Fig. 4c). Alpha-2-macroglobulin (RSD = 210%), ferritin light and heavy chain (RSD = 270% and 200%, respectively), complement C3 and 4A (RSD = 180% and 160%), and different hemoglobin subunits (alpha, beta and delta hemoglobin, RSD = 140%, 160% and 160%), are all well-known blood products that are extremely variable in urinary EV fractions between individuals and within the same individual over time. Importantly, all samples showed normal urinalysis that was negative for the presence of red-blood cells. Past whole-urine proteome studies have suggested that high abundant proteins in blood can be filtered in the kidney and secreted through a poorly understood pathway by tubular cells under certain conditions [41].
Besides the extremely variable EV proteins that tend to be blood products, we identified proteins with the lowest variability across participants that may be classified as housekeeping proteins. These include numerous heat shock proteins (RSD = 14–19%), actin (RSD = 21%), and annexin A4 (RSD = 22%) (Fig. 4c). These proteins may be useful for normalization across different groups and in longitudinal studies since they vary little from week to week in the same individual as well as across different groups of individuals.
3.4. Identification of proteins in EVs driven by THP contamination
In the purification of heterogenous EVs from biofluids such as plasma or serum, co-contaminating proteins with affinity towards lipids and vesicles such as lipoproteins and immunoglobulins can deleteriously affect unbiased capture of the EV population through loss of the EVs during purification. While urine does not contain abundant lipoproteins or albumins, the most abundant protein contaminating the EV preparations was identified as uromodulin (THP, or Tamm-Horsfall protein, Fig. 4c). THP is secreted by the loop of Henle in the kidney and may have anti-bacterial and anti-calcium crystallization properties, present at 21.3 ± 1.2 mg per day in males and 15.2 ± 1.6 mg per day in females [42]. THP is a non-EV associated secreted glycoprotein that is exclusively produced by renal tubular cells [43,44]. During the urine EV isolation process, THP readily fibrilizes into aggregates that can entrap some EVs at low speed centrifugation, with a small portion of THP fibrils of higher molecular weight co-eluting in EV enriched fractions at high speed centrifugation in different forms (Supplemental Fig. 4) [45]. Some recent data suggest that THP fibril contamination may interact with EVs to skew EV recovery and confound analysis [22,44]. Side-by-side comparison of the proteome of samples from the discovery cohort with lower THP contamination versus those with the highest THP contamination via Coomassie analysis of samples did not show an obvious reduction in the banding of other abundant EV proteins (Fig. 5a). THP levels determined by mass spectrometry are similar between PD and control groups (Fig. 5b, p = .24, 2-sided t-test) and overall the abundance of most proteins in the fifty participants (>92% of the thousand evaluated) is not correlated with the abundance of THP (Fig. 5c). Proteins with the strongest negative correlation with THP in abundant EV proteins include annexinVI, RalB, and Rab5 (p < .05, FDR corrected, Supplemental Table 9). Cross-evaluation of PANTHER pathways assigned to the proteins correlated with THP levels reveal most are extracellular organelle associated and may not be enough to represent any specific EV population (data not shown). These results suggest that variable THP contamination is likely to drive the relative abundance of only a small portion of measured proteins in urinary EVs that may be avoided for biomarker consideration.
Fig. 5.

THP complex in protein detection using mass spectrometry. (a). Urinary EV pellets purified together with relatively low and high THP contamination. Representative total protein signals are shown from trihalo stained gels for unbiased protein detection, with immunoblots for THP protein, CD63 and TSG101 underneath the gel. (b). Plot showing THP intensity in PD and control groups of the discovery cohort. Bars showing the mean value with error bars showing S.E.M. (c). Correlation between THP and each protein that are detected in >20% of individuals in the discovery cohort. (d). Correlation between intensity of THP proteins and the total number of proteins detected from each individual in the discovery cohort (22 controls and 28 PD). (e). Graphs showing total number of proteins detected in PD and control groups in the discovery cohort. Bars represent mean values with error bars showing S.E.M. p-values were calculated using 2-sided student t-test, equal variance assumptions. Correlations were calculated using Spearman's ρ.
While not generally affected the EV proteome composition, THP negatively correlated with the number of proteins that could be measured in each sample (ρ = −0.68, Control: ρ = −0.80, PD: ρ = − 0.61, p < .001, Spearman's ρ, Fig. 5d). Fewer proteins overall are measured from subjects with high THP protein, although the levels of THP contamination (Fig. 5b, p = .24, 2-sided t-test) as well as total numbers of proteins detected between cases and controls in the discovery cohort were not different (Fig. 5e, p = .9, 2-sided t-test). These results suggest that THP contamination reduces the depth of detection via mass-spectrometry of very-low abundant proteins but does not affect the overall quantification of proteins successfully measured.
3.5. Candidate urinary EV biomarkers for Parkinson's disease
From the discovery cohort of samples evaluated by bottom-up shotgun proteomics (Fig. 2), 15 urinary EV proteins were identified that were relatively stable over time within individuals (RSD < 100% from week to week, Fig. 4c) that could be measured in at least 50% of the cases and controls and were different in mean abundance in PD versus healthy controls (limma moderated t statistics for this subset of proteins were calculated for each candidate, Fig. 3, Supplemental Table 7). Receiver operator characteristics (ROC) and areas under the curve (AUC) range from 0.66 to 0.8 for each of these candidates (Supplemental Table 7). The best performing protein in separating PD from control, SNAP23 (p = .0009, AUC = 0.80, ROC), demonstrates 70% sensitive and 80% specificity in ROC analysis on its own, whereas the next best protein calbindin (p = .004, AUC = 0.75, ROC) has 76% sensitive and 71% specificity (Fig. 6a,b). Logistic regression suggests the linear combination of SNAP23 and calbindin may improve the characteristics to an AUC of 0.86 with 77% sensitive and 85% specificity (Fig. 6c).
Fig. 6.

Calbindin and SNAP23 levels in the discovery cohort. (a-b). Plots showing calbindin intensity and SNAP23 intensity in PD and control groups as measured by mass spectrometry (red: male, black: female). AUCs calculated from Receiver operating characteristics (ROC) are shown. Bars represent mean values with error as S.E.M. (c). ROC curve showing prediction success of the logistic model of calbindin and SNAP23 for PD diagnosis. Prediction success is 86% with a sensitivity of 77% and specificity of 85% at the optimum threshold. p-values were calculated using 2-sided student t-tests. A.U. is arbitrary unit from spectral counts. (For interpretation of the references to colour in this figure legend, the reader is referred to the web version of this article.)
To evaluate the SNAP23 and calbindin pair using an orthogonal protein quantification method in an independent cohort of biobanked urine samples, we developed a traditional immunoblot assay using validated monoclonal antibodies to SNAP23 and calbindin, with heat-shock protein 70 (HSC70/HSPA8) identified as an appropriate housekeeping control that is highly stable and is not different in PD versus control (Fig. 4b, Supplemental Figs. 5 and 6). Other commonly known EV markers (TSG101, CD9, CD81, Annexin A5) are equivalent between PD and control groups, whereas CD63, Flotillin-1 and Flotillin-2, although not identified as significant using limma moderated t-tests in the proteomic data, are higher in PD compare to controls (Supplemental Fig. 7). Initial evaluation of the same protein lysates used for mass spectrometry with the immunoblot analysis demonstrates good but not perfect correlation in results between the two assays (ρ = 0.80 and ρ = 0.72 for SNAP23 and calbindin, respectively, Spearman's ρ, Supplemental Fig. 5). Application of the immunoblot assay to a replication cohort of participants that include 51 idiopathic PD patients (28 male and 23 female) and 57 age matched controls (28 male and 29 female) likewise shows elevated calbindin in PD (p ≤.0001, AUC = 0.75, ROC, Fig. 7a and b). Four samples were excluded where calbindin was not detected. SNAP23 was more difficult to detect in the replication cohort with undetectable levels in 32 out of 108 individuals. Of the 31 samples with very low SNAP23 levels, 20 of them (75%) come from the control group, whereas 8 with PD are below detection levels. Combination of calbindin and SNAP23 in the same logistic model demonstrates similar efficacy in prediction of the diagnosis of PD (AUC = 0.76, ROC, Fig. 7c) as the initial mass spectrometry analysis, with 71% sensitive and 69% overall specificity. Spearman correlation values calculated for each demographic or clinical measure collected did not reveal any potential co-variables that might be affecting protein levels, including sex, dopamine medications, or duration of disease (all ρ > 0.5, Spearman's ρ). These results suggest urinary SNAP23 and calbindin may contribute to a useful biomarker panel for PD. More broadly, this study has identified the subset of proteins that are the most stable and reliably detected in clinical populations that may serve as ideal biomarkers for neurological diseases, as well as contaminating proteins and highly variable proteins inherent to the preparations that are unlikely to serve as useful biomarkers.
Fig. 7.

Calbindin and SNAP23 levels in the replication cohort. (a-b). Plots showing Calbindin intensity and SNAP23 intensity in PD and control groups measured using a LICOR assay (red: male, black: female). See Supplemental Fig. 5. Samples that have signal less than two-fold above background signal (noise) are plotted as “0”, and were included in the statistical analysis. AUC calculated from Receiver operating characteristic (ROC) curves are shown. Bars showing median values. (c). ROC curve showing prediction ability of the logistic model of Calbindin and SNAP23 in distinguishing PD from control. Prediction success is 76% with a sensitivity of 71% and specificity of 69% at the optimum threshold. P-values were calculated using Mann–Whitney U tests. (For interpretation of the references to colour in this figure legend, the reader is referred to the web version of this article.)
4. Discussion
As a source for novel biomarkers, EVs contain proteins not usually accessible for measure without tissue biopsies. However, EVs are in low abundance in biofluids thereby presenting detection challenges. Further, the half-life, variability of turn-over, and heterogeneity of vesicle sources in the body are all factors that are poorly understood, especially in clinical populations. In contrast to blood, serum, cerebrospinal fluid (CSF), and saliva, urine can be obtained non-invasively and in higher abundance than other biofluids, enabling proteomic analyses with a range of existing technology. To date, studies in urine biomarkers have focused on kidney and metastatic cancers due to the presumptive source of urinary EVs, the kidney. Here, we demonstrate that urine EVs are more heterogeneous than previously supposed by using advanced imaging approaches in specimens from a broad clinical population. Enrichment analyses show that the EV proteome harbors proteins that demarcate organs across the body without enrichment of kidney proteins. Our data suggest that most urinary EV proteins are stable within individuals over time, a sought-after property for biomarker discovery and utility. Among the stable proteins detected in most specimens from a biobanked clinical cohort, proteins linked to neurodegenerative diseases are enriched in the urinary EV proteome. Shotgun proteomics from the initial discovery cohort identified SNAP23 and calbindin as elevated in PD, with a replication cohort and orthogonal immunoblot detection assay validating the increased levels of SNAP23 and calbindin that occur in most PD patients. Overall, given the stable characteristics and positive case study with PD patients in initial biomarker candidate selection, these results provide evidence that urinary EVs may be an underutilized resource, with pathway analysis implicating particular utility in neurological diseases.
Extracellular vesicles (EVs) are secreted by most if not all cell types into biofluids. Differential ultracentrifugation is commonly used to capture the whole population of vesicles at the size range 40 nm–200 nm, including exosomes derived from endosomal pathway and other membrane-derived vesicles at similar size [2,19,20,46]. Here, we characterize urine EVs using single particle tracking and cryo-EM. Although the medium size EVs (100-150 nm) are more common compare to small size vesicles generally classified as small EVs (30-70 nm), we also identified large EVs (>200 nm) with variable morphology. Although single-vesicle particle analysis has not yet been achieved, future enrichment approaches may begin to unravel the striking heterogeneity.
While several studies have evaluated the proteome of urinary EVs, there are no previous datasets we are aware of that examine the stability over time and variability of expression of individual EV proteins in clinical populations [25,47,48]. Our study identified hundreds of proteins that appear quite stable, at least over several weeks in healthy individuals, as well as those proteins that are highly variable both between individuals and within individuals from week to week. Within the stable pool of proteins that vary little over time and can be measured in most individuals, we identified robust enrichments of proteins linked to neurological diseases. While future studies are required to identify the source of different EVs that contribute these disease-linked proteins to the overall EV pool, based on tissue enrichment analysis, it is conceivable that urinary EVs derive from organs across the body, including the brain. Tracking experiments in model organisms would provide valuable information in this regard.
Although we did not identify any urinary EV proteins that were only in the PD group and not control group, or vice versa, we reasoned that valuable biomarkers for PD may nevertheless exist in the EV pool based on the clear disease-enrichments observed in several bioinformatics analyses. Biomarkers identified from whole proteomic or transcriptomic data using multiple comparisons from single cross-sectional cohorts with one analytical technique are typically confounded by data overfitting (e.g., linear models) and high false-positive rates. Here, we identified a biobanked replication cohort approximately twice the size of the discovery cohort to test a limited number of the best performing biomarkers, SNAP23 and calbindin, using an independent measurement assay [49]. Our orthogonal immunoblotting assay was clearly less sensitive at detecting SNAP23 and calbindin in the samples, with successful detection dropping from 86% in the discovery cohort to 73% in the replication cohort for SNAP23. Nevertheless, the two proteins performed similarly in separating PD from control in the replication cohort, warranting further exploration of these markers.
We failed to identify any correlated variables for SNAP23 and calbindin from all clinical and demographic data collected including age, sex, mediation use, or clinical severity of disease. Synaptosomal-associated protein 23 (SNAP23) is a component of the SNARE complex with 58% identify to SNAP25 with function in exocytosis in neurons [50,51]. Whereas SNAP25 is mainly expressed in the brain, SNAP23 is ubiquitously expressed. A recent study found increased SNAP25 in CSF from PD patients, and depletion of SNAP25 in PD post-mortem brain [52]. Genetic polymorphisms in SNAP25 have also been linked to PD severity [53]. There are nuanced differences between SNAP23 which can compete with SNAP25 in supporting neurotransmitter release and vesicle fusion but not in vesicle pool priming [54]. In contrast, calbindin (CALB1) is a type of calcium binding protein important for calcium buffering and is vitamin D responsive in many tissues. It is highly expressed in kidney and brain, and may be depleted in Alzheimer's, Huntington's and Parkinson's disease patients [[55], [56], [57]]. Calbindin knockout aggravated Alzheimer's phenotypes in mouse models [55]. Recent studies further found that Lewy bodies are observed mostly in calbindin negative neurons in patients with dementia with Lewy bodies (DLB) [58]. While both proteins can be connected to neurodegenerative disease, the discovery of their stable presence in urinary EVs presents an opportunity to better understand their role in both health and disease. Important for future studies will be determining whether their differential abundance in PD represents traits that increase susceptibility to disease or states that are responsive to disease progression. The lack of correlation of their levels to drug dose or disease duration in PD cases provides evidence for susceptibility factors stable in time versus disease states that are variable over time.
While this study evaluated hundreds of EV proteins in over 100 subjects, our measures likely represent the tip of the iceberg in information that can be extracted from urinary EVs. Our peptide analysis did not include measurements of important post-translational modifications like phosphorylation or ubiquitination. For example, our recent studies found dramatic differences in pS1292-LRRK2 autophosphorylation levels using phospho-specific antibodies in urinary EVs from LRRK2-mutation carriers in PD [[59], [60], [61]]. Our studies here should facilitate more directed future studies with our identification of the most stable proteins that vary little over time and between individuals as housekeeping proteins, as well as the total levels of hundreds of other proteins in a cross-section of subjects. In sum, our results suggest that urinary EVs may be an underutilized resource that could be considered for biomarker discovery to address a variety of unmet needs in precision medicine approaches.
Acknowledgments
Acknowledgments
Data and biospecimens used in preparation of this manuscript were obtained from the Parkinson's Disease Biomarkers Program (PDBP) Consortium, part of the National Institute of Neurological Disorders and Stroke at the National Institutes of Health. Investigators include: Roger Albin, Roy Alcalay, Alberto Ascherio, Brad Boeve, DuBois Bowman, Alice Chen-Plotkin, Ted Dawson, Richard Dewey, Kirk Frey, Dwight German, Lawrence Honig, Xuemei Huang, Kejal Kantarci, Jim Leverenz, Karen Marder, Rachel Saunders-Pullman, Liana Rosenthal, Clemens Scherzer, Michael Schwarzschild, David Vaillancourt, David Walt, Andrew West and Jing Zhang. The PDBP Investigators have not participated in reviewing the data analysis or content of the manuscript.
The authors appreciate Dr. Kyle Fraser's help for preparing the samples for mass spectrometry. We appreciate Dr. Richard Kennedy's suggestions for statistical analysis and help on performing limma moderated t-tests.
We acknowledge core resources provided by the UAB Comprehensive Cancer Center, UAB Institutional Core Funding Mechanism, and core resources made possible through NCI P30 CA013148.
Funding sources
Research support was provided by NIH/NINDS U01 NS097028 and R01 NS064934.
The funding sources had no role in writing the manuscript or decision to submit the manuscript for publication. The authors have not been paid to write this article by any entity. The corresponding author has full access to all the data and assumes final responsibility for the decision to submit for publication.
Declaration of interests
The authors have no competing conflicts of interests to declare.
Author contributions
S.W., K.K., J.A.M., and A.B.W. performed literature searches, designed studies, collected data, interpreted data, and wrote the paper.
Footnotes
Supplementary data to this article can be found online at https://doi.org/10.1016/j.ebiom.2019.06.021.
Appendix A. Supplementary data
Supplementary tables
Supplementary figures
References
- 1.Fevrier B., Vilette D., Archer F., Loew D., Faigle W., Vidal M. Cells release prions in association with exosomes. Proc Natl Acad Sci U S A. 2004;101(26):9683–9688. doi: 10.1073/pnas.0308413101. [DOI] [PMC free article] [PubMed] [Google Scholar]
- 2.Harding C.V., Heuser J.E., Stahl P.D. Exosomes: looking back three decades and into the future. J Cell Biol. 2013;200(4):367–371. doi: 10.1083/jcb.201212113. [DOI] [PMC free article] [PubMed] [Google Scholar]
- 3.Ngolab J., Trinh I., Rockenstein E., Mante M., Florio J., Trejo M. Brain-derived exosomes from dementia with Lewy bodies propagate alpha-synuclein pathology. Acta Neuropathol Commun. 2017;5(1):46. doi: 10.1186/s40478-017-0445-5. [DOI] [PMC free article] [PubMed] [Google Scholar]
- 4.Dieude M., Bell C., Turgeon J., Beillevaire D., Pomerleau L., Yang B. The 20S proteasome core, active within apoptotic exosome-like vesicles, induces autoantibody production and accelerates rejection. Sci Transl Med. 2015;7(318):318ra200. doi: 10.1126/scitranslmed.aac9816. [DOI] [PubMed] [Google Scholar]
- 5.Raposo G., Nijman H.W., Stoorvogel W., Liejendekker R., Harding C.V., Melief C.J. B lymphocytes secrete antigen-presenting vesicles. J Exp Med. 1996;183(3):1161–1172. doi: 10.1084/jem.183.3.1161. [DOI] [PMC free article] [PubMed] [Google Scholar]
- 6.Thery C., Duban L., Segura E., Veron P., Lantz O., Amigorena S. Indirect activation of naive CD4+ T cells by dendritic cell-derived exosomes. Nat Immunol. 2002;3(12):1156–1162. doi: 10.1038/ni854. [DOI] [PubMed] [Google Scholar]
- 7.Muralidharan-Chari V., Clancy J.W., Sedgwick A., D'Souza-Schorey C. Microvesicles: mediators of extracellular communication during cancer progression. J Cell Sci. 2010;123:1603–1611. doi: 10.1242/jcs.064386. Pt 10. [DOI] [PMC free article] [PubMed] [Google Scholar]
- 8.Antonyak M.A., Li B., Boroughs L.K., Johnson J.L., Druso J.E., Bryant K.L. Cancer cell-derived microvesicles induce transformation by transferring tissue transglutaminase and fibronectin to recipient cells. Proc Natl Acad Sci U S A. 2011;108(12):4852–4857. doi: 10.1073/pnas.1017667108. [DOI] [PMC free article] [PubMed] [Google Scholar]
- 9.Costa-Silva B., Aiello N.M., Ocean A.J., Singh S., Zhang H., Thakur B.K. Pancreatic cancer exosomes initiate pre-metastatic niche formation in the liver. Nat Cell Biol. 2015;17(6):816–826. doi: 10.1038/ncb3169. [DOI] [PMC free article] [PubMed] [Google Scholar]
- 10.Zomer A., Maynard C., Verweij F.J., Kamermans A., Schafer R., Beerling E. In vivo imaging reveals extracellular vesicle-mediated phenocopying of metastatic behavior. Cell. 2015;161(5):1046–1057. doi: 10.1016/j.cell.2015.04.042. [DOI] [PMC free article] [PubMed] [Google Scholar]
- 11.Feng Q., Zhang C., Lum D., Druso J.E., Blank B., Wilson K.F. A class of extracellular vesicles from breast cancer cells activates VEGF receptors and tumour angiogenesis. Nat Commun. 2017;8 doi: 10.1038/ncomms14450. [DOI] [PMC free article] [PubMed] [Google Scholar]
- 12.Berckmans R.J., Sturk A., van Tienen L.M., Schaap M.C., Nieuwland R. Cell-derived vesicles exposing coagulant tissue factor in saliva. Blood. 2011;117(11):3172–3180. doi: 10.1182/blood-2010-06-290460. [DOI] [PubMed] [Google Scholar]
- 13.Yu Y., Gool E., Berckmans R.J., Coumans F.A.W., Barendrecht A.D., Maas C. Extracellular vesicles from human saliva promote hemostasis by delivering coagulant tissue factor to activated platelets. J Thromb Haemost. 2018;16(6):1153–1163. doi: 10.1111/jth.14023. [DOI] [PubMed] [Google Scholar]
- 14.Rajendran L., Honsho M., Zahn T.R., Keller P., Geiger K.D., Verkade P. Alzheimer's disease beta-amyloid peptides are released in association with exosomes. Proc Natl Acad Sci U S A. 2006;103(30):11172–11177. doi: 10.1073/pnas.0603838103. [DOI] [PMC free article] [PubMed] [Google Scholar]
- 15.Rajendran L., Bali J., Barr M.M., Court F.A., Kramer-Albers E.M., Picou F. Emerging roles of extracellular vesicles in the nervous system. J Neurosci. 2014;34(46):15482–15489. doi: 10.1523/JNEUROSCI.3258-14.2014. [DOI] [PMC free article] [PubMed] [Google Scholar]
- 16.Balusu S., Van Wonterghem E., De Rycke R., Raemdonck K., Stremersch S., Gevaert K. Identification of a novel mechanism of blood-brain communication during peripheral inflammation via choroid plexus-derived extracellular vesicles. EMBO Mol Med. 2016;8(10):1162–1183. doi: 10.15252/emmm.201606271. [DOI] [PMC free article] [PubMed] [Google Scholar]
- 17.Kalani A., Tyagi A., Tyagi N. Exosomes: mediators of neurodegeneration, neuroprotection and therapeutics. Mol Neurobiol. 2014;49(1):590–600. doi: 10.1007/s12035-013-8544-1. [DOI] [PMC free article] [PubMed] [Google Scholar]
- 18.Shi M., Liu C., Cook T.J., Bullock K.M., Zhao Y., Ginghina C. Plasma exosomal alpha-synuclein is likely CNS-derived and increased in Parkinson's disease. Acta Neuropathol. 2014;128(5):639–650. doi: 10.1007/s00401-014-1314-y. [DOI] [PMC free article] [PubMed] [Google Scholar]
- 19.Wang D., Sun W. Urinary extracellular microvesicles: isolation methods and prospects for urinary proteome. Proteomics. 2014;14(16):1922–1932. doi: 10.1002/pmic.201300371. [DOI] [PubMed] [Google Scholar]
- 20.Nawaz M., Camussi G., Valadi H., Nazarenko I., Ekstrom K., Wang X. The emerging role of extracellular vesicles as biomarkers for urogenital cancers. Nat Rev Urol. 2014;11(12):688–701. doi: 10.1038/nrurol.2014.301. [DOI] [PubMed] [Google Scholar]
- 21.Musante L., Tataruch D.E., Holthofer H. Use and isolation of urinary exosomes as biomarkers for diabetic nephropathy. Front Endocrinol (Lausanne) 2014;5:149. doi: 10.3389/fendo.2014.00149. [DOI] [PMC free article] [PubMed] [Google Scholar]
- 22.Wood S.L., Knowles M.A., Thompson D., Selby P.J., Banks R.E. Proteomic studies of urinary biomarkers for prostate, bladder and kidney cancers. Nat Rev Urol. 2013;10(4):206–218. doi: 10.1038/nrurol.2013.24. [DOI] [PubMed] [Google Scholar]
- 23.Bourderioux M., Nguyen-Khoa T., Chhuon C., Jeanson L., Tondelier D., Walczak M. A new workflow for proteomic analysis of urinary exosomes and assessment in cystinuria patients. J Proteome Res. 2015;14(1):567–577. doi: 10.1021/pr501003q. [DOI] [PubMed] [Google Scholar]
- 24.Dear J.W., Street J.M., Bailey M.A. Urinary exosomes: a reservoir for biomarker discovery and potential mediators of intrarenal signalling. Proteomics. 2013;13(10−11):1572–1580. doi: 10.1002/pmic.201200285. [DOI] [PubMed] [Google Scholar]
- 25.Hildonen S., Skarpen E., Halvorsen T.G., Reubsaet L. Isolation and mass spectrometry analysis of urinary extraexosomal proteins. Sci Rep. 2016;6 doi: 10.1038/srep36331. [DOI] [PMC free article] [PubMed] [Google Scholar]
- 26.Pisitkun T., Shen R.F., Knepper M.A. Identification and proteomic profiling of exosomes in human urine. Proc Natl Acad Sci U S A. 2004;101(36):13368–13373. doi: 10.1073/pnas.0403453101. [DOI] [PMC free article] [PubMed] [Google Scholar]
- 27.Raimondo F., Corbetta S., Morosi L., Chinello C., Gianazza E., Castoldi G. Urinary exosomes and diabetic nephropathy: a proteomic approach. Mol Biosyst. 2013;9(6):1139–1146. doi: 10.1039/c2mb25396h. [DOI] [PubMed] [Google Scholar]
- 28.Gonzalez-Calero L., Martinez P.J., Martin-Lorenzo M., Baldan-Martin M., Ruiz-Hurtado G., de la Cuesta F. Urinary exosomes reveal protein signatures in hypertensive patients with albuminuria. Oncotarget. 2017;8(27):44217–44231. doi: 10.18632/oncotarget.17787. [DOI] [PMC free article] [PubMed] [Google Scholar]
- 29.Rosenthal L.S., Drake D., Alcalay R.N., Babcock D., Bowman F.D., Chen-Plotkin A. The NINDS Parkinson's disease biomarkers program. Mov Disord. 2016;31(6):915–923. doi: 10.1002/mds.26438. [DOI] [PMC free article] [PubMed] [Google Scholar]
- 30.Betancourt A., Mobley J.A., Wang J., Jenkins S., Chen D., Kojima K. Alterations in the rat serum proteome induced by prepubertal exposure to bisphenol a and genistein. J Proteome Res. 2014;13(3):1502–1514. doi: 10.1021/pr401027q. [DOI] [PMC free article] [PubMed] [Google Scholar]
- 31.Keller A., Nesvizhskii A.I., Kolker E., Aebersold R. Empirical statistical model to estimate the accuracy of peptide identifications made by MS/MS and database search. Anal Chem. 2002;74(20):5383–5392. doi: 10.1021/ac025747h. [DOI] [PubMed] [Google Scholar]
- 32.Nesvizhskii A.I., Keller A., Kolker E., Aebersold R. A statistical model for identifying proteins by tandem mass spectrometry. Anal Chem. 2003;75(17):4646–4658. doi: 10.1021/ac0341261. [DOI] [PubMed] [Google Scholar]
- 33.Weatherly D.B., Atwood J.A., 3rd, Minning T.A., Cavola C., Tarleton R.L., Orlando R. A heuristic method for assigning a false-discovery rate for protein identifications from Mascot database search results. Mol Cell Proteomics. 2005;4(6):762–772. doi: 10.1074/mcp.M400215-MCP200. [DOI] [PubMed] [Google Scholar]
- 34.Liu H., Sadygov R.G., Yates J.R., 3rd A model for random sampling and estimation of relative protein abundance in shotgun proteomics. Anal Chem. 2004;76(14):4193–4201. doi: 10.1021/ac0498563. [DOI] [PubMed] [Google Scholar]
- 35.Old W.M., Meyer-Arendt K., Aveline-Wolf L., Pierce K.G., Mendoza A., Sevinsky J.R. Comparison of label-free methods for quantifying human proteins by shotgun proteomics. Mol Cell Proteomics. 2005;4(10):1487–1502. doi: 10.1074/mcp.M500084-MCP200. [DOI] [PubMed] [Google Scholar]
- 36.Beissbarth T., Hyde L., Smyth G.K., Job C., Boon W.M., Tan S.S. Statistical modeling of sequencing errors in SAGE libraries. Bioinformatics. 2004;20(Suppl. 1):i31–i39. doi: 10.1093/bioinformatics/bth924. [DOI] [PubMed] [Google Scholar]
- 37.Perez-Riverol Y., Csordas A., Bai J., Bernal-Llinares M., Hewapathirana S., Kundu D.J. The PRIDE database and related tools and resources in 2019: improving support for quantification data. Nucleic Acids Res. 2019;47(D1):D442–D450. doi: 10.1093/nar/gky1106. [DOI] [PMC free article] [PubMed] [Google Scholar]
- 38.Deutsch E.W., Csordas A., Sun Z., Jarnuczak A., Perez-Riverol Y., Ternent T. The ProteomeXchange consortium in 2017: supporting the cultural change in proteomics public data deposition. Nucleic Acids Res. 2017;45(D1):D1100–D1106. doi: 10.1093/nar/gkw936. [DOI] [PMC free article] [PubMed] [Google Scholar]
- 39.Raimondo F., Morosi L., Corbetta S., Chinello C., Brambilla P., Della Mina P. Differential protein profiling of renal cell carcinoma urinary exosomes. Mol Biosyst. 2013;9(6):1220–1233. doi: 10.1039/c3mb25582d. [DOI] [PubMed] [Google Scholar]
- 40.Gwinn K., David K.K., Swanson-Fischer C., Albin R., Hillaire-Clarke C.S., Sieber B.A. Parkinson's disease biomarkers: perspective from the NINDS Parkinson's Disease Biomarkers Program. Biomark Med. 2017;11(6):451–473. doi: 10.2217/bmm-2016-0370. [DOI] [PMC free article] [PubMed] [Google Scholar]
- 41.Hoorn E.J., Pisitkun T., Zietse R., Gross P., Frokiaer J., Wang N.S. Prospects for urinary proteomics: exosomes as a source of urinary biomarkers. Nephrology (Carlton) 2005;10(3):283–290. doi: 10.1111/j.1440-1797.2005.00387.x. [DOI] [PubMed] [Google Scholar]
- 42.Glauser A., Hochreiter W., Jaeger P., Hess B. Determinants of urinary excretion of Tamm-Horsfall protein in non-selected kidney stone formers and healthy subjects. Nephrol Dial Transplant. 2000;15(10):1580–1587. doi: 10.1093/ndt/15.10.1580. [DOI] [PubMed] [Google Scholar]
- 43.Musante L., Saraswat M., Duriez E., Byrne B., Ravida A., Domon B. Biochemical and physical characterisation of urinary nanovesicles following CHAPS treatment. PLoS One. 2012;7(7) doi: 10.1371/journal.pone.0037279. [DOI] [PMC free article] [PubMed] [Google Scholar]
- 44.Wachalska M., Koppers-Lalic D., van Eijndhoven M., Pegtel M., Geldof A.A., Lipinska A.D. Protein complexes in urine interfere with extracellular vesicle biomarker studies. J Circ Biomark. 2016;5:4. doi: 10.5772/62579. [DOI] [PMC free article] [PubMed] [Google Scholar]
- 45.Fernandez-Llama P., Khositseth S., Gonzales P.A., Star R.A., Pisitkun T., Knepper M.A. Tamm-Horsfall protein and urinary exosome isolation. Kidney Int. 2010;77(8):736–742. doi: 10.1038/ki.2009.550. [DOI] [PMC free article] [PubMed] [Google Scholar]
- 46.van der Pol E., Boing A.N., Harrison P., Sturk A., Nieuwland R. Classification, functions, and clinical relevance of extracellular vesicles. Pharmacol Rev. 2012;64(3):676–705. doi: 10.1124/pr.112.005983. [DOI] [PubMed] [Google Scholar]
- 47.Gonzales P.A., Pisitkun T., Hoffert J.D., Tchapyjnikov D., Star R.A., Kleta R. Large-scale proteomics and phosphoproteomics of urinary exosomes. J Am Soc Nephrol. 2009;20(2):363–379. doi: 10.1681/ASN.2008040406. [DOI] [PMC free article] [PubMed] [Google Scholar]
- 48.Prunotto M., Farina A., Lane L., Pernin A., Schifferli J., Hochstrasser D.F. Proteomic analysis of podocyte exosome-enriched fraction from normal human urine. J Proteomics. 2013;82:193–229. doi: 10.1016/j.jprot.2013.01.012. [DOI] [PubMed] [Google Scholar]
- 49.Shi M., Movius J., Dator R., Aro P., Zhao Y., Pan C. Cerebrospinal fluid peptides as potential Parkinson disease biomarkers: a staged pipeline for discovery and validation. Mol Cell Proteomics. 2015;14(3):544–555. doi: 10.1074/mcp.M114.040576. [DOI] [PMC free article] [PubMed] [Google Scholar]
- 50.Kunii M., Ohara-Imaizumi M., Takahashi N., Kobayashi M., Kawakami R., Kondoh Y. Opposing roles for SNAP23 in secretion in exocrine and endocrine pancreatic cells. J Cell Biol. 2016;215(1):121–138. doi: 10.1083/jcb.201604030. [DOI] [PMC free article] [PubMed] [Google Scholar]
- 51.Ravichandran V., Chawla A., Roche P.A. Identification of a novel syntaxin- and synaptobrevin/VAMP-binding protein, SNAP-23, expressed in non-neuronal tissues. J Biol Chem. 1996;271(23):13300–13303. doi: 10.1074/jbc.271.23.13300. [DOI] [PubMed] [Google Scholar]
- 52.Bereczki E., Bogstedt A., Hoglund K., Tsitsi P., Brodin L., Ballard C. Synaptic proteins in CSF relate to Parkinson's disease stage markers. NPJ Parkinsons Dis. 2017;3:7. doi: 10.1038/s41531-017-0008-2. [DOI] [PMC free article] [PubMed] [Google Scholar]
- 53.Agliardi C., Guerini F.R., Zanzottera M., Riboldazzi G., Zangaglia R., Sturchio A. SNAP25 gene polymorphisms protect against Parkinson's disease and modulate disease severity in patients. Mol Neurobiol. 2019;56(6):4455–4463. doi: 10.1007/s12035-018-1386-0. [DOI] [PubMed] [Google Scholar]
- 54.Sorensen J.B., Nagy G., Varoqueaux F., Nehring R.B., Brose N., Wilson M.C. Differential control of the releasable vesicle pools by SNAP-25 splice variants and SNAP-23. Cell. 2003;114(1):75–86. doi: 10.1016/s0092-8674(03)00477-x. [DOI] [PubMed] [Google Scholar]
- 55.Kook S.Y., Jeong H., Kang M.J., Park R., Shin H.J., Han S.H. Crucial role of calbindin-D28k in the pathogenesis of Alzheimer's disease mouse model. Cell Death Differ. 2014;21(10):1575–1587. doi: 10.1038/cdd.2014.67. [DOI] [PMC free article] [PubMed] [Google Scholar]
- 56.You J.C., Muralidharan K., Park J.W., Petrof I., Pyfer M.S., Corbett B.F. Epigenetic suppression of hippocampal calbindin-D28k by DeltaFosB drives seizure-related cognitive deficits. Nat Med. 2017;23(11):1377–1383. doi: 10.1038/nm.4413. [DOI] [PMC free article] [PubMed] [Google Scholar]
- 57.Iacopino A.M., Christakos S. Specific reduction of calcium-binding protein (28-kilodalton calbindin-D) gene expression in aging and neurodegenerative diseases. Proc Natl Acad Sci U S A. 1990;87(11):4078–4082. doi: 10.1073/pnas.87.11.4078. [DOI] [PMC free article] [PubMed] [Google Scholar]
- 58.Rcom-H'cheo-Gauthier A.N., Davis A., Meedeniya A.C.B., Pountney D.L. Alpha-synuclein aggregates are excluded from calbindin-D28k-positive neurons in dementia with Lewy bodies and a unilateral rotenone mouse model. Mol Cell Neurosci. 2016;77:65–75. doi: 10.1016/j.mcn.2016.10.003. [DOI] [PubMed] [Google Scholar]
- 59.Fraser K.B., Moehle M.S. Alcalay RN, west AB, consortium LC. Urinary LRRK2 phosphorylation predicts parkinsonian phenotypes in G2019S LRRK2 carriers. Neurology. 2016;86(11):994–999. doi: 10.1212/WNL.0000000000002436. [DOI] [PMC free article] [PubMed] [Google Scholar]
- 60.Fraser K.B., Rawlins A.B., Clark R.G., Alcalay R.N., Standaert D.G., Liu N. Ser(P)-1292 LRRK2 in urinary exosomes is elevated in idiopathic Parkinson's disease. Mov Disord. 2016;31(10):1543–1550. doi: 10.1002/mds.26686. [DOI] [PMC free article] [PubMed] [Google Scholar]
- 61.Wang S., Liu Z., Ye T., Mabrouk O.S., Maltbie T., Aasly J. Elevated LRRK2 autophosphorylation in brain-derived and peripheral exosomes in LRRK2 mutation carriers. Acta Neuropathol Commun. 2017;5(1):86. doi: 10.1186/s40478-017-0492-y. [DOI] [PMC free article] [PubMed] [Google Scholar]
Associated Data
This section collects any data citations, data availability statements, or supplementary materials included in this article.
Supplementary Materials
Supplementary tables
Supplementary figures