Abstract
Isocitrate dehydrogenase (IDH) mutant glioblastoma (GBM), accounts for ~10% GBMs, arises from lower grade diffuse glioma and preferentially appears in younger patients. Here, we aim to establish a robust gene expression-based molecular classification of IDH-mutant GBM. A total of 33 samples from the Chinese Glioma Genome Atlas RNA-sequencing data were selected as training set, and 21 cases from Chinese Glioma Genome Atlas microarray data were used as validation set. Consensus clustering identified three groups with distinguished prognostic and molecular features. G1 group, with a poorer clinical outcome, mainly contained TERT promoter wild-type and male cases. G2 and G3 groups had better prognosis differed in gender. Gene ontology analysis showed that genes enriched in G1 group were involved in DNA replication, cell division and cycle. On the basis of the differential genes between G1 and G2/G3 groups, a six-gene signature was developed with a Cox proportional hazards model. Kaplan–Meier analysis found that the acquired signature could differentiate the outcome of low- and high-risk cases. Moreover, the signature could also serve as an independent prognostic factor for IDH-mutant GBM in the multivariate Cox regression analysis. Gene ontology and gene set enrichment analyses revealed that gene sets correlated with high-risk group were involved in cell cycle, cell proliferation, DNA replication and repair. These finding highlights heterogeneity within IDH-mutant GBMs and will advance our molecular understanding of this lethal cancer.
Here, we described a robust gene expression-based molecular classification of IDH-mutant glioblastoma into three subtypes with distinct prognostic and molecular features. In addition, we also constructed a risk signature for prognostic prediction of this glioma.
Introduction
Glioblastoma (GBM) is the most common form of primary brain cancer in adults, accounting for ~55% of glioma (1). Patients with GBM have a uniformly poor prognosis, with a median survival of 14–16 months. Owing to highly diffuse and aggressive inherence, GBM displays strong treatment resistance and inevitable recurrence (2); thus, advances on basic and clinical fronts are urgently needed.
In an ever-increasing attempt to better understand GBM, many groups have focused on high-dimensional profiling studies. The Cancer Genome Atlas (TCGA) reported an integrative analysis of DNA copy number, expression and DNA methylation aberrations in 206 GBMs, confirming biologically relevant abnormalities in three core pathways, namely TP53, RB and receptor tyrosine kinase (RTK)/Ras/phosphoinositide 3-kinase (PI3K) signaling (3). Verhaak et al. (4) described a robust gene expression-based molecular classification of GBM into proneural, neural, classical and mesenchymal subtypes. At present, TCGA constructed a detailed somatic landscape of GBM through multidimensional analysis and confirmed that the survival advantage of proneural subtype was conferred by glioma-CpG island methylator phenotype (5).
According to the current 2016 World Health Organization classification of central nervous system tumors, GBMs are divided into two categories: IDH-wild-type (wt) GBM and IDH-mutant GBM (6). Despite their similar histology, IDH-mutant GBM that has better prognosis typically affects younger patients and progresses from low-grade diffuse astrocytoma or oligodendroglioma (7). Integrated genomic analyses of IDH1-mutant glioma malignant progression identified activation of oncogenic pathways (MYC and RTK/Ras/PI3K) driving progression, as well as upregulation of FOXM1- and E2F2-mediated cell cycle transitions (8). DNA methylation clustering disclosed that IDH-mutant GBM formed a distinct group separate from other diffuse glioma subtypes (9). However, the biological heterogeneity within IDH-mutant GBM patients remains elusive.
Here, we described a robust gene expression-based molecular classification of IDH-mutant GBM into three subtypes with distinct prognostic and molecular features. In addition, we also constructed a risk signature for prognostic prediction of this glioma. Our data provide a transcriptomic dimension for IDH-mutant GBM molecular stratification with potential implications for future studies.
Materials and methods
Patients and tissues
A total of 54 IDH-mutant GBM samples from Chinese Glioma Genome Atlas (CGGA) database [33 cases from RNA-sequencing (RNA-seq) data and 21 cases from microarray data] were included in this study (Supplementary Table 1, available at Carcinogenesis Online). All these tissue samples and clinicopathological information were collected with informed consent. This study was conducted in accordance with the declaration of Helsinki and approved by the ethics committee of Tiantan Hospital.
Datasets
The RNA-seq data, microarray data and corresponding clinical information [age, gender, TCGA subtype, methylguanine methyltransferase (MGMT) promoter status, isocitrate dehydrogenase (IDH) mutation status and telomerase reverse transcriptase (TERT) promoter status] were downloaded from CGGA database (http://www.cgga.org.cn) (10). IDH mutation and MGMT promoter status were determined by DNA pyrosequencing as described in previous study (11). TERT promoter mutation was evaluated by Sanger sequencing (10). The characteristics of patients are listed in Supplementary Table 2, available at Carcinogenesis Online.
Consensus clustering
For class discovery, consensus clustering was performed with R package ‘ConsensusClusterPlus’ based on the comparison of gene expression profile (12). Measured by median absolute deviation (>1), the most variable genes were used for subsequent clustering. Cumulative distribution function (CDF) was constructed for a range from 2 to 10 consensus clusters. The optimal number of clusters was determined by CDF and consensus matrices.
Gene signature selection
Significance analysis of microarray (SAM) was performed to identify differentially expressed genes within clusters. Univariate Cox regression analysis was used to determine the prognosis-related genes. Then, the Cox proportional hazards model was applied for selection of optimal prognostic gene set with R package ‘glmnet’, which was suitable for regression analysis of high-dimensional data (13,14). Risk score for each case was calculated with the linear combinational of signature gene expression weighted by their regression coefficients (Coeffs). Risk score = (expressiongene1 × coeffgene1) + (expressiongene2 × coeffgene2) + … (expressiongenen × coeffgenen).
Bioinformatic analysis
Gene set enrichment analysis (GSEA) was performed to identify gene sets of statistical difference with GSEA, v3 software (15). Gene ontology and Kyoto Encyclopedia of Genes and Genomes analyses were applied for function and pathway annotation of differential genes between groups (16). Receiver operating characteristic (ROC) curve analysis was used for overall survival (OS) prediction with R package ‘pROC’. Principal components analysis (PCA) was performed to detect expression difference between groups with R package ‘princomp’ (17). Stromal and immune scores were calculated with R package ‘estimate’, and tumor purity of each case was estimated based on the formula described in Yoshihara et al. (18). A total of 22 immune cells-specific gene sets were obtained from a published study (http://cibersort.stanford.edu) (19).
Statistical analysis
Univariate and multivariate Cox regression analyses were performed to assess independent prognostic factors. Kaplan–Meier analysis was used to determine OS difference between groups. Chi-square test was carried out to detect the difference of pathological features between groups. P < 0.05 was considered statistically significant. All statistical analyses were conducted using SPSS, R software and GraphPad Prism 6.0.
Results
Consensus clustering identifies three distinct subtypes of IDH-mutant GBMs
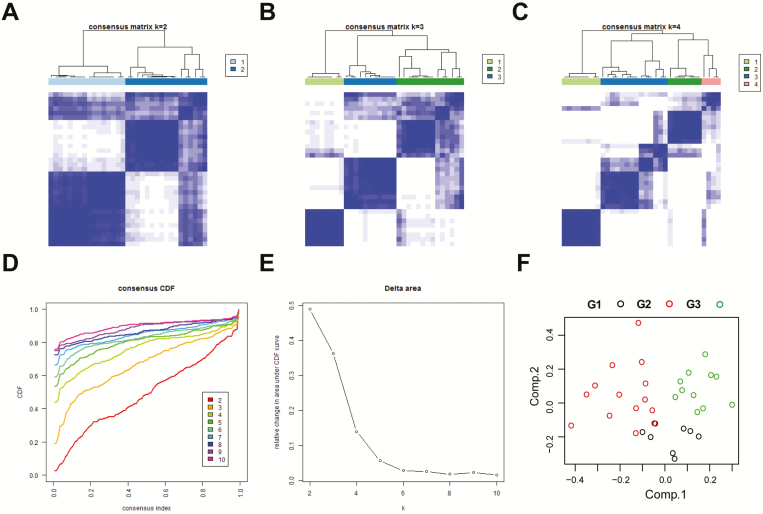
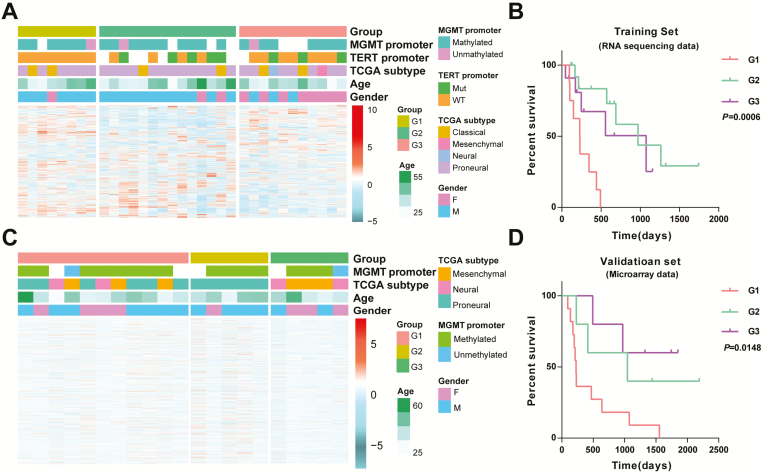
To decipher the heterogeneity within IDH-mutant GBMs, RNA-seq data of 33 samples were obtained from CGGA database. We filtered the data and got 3897 genes with highly variable expression across samples (median absolute deviation > 1). Consensus average linkage hierarchical clustering of 3897 genes identified three robust groups (Figure 1A–C), assessing by CDF and consensus matrices (Figure 1D and E;. the shape of CDF curves did not change much beyond this number). PCA showed that these three groups tended to distribute in different regions clearly (Figure 1F). In addition, we also evaluated two- or four-classification scheme, but survival and PCA analysis found no advances (Supplementary Figure 1, available at Carcinogenesis Online). We further observed that these three groups were associated with distinct clinical and molecular characteristics (Figure 2A and B; Supplementary Table 3, available at Carcinogenesis Online). Gender and TERT promoter status rather than age, TCGA subtype and MGMT promoter status had a large impact on the composition of these groups. G1 group, with significantly poorer clinical outcome, mainly contained TERT promoter wild-type and male cases. G2 and G3 groups that had better prognosis differed in gender (cases in G2 group were mainly male, whereas the opposite in G3 group). Moreover, univariate Cox analysis found that only the new classification scheme had a significant prognostic value (P = 0.032, Supplementary Table 4, available at Carcinogenesis Online).
Figure 1.
Identification of three IDH-mutant GBM subtypes. (A–C) Consensus clustering matrix of 33 samples for k = 2 to k = 4. (D) Consensus clustering CDF for k = 2 to k = 10. (E) Relative change in area under CDF curve for k = 2 to k = 10. (F) PCA of three groups based on gene expression data.
Figure 2.
Clinical and molecular features of the three subtypes. (A) Heat map of three groups defined by 3897 genes with highly variable expression. (B) Kaplan–Meier analysis of three groups. (C) Gene order from the training set was maintained in the validation set (n = 21). (D) Kaplan–Meier analysis of three groups in validation set.
After that, we used an independent set of 21 IDH-mutant GBMs from CGGA microarray data to assess group reproducibility. Gene order from the training set was maintained in the validation dataset (3196 genes available). Hierarchical clustering of these 3196 genes clearly recapitulated the gene sample groups (Figure 2C). Importantly, survival analysis revealed that cases in G1 group also had shorter OS than those in G2 or G3 group (Figure 2D). Although attempts to detect differences of clinical and molecular features within these three groups were uninformative (lack of samples and TERT promoter mutation information, Supplementary Table 3, available at Carcinogenesis Online), univariate Cox analysis confirmed the significant prognostic value of this acquired classification (P = 0.039; Supplementary Table 4, available at Carcinogenesis Online).
Functional annotation of subtypes
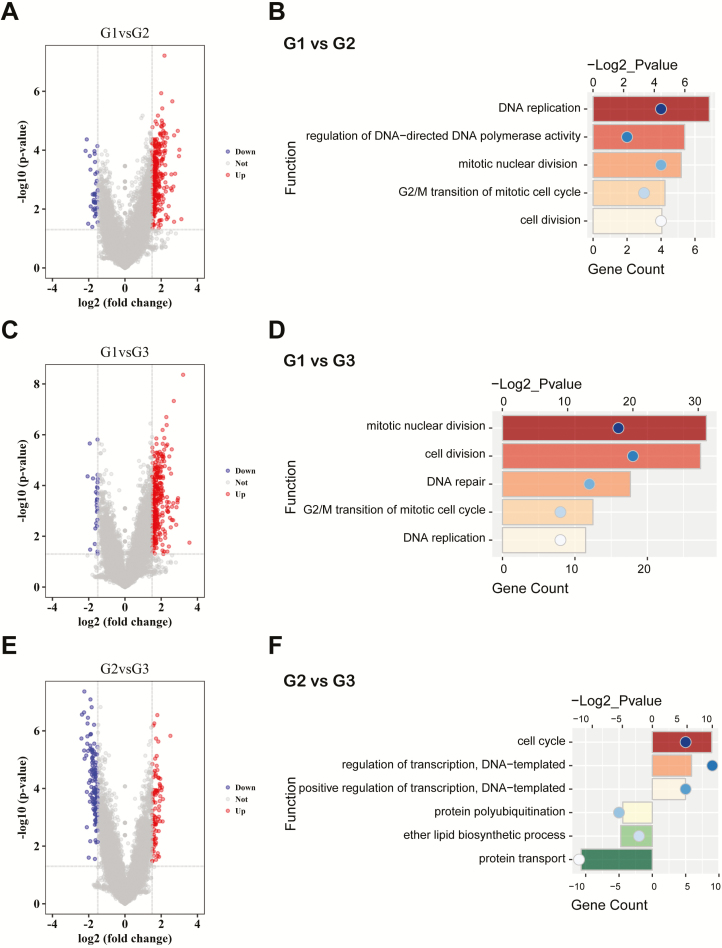
To gain insight into the biological meaning of the groups, we performed gene ontology analysis based on the differential genes between groups, which were identified by SAM (false discovery rate < 0.05). As shown in Figure 3A–D and Supplementary Table 5, available at Carcinogenesis Online, the upregulated genes in G1 group, compared with G2 or G3 group, were mainly enriched in mitotic nuclear division, cell division, DNA repair, replication and G2/M transition of mitotic cell cycle. Compared with cases of G3 group, the differential genes in cases of G2 group were annotated to cell cycle and regulation of transcription. Instead, the upregulated genes in G3 group were involved in protein transport and polyubiquitination (Figure 3E and F; Supplementary Table 5, available at Carcinogenesis Online). Meanwhile, GSEA further confirmed that cell division, DNA replication, cell cycle transition and mitotic nuclear division were significantly enriched in cases of G1 group (Supplementary Figure 2, available at Carcinogenesis Online). Subsequently, we detected the functional differences of groups in the validation set. PCA found that cases of three groups located in different areas (Supplementary Figure 3A, available at Carcinogenesis Online). The highly expressed genes in G1 group, compared with G3 group, were also involved in cell division, proliferation, DNA replication and regulation of cell cycle (Supplementary Figure 3B–D, available at Carcinogenesis Online). GSEA further reproduced the enriched functions of G1 group (Supplementary Figure 3E, available at Carcinogenesis Online), whereas fewer upregulated genes in G2 or G3 group made functional annotation meaningless (attributing to fewer samples in these groups).
Figure 3.
Enrichment analysis of distinct subtypes. (A, C and E) Volcano plots show the differentially expressed genes between G1 and G2, G1 and G3, G2 and G3 groups. (B, D and F) Gene ontology analysis based on the differentially expressed genes between G1 and G2, G1 and G3, G2 and G3 groups.
Identification of a prognostic signature for IDH-mutant GBMs
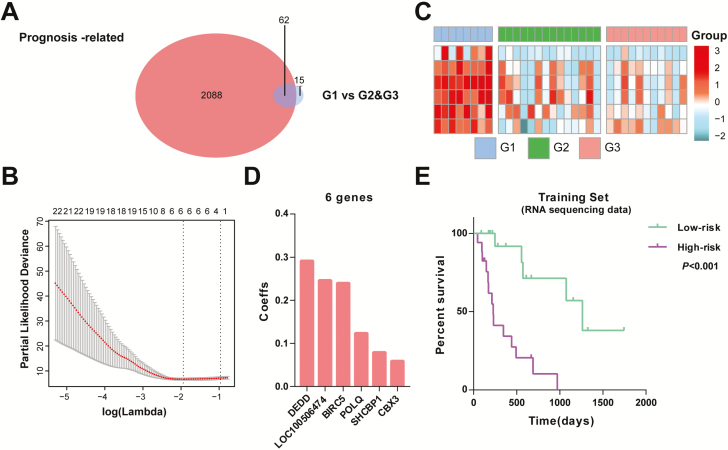
Considering the poorer outcome of G1 group relative to other groups, we proposed to construct a prognostic signature using the differential genes. SAM analysis found that 77 genes were differentially expressed between G1 and other groups (P < 0.05). Of the differential genes, 62 were significantly correlated with patients’ survival in univariate Cox regression analysis (P < 0.05; Figure 4A). Then, we applied a Cox proportional hazards model for choosing gene set with the best prognostic value. Consequently, a six-gene signature was acquired and the risk score for each sample was calculated with expression value and regression coefficient (Figure 4B–D).
Figure 4.
Identification of a prognostic signature by Cox proportional hazards model. (A) Venn diagram shows prognosis-related genes that are also differentially expressed between G1 and other groups. (B) Cross-validation for tuning parameter selection in the proportional hazards model. (C) Heat map of six genes of the signature based on the risk score value. (D) Coefficient (Coeff) values of the six selected genes. (E) Survival analysis of the signature in 33 IDH-mutant GBMs.
On the basis of the median value of risk scores, cases were assigned into low- and high-risk groups. Kaplan–Meier analysis found that patients in high-risk group had a significantly shorter OS than those in low-risk group (Figure 4E). To validate this signature in other populations, we calculated the risk score for each sample in CGGA microarray set with the same formula. As expected, the survival curve showed that low-risk cases had longer OS than high-risk ones (Supplementary Figure 4A, available at Carcinogenesis Online). Then, we further explored the prognostic value of this signature in stratified patients by age, gender, TERT promoter and subgroup. The similar results were also observed in most stratified patients (Supplementary Figure 5, available at Carcinogenesis Online). We further conducted univariate and multivariate Cox regression analyses to evaluate the prognostic independence of this signature. The acquired signature and group in the training set were both significantly correlated with patients’ OS, independent of other factors, whereas in the validation set were associated with OS only in univariate Cox analysis (Supplementary Table 4, available at Carcinogenesis Online). Moreover, we also evaluated the predictive accuracy by computing area under the curve of the risk score and group. The area under the curve of risk score (87.2%) was much higher than that of group (68.6%) (Supplementary Figure 6, available at Carcinogenesis Online). These results demonstrated the powerful ability of this signature for prognosis prediction.
Application of the acquired signature across diffuse gliomas
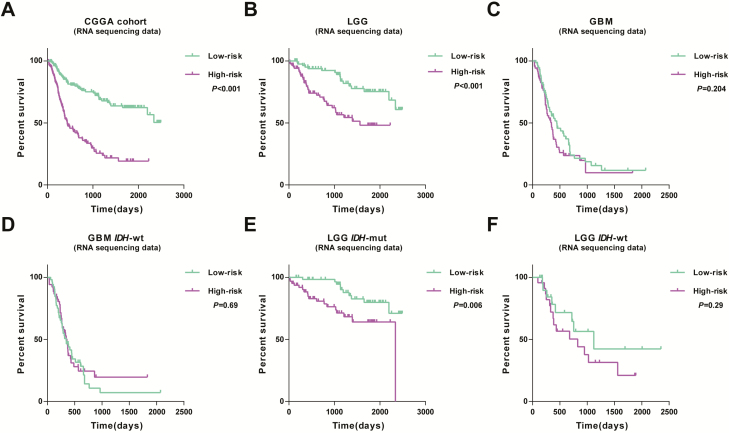
We further detected the prognostic significance of this signature across diffuse gliomas using CGGA cohort (RNA-seq and microarray data). A total of 309 diffuse glioma samples with clear clinicopathological information were included in this cohort (20,21). Kaplan–Meier analysis found that high-risk score conferred reduced OS in this cohort (Figure 5A). Then, patients were further stratified by grade and molecular subgroups. Consequently, consensus results were observed in cases of lower-grade gliomas (LGG) as well as IDH-mutant LGG, whereas in GBM, IDH-wt LGG and IDH-wt GBM found no significant differences (Figure 5B–F). In addition, we also applied this signature in patients of CGGA microarray set. As shown in Supplementary Figure 4B–G, available at Carcinogenesis Online, cases with high risk had shorter OS than those with low risk in the whole cohort, LGG and IDH-wt LGG, suggesting the compatibility of the signature in patients with LGG.
Figure 5.
Outcome prediction of the six-gene signature in diffuse gliomas. (A) Cases with low- or high-risk scores show significantly different OS in CGGA RNA sequencing cohort. (B and C) The prognostic value of signature in LGG and GBM. (D–F) Survival analysis in stratified patients (LGG IDH-mut, LGG IDH-wt and GBM-wt).
High-risk gliomas show an enhanced phenotype of cell division and DNA replication
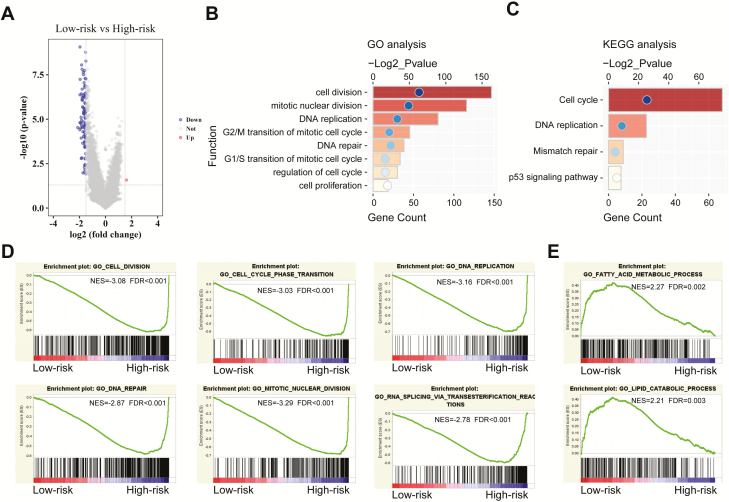
To determine the functional differences, we next compared gene expression between low-risk and high-risk cases. On the basis of differentially expressed genes (P < 0.05) identified by SAM (Figure 6A), gene ontology and Kyoto Encyclopedia of Genes and Genomes analyses revealed that cell division and proliferation, DNA replication and repair, transition of mitotic cell cycle and p53 signaling pathway were significantly enriched in high-risk IDH-mutant GBMs (Figure 6B and C). Meanwhile, GSEA also confirmed this finding and found that low-risk cases showed enrichment of lipid catabolic and fatty acid metabolic processes (Figure 6D and E). Consistently, analyses of the microarray set displayed similar results (Supplementary Figure 7, available at Carcinogenesis Online). These enriched biologic functions might contribute to patients’ favorable or poor prognosis.
Figure 6.
Functional enrichments between low- and high-risk cases. (A) Volcano plot represents the differential genes between low- and high-risk cases. (B) Gene ontology analysis of differential genes between low- and high-risk cases. (C) Kyoto Encyclopedia of Genes and Genomes analysis shows the enriched pathways. (D and E) GSEA analysis based on the median value of the risk scores.
Discussion
Tumor heterogeneity contributes to therapy failure and cancer progression. Combing single-cell RNA-seq profiles with bulk RNA-seq profiles of IDH-mutant gliomas, Venteicher et al. (22) found that differences in bulk profiles between IDH-astrocytoma and oligodendroglioma can be primarily explained by distinct tumor microenvironment, whereas both tumor types share similar lineages of glial differentiation. As grade increases, proliferative cell and undifferentiated glioma cells enhanced as well as macrophage over microglia expression programs (22). Here, we showed that gene expression profiling defined three subtypes of tumors with a common morphologic diagnosis of IDH-mutant GBMs. The importance of these subclassification lied in different targeted therapies that different subtypes might need. Moreover, studying IDH-mutant GBMs in light of subtypes could accelerate our understanding of GBM pathology. However, our study was impeded by the limited number of samples. A larger sample set might find additional subtypes for which we lacked the power to detect.
Immunotherapy has recently shown significant antitumor activity in several adult human cancers (23,24). For developing potential therapeutic targets, we explored if there were any differences in infiltrating immune signatures in these three subtypes using the immune score described by Yoshihara et al. (18). G1 group exhibited a trend of lower immune scores and higher purity compared with G2 or G3 group, but no significant differences (Supplementary Figure 8A–D, available at Carcinogenesis Online). We also determined immune-subtype differences between these groups using the CIBERSORT immune cell-specific gene sets (19) and found G1 group had lower memory B-cell scores compared with G2 group (Supplementary Figure 8E, available at Carcinogenesis Online). No significant differences in other immune cells scores were found, probably due to the limited case number of each group. B cells have been reported to play both positive and negative roles in tumor immunity (25). The presence of CD20+ B cell tumor-infiltrating lymphocytes correlated with improved survival and lower relapse rates in several cancers (26,27). Considering the poorer outcome of G1 group, B cells might negatively modulate tumor progression in this cancer, which has important implication for developing effective anticancer therapies.
Risk score was a widely used approach to develop a meaningful signature for predicting outcomes (14,28). On the basis of the upregulated genes of G1 group with worse outcome, we constructed a six-gene signature that could stratify patients with high or low risk of poor outcome. Because univariate Cox model was insufficient for variable selection, we first performed a Cox regression analysis to identify genes that were significantly correlated with patients’ survival. Then, we applied an elastic net regression Cox model to increase the predictive performance of the prognostic index, and the obtained six genes showed a cumulative effect on survival prediction. Most of these genes had been studied widely in various tumors except LOC100506474. BIRC5 (29,30), POLQ (31,32), SHCBP1 (33,34) and CBX3 (35,36) preferentially upregulated and promote cancer progression, whereas DEDD, as a tumor repressor, interacts with PI3KC3 to activate autophagy and attenuate epithelial–mesenchymal transition in breast cancer (37). We further explored the expression and prognostic correlation of these six genes in our RNA-seq data. All these genes showed increased expression in GBM compared with LGG (Supplementary Figure 9A, available at Carcinogenesis Online). High expression of these genes was associated with poor outcome except DEDD (Supplementary Figure 9B, available at Carcinogenesis Online). The biological role of these six genes involved in glioma progression needs to be studied further.
We also detected whether this signature was associated with pathological features. Cases were arrayed based on their risk scores. As shown in Supplementary Figure 10A and E, available at Carcinogenesis Online, the risk scores distributed differently in three groups, with higher levels in G1 group, whereas there were no differences of distribution in cases stratified by age, gender and TERT promoter status (Supplementary Figure 10, available at Carcinogenesis Online). Although the acquired signature could stratify patients with high or low risk of poor outcome in IDH-mutant gliomas of our dataset, more validation sets were needed for further confirmation. Our workflow is summarized in Supplementary Figure 11, available at Carcinogenesis Online.
In summary, this study demonstrated the transcriptome heterogeneity within IDH-mutant GBMs and developed a valuable signature for outcome assessment. We believe that this study will serve to facilitate discovery of new insights that can advance our molecular understanding of this disease.
Funding
National Natural Science Foundation of China (NSFC)/Research Grants Council (RGC) Joint Research Scheme (81761168038), the National Key Research and Development Plan (2016YFC0902500) and National Natural Science Foundation of China (81672479, 81773208, 81802994).
Supplementary Material
Acknowledgements
The authors conducting this work represent the Chinese Glioma Cooperative Group.
Conflict of interest: The authors declare no conflict of interest.
Glossary
Abbreviations
- CI
confidence interval
- CDF
cumulative distribution function
- CGGA
Chinese Glioma Genome Atlas
- Coeffs
coefficients
- GBM
glioblastoma
- GSEA
gene set enrichment analysis
- LGG
low-grade glioma
- OS
overall survival
- SAM
significance analysis of microarrays
References
- 1. Wen P.Y., et al. (2008) Malignant gliomas in adults. N. Engl. J. Med., 359, 492–507. [DOI] [PubMed] [Google Scholar]
- 2. Phillips H.S., et al. (2006) Molecular subclasses of high-grade glioma predict prognosis, delineate a pattern of disease progression, and resemble stages in neurogenesis. Cancer Cell, 9, 157–173. [DOI] [PubMed] [Google Scholar]
- 3. Cancer Genome Atlas Research, N. (2008) Comprehensive genomic characterization defines human glioblastoma genes and core pathways. Nature, 455, 1061–8. [DOI] [PMC free article] [PubMed] [Google Scholar]
- 4. Verhaak R.G., et al. ; Cancer Genome Atlas Research Network (2010) Integrated genomic analysis identifies clinically relevant subtypes of glioblastoma characterized by abnormalities in PDGFRA, IDH1, EGFR, and NF1. Cancer Cell, 17, 98–110. [DOI] [PMC free article] [PubMed] [Google Scholar]
- 5. Brennan C.W., et al. ; TCGA Research Network (2013) The somatic genomic landscape of glioblastoma. Cell, 155, 462–477. [DOI] [PMC free article] [PubMed] [Google Scholar]
- 6. Louis D.N., et al. (2016) The 2016 World Health Organization classification of tumors of the central nervous system: a summary. Acta Neuropathol., 131, 803–820. [DOI] [PubMed] [Google Scholar]
- 7. Hu H., et al. (2018) Mutational landscape of secondary glioblastoma guides MET-targeted trial in brain tumor. Cell, 175, 1665–1678. [DOI] [PubMed] [Google Scholar]
- 8. Bai H., et al. (2016) Integrated genomic characterization of IDH1-mutant glioma malignant progression. Nat. Genet., 48, 59–66. [DOI] [PMC free article] [PubMed] [Google Scholar]
- 9. Korshunov A., et al. (2018) Integrated molecular characterization of IDH-mutant glioblastomas. Neuropathol Appl Neurobiol, 45, 108–118. [DOI] [PubMed] [Google Scholar]
- 10. Zhang C., et al. (2017) Tumor purity as an underlying key factor in glioma. Clin. Cancer Res., 23, 6279–6291. [DOI] [PubMed] [Google Scholar]
- 11. Yan W., et al. (2012) Molecular classification of gliomas based on whole genome gene expression: a systematic report of 225 samples from the Chinese Glioma Cooperative Group. Neuro. Oncol., 14, 1432–1440. [DOI] [PMC free article] [PubMed] [Google Scholar]
- 12. Wilkerson M.D., et al. (2010) ConsensusClusterPlus: a class discovery tool with confidence assessments and item tracking. Bioinformatics, 26, 1572–1573. [DOI] [PMC free article] [PubMed] [Google Scholar]
- 13. Hughey J.J., et al. (2015) Robust meta-analysis of gene expression using the elastic net. Nucleic Acids Res., 43, e79. [DOI] [PMC free article] [PubMed] [Google Scholar]
- 14. Zhang W., et al. (2013) Whole-genome microRNA expression profiling identifies a 5-microRNA signature as a prognostic biomarker in Chinese patients with primary glioblastoma multiforme. Cancer, 119, 814–824. [DOI] [PubMed] [Google Scholar]
- 15. Subramanian A., et al. (2005) Gene set enrichment analysis: a knowledge-based approach for interpreting genome-wide expression profiles. Proc. Natl. Acad. Sci. USA., 102, 15545–15550. [DOI] [PMC free article] [PubMed] [Google Scholar]
- 16. Huang d.a.W., et al. (2009) Systematic and integrative analysis of large gene lists using DAVID bioinformatics resources. Nat. Protoc., 4, 44–57. [DOI] [PubMed] [Google Scholar]
- 17. Cheng W., et al. (2016) Bioinformatic profiling identifies an immune-related risk signature for glioblastoma. Neurology, 86, 2226–2234. [DOI] [PubMed] [Google Scholar]
- 18. Yoshihara K., et al. (2013) Inferring tumour purity and stromal and immune cell admixture from expression data. Nat. Commun., 4, 2612. [DOI] [PMC free article] [PubMed] [Google Scholar]
- 19. Newman A.M., et al. (2015) Robust enumeration of cell subsets from tissue expression profiles. Nat. Methods, 12, 453–457. [DOI] [PMC free article] [PubMed] [Google Scholar]
- 20. Wu F., et al. (2018) Expression profile analysis of antisense long non-coding RNA identifies WDFY3-AS2 as a prognostic biomarker in diffuse glioma. Cancer Cell Int., 18, 107. [DOI] [PMC free article] [PubMed] [Google Scholar]
- 21. Zhou Z., et al. (2018) Identification of an energy metabolism-related signature associated with clinical prognosis in diffuse glioma. Aging (Albany. NY)., 10, 3185–3209. [DOI] [PMC free article] [PubMed] [Google Scholar]
- 22. Venteicher A.S., et al. (2017) Decoupling genetics, lineages, and microenvironment in IDH-mutant gliomas by single-cell RNA-seq. Science, 335, eaai8478. [DOI] [PMC free article] [PubMed] [Google Scholar]
- 23. Wolchok J.D., et al. (2013) Nivolumab plus ipilimumab in advanced melanoma. N. Engl. J. Med., 369, 122–133. [DOI] [PMC free article] [PubMed] [Google Scholar]
- 24. Reck M., et al. ; KEYNOTE-024 Investigators (2016) Pembrolizumab versus chemotherapy for PD-L1-positive non-small-cell lung cancer. N. Engl. J. Med., 375, 1823–1833. [DOI] [PubMed] [Google Scholar]
- 25. Sarvaria A., et al. (2017) B cell regulation in cancer and anti-tumor immunity. Cell. Mol. Immunol., 14, 662–674. [DOI] [PMC free article] [PubMed] [Google Scholar]
- 26. Nielsen J.S., et al. (2012) CD20+ tumor-infiltrating lymphocytes have an atypical CD27- memory phenotype and together with CD8+ T cells promote favorable prognosis in ovarian cancer. Clin. Cancer Res., 18, 3281–3292. [DOI] [PubMed] [Google Scholar]
- 27. Al-Shibli K.I., et al. (2008) Prognostic effect of epithelial and stromal lymphocyte infiltration in non-small cell lung cancer. Clin. Cancer Res., 14, 5220–5227. [DOI] [PubMed] [Google Scholar]
- 28. Hu X., et al. (2017) Multigene signature for predicting prognosis of patients with 1p19q co-deletion diffuse glioma. Neuro. Oncol., 19, 786–795. [DOI] [PMC free article] [PubMed] [Google Scholar]
- 29. Hendruschk S., et al. (2011) RNA interference targeting survivin exerts antitumoral effects in vitro and in established glioma xenografts in vivo. Neuro. Oncol., 13, 1074–1089. [DOI] [PMC free article] [PubMed] [Google Scholar]
- 30. Fenstermaker R.A., et al. (2018) Survivin monoclonal antibodies detect survivin cell surface expression and inhibit tumor growth in vivo. Clin. Cancer Res., 24, 2642–2652. [DOI] [PMC free article] [PubMed] [Google Scholar]
- 31. Lemée F., et al. (2010) DNA polymerase theta up-regulation is associated with poor survival in breast cancer, perturbs DNA replication, and promotes genetic instability. Proc. Natl. Acad. Sci. USA., 107, 13390–13395. [DOI] [PMC free article] [PubMed] [Google Scholar]
- 32. Kawamura K., et al. (2004) DNA polymerase theta is preferentially expressed in lymphoid tissues and upregulated in human cancers. Int. J. Cancer, 109, 9–16. [DOI] [PubMed] [Google Scholar]
- 33. Peng C., et al. (2017) SHCBP1 promotes synovial sarcoma cell metastasis via targeting TGF-β1/Smad signaling pathway and is associated with poor prognosis. J. Exp. Clin. Cancer Res., 36, 141. [DOI] [PMC free article] [PubMed] [Google Scholar]
- 34. Peng C., et al. (2016) Identification of SHCBP1 as a novel downstream target gene of SS18-SSX1 and its functional analysis in progression of synovial sarcoma. Oncotarget, 7, 66822–66834. [DOI] [PMC free article] [PubMed] [Google Scholar]
- 35. Liu M., et al. (2015) Heterochromatin protein HP1γ promotes colorectal cancer progression and is regulated by miR-30a. Cancer Res., 75, 4593–4604. [DOI] [PubMed] [Google Scholar]
- 36. Zhou J., et al. (2014) Overexpression of HP1γ is associated with poor prognosis in non-small cell lung cancer cell through promoting cell survival. Tumour Biol., 35, 9777–9785. [DOI] [PubMed] [Google Scholar]
- 37. Lv Q., et al. (2012) DEDD interacts with PI3KC3 to activate autophagy and attenuate epithelial-mesenchymal transition in human breast cancer. Cancer Res., 72, 3238–3250. [DOI] [PubMed] [Google Scholar]
Associated Data
This section collects any data citations, data availability statements, or supplementary materials included in this article.


