

Abstract
An aged circulatory environment can activate microglia, reduce neural precursor cell activity, and impair cognition in mice. We hypothesized that brain endothelial cells (BECs) mediate at least some of these effects. We observe BECs in the aged mouse hippocampus express an inflammatory transcriptional profile with focal upregulation of Vascular Cell Adhesion Molecule 1 (VCAM1), a protein that facilitates vascular-immune cell interactions. Concomitantly, the shed, soluble form of VCAM1 is prominently increased in plasma of aged humans and mice, and their plasma is sufficient to increase VCAM1 expression in cultured BECs and young mouse hippocampi. Systemic anti-VCAM1 antibody or genetic ablation of VCAM1 in BECs counteracts the detrimental effects of aged plasma on young brains and reverses aging aspects including microglial reactivity and cognitive deficits in old mouse brains. Together, these findings establish brain endothelial VCAM1 at the blood-brain barrier (BBB) as a possible target to treat age-related neurodegeneration.
Brain structure and function deteriorate with age, steadily driving cognitive impairments and susceptibility to neurodegenerative disorders in humans1. How aging leads to these manifestations is poorly understood but an increase in the activation of microglia, frequently referred to as “neuroinflammation”2-4 and a precipitous loss of stem cell numbers and activity in the dentate gyrus (DG) of the hippocampus, one of two neurogenic regions of the adult mammalian brain5 are commonly noted. The hippocampus is crucial for learning and memory, and is particularly vulnerable to age-related neurodegeneration and diseases such as Alzheimer’s disease (AD)6.
While many of these age-related changes in the brain may be the consequences of cell-intrinsic and brain-localized mechanisms of aging, we asked if changes in secreted signaling proteins, dubbed the communicome7, could be used to understand, characterize, and quantify aspects of brain aging and cognitive impairment. Indeed, such changes in plasma or CSF proteomes are not only abundant with aging and disease8,9, but factors in young blood or plasma from mice or humans are sufficient to increase brain function in the hippocampus8,10,11 and the subventricular zone (SVZ)12. Conversely, young mice exposed to old blood showed reduced neurogenesis and cognitive function in the hippocampus8,13. Considering the tight regulation of transport of molecules across the BBB and its role as a protective barrier with limited permeability to macromolecules14, it is currently unclear how pro-youthful or pro-aging factors may modulate brain function1. Here, we investigated the interaction between the circulating communicome and BECs in the context of brain aging.
Results
Aged BECs are transcriptionally activated.
To determine the transcriptional changes associated with aged BECs, we acutely isolated primary CD31+ BECs from young (3-month-old) and aged (19-month-old) pooled mouse cortices and hippocampi and analyzed their transcriptome using RNA sequencing (Extended Data Fig. 1a-b). Unsupervised cluster analysis revealed prominent age-dependent changes in the transcriptome with over 1000 differentially expressed genes (Fig. 1a). Cell purity was confirmed based on high gene expression values for BEC-specific genes, and very low or undetectable expression of other CNS cell type-specific markers (Fig. 1b, Extended Data Fig. 1c). GeneAnalytics Pathway Analysis of differentially expressed genes revealed numerous pathways associated with aging (Supplementary Table 1), including cell adhesion, immune cell activation, stress response and vascular remodeling15. Analysis of the highly expressed and differentially expressed transcripts revealed an inflammatory and activated profile with age as illustrated by the doubling in mRNA expression of the MHC class I molecules β2-microglobulin (B2m) and H2-K1, two of the most highly expressed transcripts in BECs (Fig. 1c). Tspo, a marker of neuroinflammation commonly used in human PET scans to assess the level of microglial activation in neurodegenerative diseases16, was highly expressed in BECs and also significantly increases with age, as was von Willebrand factor (Vwf), a blood glycoprotein involved in hemostasis, elevated under acute and chronic inflammation and known to promote vascular inflammation17 (Fig. 1c).
Fig. 1. BECs are activated with age. Systemic and cerebrovascular VCAM1 increases with aging and heterochronic parabiosis.

(a) Heat map displaying up or down-regulated genes in young versus aged BECs based on bulk RNAseq (n=6 young and 6 aged biologically independent samples; each sample= 2 biologically independent mice cortex/hippocampi pooled as one sample). There were 1006 significant differentially expressed genes (*q<0.05, Cuffdiff Statistical Package61).
(b) Fragments Per Kilobase of transcript per Million mapped reads (FPKM) of BEC cell-type specific markers. n=6 young and 6 aged biologically independent samples. Mean +/− SEM.
(c) FPKM values of inflammation and activation related genes. n=6 young and 6 aged biologically independent samples. Mean +/− SEM. Specific q values shown are derived from Cuffdiff Statistical Package. See Methods and Source Data for details.
(d) Heat map showing changes in 31 out of 74 human plasma factors with aging (p<0.05, Spearman’s correlation coefficient). Multiplex assay used (n=118 healthy humans).
(e) Spearman correlation of VCAM1 levels and age (Spearman’s correlation coefficient = 0.47; p=7.7e-08; q=5.72 × 10⁻⁶).
(f) Human sVCAM1 ELISAs in 11 young (<25 years old) or 11 aged (>65 years old) plasma from individual healthy donors. **p=0.0033, Student’s t-test. Two-tailed. Mean +/− SEM.
(g) ELISA for mouse sVCAM1 in plasma from young (3-month-old; n=8), middle-aged (8–10-month-old; n=10), and aged (19-month-old; n=8) mice. Mean +/− SEM. ***p=0.0001 ****p<0.0001, 1-way ANOVA with Tukey’s multiple comparisons test.
(h) Representative confocal images in the DG of young (3-month-old) or aged (18-month-old) mice given retro-orbital (r.o.) injections of fluorescently conjugated anti-VCAM1 and anti-Meca99 2 hours before perfusion. Hoechst labels cell nuclei. Scale bar = 50 µm. 3D rendering of the 2D images are displayed. 3D Scale bar = 50 µm. VCAM1 quantified in 4 separate cohorts of mice spaced 6 months or more apart.
(i) Quantification of VCAM1+Lectin+ stained brain vasculature in young, middle, and aged hippocampi. n=12 young (3-4-month-old), 5 middle (12-month-old), 11 aged (18-month-old), and 6 very aged (24-month-old) mice. VCAM1 quantified in 4 separate cohorts of mice spaced 6 months or more apart. Mean +/− SEM. ***p=0.0002, ****p<0.0001, 1-way ANOVA with Tukey’s multiple comparisons test.
(j) Quantification in the DG of VCAM1+Lectin+ stained brain vasculature of young isochronic or heterochronic parabionts 5 weeks after surgery. Representative images shown in Extended Data Figure 1k. **p=0.0071, Student’s t-test. Two-tailed. Mean +/− SEM. n= 8 mice in the Young Isochronic group and 13 mice in Young heterochronic group from two independent experiments.
VCAM1 increases with age exposure to systemic inflammatory mediators.
To identify proteins changing with human aging and possibly associated with the BBB and cerebrovascular dysfunction, we searched for those involved in vascular function in the healthy aging control group in a previously published plasma proteomic dataset from our lab9. Concentrations of 31 factors correlated significantly with age (Fig. 1d, Supplementary Table 2, p<0.05). Of these, 8 are expressed in mouse BECs at the transcriptional level (Supplementary Table 2; Extended Data Fig. 1d,f), and 5 have vascular, endothelial, or angiogenesis-related functions (Supplementary Table 2; GeneCards). Among the proteins expressed in or related to the vasculature, sVCAM1 correlated most strongly with age (Fig. 1e) and increased in an independent cohort of healthy individuals (Fig. 1f). VCAM1, a member of the immunoglobulin superfamily, is upregulated on endothelium in response to inflammation throughout the body where it facilitates leukocyte tethering through the integrin receptor α4β1 (also known as VLA-4) and transmigration into tissues18,19. VCAM1 is shed constitutively through proteolytic cleavage by the membrane-bound metalloproteinase ADAM17, resulting in high quantities of plasma sVCAM120. Similar to humans, mice show a significant increase in plasma sVCAM1 with more advanced age (19-month-old) that is not seen in middle age (10–12-month-old; Fig. 1g).
This increase in sVCAM1 in plasma is associated with a significant increase in VCAM1 expression in lectin and Meca99 immunoreactive cells, markers of cerebral blood vessels, in the aged mouse dentate gyrus (Fig.1h-i)21,22. This increase was confirmed by quantifying CD31+VCAM1+ BECs in the cortex and hippocampi of young and aged mice (Extended Data Fig. 1g-i). Interestingly, exposure to aged blood through heterochronic parabiosis induced a similar increase in VCAM1 immunoreactivity in young mice (Fig. 1j; Extended Data Fig. 1k) and a concomitant increase in sVCAM1 in plasma (Extended Data Fig. 1j). In bulk population of BECs, mRNA expression of molecules involved in leukocyte adhesion were low or undetectable (Extended Data Fig. 1d). At the protein level, VCAM1 expression is visible in a small percentage of BECs (Extended Data Fig. 1g-i), suggesting that different populations and regions of BECs at the BBB respond uniquely to an aged systemic milieu.
Considering the heterogeneity of the BBB (Fig. 2a) and the low percentage of BECs that express VCAM1 (Fig. 1h-j; Extended Data Fig. 1g-i; Fig. 3c-d), we performed single cell RNAseq on VCAM1-enriched BECs to characterize the unique molecular and phenotypic nature of rare VCAM1+ BECs. Full-length single-cell RNAseq was performed on 160 and 112 BECs isolated from pooled hippocampi of young or aged mice, respectively. We infused a fluorescently labeled anti-VCAM1 mAb retro-orbitally (r.o.) prior to mouse perfusion and tissue dissection which allowed us to enrich VCAM1+BECs up to 50% using cell sorting (Extended Data Fig. 1g-i; Methods). All isolated cells expressed both pan-endothelial (Pecam1, Cldn5) and BBB-specific markers (Slco1c1, Slc2a1, Abcb1a, Ocln) (Extended Data Fig. 1l; ref. 23-26). Furthermore, we verified that VCAM1 protein levels correlate with Vcam1 mRNA (Extended Data Fig. 1m-n). Unsupervised clustering in principal component space using the top 2,500 correlated and anti-correlated genes revealed three molecularly distinct populations (Fig. 2b). The isolated VCAM1+ cells were confined to two subpopulations (Fig. 2c and Supplementary Table 3). Interestingly, none of the clusters were significantly enriched for young or aged cells, indicating that strong sources of variation exist besides age that are resulting in transcriptional heterogeneity between the BEC subpopulations (Extended Data Fig. 1o). In spite of this, a direct comparison of Vcam1 expression levels within the isolated VCAM1high CD31+ BECs showed significantly higher Vcam1 mRNA levels in aged BECs compared to young (Extended Data Fig. 1p). Other adhesion molecules, namely E- and P-selectin, were undetectable in the isolated BECs with scRNAseq, consistent with absence of detection in bulk RNAseq (Extended Data Fig. 1d). Icam1 transcript, primarily enriched in the venous VCAM1+ cluster (Fig. 2h), is co-expressed in few young or aged VCAM1+ BECs as well as all BECs analyzed and does not increase with age (Extended Data Fig. 1q).
Fig. 2. Single cell RNASeq of VCAM1 enriched young and aged BECs.

(a) Schematic of the Blood-brain barrier (BBB). Nutrient-rich, oxygenated blood is pumped into the brain through cerebral arterial BECs (arteries and arterioles), which are protected and supported by smooth muscle cells (SMCs) that cover the endothelium and form a basement membrane layered by astrocytic end-feet of the brain parenchyma. The blood is transferred to highly specialized capillaries, which are comprised of BECs that form unique tight junctions and are wrapped by pericytes (Peric.) within the endothelial basement membrane, which is then covered by astrocytic end-feet. BBB capillaries are the site of controlled transport of fluids and solutes into the CNS. Immuno-surveillance and occasional extravasation of leukocytes (Leuk.) into the CNS parenchyma occurs at the level of postcapillary venous cells (venules and veins) the vascular segments into which blood flows after passing through the capillaries. Postcapillary Venules contain enlarged perivascular space between the endothelial and astrocytic basement membranes where occasional immune cells can reside.62,63
(b) Unbiased clustering of 112 aged and 160 young hippocampal BECs using whole transcriptome and visualization with tSNE reveals 3 molecularly distinct BEC populations.
(c) Violin plots of Vcam1 reveal differing levels of the transcript in each of the cell clusters. Minima, maxima, median, and percentiles are listed in Supplementary Table 4. (n=146 Capillary BECs, n=59 Venous BECs, n=67 Arterial BECs pooled from 8 mice hippocampi).
(d) Dotplot comparing the expression (scaled transcript counts and percent of population expressing) of various classical inflammatory, Notch signaling, arteriolar, venular and capillary markers between the three clusters (Cluster 0: Vcam1-negative, Cluster 1: Vcam1-pos, Cluster 2: Vcam1-pos).
(e) Heatmap of the scaled expression of the top 10 enriched genes (differentially expressed with p<0.05, Mann-Whitney test, two-sided) in each cluster. Genes are ranked by highest log-fold change when compared to all other cells.
(f) tSNE visualization colored by Vcam1 expression levels. Clusters are further annotated by their putative functional-phenotype and vessel segmental identity. (n=146 Capillary BECs, n=59 Venous BECs, n=67 Arterial BECs pooled from 8 mice hippocampi).
(g) GeneAnalytics (GSEA Package)- Brain Endothelial Cell Pathway analysis of the Vcam1−positive venous and arteriolar hippocampal BEC clusters. The top 10 pathways containing Vcam1 are highlighted here, along with the number of genes in each pathway enriched and the score assigned to each pathway.
(h) Violin plots of various inflammation-related genes in each of the 3 distinct clusters. To note, age-related chemokine Ccl11 and its receptor, Ccr3, were not found to be expressed in isolated CD31+ BECs. Minima, maxima, median, and percentiles are listed in Supplementary Table 4. (n=146 Capillary BECs, n=59 Venous BECs, n=67 Arterial BECs pooled from 8 mice hippocampi).
(i) Violin plots of cytokine receptors enriched in the Vcam1−positive venous cluster. Minima, maxima, median, and percentiles are listed in Supplementary Table 4. (n=146 Capillary BECs, n=59 Venous BECs, n=67 Arterial BECs pooled from 8 mice hippocampi).
(j) Young (2.5-month-old) mice were injected with PBS control (n=5 mice high dose, 3 mice low dose), TNF-α (n=3 mice at high dose, 4 mice at low dose), IL-1β (n=4 mice low dose, 4 mice high dose), or IL-6 r.o. (n=4 mice low dose) daily over 5 days (2 µg per injection; low dose) or acutely (10 µg; high dose). Representative confocal images (bottom) and quantification (top) of VCAM1+ staining in the DG. Scale bar = 100 µm. Mean +/− SEM. *p=0.027, **p=0.041, ***p=0.028, ***p=0.006. 1-way ANOVA with Dunnett’s multiple comparison’s test.
Fig. 3. Aged blood administration into young mice activates brain vasculature and microglia and reduces hippocampal NPC activity.

(a) Schematic of experimental design. n=10 mice treated with YMP,11 mice treated with AMP.
(b) Representative confocal images (left) and quantification (right) of VCAM1+lectin+ in the DG. Hoechst labels cell nuclei. Arrows indicate VCAM1+ vessels. Scale bar = 100 µm. ****p=0.0001. Two-tailed Student’s t-test. Mean +/− SEM. n=10 mice treated with YMP,11 mice treated with AMP.
(c) Top: Histogram plots of CD31+VCAM1+ cells isolated from LPS stimulated young (3-month-old) wildtype mice injected (r.o.) with fluorescently tagged DL488 anti-VCAM1 mAb or IgG-DL488 isotype control 2 hours before sacrifice. This was done to set the gating for VCAM1+CD31+BECs. Bottom: Flow gating and histogram plots of pooled (n=4 mice/plasma treatment), young hippocampi isolated from plasma-injected young mice. To label VCAM1+BECs, mice were injected (r.o.) with fluorescently tagged DL488 anti-VCAM1 mAb 2 hours before sacrifice.
(d) Quantification of CD31+VCAM1+cells isolated from (left) healthy cortex (n=4 mice per plasma treatment, individually measured) and (right) 4 technical replicates of hippocampi that are pooled from 4 mice per plasma treatment group. Mean +/− SEM. *p=0.017. Two-tailed Student’s t-test.
(e) Representative confocal images and quantification (f) in the DG and SGZ of BrdU+, Sox2+, and GFAP. Scale bar = 100 µm. Purple lines outline the SGZ and arrows indicate proliferating NPCs. **p=0.009, *p=0.028. Two-tailed Student’s t-test. Mean +/− SEM. n=10 mice treated with YMP,11 mice treated with AMP.
(g) Representative confocal images and quantification (h) in the GCL of DCX (white). Scale bar = 100 µm. ***p=0.0001. Two-tailed Student’s t-test. Mean +/− SEM. n=10 mice treated with YMP,11 mice treated with AMP.
(i) Representative confocal images and quantification (j) in the DG of CD68, Iba1, and Hoechst. Scale bar = 100 µm. ***p=0.0047, **p=0.0011, *p=0.031. Two-tailed Student’s t-test. Mean +/− SEM. n=10 mice treated with YMP,11 mice treated with AMP.
Among the three unique clusters, we identified one largely Vcam1 negative population characterized by genes relating to BBB metabolism, transport and the capillary phenotype (Fig. 2c-f). Interestingly, the remaining two clusters were both Vcam1-positive, but molecularly distinct, with one expressing slightly higher Vcam1 levels (C1) than the other (C2) (Fig. 2c). Using a biased classification method with known markers of the 3 main vessel types found in the BBB (Extended Fig. 2a; ref. 23-26), we found the Vcam1-C2 cluster to express significantly higher levels of pro-inflammatory genes (Vwf among others) and post-capillary venous (venule and vein) markers (Nr2f2, Ephb4), while the Vcam1-C1 cluster expressed genes involved in vascular remodeling and Notch signaling (Vegfc, Notch1, Edn1, among others) and arterial (artery and arteriole) classification markers (Bmx, Efnb2, Jag1) (Fig. 2d, Extended Data Fig. 2a-b; GeneCards; ref. 23-26).
We further applied the Mann-Whitney test to find differentially expressed genes between the three BEC subpopulations in an unbiased manner (Fig. 2e). Indeed, the Vcam1-venous cluster was enriched with inflammatory and cytokine-signaling genes (Tspo, Lrg1, Hif1a, B2m, among others) and pathways including TNF-α, NFκB, and cytokine signaling, among others (Fig. 2e-i, GeneCards). The Vcam1-arterial cluster was differentially characterized by genes involved in matrix remodeling, migration and proliferation (Fbln5, Mgp, Bgn) and pathways including innate immunity, integrin, and VEGF signaling (Fig. 2e-g), Notch signaling pathway genes and factors related to neurogenesis (Extended Data Fig. 2a-b; GeneCards; ref. 23-28). Venous and arterial VCAM1+BECs expressed Tnfrsf1a, Il1r1, Il6ra, Il6st (Fig 2i), receptors for inflammatory cytokines TNF-α, IL-1ß, and IL6, respectively, known to induce VCAM1 through NF-κB signaling29,30 and increased in the circulation in neurodegeneration and ageing31,32. Indeed, recombinant TNF-α and IL-1ß, but not IL-6, were sufficient to induce VCAM1 expression in the hippocampus following retro-orbital injection in mice (Fig. 2j) or in cultured brain endothelial cells (Extended Data Fig. 2c-e).
Aged plasma increases VCAM1 expression, reduces NPC activity, and increases microglial reactivity.
To determine whether soluble factors in blood can increase cerebrovascular VCAM1 we added aged plasma to cultured BECs or infused it into young mice. Aged plasma added to acutely isolated primary mouse BECs or Bend.3 cells significantly increased VCAM1 protein compared to young plasma while other adhesion molecules, namely ICAM1, E-selectin, and P-selectin, were not significantly upregulated at protein (Extended Data Fig. 2f-i) or RNA levels (Extended Data Figs. 1d, q). Likewise, plasma from aged, but not from young mice infused into young mice (r.o.) caused a significant increase in VCAM1 expression in lectin+ blood vessels and acutely isolated BECs (Fig. 3a-d), while ICAM1 was not changed (Extended Data Fig. 2j-k).
In line with previous findings8,13, aged plasma infusions reduced numbers of BrdU+ proliferating cells overall, BrdU+Sox2+ NPCs (Fig. 3e-f), and doublecortin (DCX)+ immature neurons (Fig. 3g-h) in the granule cell layer (GCL) of the dentate gyrus of young mice. Administration of recombinant TNF-α or LPS in young mice also reduced NPC proliferation (Extended Data Fig. 2l-m). There was no change in the number of quiescent BrdU+Sox2+GFAP+ neural stem cells in the subgranular zone (SGZ) (Fig. 3f). Acute injections of aged plasma also induced a prominent response in microglia, manifested in increased Iba1 immunoreactivity overall, expression of CD68 in Iba1+ cells, and numbers of CD68+Iba1+ microglia (Fig. 3i-j). The total number of microglia did not change with this short-term plasma treatment (Fig. 3j).
Similar to aged mouse plasma, repeated injections of aged human plasma over 3 weeks induced a prominent increase in BEC-specific VCAM1 expression in young immunodeficient NOD-scid IL2Rγnull (NSG) mice (Extended Data Fig. 3a-b), reduced NPC activity, and increased microglia reactivity (Extended Data Fig. 3c-d). NSG mice lack T and B lymphocytes and have defective natural killer cells but VLA-4 expressing innate immune cells of the myeloid lineage, including neutrophils and monocytes, are intact33. Injection of human cord plasma (r.o.) into old NSG mice rejuvenates their brains11.
Genetic deletion of Vcam1 in BECs prevents effects of aged plasma.
To test whether VCAM1 is simply a correlate of vascular inflammation or a possible mediator of the detrimental effects of aged plasma on the hippocampus, we deleted Vcam1 in BECs using a Slco1c1-CreERT2 mouse – encoding tamoxifen-inducible Cre-recombinase under a brain endothelial and epithelial-specific Slco1c1 promoter34. While unspecific recombination of tamoxifen-treated Slco1c1-CreERT2 mice can occur in granule neurons and possibly other cell types when crossed with a td-tomato reporter line34, we did not detect any expression of VCAM1 protein in Sox2+, GFAP+, NeuN+, or DCX+ cells in the DG of the hippocampus (Extended Data Fig. 4a,c), even in aged mice although, as expected Aqp4+ astrocytic endfeet outlines VCAM1+ vessels (Extended Data Fig. 3j-k). We confirmed that Vcam1fl/flSlco1c1-CreERT2+/− (Cre+) mice undergo BEC-specific Vcam1 deletion following tamoxifen injections using a systemic LPS inflammation model (Extended Data Fig. 4d-g). Systemic LPS administration significantly upregulated BEC-specific VCAM1 in tamoxifen-treated Vcam1fl/flSlco1c1-CreERT2−/− (Cre-) control mice, but not in tamoxifen-treated Cre+ littermates (Extended Data Fig. 4d-g) and reduced VCAM1 protein expression in blood vessels of Cre+ mice (Extended Data Fig. 3j-k).
We next investigated how short-term administration of aged plasma affects young mice in the absence of brain endothelial and epithelial-specific Vcam1 (Fig. 4a). While VCAM1 expression was absent in Cre+ brains, sVCAM1 levels remained high in plasma of all tamoxifen-treated mice indicating unperturbed peripheral expression (Fig. 4b-d). Importantly, Vcam1 deletion in Cre+ brain endothelium abrogated the detrimental effects of aged mouse plasma on hippocampal NPC activity and microglial reactivity (Fig. 4e-k). Thus, Cre+ mice treated with young or aged plasma had equal levels of NPCs as shown by equal numbers of BrdU+, BrdU+Sox2+, and DCX+ NPC populations (Fig. 4e-i). Moreover, aged plasma also failed to induce microglial reactivity, indicated by the levels of CD68 in Iba1+ cells (Fig. 4j-k). Similar to wildtype mice (Fig. 3), Cre-negative control mice showed reduced NPC activity and increased microglial activation when exposed to aged plasma (Fig. 4e-k). Similarly, long-term administration of aged plasma failed to induce microglial reactivity and inhibit NPC activity in the dentate gyri of young Cre+ mice lacking VCAM1 (Extended Data Fig. 5a-j). Interestingly, young mice lacking brain endothelial and epithelial Vcam1 for 3 weeks of young adulthood showed a lower baseline number of BrdU+Sox2+ NPCs in the hippocampus while microglial number and activation were not affected (Extended Data Fig. 3e-i). It is possible that VCAM1 has additional functions in the maintenance of adult NPCs in young mice as reported for the SVZ35 and discussed in more detail below. Importantly, depletion of sVCAM1 from aged human plasma prior to in vivo administration (Extended Data Fig. 6a-d) did not significantly change its adverse effects on NPC activity and microglial reactivity in young mice (Extended Data Fig. 6e-j) indicating high levels of circulating, soluble VCAM1 do not drive aging phenotypes in the young brain.
Fig. 4. Brain endothelial and epithelial-specific Vcam1 deletion in young mice mitigates the effects of aged plasma administration.

(a) Experimental design. n=7 Cre− mice administered YMP, 8 Cre+ mice administered YMP, 8 Cre− mice administered AMP, 8 Cre+ mice administered AMP. Plasma administration in these transgenic mice was performed 1 additional time in a long-term paradigm with similar results (Extended Data Figure 5). Plasma administration was performed in 8 independent experiments with similar results (Supplementary Table 4).
(b) Representative confocal images in the DG of VCAM1, MECA-99, and Aqp4. Hoechst labels cell nuclei. Scale bar = 200 µm for merged images and scale bar= 50 µm for the zoomed VCAM1 and MECA-99 merged images outlined with white squares. Tissue was stained and VCAM1 was measured in all 31 mice in this study.
(c) Quantification of VCAM1+ lectin+ vasculature ***p=0.0031. 2-way ANOVA with Tukey’s multiple comparisons test. Mean +/− SEM. n=7 Cre− mice administered YMP, 8 Cre+ mice administered YMP, 8 Cre− mice administered AMP, 8 Cre+ mice administered AMP.
(d) Mouse sVCAsM1 ELISA of plasma samples. *p=0.022. 2-way ANOVA with Tukey’s multiple comparisons test. Mean +/− SEM. n=7 Cre− mice administered YMP, 8 Cre+ mice administered YMP, 8 Cre− mice administered AMP, 8 Cre+ mice administered AMP.
(e) BrdU quantification and representative confocal images (f) and BrdU+Sox2+ quantification (g) in the DG of brain sections immunostained for BrdU and Sox2. White dotted lines outline the SGZ; Scale bar = 200 µm. *p=0.02, **p=0.017. 2-way ANOVA with Tukey’s multiple comparisons test. Mean +/− SEM. n=7 Cre− mice administered YMP, 8 Cre+ mice administered YMP, 8 Cre− mice administered AMP, 8 Cre+ mice administered AMP.
(h) DCX+ quantification and representative confocal images (i) in the GCL. Hoechst labels cell nuclei. Scale bar = 100 µm. **p=0.0015. 2-way ANOVA with Tukey’s multiple comparisons test. Mean +/− SEM. n=7 Cre− mice administered YMP, 8 Cre+ mice administered YMP, 8 Cre− mice administered AMP, 8 Cre+ mice administered AMP.
(j) Representative confocal images and quantification (k) from the DG of CD68 and Iba1. Hoechst labels cell nuclei. Scale bar = 100 µm. ****p=0.0008, ***p=0.0061, 2-way ANOVA with Tukey’s multiple comparisons test. Mean +/− SEM. n=7 Cre− mice administered YMP, 8 Cre+ mice administered YMP, 8 Cre− mice administered AMP, 8 Cre+ mice administered AMP.
Monoclonal VCAM1 antibody prevents detrimental effects of aged plasma.
Leukocytes bind to VCAM1 primarily through α4ß1 integrin, also known as VLA-436, and a VLA-4 antibody is used to treat multiple sclerosis (MS) and Crohn’s Disease37. Blockade of the VCAM1-VLA-4 interaction also reduced seizures in a mouse model15 prompting us to determine whether anti-VCAM1 antibody treatment would mimic the effects of genetic VCAM1 deletion and antagonize effects of aged plasma (Fig. 5a). Treatment with a well-characterized anti-VCAM1 antibody that binds to immunoglobulin domains 1 and 4 of the extracellular domain of the protein and prevents leukocyte tethering38 did not affect the increase in VCAM1 expression in brain endothelium following aged plasma infusion (Fig. 5b,e), while it completely prevented the inhibitory effects of aged plasma on NPC activity (Fig. 5c,f) and microglial reactivity (Fig. 5d,g). In contrast, in PBS-treated control mice, anti-VCAM1 treatment had no effects on these parameters. Anti-VCAM1 antibody treatment similarly prevented the detrimental effects of aged human plasma in young NSG mice (Extended Data Fig. 6k-p).
Fig. 5. Anti-VCAM1 antibody prevents inhibitory effects of aged plasma administration in young mice.

(a) Experimental design. n=10 mice per group.
(b) Representative confocal images and quantification (e) (n= 5 mice/group) in the DG of VCAM1, lectin, and Aqp4. Hoechst labels cell nuclei. White arrows point to VCAM1+ vessels. Scale bar = 100 µm. Mean +/− SEM. 2-way ANOVA with Tukey’s multiple comparisons test. ****p=0.0013, p=0.06 (PBS vs. AHP in mice treated with anti-VCAM1 mAb).
(c) Representative confocal images and quantification (f) in the DG of EdU and Sox2. Hoechst labels cell nuclei. Arrows indicate proliferating NPCs. The SGZ is outlined with white lines. Scale bar = 50 µm. n=10 mice/group. Mean +/− SEM. 2-way ANOVA with Tukey’s multiple comparisons test. *p=0.0154.
(d) Representative confocal images and quantification (g) in the DG of CD68 and Iba1. Hoechst labels cell nuclei. Scale bar = 100 µm. n=10 mice/group. Mean +/− SEM. 2-way ANOVA with Tukey’s multiple comparisons test. ****p<0.0001, ***p=0.0001, *p=0.0407.
(h) Experimental design. n=8 mice injected with PBS (r.o.), 8 mice injected with AHP (r.o.) and IgG (i.p.), and 7 mice injected with AHP (r.o.) and anti-VCAM1 mAb (i.p.)
(i) Quantification and (j) representative confocal images in the DG of BrdU+ and BrdU+Sox2+ precursor cells. The SGZ is outlined with white lines. Scale bar = 100 µm. n=8 mice injected with PBS, 8 mice injected with AHP and IgG, and 7 mice injected with AHP and anti-VCAM1 mAb. Mean +/− SEM. One-way ANOVA with Tukey’s post hoc test for group comparisons. **p=0.0056, *p=0.0253, ***p=0.0041, ****p=0.019.
(k) Quantification in the DG of total number of surviving EdU+ cells, EdU+GFAP+ astrocytes, and EdU+Sox2+GFAP+ radial glia-like NSCs in the SGZ based on confocal images of immunostained brain sections for EdU, Sox2, and GFAP. n=8 mice injected with PBS, 8 mice injected with AHP and IgG, and 7 mice injected with AHP and anti-VCAM1 mAb. Mean +/− SEM. One-way ANOVA with Tukey’s post hoc test for group comparisons. **p=0.011, **p=0.0057, ***p=0.0083, ****p=0.049, *****p=0.022.
(l) Representative confocal images and quantification (m) in the GCL of EdU, DCX, and NeuN. Scale bar = 100 µm. n=8 mice injected with PBS, 8 mice injected with AHP and IgG, and 7 mice injected with AHP and anti-VCAM1 mAb. Mean +/− SEM. One-way ANOVA with Tukey’s post hoc test for group comparisons. *p=0.0399 and p=0.0643(AMP+IgG vs. AMP+ anti-VCAM1 mAb).
(n) Cell fate based on co-labeling of surviving EdU+ cells 4 weeks after EdU labeling of mice. Each bar represents 100% of EdU+ cells.
To determine if aged plasma reduced the survival of newborn cells in the DG of the hippocampus and whether anti-VCAM1 treatment antagonized this effect we pulsed young mice with EdU prior to treatment with aged plasma and antibodies (Fig. 5h). As shown earlier, young mice treated with aged plasma and IgG isotype control antibody show reduced proliferation of BrdU+ cells and BrdU+Sox2+ NPCs, and this is reversed with anti-VCAM1 treatment (Fig. 5i-j). Interestingly, aged plasma also reduced survival of EdU labeled cells overall, EdU+Sox2+GFAP+ NSCs, and newly formed NeuN+EdU+ neurons while it increased the number of EdU+GFAP+ astrocytes (Fig. 5k-n). These effects of aged plasma were prevented by anti-VCAM1 treatment. Survival of immature DCX+EdU+ cells was not affected (Fig. 5l-n).
To investigate if these overall beneficial effects of VCAM1 inhibition and depletion were linked to overt changes in BBB integrity we injected young, aged VCAM1 deficient, and mice exposed to traumatic brain injury with a non-fixable 70 kDa tracer and perfused them 3h later with a fixable 2 MDa tracer. We observed no differences in dextran diffusion in the hippocampus as a result of BEC VCAM1 expression, with the caveat that non-fixable tracers may underestimate BBB permeability39 (Extended Data Fig. 7a-d). Additionally, we did not observe an age-related change in RNA expression of major tight junction (TJ) or BBB permeability genes Claudin-5 (Cldn5), Occludin (Ocln), ZO-1 (Tjp1), and Plasmalemma Vesicle Associated Protein (Plvap) at the single cell level although in bulk populations of BECs, Tjp1 or Pvlap were reduced with age (Fig. 1b; Extended Data Fig. 1e,r). Likewise, we observed no significant changes in the numbers of microglia, T cells, B Cells, neutrophils, monocytes, macrophages, and natural killer cells between young or aged mice with or without short- or long-term deletion of Vcam1 in BECs using flow cytometry (Extended Data Figs. 7e-f, 8). Expression of VLA4 did not affect this result with exception of VLA-4+ microglia which were increased in 22-month-old Cre+ mice lacking VCAM1 in BECs (Extended Fig 8c); in addition, we observed an increase in CD45+CD11b+Cd11c+IAIE+ dendritic cells in aged brains regardless of VCAM1 expression (Extended Data Fig. 8j).
To determine if the VCAM1 ligand VLA-4 is similarly involved in regulating age-related NPC activity and microglial reactivity, we treated aged wildtype mice with anti-VLA-4 antibody, which did not affect VCAM1 levels in the hippocampus (Extended Data Fig. 9a-b,d). While we observed a reduction in Iba1+CD68+ activated microglia, neural progenitor proliferation was unaffected (Extended Data Fig. 9c,e-f).
To determine if the VCAM1 increase as a result of normal aging (Fig. 1) may mediate similar negative effects on the aged brain as aged plasma does on a young brain, we treated aged male wildtype mice with anti-VCAM1 antibody (Fig. 6a). Strikingly, mice treated with anti-VCAM1 antibody for 3 weeks exhibited a general increase in BrdU+ as well as in BrdU+Sox2+ NPCs (Fig. 6b,d) and a significant reduction in the number of Iba1+CD68+ activated microglia (Fig. 6c,e). Consistent with these results, Vcam1fl/flSlco1c1-CreERT2+/− mice lacking Vcam1 long-term from 2 to 18 months showed reduced microglial activation and increased NPC proliferation (Fig. 6f-h, Extended Data Fig. 9g-h). Anti-VCAM1 antibody treatment similarly promoted NPC proliferation and reduced microglial activation in aged female mice which, like male mice, show age-related increases in levels of soluble and BEC-specific VCAM1 (Extended Data Fig. 5k-o).
Fig. 6. VCAM1 perturbation reverses age-related impairments and improves hippocampal-dependent learning and memory.

(a) Experimental design for anti-VCAM1. n=7 mice/group.
(b) Representative confocal images of BrdU and Sox2 from the experiment described in Figure 6a. Arrows indicate proliferating NPCs. The white lines outline the SGZ. Scale bar = 100 µm. n=7 mice/group.
(c) Representative confocal images of CD68, Iba1, and Hoechst from the experiment described in Figure 6a. Scale bar = 100 µm. n=7 mice/group.
(d) Quantification in the DG of BrdU and Sox2. n=7 mice/group. Two-tailed Student’s t-test. Mean +/− SEM. *p=0.0341, **p=0.0027.
(e) Quantification in the DG of CD68 and Iba1 from confocal images. n=7 mice/group. Mean +/− SEM. Two-tailed Student’s t-test. ***p=0.0005, **p=0.0026, *p=0.0354.
(f) Experimental design for conditional deletion of Vcam1 in young (2-month-old) mice followed by aging them to 18 months. n=8 mice/group.
(g) Quantification of total BrdU+ proliferating cells, and BrdU+Sox2+ neural progenitor cells in the DG of immunostained sections. n=8 mice/group. Mean +/−SEM. Two-tailed Student’s t-test. **p=0.0075, *p=0.0263.
(h) Quantification in the DG of CD68 and Iba1. Hoechst labels cell nuclei. n=8 mice/group. Mean +/−SEM. Two-tailed Student’s t-test. **p=0.0068, *p=0.0169.
(i) Days 1–5 escape latency from Barnes Maze and (j) percent time spent exploring objects in novel object placement task of IgG treated young adult C57BL6 mice (5-month-old; n=15) and IgG-treated aged mice (17-month-old; n=15) or anti-VCAM1 mAb treated aged mice (17-month-old; n=15). All mice received intraperitoneal injections every 3 days for 3 weeks prior to initiating behavior studies and throughout the duration of the studies; two-way repeated-measures ANOVA with Bonferroni’s post hoc test for time × group comparisons; One-way ANOVA with Tukey’s post hoc test for group comparisons; *p=0.0217, **p<0.01, ***p<0.001; ****p<0.0001; Mean +/− SEM.
(k) Quantification of freezing behavior in Fear Conditioning Contextual trial with 23-month-old C57BL6 mice injected with anti-VCAM1 mAb or IgG every 3 days for one month. Average of trials 3–5 shown. n=7 PBS, n=12 IgG, n= 13 anti-Vcam1−treated mice per group. **p=0.0075, *p=0.0265. One-way ANOVA with Tukey’s post hoc test for group comparisons; Mean +/− SEM.
To test if anti-VCAM1 therapy exerts cognitive benefits we treated young and aged NSG and C57BL6 mice with anti-VCAM1 antibody or IgG as a control and tested them in contextual fear conditioning, novel object recognition, and Barnes maze, established paradigms to assess age-related impairments in hippocampal-dependent learning and memory 10,11. Remarkably, aged C57BL6 mice treated with anti-VCAM1 antibody, but not with IgG, reached the escape hole in the Barnes maze with similar efficiency as young mice on the final 2 testing days, and they showed significantly increased interaction with a novel object (Fig. 6i-j). Thirteen-month-old NSG mice, which exhibit accelerated age-related cognitive decline11, showed increased interaction with a novel object (Extended Data Fig. 9i) although no significance in contextual freezing (Extended Data Fig. 9j-k) upon treatment with VCAM1 antibody for one month. Likewise, a cohort of 23-month-old C57BL6 wildtype mice, in which all mice exhibited similar baseline freezing (Extended Data Fig. 9l), demonstrated a significant increase in contextual (Fig. 6k, Extended Data Fig. 9n), but not cued (Extended Data Fig. 9m), memory following treatment with VCAM1 antibody. All in vivo experiments are summarized in Supplementary Table 4.
Discussion
Our studies uncovered a novel role for the endothelial cell adhesion molecule VCAM1 in regulating brain function with aging. Maybe most surprising and of potential therapeutic relevance, administration of VCAM1 antibody in aged mice led to increased NPC activity, reduced microglial reactivity, and improved hippocampal-dependent learning and memory (Fig. 6, Extended Data Figs. 5 and 9). Moreover, long-term genetic deletion of Vcam1 in BECs during adulthood also reduced microglial activation and resulted in increased NPC numbers in the aged hippocampus (Fig. 6d-f). Based on substantial experimental evidence we propose the following model: 1) factors in aged plasma, including TNF-α and IL-1β, induce BEC VCAM1; 2) VCAM1 facilitates tethering, but not transmigration, of leukocytes which sustain BEC inflammation; 3) inflamed and activated venous and arterial VCAM1+ BECs relay signals to the parenchyma to activate microglia, inhibit NPC activity, and impair cognition (Extended Data Fig. 10). Naturally, future work will have to refine, revise, and test other aspects of this model.
We report that VCAM1 expression on BECs, the major cell type of the BBB40, is up-regulated during normal aging or by exposure to dialyzed aged plasma. As VCAM1 is shed constitutively by ADAM1720,41, we observe a concomitant increase in sVCAM1 with aging in blood (Fig. 1). Interestingly, sVCAM1 correlated negatively with cognitive impairment and cerebrovascular dysfunction in 680 elderly participants42. Indeed, VCAM1 is not only increased with normal aging in mice43 and humans44, but as well in peripheral endothelium in atherosclerosis45, cancer46, inflammatory diseases47 and in BECs in AD48, MS49 and epilepsy15. While Elahy et al. reported no increase in VCAM1 expression in aged mice50 we detected the increase with age by immunofluorescence and by flow cytometry only after retro-orbital injection of fluorescently conjugated anti-VCAM1 antibody prior to mouse perfusion and cell processing or using scRNAseq (Figs.1,3; Extended Data Fig. 1).
The circulating factors mediating the observed pro-aging effects on the brain are unknown at this point, but because we dialyze plasma, removing most metabolites and small molecules, we think proteins are responsible for communicating many of the circulatory signals to the brain. Indeed, circulating cytokines and chemokines with detrimental effects on the brain increase in blood with advanced age8, and TNF-α, IL-1ß, and IL-4 induce expression of endothelial VCAM1 through NF-κB signaling29,30 in line with our findings (Fig. 2j). In contrast, the shed form of VCAM1 is unlikely to be a culprit because depletion of sVCAM1 from aged plasma did not affect its capacity to increase VCAM1, activate microglia, and inhibit NPC activity (Extended Data Fig. 6).
How then do increased levels of VCAM1 in BECs result in brain dysfunction with age as proposed in our model? It is possible that leukocytes expressing VLA4 bind to VCAM1 expressed on venule BECs, releasing detrimental factors towards the endothelium (as seen in atherosclerosis) and/or activating BECs via VCAM151,52. Indeed, ligand binding to VCAM1 can induce Ca++ mobilization, H2O2 production, and p38MAPK and PKCα activation leading to a concerted activation of endothelial cells51,52. While these events are necessary for transcytosis of leukocytes, aging or aged plasma, in our hands, did not result in upregulation of ICAM1, E- or P-selectin, proteins required for transcytosis. Indeed, during normal aging, leukocyte recruitment into the brain parenchyma is minimal or absent (Extended Data Fig. 7-8; refs.8,50,53). Likewise, heterochronic parabiosis studies using a GFP-expressing transgenic mouse showed no evidence of infiltrating GFP+ leukocytes in the brains of GFP-negative parabionts8. Nevertheless, our studies with systemically administered anti-VCAM1 or anti-VLA4 antibodies (Fig. 5-6, Extended Data Figs. 5, 6, 9 and Supplementary Table 4) make it reasonable to conclude that leukocytes – but not T, B, or NK cells which are absent in NSG mice – are involved in the adverse effects of aged plasma on the brain. Interestingly, anti-VLA-4 antibody did not affect NPC activity in aged mice, possibly because leukocytes could still tether to BECs through other pathways. Alternatively, progenitor proliferation in aged mice, already reduced to less than 10% compared with young mice 54, may no longer be susceptible to rescue by peripheral modulation of leukocyte binding to brain endothelium.
Lastly, in the third step of our model we propose activated VCAM1+ BECs function as relay stations of circulatory signals (or cells) communicating information as part of the neurovascular unit to surrounding glia and neurons. Intriguingly, we observe VCAM1 in only a small subset of BECs, even after LPS stimulation (Fig. 1,3 and Extended Data Figs.1, 3,8). Single cell RNAseq of isolated hippocampal BECs revealed 3 unique subpopulations in line with a recent scRNAseq study of mouse brain endothelium26: 1) Vcam1-negative capillaries expressing characteristic BBB genes related to transport and metabolism, 2) Vcam1-positive arterial BECs enriched in Notch signaling markers, and 3) Vcam1-positive venous BECs expressing inflammatory gene transcripts (Fig. 2 and Extended Data Figs.1-2). Considering even young healthy mice contain VCAM1 expressing subpopulations of BECs, we hypothesize they function as the above-mentioned relay stations and environmental sensors. In addition to the canonical roles of VCAM1 in leukocyte extravasation and inflammation in venous BECs, Vcam1-positive arterial BECs are enriched in transcripts related to Notch signaling and vascular remodeling. We speculate that the regenerative effect of Vcam1 deletion in young mice (Fig. 4) and, possibly, the perturbation of homeostasis in the SVC neural stem cell niche35,55 (see discussion below) may involve these specialized VCAM1+ arterial BECs.
Given the transcriptional profile of BECs changes drastically with age, exhibiting an overall activated, proinflammatory signature (Fig. 1) it could be expected that BBB function is different between young and old mice. Indeed, it is generally agreed that the ultrastructural composition, the activity of the neurovascular unit, and transport of various types of molecules is changed with age56 . Montagne et al. used advanced dynamic contrast-enhanced magnetic resonance imaging in living human brains and reported that the BBB deteriorates and becomes more permeable in the aged hippocampus 57. While studies focused on normal aging remain limited, Bien-Ly et al. showed that multiple mouse models of AD have limited uptake of therapeutic antibodies due to intact BBB and limited permeability 58. While fixable large and nonfixable small dextran tracers indicate no overt leakage of the BBB with aging or following genetic VCAM1 deletion in our studies (Extended Data Fig. 7a-d), we observed some age-related differences in tight junction gene expression with aging (Fig. 1b, Extended Data Fig.1e,r). In conclusion, it is possible that VCAM1 contributes to the overall regulation of BBB function with aging but additional studies involving more refined methods will be required to test this possibility.
Apart from the novel role in hippocampal aging and function we describe here, VCAM1 is required under non-pathological conditions for Type B neural stem cell anchoring to the neurogenic niche of the subventricular zone (SVZ)35 where it is highly expressed in endothelial cells of the lateral ventricles and epithelial cells of the choroid plexus35,59. Kokovay and colleagues showed that VCAM1 expression increases in the lateral ventricles as a result of increased inflammatory cytokine signaling, leading to production of reactive oxygen species (ROS) and restriction of NSC proliferation and lineage progression in the SVZ35. Intraventricular infusion of VCAM1 antibody activated Type B neural stem cells to a proliferative state35. Additionally, it was recently shown that VCAM1 expression in radial glial cells is necessary for embryonic neurogenesis and development of the SVZ neurogenic niche55. While this seems to contradict our findings, we observed, indeed, that genetic deletion of Vcam1 in young Cre+ VCAM1 floxed mice resulted in a reduction of baseline NPC activity. Thus, VCAM1 appears to have dual roles in regulating adult NPC activity, supporting a homeostatic role related to anchoring of stem cells in their niche as well as a role in aging-related inflammation which inhibits NPC activity. In other words, genetic ablation of brain endothelial and epithelial Vcam1 in young animals may reduce NPC activity due to depletion of the quiescent neural stem cell population. Increased VCAM1 with aging and inflammation, on the other hand, may reduce NPC activity by restricting NSC activation and lineage progression. Additionally, activated microglia might also be directly inhibiting NPC activity via secretion of inflammatory soluble factors60.
Methods
Animals
NOD-scid IL2Rγnull (NSG) immunodeficient mice were purchased from Jackson Laboratory (Bar Harbor, Maine). NSG mice were bred and only males used for plasma treatment studies. Heterozygous Slco1c1-CreERT2 breeding males were provided by Professor Markus Schwaninger 34. Mice were bred and crossed with Vcam1fl/fl mice (B6.129(C3)-Vcam1tm2Flv/J mice) purchased from Jackson Laboratory (Bar Harbor, Maine). Male mice were used for plasma treatment studies following treatment with tamoxifen (an estrogen modulator). Aged (greater than 12 months of age) C57BL6/J males and females were obtained from the National Institute on Aging (NIA), and young C57BL6/J males (2–4 months of age) were purchased from Jackson Laboratory and Charles River. BALB/cNctr-Npc1m1N/J 9-week-old homozygous males and females were generated by breeding heterozygous mice acquired from Jackson. 17–18-month-old male and female wildtype and Grn−/− deficient mice (B6.129S4(FVB)-Grntm1.1Far/Mmja) were bred and aged in-house but originally acquired from Jackson. These transgenic strains were bred and aged in-house. All mice lived under a 12-hour light/dark cycle in pathogenic-free conditions with open access to dry feed and water, in accordance with the Guide for Care and Use of Laboratory Animals of the National Institutes of Health. In-house aged mice health status was monitored every 2–3 months via weight and physical checks, young (2–4 months of age) mice weighed 20–30 grams and aged (greater than 12 months of age) mice weighed 40–50 grams. Mice found to have health issues were excluded from studies and assessed by the in-house Veterinary Medical Officer. All animal care and procedures complied with the Animal Welfare Act and were in accordance with institutional guidelines and approved by the V.A. Palo Alto Committee on Animal Research and the institutional administrative panel of laboratory animal care at Stanford University.
Human blood samples
Human blood samples from healthy males in the age range of 18–25 and 65–74 were anonymously donated to the Stanford Blood Center, Palo Alto. Blood was centrifuged at 1600g for 10 min at 4˚C, plasma was collected and centrifuged again at 1600g for 10 min at 4˚C. Plasma was dialyzed using cassettes (Slide-A-Lyzer Dialysis Cassettes, 3.5k MWCO, 12 ml (Fisher, PI 66110)) in 4 L phosphate buffered saline (PBS) with stir bar for 45 min at room temperature, with fresh PBS every 20 min. Cassettes were transferred to fresh 4 L PBS with stir bar for overnight dialysis at 4˚C. Plasma samples from 5 aged individuals >65 years old were pooled together for aged human plasma injections or in vitro studies. Plasma samples anonymously donated by 5 young adults <25 years old were pooled together for in vitro studies. Plasma was aliquotted to prevent more than 1 freeze-thaw and stored at −80˚C until further use.
Plasma collection, dialysis and processing
Mouse:
Approximately 500 µl of blood was drawn from the heart in 250 mM EDTA (Sigma Aldrich, CAS Number: 60-00-4) and immediately transferred to ice. Blood was centrifuged at 1000g for 10 min at 4°C with a break set to 5 or less. Plasma was collected and immediately snap frozen on dry ice and stored at −80°C until further processing. Plasma was dialyzed in 4L of 1X PBS (51226, Lonza) stirred at room temperature. Plasma was transferred to a fresh 4L of 1 X PBS after 45 min and then again 20 min later. After the second transfer, plasma was dialyzed overnight at 4°C in 4 L of stirred 1X PBS. Plasma from 7–9 mice was pooled for injections.
Human:
Donor plasma (healthy males, aged 18– 25 year or 65–74 years) was purchased from the Stanford Blood Bank. Human plasma was dialyzed as described for mouse plasma (see above). Plasma from 5 individuals of an age group was pooled for injections.
Proteomics (Human plasma, VCAM1 analysis)
Britschgi et al. measured plasma factors in cognitively normal and AD patients by multiplex assay which measured 74 cytokines, chemokines, growth factors and related proteins in plasma using bead-based multiplex immunoassays as described 9. We used the raw plasma data generated in which the low values were replaced with lowest detectable value measured in AD patients or controls, respectively (“Data 4” of the Supplementary data) and focused our analysis on subjects cognitively normal (n=118 subjects, 59 males, 59 females). The age range was between 50 and 88 with a median age of 68. We replaced QNS (quantity not sufficient) values in the dataset by NA and log10 transformed the data. To measure the strength of the relationships between age and plasma factors levels, we used R Segmented package 64,65 to calculate Spearman’s correlation coefficient. To visualize the changes of plasma factors levels with aging, mean value per decade was calculated for each plasma factors and hierarchical clustering applied.
Primary BEC isolation for bulk and single cell RNA-seq
Primary BEC isolation and quantification of CD31+VCAM1+ cells:
BEC isolation was conducted as recently described 66. Briefly, mice were anesthetized with avertin and perfused following blood collection. After thoroughly dissecting the meninges, cortices and hippocampi were collected, minced and digested using the neural dissociation kit according to kit instructions (Miltenyi, 130–092-628). Brain homogenates were filtered through 35 µm in HBSS and centrifuged pellets were resuspended in 0.9 M sucrose in HBSS followed by centrifugation for 15 min at 850xg at 4ºC in order to separate the myelin. This step was repeated for better myelin removal.
Cell pellets were eluted in FACs buffer (0.5% BSA in PBS with 2mM EDTA) and blocked for ten min with Fc preblock (CD16/CD32, BD 553141), followed by 20 minute staining with anti-CD31-APC (1:100, BD 551262), anti-CD45-FITC or anti-CD45-APC/Cy7 (1:100, BD Pharmingen Clone 30-F11 553080; Biolegend, 103116), and anti-Cd11b-BV421 (1:100, Biolegend Clone M1/70 101236). Dead cells were excluded by staining with propidium iodide solution (1:3000, Sigma, P4864). Flow cytometry data and cell sorting were acquired on an ARIA II (BD Biosciences) with FACSDiva software (BD Biosciences). FlowJo software was used for further analysis and depiction of the gating strategy. Gates are indicated by framed areas. Cells were gated on forward (FSC = size) and sideward scatter (SSC = internal structure). FSC-A and FSC-W blotting was used to discriminate single cells from cell doublets/aggregates. PI+ dead cells were excluded. CD11b+ and CD45+ cells were gated to exclude monocytes/macrophages and microglia. CD31+Cd11b-CD45- cells were defined as the BEC population and were sorted directly into RNAlater (Life Technologies, AM7020) and stored at −80ºC until further processing. If mice were injected with fluorescently labeled anti-mouse VCAM1- DyLight™488 as described above, CD45 was stained in the APC/Cy7 channel, and CD31+VCAM1+ cells were also gated in the APC and FITC channels.
Anti-VCAM1 antibody in vivo retro-orbital injections to label CD31+VCAM1+ BECs
C57BL6/J Mice:
For Gating of VCAM1+ cells: Mice were injected with Lipopolysaccharide (LPS) derived from Salmonella enterica Serotype Typhimurium (Sigma, L6511), i.p. 1 mg LPS/kg body weight at three successive time points: 0h, 6h, and 24h 67. Control mice were injected with bodyweight corresponding volumes of PBS. Experimental mice received i.p. and s.c. injections of sterile 0.9% saline with 5% glucose to ensure hydration and stable glucose levels during the procedure. Mice received a third LPS injection followed by retro-orbital injections of either 100µg fluorescently labeled (DyLight™488, Thermo Scientific, 53025) InVivoMAb anti-mouse CD106 (VCAM-1, clone M/K-2.7, Bioxell, BE0027) or fluorescently labeled Rat IgG1 Isotype antibody (Clone HRPN, Bioxell, BE0088). Two hours after the last LPS injection (26h) mouse brains were harvested for BEC isolation and flow analysis.
Healthy young (3-month-old), aged (19-month-old), or plasma injected (r.o.) young mice were similarly injected (r.o.) with fluorescently labeled anti-VCAM1 mAb and gated for flow cytometry analysis of CD31+VCAM1+ cells from cortex and hippocampi. Gates are based on positive LPS-stimulated mice injected (r.o.) with anti-VCAM1 or IgG control.
RNA Sequencing
Bulk RNAseq
Mice brain hippocampi and cortex (2 pooled brains per sample; n=6 young (3-month-old C57BL6/J males) samples or n=6 aged (19-month-old C57BL6/J males) samples were dissected using the neural dissociation kit (Miltenyi, 130–092-628) following perfusion. BECs (average 81,000 cells CD31+CD45-Cd11b- cells per pooled sample) were isolated using multi-channel flow cytometry and sorted directly into RNAlater as described above. Frozen cells were thawed to room temperature before 10 min centrifugation at 1000g. Total RNA was isolated from the cell pellets using the RNeasy Plus Micro kit (Qiagen, 74034). RNA quantities and RNA quality was assessed using the Agilent 2100 Bioanalyzer (Agilent Technologies). All samples passed a quality control threshold (RIN ≥ 8.5) to proceed to library preparations and RNAseq.
Total mRNA was transcribed into full length c-DNA using the SMART-Seq v4 Ultra Low Input RNA kit from Clontech according to the manufacturer’s instructions. Samples were validated using the Agilent 2100 Bioanalyzer and Agilent High Sensitivity DNA kit. 150 pg of full length c-DNA was processed with the Nextera XT kit from Illumina for library preparation according to the manufacturers protocol. Library quality was verified with the Agilent 2100 Bioanalyzer and the Agilent High Sensitivity DNA kit. Sequencing was carried out with Illumina HiSeq 2000, paired end, 2× 100 bp depth sequencer.
FastQC v0.11.2 was used to provide quality control checks on the raw RNAseq sequence data. STAR v2.4.2a was used to align the RNAseq reads to the mouse reference genome (mm9). Cuffdiff v2.2.1 statistical package was used to perform differential expression analysis for RNAseq based on gene and transcript abundance measurements in terms of Fragments Per Kilobase of transcript per Million mapped reads (FPKM), as previously described61. R v3.2.2 statistical package and CummeRbund v2.12.1 R/Bioconductor package were used for visualization of the various output files of the Cuffdiff differential expression analysis including visualization of the changes in gene transcripts with age. FPKM values for genes and transcripts were tabulated and Cluster v3.0 was used to perform hierarchical clustering and cluster analysis. Java TreeView v1.1.6 was used to visualize the output files from hierarchical clustering in the form of heat maps displaying up- or down- differentially regulated genes in aged versus young BECs. Gene Set Enrichment Analysis (GSEA v2.2.0) tool was used to determine whether GO and Pathway gene sets showed statistically significant, concordant differences between young and aged BECs.
Single Cell RNAseq of VCAM1 enriched BECs
4 young (3-month-old) or 4 aged (19-month-old) C57BL6/J males were injected (r.o.) with fluorescently labeled anti-VCAM1 mAb 2 hours prior to sacrifice and gated for single cell isolation of CD31+VCAM1+ cells from pooled hippocampi following perfusion. Gates are based on positive LPS-stimulated mice injected with fluorescently labeled (DL488) anti-VCAM1 mAb or IgG-DL488 control antibody.
Four hippocampi (from both hemispheres) were pooled together from 4 young (3-month-old) or 4 aged (19-month-old) C57BL6/J males and sorted into lysis buffer in 96-well plates then snap frozen and stored at −80 degrees Celsius until RNA extraction and library preparation. Two, 96-well plates per group contained BECs that were 50% enriched for VCAM1 high expression based on flow cytometry gating; unbiased CD31+ cells were also collected into two, 96-well plates per group.
cDNA synthesis, library preparation and sequencing
Cell lysis, and cDNA synthesis was performed using the Smart-seq-2 protocol as described previously 68,69, with some modifications. After cDNA amplification (23 cycles), cDNA concentrations were determined via capillary electrophoresis and cells were cherry-picked to improve quality and cost of sequencing. Cell selection was done through custom scripts and simultaneously normalizes cDNA concentrations to ~0.2 ng/uL per sample, using the TPPLabtech Mosquito HTS and Mantis (Formulatrix) robotic platforms. Libraries were prepared using the Illumina Nextera XT kits following the manufacturer’s instructions. Libraries were then sequenced on the Nextseq (Illumina) using 2 × 75bp paired-end reads and 2 × 8bp index reads with a 200 cycle kit (Illumina, 20012861) and pooled using the Mosquito liquid handler. Library quality was assessed via capillary electrophoresis on a Fragment Analyzer (AATI) and quantified by qPCR. Samples were sequenced at an average of 700,000 reads per cell.
Bioinformatics pipeline
Sequences from the Nextseq were demultiplexed using bcl2fastq, and reads were aligned to the mm10 genome augmented with ERCC sequences, using STAR version 2.5.2b. Gene counts were made using HTSEQ version 0.6.1p1. We applied standard algorithms for cell filtration, feature selection, and dimensional reduction. First, genes appearing in fewer than 3 cells, cells with fewer than 300 genes, and cells with less than 50 000 reads were excluded from the analysis. Out of these cells, those with more than 30% of reads as ERCC, and more than 5% mitochondrial or 3% ribosomal were also excluded. Counts were log-normalized (log(1+counts per N)), then scaled via linear regression against the number of reads, the percent mapping to ribosomal genes, and percent mapping to mitochondrial genes. To select for relevant features, genes were first filtered to a set of 3000 with the highest positive and negative pairwise correlations. Genes were then projected into low dimensional principal component space using the robust principal component analysis (rPCA). Single cell PC scores and genes loads for the first 20 PCs were analyzed using the Seurat package in R. Briefly, a shared-nearest-neighbor graph was constructed based on the Euclidean distance metric in PC space, and cells were clustered using the Louvain method. Cells and clusters were then visualized using 3-D t-distributed Stochastic Neighbor embedding on the same distance metric. Differential gene expression analysis was done by applying the Mann-Whitney U-test of the BEC clusters obtained using unsupervised clustering. P-values were adjusted via the false discovery rate (FDR) or Bonferroni. All graphs and analyses were generated and performed in R.
GeneAnalytics and GeneCards- packages offered by Gene Set Enrichment Analysis (GSEA) tool was used for GO pathway analysis and classification of enriched genes in each subpopulation.
Cell Culture
For all studies, Bend.3 cells (gift of the Butcher Lab; purchased from America Type Culture Collection) were used. Bend.3 cells are immortalized brain endothelial cells isolated from BALB/C mice (CRL-2299, ATCC) 70. These cells were seeded at 40,000 cells/cm2 in MCDB 131 HUVEC medium (10372019, Life Technologies) supplemented with the following: 15% endotoxin-free fetal bovine serum (SH30071, GE Healthcare Life Sciences), 1% sodium pyruvate (11360070, Life Technologies), 1% heparin (H4784, Sigma Aldrich), 1% pen-strep (1786396, Life Technologies), 1% non-essential amino acids (11140050, Life Technologies), 1% l-glutamine (2 mM, Fisher Scientific, glutamax supplement, 35050061), and 1% 100 mg/mL sodium bicarbonate (S5761, Sigma Aldrich). To confirm cell morphology and tight- and adherens-junctions we stained with β-catenin (Millipore, 05–665), Claudin-5 (Thermofisher Scientific, 34–1600), and VE-Cadherin (Santa Cruz Biotechnology, sc-6458) after fixation in cold methanol for 10 min followed by 3 PBS washes and 1 h incubation in TBS++. Cells were maintained in a humidified 5% CO2 incubator at 37°C. Cells at low density were fed with fresh medium every other day; cells at high density were fed every day. Cells were split 1:2 or 1:3 at ≥80% confluency.
Primary BEC cultivation was based on a previously described procedure 71. For primary BEC cultivation, cells were resuspended in endothelial cell growth medium (20% FBS, 2mM L-glutamine, 2mM penicillin-streptomycin, 1x MEM non-essential amino acids, 0.1mg/ml heparin, 1mM sodium pyruvate, 1mg/ml sodium hydrogen carbonate, 0.05mg/ml ECGS in MCDB-131) and seeded on 1mg/ml rat tail collagen (BD Biosciences, 354236) coated tissue culture plates. After 24h, 4µg/ml puromycin (Santa Cruz, sc-108071A) was added for 48h to remove potentially contaminating cells 72.
In vitro cytokine treatment and flow cytometry analysis
Bend.3 cells plated in 6-well plates (seeded at 400,000 cells/well) were serum starved for 1 h followed by 16 h overnight treatment with recombinant TNFα (10 ng/ml), IL-1β (10 ng/ml), or IL-6 (30 ng/ml). After overnight treatment, medium was aspirated and cells were washed once with PBS. Cells were detached with 700 μl of accutase (A1110501, Life Technologies) for 5 min and the reaction was stopped by resuspending cells in 2 mL PBS. Cells were centrifuged for 5 min at 300 rcf, medium was aspirated. After centrifugation, cells were resuspended in PBS for one wash followed by 30 min blocking in FACS buffer (DPBS + 1 g/L glucose + 30 mM sodium pyruvate + 2% BSA with 2mM EDTA). Following centrifugation, cells were resuspended in 100 μl/sample of FACS buffer. FC blocking antibody (553142, BD Pharmigen) was added for 10 mins followed by addition of each antibody (1:50). Samples were incubated in antibodies for 30 min—1 h with shaking at room temperature, covered from light. After one wash with FACS buffer, cells were resuspended in 500 μl FACS buffer and transferred to flow tubes for analysis. Bend.3 cells are stained using a conjugated anti-CD31 antibody (CD31-APC) (551262, BD Pharmigen), an anti-VCAM1 antibody (BE0027, BioXcell) fluorescently conjugated using Dylight 488 Conjugation Kit according to manual instructions (53024, Thermo Scientific). FSC-A and FSC-W blotting was used to discriminate single cells from cell doublets/aggregates. PI+ dead cells were excluded. Cells were gated based on CD31+ and VCAM1+ staining compared to n-1 control stains and IgG isotype control staining.
In vitro VCAM1 analysis following plasma administration
Immunofluorescence analysis
Bend.3 cells or primary BECs were seeded in 8-well chamber slides (154534, Thermo Scientific) overnight with 40,000 cells/cm2. The cells were serum starved for 1 h via incubation in DMEM with no added supplements (11965–092, Gibco), followed by treatment in DMEM with 10% pooled and dialyzed young (25 years or younger) or aged (65 years or older) human plasma (Bend.3 cells) or young (3-month-old) or aged (19-month-old) mouse plasma-derived serum (primary BECs and Bend.3 cells) for 16 h. Plasma was warmed to 37°C and filtered through 22 µm filter prior to being added to cells. The following day, cells were fixed in cold 4% PFA for 10 min, followed by three 5 min PBS washes and 1 h blocking in TBS with 3% donkey serum and .25% triton X-100 (TBS++). Cells were blocked in TBS++ and primary antibody (1:250) overnight: anti-VCAM1 (ab19569, abcam) and anti-VE-Cadherin (sc-6458, Santa Cruz Biotechnology). Cells were blocked in TBS++ and secondary antibody (1:250) for 45 min the next day (Alexa Fluor 488: A10266, Life Technologies; Alexa Fluor 647: A10277, Life Technologies).
TNF-α dosage response
Bend.3 cells were seeded overnight as described above, serum starved for 1 h before being cultured for 24 h in varying concentrations of TNFα (5ng/mL-156.25 pg/mL) in DMEM, followed by staining with CD31 and VCAM1 antibodies and flow cytometry analysis.
In vitro flow cytometry analysis:
Bend.3 cells were serum starved for 1 h followed by 16 h overnight treatment with 10% young or aged mouse or human plasma-derived serum, as described above for in vitro VCAM1 analysis. After overnight treatment with plasma, medium was aspirated and cells were washed once with PBS. Cells were detached with 700 µl of accutase (A1110501, Life Technologies) for 5 min and the reaction was stopped by resuspending cells in 2 mL PBS. Cells were centrifuged for 5 min at 1100 rpm, medium was aspirated, and cells were resuspended in 1 mL/well of PBS with 4% PFA (diluted with 8 mL of PBS) and fixed on ice for 10 min. After centrifugation at 1100 rpm for 5 min, cells were resuspended in PBS for one wash followed by 30 min blocking in FACS buffer (PBS + 2% BSA with 2mM EDTA). Following centrifugation, cells were resuspended in 100 µl/sample of FACS buffer. FC blocking antibody (553142, BD Pharmigen) was added for 10 mins followed by addition of each antibody. Samples were incubated in antibodies for 30 min—1 h on ice. After two washes with FACS buffer, cells were resuspended in 500 µl FACS buffer and transferred to flow tubes for analysis. Bend.3 cells are stained using a conjugated anti-CD31 antibody (CD31-APC) (551262, BD Pharmigen), an anti-VCAM1 antibody (BE0027, BioXcell) conjugated using Dylight 488 Conjugation Kit according to manual instructions (53024, Thermo Scientific), and rat anti-mouse E-Selectin-DL405 (clone RB40.34, gift of the Butcher lab). Plasma treated Bend.3 cells were also stained with anti-CD31-PE/Cy7 (102418, Biolegend), anti-ICAM1-DL594 (clone YN1/1.7.4, gift of the Butcher lab), and anti-P-selectin-DL405 (clone 10E9.6, gift of the Butcher lab). Cells were gated on forward (FSC = size) and sideward scatter (SSC = internal structure). FSC-A and FSC-W blotting was used to discriminate single cells from cell doublets/aggregates. PI+ dead cells were excluded. CD31+ cells were defined as BECs.
In Vivo Mouse Studies
Parabiosis
Isochronic and heterochronic parabiosis was performed as described 8. In brief, mirror-image incisions through the skin were made on the left and right flanks of mice and shorter incisions were made through the abdominal wall. Parabionts were sutured together at their adjacent peritoneal openings. The parabionts’ elbow and knee joints were also sutured together and the skin of each mouse was stapled together. For 1 week during recovery post-surgery, each parabiont mouse received daily subcutaneous injections of Baytril antibiotic solution (5 micrograms per gram of body weight in saline to give a volume of approximately 1% of weight of each mouse) and Buprenorphine (0.1 milligram per milliliter, 0.05 mg/kg) as well as physiological saline (0.9%) for pain relief, prevention of infection and hydration and were monitored regularly.
In vivo Cytokine injections
Low-dose cytokine injection paradigm:
Young (2.5-month-old) C57BL6 littermates were injected every other day (0.08 mg/kg r.o.) with recombinant pro-inflammatory cytokines (TNFα, IL-1β, IL-6) for 5 days (n=4 mice/group for 6 groups). Mice received BrdU (100 mg/kg, i.p.) twice daily beginning on the 5th day after the start of cytokine treatment. On the 6th day, mice were pulsed with the last BrdU and cytokine injections. All mice were also injected (r.o.) with 0.05 mg of fluorescently labeled (DyLight™488, Thermo Scientific, 53025) rat anti-mouse VCAM-1 (clone M/K-2.7, Bioxell, BE0027) prior to perfusion. Two hours after the final injections, mice were anesthetized with avertin followed by PBS perfusion.
High-dose acute cytokine paradigm:
Young (2.5-month-old) C57BL6 littermates were injected (0.4 mg/kg r.o.) with TNFα, IL-1β, or PBS control (n=3–4 mice/group for 4 groups). Mice were injected (r.o.) with 0.05 mg of fluorescently labeled (DyLight™488, Thermo Scientific, 53025) rat anti-mouse VCAM-1 (clone M/K-2.7, Bioxell, BE0027) approximately 16 hours later. Two hours after antibody injections, mice were anesthetized with avertin followed by PBS perfusion.
| Reagent or Resource | Source (Company) | Identifier (Catalog #) |
Identifier Lot # |
|---|---|---|---|
| Cytokines | |||
| Recombinant Mouse TNF-α | Peprotech | 315-01A | 061454-1 |
| Recombinant Mouse IL-1β/IF-1F2 | Peprotech | 211-11B | 100947 |
| Recombinant Mouse IL-6 | Peprotech | 216-16 | 031750 |
Plasma injections and antibody treatments
C57BL6/J mice
Plasma injections in young mice
Young (3-month-old) C57BL6/J male mice were treated with 7 injections of young (3-month) or aged (18-month) dialyzed and pooled mouse plasma (150 uL, r.o.), coming from 8–10 mice per pooled plasma sample. Mice were treated acutely over 4 days, with 2 injections per day spaced 10–12 hours apart. On day 3 during both morning and evening injections and the morning of day 4, mice were pulsed with BrdU to label proliferating cells (100 mg/kg, i.p.; B5002–5G, Sigma Aldrich). Mice received a 7th plasma injection along with BrdU on day 4 followed by perfusion 3 hours after the last injection.
Aged mice treated with anti-VCAM1 or anti-VLA-4 monoclonal antibody
Aged (16-month-old) C57BL6/J mice received i.p. injections of anti-VCAM1 mAb anti-VCAM1 antibody (BE0027, BioXcell) or IgG isotype control (9 mg/kg) every 3 days for a total of 7 injections. Mice also received BrdU daily (100 mg/kg i.p.) for the last 6 days prior to perfusion 24 hours after the last BrdU injection and 48 hours after the last antibody injection.
Similarly, aged (16-month-old) C57BL6/J mice received i.p. injections of anti-VLA-4 mAb (BE0071, BioXCell) or IgG isotype control (9 mg/kg) every 3 days for a total of 7 injections. Mice also received BrdU daily (100 mg/kg i.p.) for the last 6 days prior to perfusion 24 hours after the last BrdU injection and 48 hours after the last antibody injection.
Young mice treated with anti-VCAM1 monoclonal antibody and aged plasma injections
Young (3-month-old) C57BL6/J male mice were treated with 9 injections of aged (18-month) dialyzed and pooled mouse plasma (150 uL, r.o.), coming from 8–10 mice per pooled plasma sample. Mice also received i.p. injections of anti-VCAM1 mAb or IgG isotype control (9 mg/kg) every 3 days for a total of 9 injections. Mice were injected with PBS as a baseline control. Prior to the start of the experiment, mice received daily EdU (Invitrogen, E10415) injections (100 mg/kg, i.p.) for 4 days to label newly born surviving cells. Mice were treated over 4 weeks, with 1 injection every 3rd day for a total of 9 injections. Starting on day 23 post first injection of plasma and antibody, mice received daily injections of BrdU (100 mg/kg, i.p.; B5002–5G, Sigma Aldrich) to label proliferating cells for 4 days followed by perfusion 24 hours after the last BrdU injection.
EAE was induced in young wildtype C57BL6/J (4-month-old) female mice as previously reported 73.
NSG mice plasma treatments
Long-term plasma treatment:
NSG mice received PBS or pooled aged human plasma (AHP, >65 years, dialyzed plasma from 5 individuals pooled, 150 uL/injection, r.o) every 3 days for 3 weeks, totaling 7 injections. They also received daily EdU injections (150 mg/kg, i.p.) for 3 days, beginning two weeks after plasma treatment, followed by daily BrdU injections (150 mg/kg, i.p.) beginning on day 18 for 3 days followed by perfusion. n= 6–7 mice/group.
Acute Plasma treatment:
NSG mice received PBS or pooled aged human plasma (AHP, >65 years, dialyzed plasma from 5 individuals pooled, 150 uL/injection, r.o) twice daily in morning and evenings 10–12 hours apart for 7 total injections. They also received EdU (150 mg/kg, i.p.) 16 hours and 4 hours before perfusion. n=5 mice/group
Acute plasma paradigm with anti-VCAM1:
3-month-old NSG mice received rat anti-mouse VCAM1 mAb or rat IgG isotype control (9 mg/kg i.p.) on day 0 and day 3. Mice were given r.o. injections (150 µl) of aged human plasma (AHP, >65 years, pooled from 5 individuals) or PBS as control twice daily for 7 total injections. Mice were pulsed with EdU (100 mg/kg, i.p.) 16 hours and 2 hours before perfusion to label proliferating cells.
Longterm plasma paradigm with anti-VCAM1:
NSG mice received pooled aged human plasma (AHP, >65 years) injections (150 uL, r.o.) every 3 days for 7 total injections. In addition, mice received i.p. injections of a anti-VCAM1 blocking mAb or IgG isotype control (9 mg/kg) every 3 days for a total of 7 injections. They also received daily BrdU injections (150 mg/kg, i.p.) for 4 days beginning on day 16.
Depletion of sVCAM1:
Soluble VCAM1 (sVCAM1) was immunoprecipitated from pooled aged human plasma (65–74 years of age, n=5) using superparamagnetic microbeads conjugated to a mouse anti-human-VCAM1 antibody (BBA5, Novus Biologicals) (or monoclonal mouse anti-human IgG antibody (MAB002, R&D Systems) as a control). In order to first conjugate the dynabeads to the anti-IgG or anti-VCAM1 antibodies, 500 µl of (0.5 mg/ml) antibody was added to 25 mg of dynabeads and incubated on a rotator overnight at 37°C and prepared according to manual instructions (14311D, Thermo Scientific]. The following day, 8 mg of conjugated VCAM1 mAb bound to dynabeads (or equal amount of IgG mAb bound to dynabeads) were added to aliquots of 0.5 mL of dialyzed pooled human plasma and incubated at 4C rotating overnight. Depleted plasma was collected the next day and magnetic VCAM1 saturated dynabeads were removed using a magnetic bar through serial transfers of the plasma to new tubes, and stored at −80°C until mouse treatment.
NSG mouse VCAM1-depleted plasma treatment:
Following pull-down of sVCAM1, pooled, depleted aged human plasma (IgG versus sVCAM1 depleted) or saline (200 µl/mouse) was injected retro-orbitally (r.o.) into young (4-month-old) NSG mice (n=7–8 mice/group) twice daily for 4 days for 7 total injections. Mice were also injected with BrdU (100 mg/kg, i.p.) starting on the third day. Mice were anesthetized with avertin followed by saline perfusion on the 4th day of treatment, 4 hours after the 3rd BrdU and 7th plasma injections. One mouse per group received intra-orbital injections of 100 µg fluorescently labeled (DyLight™488, Thermo Scientific, 53025) InVivoMAb anti-mouse CD106 (VCAM-1, clone M/K-2.7, Bioxell, BE0027) and fluorescently labeled (DyLight™550, Thermo Scientific, 84530) rat anti-mouse MECA-99 (gift of the Butcher lab) 3 hours prior to perfusion.
Slc01c1CreERT2+/−; VCAM1fl/fl (Cre+) or Slc01c1CreERT2−/−; Vcam1fl/fl (Cre-) mice experiments
LPS-treated Slco1c1CreERT2+/−; Vcam1fl/fl mice
Young (4-month-old) Vcam1fl/fl Slco1c1-CreERT2+/− mice (Cre+) received tamoxifen (100 mg/kg; i.p.) once daily for 5 days. After a 3-day resting period, mice were treated with LPS at 0, 2, and 24-hour time points (0.5 mg/kg, i.p.) and fluorescently labeled anti-VCAM1 mAb (100µg, r.o.) 2 hours prior to cell isolation and flow cytometry analysis.
BEC isolation was based on a recentlly described procedure 74. Briefly, mice were sacrificed using carbon dioxide asphyxiation followed by cervical dislocation. Mouse brains were carefully removed from the scull and stored on ice in Buffer A (153mM NaCl, 5.6mM KCl, 1.7mM CaCl2, 1.2mM MgCl2, 15mM HEPES; 10mg/ml bovine serum albumin (BSA) fraction V). After thoroughly dissecting the meninges, cortices and hippocampi were collected and washed several times in Buffer A before the tissues was minced and centrifuged at 300g for 7min at 4°C. The pellet was digested in a 1:1:1 volume mix of tissue, Buffer A, and 0.75% collagenase II (Millipore, C2–22) at 37°C for 50min. The tissue was homogenized by thorough shaking after 25 and 50min of digestion and repetitive up and down pipetting of the cell solution at the end of digestion. The enzymatic reaction was stopped by adding Buffer A. After centrifugation (300g, 7 min, 4°C) the pellet was carefully resuspended in PBS containing 25% BSA (Fisher Scientific, BP1600–1) and centrifuged at 1000g, 30min at 4°C in order to separate the myelin and to enrich for capillary fragments. To deplete for red blood cells the pellet was incubated in Red Blood Cell Lysis Buffer (Sigma, R7757) for 1.5min at room temperature with occasional shaking, followed by a wash step in buffer A and centrifugation (300g, 7 min, 4°C). For the second digestion, the pellet was resuspended in buffer A containing 1mg/ml Collagenase/Dispase (Roche, 11097113001) and the mixture was incubated at 37°C for 13min. 1μg/ml DNase I (Sigma, 10104159001) was added for 2 additional minutes. To quench the reaction buffer A was added and cells were centrifuged at 300g for 7min at 4°C.
For flow cytometry, the enriched BECs were labeled by standard protocols with fluorochrome-conjugated antibodies (identified in antibodies section) in HBSS (Thermo Fisher) containing 10% FBS for 30min on ice. Dead cells were excluded by staining with propidium iodide solution (1:3000, Sigma, P4864). Background fluorescence was determined by the ‘fluorescence-minus-one’ method and for VCAM1 a specific IgG1 Isotype control antibody was used. Flow cytometry data were acquired on an ARIA II (BD Biosciences) with FACSDiva software (BD Biosciences). FlowJo software (TreeStar) was used for further analysis.
Cells were gated on forward (FSC = size) and sideward scatter (SSC = internal structure). FSC-A and FSC-W blotting was used to discriminate single cells from cell doublets/aggregates. PI uptake indicated dead cells, which were excluded. CD11a/b, CD45, and, Ter-119 negative cells were gated to exclude erythrocytes, monocytes/macrophages and microglia. CD13 and ACSA-2 staining was applied to exclude pericytes and astrocytes, respectively. CD31+MECA99+ cells were defined as the BEC population.
Basal NPC activity:
Young (4-month-old) heterozygous Vcam1fl/fl Slco1c1-CreERT2+/− mice (Cre+) or CreERT2−/− (Cre-) littermates were injected once daily with tamoxifen (Sigma, T5648, prepared in sunflower seed oil (20 mg/mL solution; 100 mg/kg i.p.) for 4 consecutive days, followed by 2 weeks of rest. Mice received BrdU (100 mg/kg, i.p.) once daily for 4 days. Mice were anesthetized with avertin (tribromoethanol; 0.018 ml (2.5%) per gram of body weight), followed by saline perfusion 24 hours after the final BrdU injections. n= 6–7 mice/group.
In a separate study, young (2-month-old) heterozygous Vcam1fl/fl Slco1c1-CreERT2+/− mice (Cre+) or CreERT2−/− (Cre-) littermates were injected once daily with tamoxifen (Sigma, T5648, prepared in sunflower seed oil (20 mg/mL solution; 100 mg/kg i.p.) for 4 consecutive days, followed by 16 months of aging. Mice received BrdU (100 mg/kg, i.p.) once daily for 5 days at 18-months of age. Mice were anesthetized with avertin (tribromoethanol; 0.018 ml (2.5%) per gram of body weight), followed by saline perfusion 24 hours after the final BrdU injections. n= 7–8 mice/group.
Acute paradigm:
Young (4-month-old) heterozygous Vcam1fl/fl Slco1c1-CreERT2+/− mice (Cre+) and littermates controls lacking a copy of CreERT2 (Cre-) were injected once daily with tamoxifen (100 kg/mg), prepared in sunflower seed oil (20 mg/mL solution) intraperitoneally (i.p.) for 4 consecutive days. After a 3-day resting period, mice were treated acutely over 4 days with young plasma (3-month-old C57BL6/J pooled male plasma, 8–10 mice pooled per sample) or aged plasma (18-month-old C57BL6/J pooled mouse plasma, 8–10 mice pooled per sample) (150 uL, r.o.), with 2 injections per day spaced 10–12 hours apart. On day 3 during both morning and evening injections and the morning of day 4, mice were pulsed with BrdU (100 mg/kg, i.p.) to label proliferating cells. Mice received a 7th plasma injection along with a 3rd BrdU injection on day 4 followed by perfusion 3 hours after the last injection. One mouse per group received a single retro-orbital injection of 100µg fluorescently labeled (DyLight™488, Thermo Scientific, 53025) InVivoMAb anti-mouse CD106 (VCAM-1, clone M/K-2.7, Bioxell, BE0027) and fluorescently labeled (DyLight™550, Thermo Scientific, 84530) rat anti-mouse MECA-99 (gift of the Butcher lab) 3 hours prior to perfusion.
Long term paradigm:
Young (4-month-old) heterozygous Vcam1fl/fl Slco1c1-CreERT2+/− mice (Cre+) or Cre ERT2−/− (Cre-) littermates were injected with tamoxifen (100 mg/kg i.p.) for 4 consecutive days, followed by 12 days of rest. Young or aged pooled mouse plasma (YMP/AMP) (150 uL, r.o.) was injected once every 3 days for 7 total injections. Mice received BrdU (100 mg/kg, i.p.) for 5 consecutive days beginning on 15th day after the start of plasma treatment. Mice were perfused 24 hours after the last BrdU and plasma injection. n=8 mice/group for 4 groups. One mouse per group received r.o. injections of 100µg fluorescently labeled (DyLight™488, Thermo Scientific, 53025) rat anti-mouse VCAM-1 (clone M/K-2.7, Bioxell, BE0027) and fluorescently labeled (DyLight™550, Thermo Scientific, 84530) rat anti-mouse MECA-99 (gift of the Butcher lab) 3 hours prior to perfusion. Mice were anesthetized with avertin followed by saline perfusion 16 hours after the final BrdU injections.
Blood Brain Barrier Permeability
Aged (17-month-old) Vcam1fl/fl Slco1c1-CreERT2+/− mice (Cre+) or CreERT2−/− (Cre-) littermates were injected once daily with tamoxifen (Sigma, T5648, prepared in sunflower seed oil (20 mg/mL solution; 100 mg/kg i.p.) for 4 consecutive days, followed by 2 months of rest. Mice were used to assess BBB permeability and to phenotype brain-resident leukocytes.
For control, aged C57BL6 mice underwent mild traumautic brain injury in the cortical region, which has been shown to induce neuroinflammation and damage to the BBB, as previously described 75.
Young (5-month-old) Cre− mice (n=4), aged Cre− and Cre+ (19-month-old) mice (administered tamoxifen 2 months prior) (n=5/group), and control aged (17-month-old) mice that underwent TBI (n=2) were injected (r.o.) with 200 uL of 25 mg/mL Texas-Red labeled 70kDa dextran (ThermoFisher Cat #: D1830) to probe endogenous Blood Brain Barrier Breakdown76. Injections were staggered to ensure PBS perfusions of each mouse 3 hours post injection for optimal brain uptake 77. Mice were anesthetized by avertin and slowly perfused with 40 mL of cold PBS before an additional 10 mL of 5 mg/mL FITC labeled 2 MDa dextran (Sigma-Aldrich Cat #: FD2000S) to probe large BBB breaks. Right hemisphere was fixed in 4% PFA for immunostaining and left hemisphere was frozen at −80C for tissue homogenate analysis until further processing.
The left hemisphere was thawed and suspended in 300 uL of a custom Lysis Buffer (200 mM Tris, 4% CHAPS, 1M NaCl, 8M Urea, pH 8.0). Tissues were then homogenized using a Branson Digital Sonifier sonicator set to 20% amplitude for 3 seconds, allowed to rest for 30 seconds on ice, and repeated 3 times. Samples were centrifuged at 14,000g for 20 minutes at 4C, and supernatant was extracted for analysis. Fluorescence for FITC and Texas Red were measured using a ThermoFisher Varioskan Flash microplate reader. Fluorescence signal was standardized to quantity of protein per sample using a Pierce BCA Protein Assay (ThermoFisher Cat #:23227).
The right hemisphere was fixed in 4% PFA for 72 hours, sunk in 30% sucrose cryoprotectant, and sectioned at 40 um using a Leica SM 2010R microtome. Hippocampi images were captured using a Zeiss LSM880 confocal, Z-stacked with 9 slices at 2 um intervals; Mean Fluorescence Intensity was measured using ImageJ (1.51q build) software.
Flow Cytometry analysis of Brain-resident immune cells
Mice analyzed were: Young (3-month-old) C57BL6/J mice (n=5), aged Cre− (n=9) and Cre+ (n=4) 19-month-old mice administered tamoxifen at 17 months as described above in BBB Permeability section, and aged Cre+ (22-month-old) mice administered tamoxifen at 2 months of age as described in section: Basal NPC activity (n=4).
Gates are based on positive LPS-stimulated, Cre− aged mice injected with a fluorescently labeled (DL488) anti-VCAM1 mAb or IgG-DL488 control antibody 2 hours prior to perfusion and analysis by flow cytometry. An aged (19-month-old) Cre + littermate administered tamoxifen at 17 months as described above in BBB Permeability section was also injected with a fluorescently labeled (DL488) anti-VCAM1 mAb to confirm successful deletion of Vcam1 in the hippocampus and cortex.
Mice analyzed were anesthetized by avertin and perfused with 20 mL of cold Medium A (500 ml HBSS, 7.5 mL 1M HEPES, 5.56 mL 45% Glucose. Sterile filtered) for mechanical dissociation of cortex and hippocampus. Tissue was collected and chopped in 2 mL cold Medium A with 80 uL DNase1 then homogenized with a glass douncer. Homogenate was passed through a 100 um cell strainer, washed 3 times with medium A to remove clumps, and centrifuged at 340g for 7 minutes at 4C. The supernatant was removed and the pellet was resuspended in 12 mL of 25% Percoll Plus diluted in Medium A (GE Healthcare Cat #: 17–5445-01) then centrifuged at 950g for 20 minutes. The supernatant was discarded and the remaining cell pellet was washed with 5 mL of Medium A and centrifuged at 340g for 7 minutes at 4C to remove myelin.
The myelin free cell samples were then resuspended in 1 mL FACs buffer (PBS + 1% BSA with 2mM EDTA), transferred to new 2 mL eppendorf tubes and centrifuged at 300g for 5 min at 4C. Cells were resuspended in 300 uL of FC block solution (1: 100 CD16/CD32, BD Cat #: 553141) and allowed to incubate on a shaker for 5 minutes at room temperature. After blocking, primary antibodies against Ly6C, Ly6G, Tmem119, Alpha4, Beta 1 (VLA-4), CD45, CD11c, IA/IE, CD14, CD19, CD3, CD11b, CD206 were added to the samples and allowed to incubate 15 minutes. FACs buffer was added to the samples to a final volume of 1 mL and centrifuged at 400g for 5 minutes. Samples were then incubated in 300 uL solution of secondary antibodies, Streptavidin and Alexa Fluor for 15 minutes. FACs buffer was added to the samples to a final volume of 1 mL and centrifuged at 400g for 5 minutes. Samples were washed with 1 mL FACs buffer and stained with a viability dye (Bioscience Fixable Viability Dye eFluor 506 from thermofisher, 65–0866-14). Samples were then washed in 1mL FACs buffer, centrifuged then resuspended in 500 uL of FACs Buffer and filtered through a 40 um cell strainer cap into round-bottom tubes for flow cytometry analysis (Falcon Cat #: 32235).
Antibodies for Immune cell profiling with Flow Cytometry
| Markers: | Catalog Number | |
|---|---|---|
| Ly6C | FITC (1:200) | Biolegend 128021 |
| Tmem119 | AlexaFluor647 (1:400) | Abcam ab209064 |
| Ly6G | APC-Cy7 (1:200) | Biolegend 127623 |
| Alpha4 | PE (1:100) | GeneTex GTX74788 |
| CD45 | Pac Blue (1:100) | Biolegend 103126 |
| Beta1 | PECy7 (1:100) | eBioscience 25-0291-80 |
| CD11c | BV711 (1:200) | Biolegend 117349 |
| IA/IE | AF700 (1:100) | Biolegend 107621 |
| CD14 | PerCP/Cy5.5 (1:100) | Biolegend 123313 |
| CD19 | BV605 (1:100) | Biolegend 115539 |
| CD3 | BV786 (1:100) | BD Biosciences 564010 |
| CD11b | BV650 (1:100) | Biolegend 740551 |
| CD206 | biotin antibody; streptavidin BUV395. (1:100 BD 564176) | Biolegend 141713 |
| Markers for Compensations | Catalog Number |
|---|---|
| CD45-FITC | BD Biosciences, 553080 |
| CD45-APC | Biolegend 103112 |
| CD11b-ApcCy7 | BD Biosciences 557657 |
| CD11b-PE | eBioscience 12-0112-82 |
| CD45-PacBlue | Biolegend 103126 |
| CD11b-PeCy7 | Biolegend 101215 |
| CD11b-BV7ll | Biolegend 101241 |
| CD11b-AF700 | Biolegend 101222 |
| CD11b-PerCP-Cy5.5 | Biolegend 101227 |
| CD11b-BV605 | Biolegend 101237 |
| CD11b-BV785 | Biolegend 101243 |
| CD11b-BV650 | Biolegend 740551 |
| CD11b-Biotin | Biolegend 101203 |
Behavior Testing
Anti-VCAM1 dosing paradigm
Aged (17-month-old) or adult (5-month-old) C57BL6/J male mice were injected with anti-VCAM1 mAb (BioXCell cat # BE0027) or IgG isotype control (BioXCell cat # BE0088), 9 mg/kg i.p. every 3 days for a total of 8 injections over a 3 week period. Behavioral testing began at the start of week 4, and antibody injections continued every 3 days throughout the testing period.
13-month-old NSG mice (n=11 mice per group) were injected with anti-VCAM1 mAb or IgG1 isotype control (9 mg/kg i.p) every 3 days for nine injections over 4 weeks. Behavior experiments were performed between 7th and 9th injection of antibodies during the last week.
23-month-old C57BL6 males (“WT”) were treated with anti-VCAM1 (n=13), IgG (n=12), PBS (n=7). They each received 10 i.p. injections (9 mg/kg) of antibody every 3 days for 4 weeks. Behavior experiments were performed between 8th and 10th injection of antibodies.
Behavior testing was performed in a controlled environment as previously described78,79. Tests were performed in groups of 4 mice at a time with even lighting conditions (30 ± 5 lumens). All trials were recorded using a ceiling mounted camera and Topscan Version 2.00 Software. All equipment was thoroughly cleaned using 70% Ethanol between trials.
Novel Object Recognition-Extended Data Fig. 9:
The novel object recognition (NOR) test was performed in a large acrylic cube measuring 45 cm (17.75 in) tall by 44.5 cm (17.5 in) wide with a light cerulean bottom. On Day 1 of NOR, the mice were allowed to habituate to the testing environment for 5 mins. Two objects, either a Black Cat/Taby Cat or Gray Cat/Orange Dog (Silicon toys measuring 5.1 cm (2 in) tall by 3.2 cm (1.25 in) wide), were placed along one wall of the cubic field 5.1 cm (2 in) away from the corners. The mice were placed inside the cubic field facing away from the objects and allowed 15 mins to explore and interact with the objects. On day 2 of NOR, one of the two objects in each field, Taby Cat and Orange Dog, was replaced by a novel object, Orange Tiger and Yellow Lion, respectively; while the 2nd object (Black Cat and Gray Cat) was kept constant from Day 1. The mice were placed inside the field facing away from the objects and allowed 15 mins to explore and interact with the objects. Object interaction was defined as close investigation within 1 cm of the object. Novel Object interaction % is calculated using (Time interaction with Novel Object × 100)/(Time interaction with Sample Object + Time interaction with Novel Object) from Day 2. Sample Object interaction % is calculated using (Time interaction with Sample Object × 100)/(Time interaction with Sample Object + Time interaction with Novel Object) from Day 2. Interaction times were manually scored by the observer.
Novel Object Recognition- Fig. 6
Novel object recognition was performed as previously described, with minor modifications80. Briefly, mice were first habituated to the open-field arena (40 cm × 40 cm × 35 cm), which contained wall-mounted visual cues, for a period of 5 minutes. Mice were given one 5 min trial during which they explored two identical objects in fixed positions. Animals were randomly assigned to identical starting objects of either 25 mL cell culture flasks filled with sand or Lego towers (3 cm × 3 cm × 7.5 cm). Subsequently, mice explored the same arena for 5 min but with one object replaced with the novel, distinct object. Interactions with objects (sniffing or exploring within 2 cm of object; excluding time spent sitting on top of object) were manually timed in a blinded fashion to assess the percentage of time spent exploring each object ((single object interaction time)/(total interaction time with both objects)) × 100.
Fear Conditioning:
The Fear conditioning test was performed as previously described 11. In brief, a prefabricated electric shock cage set at 0.70 mAh for NSG mice and at 0.45 mAh for B6 mice. A 6 min training session was conducted on Day 1. Tone and Light cues were given three times for 20s each at 180s, 240s, 300s marks. Each tone and light cue ended in a 2s foot shock. On Day 2 of the Cued recall trial, white blocks of acrylic was inserted into the shock cage to alter the shape of the cage, these blocks were cleaned using 4% acetic acid between trials to eliminate odor cues. Mice were tested for a Cued recall response for 6 mins with tone and light cues given three times for 20s each at 180s, 240s, 300s marks. In the Afternoon of Day 2, a Contextual recall trial was performed for 5 mins where no tone and light cues were given. Trials were recorded using the FreezeScanLite software and % freezing was determined using the software’s motion detection.
Barnes Maze
A modified Barnes maze test was performed similarly to that previously described11, and tailored minimally to accommodate mild deficiencies of aged mice. Briefly, a large circular maze containing 16 holes on the outer edge was centered over a pedestal and elevated approximately 120 cm above the floor. The escape hole consisted of a PVC elbow joint connector that was similar in texture to the maze, while the other holes were left open to the floor. Distinct visual cues were placed at four equally spaced points around the maze. An overhead light, two additional standing lights, and a fan blowing on the maze provided motivation to find the escape hole. The escape hole position was fixed for all days of the task. Mice performed four trials per day for five days as follows. For each trial within a day, the starting location for the mouse was altered relative to the escape hole position. If mice failed to identify the escape hole within 90 seconds, they were gently guided by light tapping/ directing towards the escape hole and given a score of 90 s. Between each trial, both the maze and escape hole were thoroughly cleaned with 10% EtOH to remove any scent cues that might affect performance in subsequent trials.
Tissue processing
Mice were anesthetized with Avertin (2,2,2, Tribromoethanol: T48402, Sigma Aldrich; 2-methyl-2-butanol: 240486, Sigma Aldrich) (0.018 ml (2.5%) per gram of body weight) prior to sacrifice. 0.5 ml blood was collected from the right heart ventricle in 250 mM EDTA and kept on ice until further processing. Mice were perfused with 20 ml PBS. Blood was centrifuged at 1000g for 10 min at 4˚C, plasma was rapidly frozen with dry ice and stored at −80˚C until further processing. Brains were harvested and divided sagittal. One hemisphere was used to dissect hippocampus and cortex which was snap frozen and stored at −80˚C. The second hemisphere was fixed in phosphate-buffered 4% paraformaldehyde (PFA) for 72h at 4 ˚C before transferring to 30% sucrose in PBS at 4 ˚C for 48 hours. Brains were frozen at −30˚C and cryosectioned coronally at 40µm using a microtome (Leica SM2010R). Brain sections were stored in cryoprotectant (40% PBS, 30% glycerol, 30% ethynele glycol) and kept at −20˚C until staining.
Immunostaining
Non-BrdU/EdU staining:
Brain sections were washed 3 times for 10 min in TBST and then blocked in TBS++ (TBS, 3% donkey serum – 130787, Jackson ImmunoResearch, 0.25% triton X-100 – T8787, Sigma Aldrich) for 1.5 h, followed by 72 h incubation on rocking platform at 4 ˚C in primary antibodies (see antibodies listed below). For secondary staining, brain sections washed 3 times for 10 min in TBST, followed by 1.5 h incubation in secondary antibody mix. Following secondary antibody incubation, there were 4 10 min washes in TBST; the second wash of which contained Hoechst (1:2000) with TBST. Brain sections were mounted on Superfrost™ microscope slides (12–550-15, Fisher Scientific) with Flouromount™ Aqueous Mounting Medium (Sigma-Aldrich, F4680). Slides were stored at 4˚C.
EdU staining:
Brain sections were washed 3 times for 10 min in TBST and then blocked in TBS++ (TBS, 3% donkey serum, 0.25% triton X-100) for 1.5 h, followed by 72 h incubation on rocking platform at 4 ˚C in primary antibodies (see antibodies listed below). For secondary staining, brain sections washed 3 times for 10 min in TBST, followed by 1.5 h incubation in secondary antibody mix. After secondary staining sections were washed 3 times in TBST followed by 50 min fixation with 4% PFA and 3 10 min washes in TBST. EdU staining was performed following manual instructions on the Imaging Kit (C10637, Life Technologies). 4 10 min washes, in which the third wash contained Hoechst (1:2000), with TBST before mounting with Flouromount™ and slides were stored at 4˚C.
BrdU staining:
Brain sections were washed 3 times for 10 min in TBST and then transferred to 95˚C for 10 min in 10 mM sodium citrate (pH 6), followed by 3, 10 min washes in TBST. Sections were incubated in 3M HCl for 30 min at 37˚C and then washed 3 times for 10 min washes in TBST. Sections were blocked for 1.5 h TBS++ and then transferred primary antibody mix for 72 h incubation on a rocking platform at 4 ˚C. Secondary staining started with 3 washes for 10 min in TBST, followed by incubation with secondary antibody mix for 1.5 h (all antibodies listed below). After 3, 10 min washes in TBST, sections were mounted with Flouromount™. Slides were stored at 4˚C.
Enzyme-linked immunoabsorbent assay (ELISA)
Mouse plasma samples were used to measure soluble VCAM-1 using VCAM-1 ELISA kit (Raybiotech, ELM-VCAM-1) according to manual instructions. Soluble VCAM1 was measured in human plasma samples using the Human sVCAM-1/CD106 Quantikine ELISA Kit (R&D Systems, DVC00), following manual instructions. Optical density was measured at 450 nm and 540 nm wavelengths on a Varioskan Flash Multimode Reader (5250040, ThermoScientific).
Antibodies
Immunofluorescence staining or Western blot:
Primary Antibodies:
Rat monoclonal anti-BrdU (1:500, Abcam, ab6326, clone BU1/75[ICR1])
Rat monoclonal anti-VCAM1 (1:125, Abcam, ab19569, clone M/K-2)
Goat monoclonal anti-Sox2 (1:100, Santa Cruz, sc-17320, clone Y-17)
Goat polyclonal anti-doublecortin (DCX) (1:100, Santa Cruz, sc-8066, clone C-18)
Goat polyclonal VE-Cadherin (Santa Cruz Biotechnology, sc-6458, clone C-19)
Click-iT® Plus EdU Alexa Fluor® 488 Imaging Kit (Thermo/Life Technologies, C-10637)
Mouse monoclonal anti-GFAP (1:1000, Chemicon/Fisher, MAB360MI, clone GA5)
DyLight 488 Lectin (1:200, Vector, DL-1174)
Rabbit monoclonal anti-Aquaporin 4 (1:500, Millipore, AB2218, clone)
Rat monoclonal anti-CD68 (1:600, Serotec, MCA1957, clone FA-11)
Rabbit polyclonal anti-Iba1 (1:250, ProteinTech, 10904–1-AP)
Mouse anti-human-VCAM1 antibody (Novus Biologicals, BBA5, clone BBIG-V1)
Mouse monoclonal anti-human IgG antibody (R&D Systems, MAB002 clone 11711)
Rat monoclonal anti-VCAM-1 (BioxCell, BE0027, clone M/K-2.7)
Rat IgG1 Isotype antibody (BioxCell, BE0088, clone HRPN)
Secondary Antibodies:
Alexa Fluor® 488 donkey anti-goat IgG (1:250, Invitrogen, A-11055)
Alexa Fluor® 488 donkey anti-rat IgG (1:250, Invitrogen, A-21208)
Alexa Fluor® 555 donkey anti-mouse IgG (1:250, Invitrogen, A-31570)
Alexa Fluor® 555 donkey anti-goat IgG (1:250, Invitrogen, A-21432)
Alexa Fluor® 647 donkey anti-mouse IgG (1:250, Invitrogen, A-31571)
Alexa Fluor® 647 donkey anti-rabbit IgG (1:250, Invitrogen, A-31573)
Alexa Fluor® 647 donkey anti-goat IgG (1:250, Invitrogen, A-21447)
Alexa Fluor® 647 donkey anti-rabbit IgG (1:250, Invitrogen, A-31573)
Alexa Fluor® 647 donkey anti-goat IgG (1:250, Invitrogen, A-21447)
Alexa Fluor 488 Azide (Invitrogen, A-10266)
Alexa Fluor 647 Azide (Invitrogen, A-10277)
Cy3 AffiniPure donkey anti-rat IgG (1:250, Jackson Immunoresearch, 712–165-153)
Hoechst 33342 (1:2000, Sigma, 14533–100MG)
Flow Cytometry Antibodies:
Bran Endothelial Cell Profiling:
Dylight 488 Conjugation Kit (Thermo Scientific, 53024)
Anti-Mouse CD45 PerCP-Cyanine5.5 (1:1000, eBioscience, 45–0451-80, clone 30-F11)
Anti-Mouse CD31 (PECAM-1) PE-Cyanine7 (1:100, eBioscience, 25–0311-81, clone 390)
Anti-Mouse CD11b PerCP-Cyanine5.5 (1:100, eBioscience, 45–0112-80, clone M1/70)
Anti-Mouse TER-119 PerCP-Cyanine5.5 (1:100, eBioscience, 45–5921-80, clone TER119)
Anti- Mouse CD13 Antibody (CD13-APC) (1:50, NOVUS Biologicals, NB100–64843, clone ER-BMDM1)
Anti-Mouse ACSA-2 PE (1:100, Miltenyi Biotec Inc., 130–102-365, clone IH3–18A3)
Anti-Mouse CD16/CD32 (Mouse BD FC Block) (BD Pharmigen, 553142, clone 2.4G2)
Anti-Mouse CD31 (CD31-APC) (1:100, BD Pharmigen, 551262, clone MEC13.3)
Anti-Mouse CD45 (CD45-FITC) (1:100, BD Pharmingen, 553080, clone 30-F11)
Brain-Resident Immune Cell Profiling
Anti-Mouse Ly6C-FITC (1:200), Biolegend 128021
Rabbit monoclonal Anti-Mouse Tmem119 conjugated to AlexaFluor647 (1:400), Abcam ab209064
Anti-Mouse Ly6G APC-Cy7 (1:200), Biolegend 127623
Anti-Mouse Alpha4 PE (1:100), GeneTex GTX74788
Anti-Mouse CD45 Pac Blue (1:100), Biolegend 103126
Anti-Mouse Beta1 PECy7 (1:100), eBioscience 25–0291-80
Anti-Mouse CD11c BV711 (1:200), Biolegend 117349
Anti-Mouse IA/IE AF700 (1:100), Biolegend 107621
Anti-Mouse CD14 PerCP/Cy5.5 (1:100), Biolegend 123313
Anti-Mouse CD19 BV605 (1:100), Biolegend 115539
Anti-Mouse CD3 BV786 (1:100), BD Biosciences 564010
Anti-Mouse Cd11b BV650 (1:100), Biolegend 740551
Anti-Mouse CD206 biotin antibody; streptavidin BUV395. (1:100 BD 564176), Biolegend 141713
Markers for Setting Channel Compensations (for brain immune cell profiling, all 1:100):
Anti-Mouse CD45 APC, Biolegend 103112
Anti-Mouse CD11b ApcCy7, BD Biosciences 557657
Anti-Mouse CD11b PE eBioscience 12–0112-82
Anti-Mouse CD45 PacBlue, Biolegend 103126
Anti-Mouse CD11b PeCy7, Biolegend 101215
Anti-Mouse CDllb-BV7ll, Biolegend 101241
Anti-Mouse CD11b-AF700, Biolegend 101222
Anti-Mouse CD11b-PerCP-Cy5.5, Biolegend 101227
Anti-Mouse CD11b-BV605 Biolegend 101237
Anti-Mouse CD11b-BV785, Biolegend 101243
Anti-Mouse CD11b -BV650 Biolegend 740551
Anti-Mouse CD11b-Biotin Biolegend 101203
Statistics and Reproducibility
Quantitative analysis of immunohistological data
NPC activity
For quantification of the number of BrdU+, EdU+, Sox2+, DCX+, NeuN+, and GFAP+ cells in mice, confocal Z-stacks of six coronal brain sections spanning the hippocampus (40 mm thick, 200 mm apart) were captured on a Zeiss confocal microscope per brain sample, and cells within the dentate granule cell layer were counted. NPC activity was quantified by counting colabeled precursor cell populations in the neurogenic granular layer and hilus in 6 serial 40 µm sections throughout the hippocampal DG. Counts were made while blinded to the different groups. Cell numbers were normalized to the volume of the DG granule cell layer. Unless otherwise noted, all representative confocal images were captured on a Zeiss confocal microscope and represent a Z-stack of 10 images taken on confocal planes 2 µm apart. Images of cells cultured in vitro (Supplementary Figure 4) were captured on a single plane.
For 3D Rendering of High-magnification Immunofluorescence Tissue Staining:
63x magnification Z-stacked Images were captured using the LSM 700 system set to take 51 slices with an interval of 0.4 um. 3D modeling through the Imaris8 software was done on the Z-stacked Images for high contour modeling of antibody markers. Surface masks with smoothing set to 0.2 um were used to form the base 3D model. Surface area and voxel thresholds were used to remove artifacts from high magnification image acquisition.
For %area quantifications of immunofluorescent images, ImageJ was used to determine integrated pixel intensity of thresholded images comprising 5–6, serial 40 µm sections spanning the hippocampal DG per animal immunostained for various vasculature and microglia cell markers.
Vasculature
Confocal Z-stacks of six coronal brain sections spanning the hippocampus (40 mm thick, 200 mm apart) were captured on a Zeiss confocal microscope per brain sample. VCAM1+ and Lectin+ signals were threshold and analyzed using the “% Area” of the ‘Analyze Particles’ function in ImageJ 1.50i (ImageJ website: https://imagej.nih.gov/ij/). Auto-fluorescent background picked up by the thresholds is removed using the Size Exclusion feature of the ‘Analyze Particles’ function. Colocalized VCAM1+/Lectin+ signal was calculated using the Colocalization plug-in developed by Pierre Bourdoncle of the Institut Jacques Monod (Plug-in website: http://rsb.info.nih.gov/ij/plugins/colocalization.html).
Microglial Activation
Confocal Z-stacks of six coronal brain sections spanning the hippocampus (40 mm thick, 200 mm apart) were captured on a Zeiss confocal microscope per brain sample. Microglia markers IBA1 and CD68 were analyzed through “% Area” and manual cell counts; IBA1+ and CD68+ signals were threshold and analyzed using the “% Area” of the ‘Analyze Particles’ function of ImageJ 1.50i (ImageJ website: https://imagej.nih.gov/ij/). Colocalized IBA1+/CD68+ signal was calculated using the Colocalization plug-in (Plug-in website: http://rsb.info.nih.gov/ij/plugins/colocalization.html). To count the numbers of IBA1+ and IBA1+/CD68+ cells in the DG, the soma of IBA1+ cells in 5–6 visual fields per animal photographed using a Zeiss confocal microscope and Zen Black software were physically counted using the ‘Multi-point’ tool of ImageJ 1.50i (ImageJ website: https://imagej.nih.gov/ij/). Colocalization of IBA1+/CD68+ cells was counted through visual confirmation by superimposition of the two markers in ImageJ. Cell density of IBA1+ and IBA1+/CD68+ cells in the DG were calculated by normalizing the total counts to the volume of the DG determined by the dimensions of the images captured using the Zeiss confocal microscope.
Data were analyzed using an unpaired Student’s t-test and One- or Two-Way Anova with Tukey’s Multiple Comparisons Test or Sidak’s Multiple Comparisons Test, respectively. Proteomics was analyzed using Spearman’s correlation coefficient. Bulk RNA-seq was analyzed using Cuffdiff v2.2.1 statistical package. Single cell RNAseq was analyzed by applying the Mann-Whitney U-test of the BEC clusters obtained using unsupervised clustering. P-values were adjusted via the false discovery rate (FDR) or Bonferroni. P values equal to or lower than 0.05 were considered statistically significant. Significance was assessed based on p values and heteroscedastic variance between groups that are statistically compared. All violin plots minima, maxima, centre, and percentile values corresponding to data in Fig. 1, Extended Data Fig. 1, and Extended Data Fig. 2 are shown in Supplementary Table 3. Unless otherwise noted, experiments were repeated 3 or more times independently with similar results. A summary of all in vivo studies and n groups can be found in Supplementary Table 4.
Supplementary information
Life Sciences Reporting Summary, and Supplementary Tables 1-4 describing GeneAnalytics pathway analysis of Bulk RNAseq (Fig. 1 and Extended Data Fig.1), proteomics (Fig. 1 and Extended Data Fig. 1), Violin plot values of scRNAseq (Fig. 2, Extended Data Fig. 1, and Extended Data Fig. 2), and a summary of all in vivo experiments are provided here.
Data Availability Statement
RNA-seq gene lists with statistics (Fig. 1, Fig. 2, and Extended Data Fig. 1 and 2), full blots (Extended Data Fig.6), and individual data points graphed for Extended Fig. 9n are available as source data files and as Supplementary Tables 1-3 accompanying this article. Requests of datasets obtained from human research will be subject to additional review steps by the IRB that has granted permit for a particular research. Bulk and single cell RNA sequencing datasets that support the findings of this study have been deposited in NCBI GEO with the series accession record GSE127758 [with embedded accession codes GSM3638211 to GSM3638222]. Please contact the corresponding author for additional information.
Extended Data
Extended Data Figure 1. Bulk and single cell transcriptome and proteome profiling of young and aged BECs reveal increased inflammatory signature with aging.

(a) Schematic of flow sorting of CD31+CD45− BECs from mouse cortex and hippocampi. n=6 young and 6 aged biologically independent samples; each sample= 2 biologically independent mice cortex/hippocampi pooled as one sample. There were 1006 significant differentially expressed genes (*q<0.05, Cuffdiff Statistical Package61).
(b) FACS gating strategy to isolate single BECs. PI+ dead cells were excluded. CD11b+ and CD45+ cells were gated to exclude monocytes/macrophages and microglia. CD31+Cd11b−CD45− cells were defined as the BEC population.
(c) Fragments Per Kilobase of transcript per Million mapped reads (FPKM) of CNS cell-type specific markers. n=6 young and 6 aged biologically independent samples. Mean +/− SEM.
(d) FPKM values of leukocyte binding adhesion molecules including Vcam1. n=6 young and 6 aged biologically independent samples. Bars represent mean. Error bars derived from SEM. Specific q values shown are derived from Cuffdiff Statistical Package (*q=0.0015). See Methods and Source Data for details.
(e) FPKM values of tight junction genes. n=6 young and 6 aged biologically independent samples. Mean +/− SEM. q=0.16, *q=0.0013, **q=0.0015, Cuffdiff Statistical Package. See Methods and Source Data for details.
(f) FPKM values of the gene transcripts in murine young and aged CD31+BECs of human plasma proteins that change with age (see Supplementary Table 2 for list of human plasma proteins expressed in murine BECs). n=6 young and 6 aged biologically independent samples. Mean +/− SEM. *q=0.0015, **q=0.021, Cuffdiff Statistical Package. See Methods and Source Data for details.
(g) C57BL6 mice were injected with anti-VCAM1-DL488 or IgG-DL488 isotype control (r.o.) 2 hours before perfusion to label BECs in vivo prior to brain dissociation, staining and FACS.
(h) Flow gating and histogram plots of pooled (n=4 mice/ age group), young or aged hippocampi isolated from healthy mice injected with fluorescently tagged DL488 anti-VCAM1 mAb or IgG-DL488 conjugated isotype control as depicted in (g).
(i) Quantification of CD31+VCAM1+cells isolated from (left) healthy cortex (n=4 mice per age group, individually measured) and (right) 4 technical replicates of hippocampi that are pooled from 4 mice per age group. Mean +/− SEM. *p=0.0015. Two-tailed Student’s t-test.
(j) sVCAM1 ELISA in plasma from young isochronic or heterochronic parabionts following 5 weeks of parabiosis. n=11 mice/group pooled from two independent experiments. **p=0.0031,Two-tailed Student’s t-test. Mean +/− SEM.
(k) Confocal images in the DG of VCAM1, lectin, and Aqp4 of young isochronic or heterochronic parabionts 5 weeks after surgery. Quantification shown in Fig. 1j. Hoechst labels cell nuclei. Scale bar = 100 μm. n= 8 mice in the Young isochronic group and 13 mice in Young heterochronic group from two independent experiments; representative images are shown.
(l) Boxplot of expression levels of classical pan-endothelial and BBB-specific transcripts (n=272 BECs total). Minima, maxima, median, and percentiles are listed in Supplementary Table 3. (n=146 Capillary BECs, n=59 Venous BECs, n=67 Arterial BECs pooled from 8 mice hippocampi).
(m) Overlay of Vcam1 mRNA levels on corresponding coordinate on the Cd31 vs Vcam1 fluorescent intensity plots obtained during FACs sorting.
(n) Validation of the correlation (Spearman’s rho = 0.704) between protein and mRNA levels of 77 single BECs sorted from both Vcam1+ and Vcam1− gates. Scatterplot of Vcam1 fluorescence intensity as measured by FACs and corresponding transcript counts (per million).
(o) tSNE visualization colored by cell identity (aged vs. young) (n=160 young BECs, n=112 aged BECs pooled from 4 mice hippocampi per age group).
(p) Comparison of Vcam1 expression levels in young and aged hippocampal CD31+ BECs collected from the VCAM1+ gate during FACs sorting (bars represent mean and error bars = SD). (n=160 young BECs, n=112 aged BECs pooled from 4 mice hippocampi per age group). *p=0.017. Two-tailed Mann-Whitney test.
(q) Violin plots of mRNA expression levels of Icam1 in all isolated BECs (bottom) and specifically in VCAM1+ enriched BECs (top). Other adhesion molecules, namely Psele and Sele were not found to be expressed in isolated CD31+ BECs. (All BECs: n=160 young BECs, n=112 aged BECs pooled from 4 mice hippocampi per age group; VCAM1+ enriched BECs: n=56 Vcam1+ young BECs, n=44 Vcam1+ Aged BECs pooled from 4 mice hippocampi per age group). Minima, maxima, median, and percentiles are listed in Supplementary Table 3.
(r) Violin plots of tight junction markers in all isolated young and aged BECs. (n=160 young BECs, n=112 aged BECs pooled from 4 mice hippocampi per age group). Minima, maxima, median, and percentiles are listed in Supplementary Table 3.
Extended Data Figure 2. Single Cell Transcriptome profiling of Vcam1-enriched BECs reveal specialized subclusters and aged plasma upregulates VCAM1 on cultivated BECs.

(a) Violin plots of classical arterial (top) or venous (bottom) markers in each cluster. Putative neurogenic secreted factors include Jag1 and Efnb2. Minima, maxima, median, and percentiles are listed in Supplementary Table 3. (n=146 Capillary BECs, n=59 Venous BECs, n=67 Arterial BECs pooled from 8 mice hippocampi).
(b) Violin plots of various angiogenesis and Notch-signaling related genes in each of the 3 distinct clusters. Putative neurogenic secreted factors include Vegfc. Minima, maxima, median, and percentiles are listed in Supplementary Table 3. (n=146 Capillary BECs, n=59 Venous BECs, n=67 Arterial BECs pooled from 8 mice hippocampi).
(c) Representative images of Bend.3 cells immunostained for BBB specific markers of adherens junctions (AJ) and tight junctions (TJ), specifically ß-catenin, Claudin-5, and VE-Cadherin. All Bend.3 cells and primary BECs are validated with these markers prior to experimentation; confirmed independently >10 experiments. Hoechst labels cell nuclei. Scale bar = 100 μm.
(d) Dose response graph depicting cultured Bend.3 cells stimulated overnight with increasing concentrations of recombinant mouse TNF-α followed by flow cytometry to quantify %CD31+ VCAM1+ cells. n=2 pooled samples per condition.
(e) CD31+VCAM1+ Quantification (left) and histogram (right) of Bend.3 cells stimulated overnight with recombinant mouse TNF-α, IL-1β, or IL-6 followed by flow cytometry to measure VCAM1. n=3 biologically independent samples per condition. ****p<0.0001, One-way ANOVA with Tukey’s post hoc test for group comparisons; Mean +/− SEM; experiment repeated four times independently with similar results.
(f) Primary BECs and Bend.3 cells cultured in 10% young or aged mouse plasma (YMP: 3-month old; AMP: 18-month-old) or young or aged human plasma (<25 years or >65 years, YHP/AHP) for 16 hours then stained for VCAM1 to label cell nuclei. Representative images are shown. Scale bar = 100 μm. Each plasma treatment experiment in Primary BECs or Bend.3 cells with mouse or human plasma repeated at least three times independently with similar results.
(g) Quantification of VCAM1 %area staining. Primary BECs treated with YMP or AMP: n=7 YMP, 9 AMP biologically independent replicates pooled from two experiments. *p=0.0343. Bend.3 cells with YMP or AMP: n=4 biologically independent replicates per group derived from different cell flasks. ***p=0.0003. Bend.3 cells with YHP or AHP: n=6 biologically independent replicates derived from different cell flasks per group. ****p<0.0001. Two-tailed Student’s t-test. Mean +/− SEM. Mean +/− SEM.
(h) Bend.3 cells cultured in 10% young or aged mouse plasma (YMP/AMP) for 16 hours followed by flow cytometry of CD31 and VCAM1. n=5 biologically independent replicates per group. Graph of %CD31+VCAM1+ quantification shown with histogram of Bend.3 cells. **p= 0.0082. Two-tailed Student’s t-test. Mean +/− SEM.
(i) Quantification of %CD31+ Bend.3 cells treated with young or aged mouse plasma and co-stained with CD31 and ICAM1, E-Selectin, or P-Selectin. n=5 biologically independent replicates per group for ICAM1; n=6 biologically independent replicates per group for E- and P- selectin. Mean +/− SEM. Histogram plots shown to the right of quantifications. Two-tailed Student’s t-test. Not significant; p=0.2355 (ICAM1), p=0.1959 (E-Selectin), p=0.0825 (P-Selectin).
(j) Representative images of ICAM1, Meca99, lectin, and Hoechst to label cell nuclei of young (3-month-old) mice which received 7 r.o. injections of young (3 month) or aged (18 month) pooled plasma over 4 days as described in Fig. 3A schematic. n=10 mice treated with YMP,11 mice treated with AMP. Scale bar = 100 μm. Quantification (k) on the right using n=4 mice per group. Mean +/− SEM. Two-tailed Student’s t-test. Not significant; p=0.5222.
(l-m) Quantification in the DG of total BrdU+Sox2+ neural progenitor cells in young (3-month-old) mice injected r.o. daily over 5 days (2 μg per injection) with TNF-α (n=4 mice/group) or with 3 LPS injections (0.5 mg/kg i.p.) at 28 hours, 22 hours, and 2 hours prior to perfusion (n= 8 mice per group). In each experiment, mice were pulsed with BrdU every 8 hours for 3 injections prior to perfusion. *p=0.0194 (TNF-α *p= 0.0122 (LPS). Mean +/− SEM. Two-tailed Student’s t-test.
Extended Data Figure 3. Assessment of Vcam1fl/flSlco1c1-CreERT2+/− young mice and Sudan Black B treatment quenches autofluorescent staining caused by lipofuscin revealing VCAM1 cerebrovascular specificity, and immunodeficient mice exposed to aged human plasma over 3 weeks have increased brain aging hallmarks.

(a) Schematic. n= 5 mice/group.
(b) Quantification in the DG of VCAM1 from immunostained confocal images. n= 5 mice/group. Unpaired two-tailed Student’s t-test. Mean +/− SEM. *p=0.0451.
(c) Quantification in the DG of BrdU+ and Sox2+ NPCs and triple labeled GFAP+ neural stem cells from confocal images of immunostained sections. Scale bar = 100 μm. n= 5 mice/group. Unpaired two-tailed Student’s t-test. Mean +/− SEM. ***p=0.007, **p=0.0227, *p=0.0038.
(d) Quantification in the DG of Iba1 and CD68 from confocal images of immunostained sections. n= 5 mice/group. Unpaired two-tailed Student’s t-test. Mean +/− SEM. *p= 0.0454.
(e) Experimental Design. n= 6 Cre− and 7 Cre+ mice per group.
(f) Quantification of VCAM1+ percent area in lectin+ vasculature of immunostained sections from 6 Cre− and 5 Cre+ mice/group. ****p<0.0001. Unpaired two-tailed Student’s t-test. Mean +/− SEM.
(g) Quantification of the total number of BrdU+ cells, BrdU+Sox2+ co-labeled neural progenitor cells, and (h) average # DCX+ imature neurons per section in the DG of immunostained sections. n=6 Cre− and 7 Cre+ mice per group. *p=0.0012, **p=0021, ***p=0.0028. Unpaired two-tailed Student’s t-test. Mean +/− SEM.
(i) Quantification of Iba1 and CD68 in the DG of immunostained sections. n=6 Cre− and 7 Cre+ mice per group. Bars represent mean. Error bar represents SEM. Stain experiment repeated twice with similar results; Similar mouse experiments using these validated transgenic mice repeated 4 times with similar results (see Supplementary Table 4).
(j) Confocal images of brain sections of Cre+ or Cre− aged Slco1c1-CreERT2-Vcam1fl/fl mice treated with tamoxifen in young adulthood (age 2 months) and aged to 18 months stained for anti-VCAM1 or IgG isotype control, Aqp4, and GFAP. Hoechst labels cell nuclei. Aged (18-month-old) brain sections were treated with Sudan Black B to remove lipofuscin background in the granular and hilus layers of the DG. SBB treatment removes the majority of lipid-based artifacts typically seen in aged tissues without suppressing immunofluorescent labeling. Scale bar = 100 μm. Experiment repeated three times with similar results.
(k) Aged (18-month-old) Cre+ and Cre− brain sections were immunostained using the regular protocol, without Sudan Black B treatment. Heavy lipofuscin background is present in the Cy3 fluorescence channel. Experiment repeated three times with similar results.
Extended Data Figure 4. VCAM1 is not expressed in CNS cell types other than BECs in the hippocampus, is increased during neurodegeneration, and deleted in brain endothelium using Vcam1fl/flSlco1c1-CreERT2+/− transgenic mice.

(a) Representative 2D and 3D Z-stacked high magnification confocal images (51 slices with an interval of 0.4 um) of VCAM1 in the granular layer of the DG of the hippocampus of a young (3-month-old) NSG mouse acutely treated with Aged Human Plasma (AHP). Brain sections were co-stained with DCX and NeuN to label immature and mature granule neurons, respectively. VCAM1 is not expressed in these cell types. Light blue lines outline the granule layer. Experiment repeated 3 times independently with similar results. 2D Scale bar = 50 μm. Two 3D renderings of the 2D images are displayed. 3D Scale bar = 20 μm.
(b) Quantification of VCAM1, Aqp4, Lectin, with Hoechst labeling cell nuclei in the hippocampus and cerebellum of EAE (multiple sclerosis), Npc1−/− (Niemann Pick Disease Type C), and Grn−/− (Frontotemporal Dementia) disease models. EAE: n=4 naïve, 8 EAE induced, *p=0.006, **p=0.0125; Npc1: n=6 mice per group, ***p=0.0274, ****p<0.0001; Grn: n=4 mice per group, *****p=0.0004. Unpaired two-tailed Student’s t-test. Mean +/− SEM.
(c) Representative 2D and 3D Z-stacked high magnification confocal images (51 slices with an interval of 0.4 um) of VCAM1 in te granular layer of the DG of the hippocampus co-stained with Sox2 and GFAP to label neural stem and progenitor cells (Sox2+GFAP+) and hilus GFAP+ astrocytes. VCAM1 is not expressed in these cell types in the DG. Light blue lines outline the granule layer. Experiment repeated 3 times independently with similar results. 2D Scale bar = 50 μm. Two 3D renderings of the 2D images are displayed. 3D Scale bar = 20 μm.
(d) Vcam1fl/flSlco1c1-CreERT2+/− (Cre+) or CreERT2−/− (Cre−) littermates (3-month-old) were treated daily with tamoxifen (i.p. 150 mg/kg) for 5 days followed by 4 days of rest. Mice received 3 LPS injections (0.5 mg/kg i.p.) at 28, 22, and 2 hours prior to perfusion. Mice also received a retro-orbital injection of fluorescently conjugated mouse anti-VCAM1 mAb (100μg) 2 hours prior to perfusion. FACS gating strategy to analyze single BECs. PI+ dead cells were excluded. CD11a/b, CD45, and Ter-119 negative cells were gated to exclude erythrocytes, monocytes/macrophages and microglia. CD13 and ACSA-2 staining was applied to exclude pericytes and astrocytes, respectively. CD31+MECA99+ cells were defined the BEC population.
(e) Quantification of (f) flow cytometry that was performed on primary BECs isolated from Cre+ or Cre− mice treated as described in (d). n=3 Cre+ or Cre− mice received LPS, while one Cre− mouse was given PBS vehicle control instead. The VCAM1 gate was set based on a Cre− mice injected with fluorescently conjugated IgG. **p=0.0011; Unpaired two-tailed Student’s t-test; Mean +/− SEM.
(g) Representative confocal images of cortex and DG for VCAM1 and Hoechst to label cell nuclei in LPS stimulated mice as descrbed in (d). Loss of Vcam1 in Cre+ mice, but not Cre−, in BBB endothelium, but not in meninges is shown. Experiment repeated 3 times independently with similar results. Scale bar = 100 μm.
Extended Data Figure 5. Brain endothelial and epithelial-specific Vcam1 deletion in young mice mitigates the negative effects of aged plasma administration and anti-VCAM1 antibody reduces hallmarks of brain aging in female mice.

(a) Experimental Design. n=8 mice per group.
(b) Representative confocal images and (c) quantification in the DG of VCAM1, MECA-99, and Aqp4. Hoechst labels cell nuclei. Scale bar = 100 μm. Arrows point to VCAM1+ vessels. (n=4 mice/group analyzed). 2-way ANOVA with Tukey’s multiple comparisons test. Mean +/− SEM.***p=0.0002.
(d-f) Quantification of the total number of BrdU+ cells, BrdU+Sox2+ neural progenitor cells, and DCX+ immature neurons in the DG of immunostained sections. n=8 mice per group. 2-way ANOVA with Tukey’s multiple comparisons test. Mean +/− SEM. *p=0.0193, **p=0.0283, ***p=0.0015.
(g-h) Quantification of the total number of surviving EdU+DCX+ immature neurons and EdU+NeuN+ neurons in the DG of immunostained sections. n=8 mice per group. 2-way ANOVA with Tukey’s multiple comparisons test. Mean +/− SEM. *p=0.0181.
(i-j) Quantification of Iba1 and CD68 in the DG of immunostained sections. n=8 mice per group. 2-way ANOVA with Tukey’s post-hoc test. Mean +/− SEM.****p<0.0001 for both.
(k) Schematic. Aged (18-month-old) C57BL6/J female mice received i.p. injections of a mouse specific anti-VCAM1 mAb or IgG isotype control (9 mg/kg) every 3 days for a total of 7 injections. Mice also received BrdU daily (100 mg/kg i.p.) for 6 consecutive days followed by perfusion 2 days after the last injection. n=9 IgG- treated and 10 anti-VCAM1 mAb-treated mice per group.
(l) Quantification of VCAM1+Lectin+ staining from confocal images in the DG. n=3 mice brain sections stained and quantified per group. Mean +/− SEM. *p=0.0128, 1-way ANOVA with Tukey’s multiple comparisons post-hoc test.
(m) Quantification of BrdU+ and BrdU+Sox2+ staining from confocal images in the DG. n=9 IgG- treated and 10 anti-VCAM1 mAb-treated mice per group. Unpaired two-tailed Student’s t-test. Mean +/− SEM. *p=0.0325, ***p=0.0003.
(n) Quantification of Iba1 and CD68 staining from confocal images in the DG. n=9 IgG- treated and 10 anti-VCAM1 mAb-treated mice per group. **p=0.0008, *p= 0.0427. Unpaired two-tailed Student’s t-test. Mean +/− SEM.
(o) sVCAM1 ELISA of the plasma of young (4-month-old) and aged (18-month-old) female mice. n=6 mice/group. ****p<0.0001. Unpaird two-tailed Student’s t-test. Mean +/− SEM.
Extended Data Figure 6. Circulating sVCAM1 does not contribute to inhibitory effects of aged plasma administration while anti-VCAM1 antibody prevents inhibitory effects of aged human plasma.

(a) Experimental design. n=7 mice/group.
(b) Ponceau S stain showing total protein pull-down from plasma by both IgG and anti-VCAM1 mAb conjugated beads. Experiment repeated 3 times with similar results.
(c) Western blot showing human sVCAM1 (93 kDa) pulled down during immunodepletion by anti-human VCAM1 antibody but not IgG. Experiment repeated 3 times with similar results. Full blots shown in Source Data.
(d) Human sVCAM1 ELISA of depleted plasma. n=4 mice per group. Mean +/− SEM.
(e) Representative confocal images and quantification (f) in the DG of VCAM1, MECA-99, and Aqp4. Hoechst labels cell nuclei. Scale bar = 50 μm for merged images and scale bar= 20 μm for the 4x zoomed single channel VCAM1 images outlined with white squares. Arrows indicate VCAM1+ vessels. n=5 mice/group analyzed. Mean +/− SEM. 1-way ANOVA with Tukey’s multiple comparisons post-hoc test. ***p=0.0004, **p= 0.0025.
(g) Quantification of the total number of BrdU+ and BrdU+Sox2+ co-labeled neural progenitor cells in the DG of immunostained sections. n=7 mice/group. Mean +/− SEM. 1-way ANOVA with Tukey’s multiple comparisons post-hoc test. *p=0.0237, **p= 0.0123, ***p=0.0320, ****p=0.0094.
(h) Quantification and representative confocal images (i) of the DG for DCX and Hoechst to label cell nuclei. Scale bar = 100 μm. n= 5 mice/group analyzed. Mean +/− SEM. 1-way ANOVA with Tukey’s multiple comparisons post-hoc test. **p=0.0017, *p=0.0385.
(j) Quantification of the Iba1+ and CD68+ staining from confocal images in the DG. n=7 mice/group. *p= 0.0156, **p=0.0242, ***p=0.0034, ****p= 0.0237, p=0.0546 PBS compared to anti-VCAM1 activated microglia counts. 1-way ANOVA with Tukey’s multiple comparisons post-hoc test. Mean +/− SEM.
(k) Experiment schematic. n=9 PBS-treated, 8 AHP + IgG-treated, and 8 AHP + anti-VCAM1 mAb-treated mice.
(l) Quantification in the DG of VCAM1 in lectin+ blood vessels using immunostained confocal images. n=9 PBS-treated, 8 AHP + IgG-treated, and 7 AHP + anti-VCAM1 mAb-treated mice analyzed. 1-way ANOVA with Tukey’s multiple comparisons post-hoc test. Mean +/− SEM. **p=0.006.
(m) Quantification in the DG of CD68 in Iba1+ stained microglia using immunostained confocal images. n=9 PBS-treated, 8 AHP + IgG-treated, and 8 AHP + anti-VCAM1 mAb-treated mice. 1-way ANOVA with Tukey’s multiple comparisons post-hoc test. Mean +/− SEM. ***p=0.0006, **p=0.0067.
(n) Quantification of BrdU+Sox2+ progenitor cells and DCX+ immature neurons (o) from confocal images. n=9 PBS-treated, 8 AHP + IgG-treated, and 8 AHP + anti-VCAM1 mAb-treated mice. 1-way ANOVA with Tukey’s multiple comparisons post-hoc test. Mean +/− SEM. *p=0.018, **p=0.0386, ***p=0.0344, ****p=0.0167.
(p) Quantification of the total numbers of EdU+ surviving cells in the DG of immunostained sections. n=9 PBS-treated, 8 AHP + IgG-treated, and 8 AHP + anti-VCAM1 mAb-treated mice. 1-way ANOVA with Tukey’s multiple comparisons post-hoc test. Mean +/− SEM. ***p=0.0009, ****p=0.0002.
Extended Data Figure 7. BBB integrity is not compromised with aging or Vcam1 conditional deletion.

(a) Quantification of fluorescent signal measured with a microplate reader from homogenized brain tissues samples from mice that were injected with Texas Red labeled 70kDa dextran r.o. and perfused with FITC labeled 2MDa dextran 3 hours after injection. Vcam1-fl/fl Slco1c1-CreERT2−/− (Cre−) or Vcam1-;fl/fl Slco1c1-CreERT2−/+ (Cre+) mice were used. n= 3 Young Cre− (5-month-old), 5 aged Cre− (19-month-old), 2 young Cre− mice that underwent TBI as a positive control, 3 young Cre− control mice not injected with dextran, and 3 aged Cre− control mice not injected with dextran. Mean +/− SEM.
(b) Quantification of fluorescent signal from homogenized brain tissues samples measured with a microplate reader. Cre− or Cre+ mice were used as described in (a). n= 3 Young Cre−, 5 aged Cre−, or 5 “Aged Vcam1-ST” (19-month-old), which are Cre+ mice that were tamoxifen treated for 4 days, 2 months prior to sacrifice, and that were infused with dextran prior to sacrifice as described in (a). Mean +/− SEM.
(c-d) Quantification of Mean Fluorescence Intensity from confocal images of tissue sections from mice injected as in (a-b). Cre− or Cre+ mice were used as described in (a). n= 4 Young Cre−, 5 aged Cre−, 5 “Aged Vcam1-ST” Cre+ mice that were tamoxifen treated and that were infused with dextran as described in (a-b), 1 young and 1 aged Cre− control mice not infused with dextran. Mean +/− SEM. 1-way ANOVA with Tukey’s multiple comparisons post-hoc test. p=0.895 (Young vs. Aged), 0.9097 (Aged vs. Aged Vcam1-ST).
(e) Schematic of flow cytometric analysis of various immune cell populations from mouse cortex and hippocampi.
(f) Flow cytometry gating strategy of individual hippocampal immune cell populations labeled with various immune cell markers, anti-alpha4 and anti-beta1 integrins (VLA-4). n-1 was used to gate fir VLA-4+ cell populations.
Extended Data Figure 8. Brain-resident leukocyte composition does not change with aging or Vcam1 conditional deletion.

(a) Mouse model and experimental groups. n= 5 Young Cre− mice, 9 Aged Cre− mice, 4 “Vcam1− (LT)” mice, and 4 “Vcam1-(ST)” mice. Vcam1-fl/fl Slco1c1-CreERT2−/− (Cre−) or Vcam1-fl/fl Slco1c1-CreERT2−/+ (Cre+) mice were used. Tamoxifen treatment paradigm described in schematic.
(b) Gating plots of CD31+VCAM1+ hippocampal and cortex cells isolated from 1 LPS stimulated aged (19-month-old) Cre+ (Vcam1−deletion ST) mouse and 1 Cre− mouse injected with fluorescently tagged DL488 anti-VCAM1 mAb (r.o.) 2 hours before sacrifice to confirm VCAM1 on BECs was reduced. 1 additional Cre− mouse was treated with LPS and injected with IgG-DL488 isotype control prior to sacrifice to serve as a control for VCAM1 gating.
(c-j) Quantification of various cell populations present in Young Cre− (n=5), Aged Cre− (n=9), Aged Vcam1-deleted LT (n=4), and Aged Vcam1-deleted ST (n=4) mice per group. Mean +/− SEM. *p=0.0413, **p=0.0245, ***p=0.0429, ****p=0.0023. Mean +/− SEM. 1-way ANOVA with Tukey’s multiple comparisons post-hoc test.
Extended Data Figure 9. VCAM1 and VLA4 perturbations reduce hallmarks of brain aging.

(a) Experimental design for anti-VLA-4. n=7 mice/group.
(b) Representative confocal images and quantification (d) of VCAM1, Lectin, and Hoechst to label cell nuclei. Scale bar = 100 μm. n=3 mice/group analyzed. Mean +/−SEM.
(c) Representative confocal images and quantification (f) in the DG of CD68, Iba1, and Hoechst. Scale bar = 100 μm. n=7 mice/group. Mean +/−SEM. Two-tailed Student’s t-test. *p=0.0436, **p=0.0175.
(e) Quantification of confocal images of the DG of NPCs co-labeled with BrdU and Sox2. n=7 mice/group. Mean +/−SEM.
(g-h) Quantification of Iba1+ and Iba1+CD68+ Microglia in the DG from the experiment described in Figure 6f. n=8 mice/group. Mean +/−SEM.
(i-k) 13-month-old NSG mice were injected with anti-VCAM1 mAb or IgG every 3 days for one month and underwent novel object recognition or fear conditioning during the last week (n=11 mice per group). Quantification of percent time spent exploring objects in novel object placement task is shown in (i) while %Freezing observed during the Training (j) phase is shown. The average of Trials 3-5 for Contextual are quantified in (k). Mean +/−SEM. 2-way Anova with Sidak’s multiple comparisons test. *p=0.0485. There were no significant differences between groups for contextual freezing (Two-tailed Student’s t-test; p=0.2722).
(l-n) 23-month-old C57BL6 mice were injected with anti-VCAM1 or IgG every 3 days for one month and underwent fear conditioning during the last week (n=7 PBS, 12 IgG, and 13 anti-Vcam1-treated mice per group). %Freezing observed during the Training (l), Cued (m), and Contextual (n) tests are shown. Mean +/− SEM. 2-way Anova with Tukey’s multiple comparisons test between groups at each timepoint. *p=0.0493. Individual data point distribution shown in Source Data.
Extended Data Figure 10. Aged blood inhibits hippocampal NPC activity and activates microglia through VCAM1 at the blood-brain barrier (BBB).
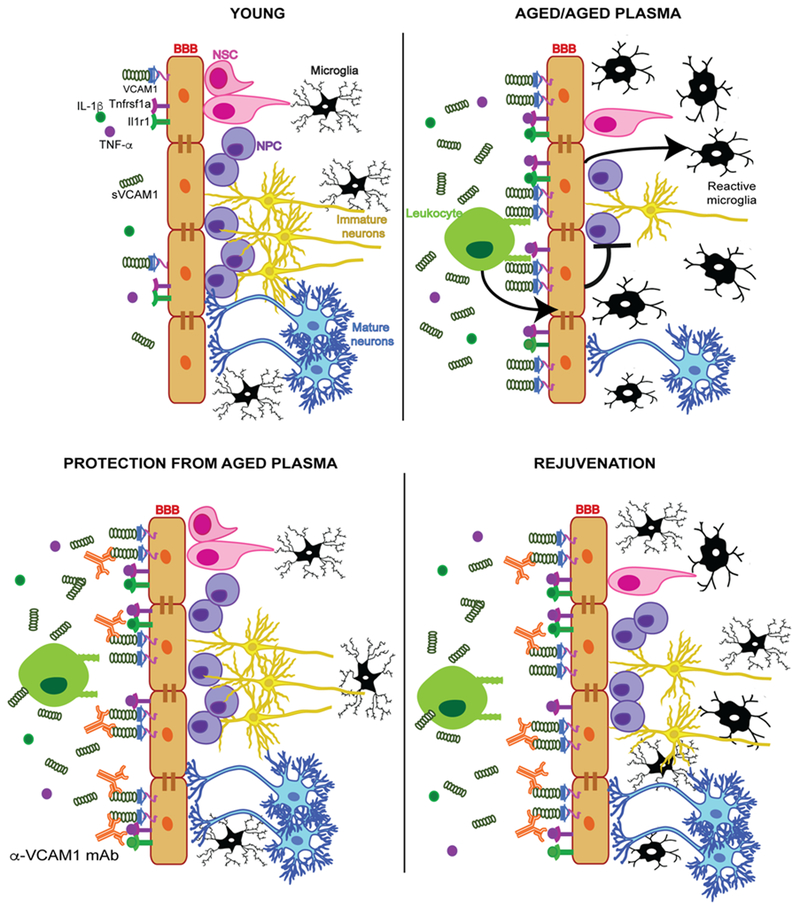
In young healthy mice, neurovascular homeostasis is maintained with low expression levels of systemic soluble VCAM1 (sVCAM1) and BBB-specific VCAM1, active neurogenesis with neural stem cells (NSCs) differentiating into NPCs (NPCs), immature neurons and mature neurons, and nonreactive microglia in a low inflammation environment. During aging or exposure to aged plasma, we propose:
1) Inflammatory factors in aged plasma (IL-1β, TNF-α, among others) induce arterial and venous BEC activation and upregulation of VCAM1 through their cytokine receptors Tnfrsf1a and Il1r1.
2) Venous VCAM1 facilitates tethering, but not transmigration, of leukocytes which sustain BEC inflammation.
3) Inflamed and activated venous and arterial VCAM1+ brain endothelium relay (unknown) signals to the parenchyma leading to a loss of homeostasis, decline in NPC activity and chronic activation of microglia.
4) anti-VCAM1 mAb protects young brains from the detrimental effects of aged plasma by reducing BEC-mediated inflammation.
5) anti-VCAM1 mAb rejuvenates aged brains by reducing BEC-mediated inflammation and VCAM1+ BEC-mediated reduction in NPC proliferation.
Supplementary Material
ACKNOWLEDGEMENTS
We thank Lusijah Sutherland, PhD, and Corey Cain, PhD, for managing the core flow cytometry facility at the VA in Palo Alto and providing H.Y. and C.J.C. training on the instruments; Corey Cain, PhD as well for his experimental advice, assistance with flow cytometry and analysis of PBMCs and thoughtful discussion; Oscar Leyva for assistance in staining/microscopy analysis for the experiment shown in Extended Data Fig. 4a-d. We would also like to thank Ryan Watts, PhD and Nga Bien-Ly, PhD for sharing a BEC isolation protocol used in modified form for RNAseq. This work was funded by the Department of Veterans Affairs (T.W.-C.), the National Institute on Aging (F32-AG051330 to H.Y., R01-AG045034 and DP1-AG053015 to T.W.-C.), the NOMIS Foundation (T.W.-C.), the D. H. Chen Foundation (T.W.-C.), The Glenn Foundation for Aging Research (T.W.-C), a SPARK grant to H.Y. through the Stanford Clinical and Translational Science Award (CTSA) to Spectrum (UL1 TR001085), the National Institutes of Health (R01-GM37734 and R37-AI047822 to E.C.B, RO1 AI109452 to HH), the Wu Tsai Neurosciences Institute (T.W.-C.), the Stanford Institute for Immunity, Transplantation and Infection (C.J.C.), and the Edinger Institute (C.J.C.). The CTSA program is led by the National Center for Advancing Translational Sciences (NCATS) at the National Institutes of Health (NIH).
Footnotes
Competing Interests
The authors declare the existence of a financial competing interest.
References (Main Text)
- 1.Wyss-Coray T Ageing, neurodegeneration and brain rejuvenation. Nature 539, 180–186 (2016). [DOI] [PMC free article] [PubMed] [Google Scholar]
- 2.Harry GJ Microglia during development and aging. Pharmacol Ther 139, 313–326 (2013). [DOI] [PMC free article] [PubMed] [Google Scholar]
- 3.Mosher KI & Wyss-Coray T Microglial dysfunction in brain aging and Alzheimer’s disease. Biochem. Pharmacol 88, 594–604 (2014). [DOI] [PMC free article] [PubMed] [Google Scholar]
- 4.Safaiyan S et al. Age-related myelin degradation burdens the clearance function of microglia during aging. Nat. Neurosci. 19, 995–998 (2016). [DOI] [PMC free article] [PubMed] [Google Scholar]
- 5.Ming GL & Song H Adult Neurogenesis in the Mammalian Brain: Significant Answers and Significant Questions. Neuron 70, 687–702 (2011). [DOI] [PMC free article] [PubMed] [Google Scholar]
- 6.Lazarov O & Marr RA Neurogenesis and Alzheimer’s disease: At the crossroads. Exp. Neurol 223, 267–281 (2010). [DOI] [PMC free article] [PubMed] [Google Scholar]
- 7.Ray S et al. Classification and prediction of clinical Alzheimer’s diagnosis based on plasma signaling proteins. Nat. Med 13, 1359–62 (2007). [DOI] [PubMed] [Google Scholar]
- 8.Villeda S et al. The ageing systemic milieu negatively regulates neurogenesis and cognitive function. Nature 477, 90–94 (2011). [DOI] [PMC free article] [PubMed] [Google Scholar]
- 9.Britschgi M et al. Modeling of pathological traits in Alzheimer’s disease based on systemic extracellular signaling proteome. Mol. Cell. Proteomics 10, M111.008862 (2011). [DOI] [PMC free article] [PubMed] [Google Scholar]
- 10.Villeda SA et al. Young blood reverses age-related impairments in cognitive function and synaptic plasticity in mice. Nat Med 20, 659–663 (2014). [DOI] [PMC free article] [PubMed] [Google Scholar]
- 11.Castellano JM et al. Human umbilical cord plasma proteins revitalize hippocampal function in aged mice. Nature 544, 488–492 (2017). [DOI] [PMC free article] [PubMed] [Google Scholar]
- 12.Katsimpardi L et al. Vascular and Neurogenic Rejuvenation of the Aging Mouse Brain by Young Systemic Factors. Science 344, 630–634 (2014). [DOI] [PMC free article] [PubMed] [Google Scholar]
- 13.Rebo J et al. A single heterochronic blood exchange reveals rapid inhibition of multiple tissues by old blood. Nat. Commun 7, 13363 (2016). [DOI] [PMC free article] [PubMed] [Google Scholar]
- 14.Engelhardt B & Liebner S Novel insights into the development and maintenance of the blood-brain barrier. Cell Tissue Res 355, 687–99 (2014). [DOI] [PMC free article] [PubMed] [Google Scholar]
- 15.Fabene PF et al. A role for leukocyte-endothelial adhesion mechanisms in epilepsy. Nat. Med 14, 1377–83 (2008). [DOI] [PMC free article] [PubMed] [Google Scholar]
- 16.Vivash L & OBrien TJ Imaging Microglial Activation with TSPO PET: Lighting Up Neurologic Diseases? J. Nucl. Med 57, 165–168 (2016). [DOI] [PubMed] [Google Scholar]
- 17.Gragnano F, Sperlongano S, Golia E, Natale F, Bianchi R, Crisci M, Fimiani F, Pariggiano I, Diana V, Carbone A, Cesaro A, Concilio C, Limongelli G, Russo M, and The PC Role of von Willebrand Factor in Vascular Inflammation: From Pathogenesis to Targeted Therapy. Mediators Inflamm 2017, (2017). [DOI] [PMC free article] [PubMed] [Google Scholar]
- 18.Rossi B, Angiari S, Zenaro E, Budui SL & Constantin G Vascular inflammation in central nervous system diseases: adhesion receptors controlling leukocyte-endothelial interactions. J. Leukoc. Biol 89, 539–56 (2011). [DOI] [PubMed] [Google Scholar]
- 19.Berlin C et al. α4 integrins mediate lymphocyte attachment and rolling under physiologic flow. Cell 80, 413–422 (1995). [DOI] [PubMed] [Google Scholar]
- 20.Garton KJ et al. Stimulated shedding of vascular cell adhesion molecule 1 (VCAM-1) is mediated by tumor necrosis factor-alpha-converting enzyme (ADAM 17). J. Biol. Chem 278, 37459–64 (2003). [DOI] [PubMed] [Google Scholar]
- 21.Pan J et al. Patterns of expression of factor VIII and von Willebrand factor by endothelial cell subsets in vivo. Blood 128, 104 LP–109 (2016). [DOI] [PMC free article] [PubMed] [Google Scholar]
- 22.Lee M et al. Transcriptional programs of lymphoid tissue capillary and high endothelium reveal control mechanisms for lymphocyte homing. Nat Immunol 15, 982–995 (2014). [DOI] [PMC free article] [PubMed] [Google Scholar]
- 23.Murakami M Signaling required for blood vessel maintenance: Molecular basis and pathological manifestations. Int. J. Vasc. Med 2012, (2012). [DOI] [PMC free article] [PubMed] [Google Scholar]
- 24.Daneman R et al. The mouse blood-brain barrier transcriptome: A new resource for understanding the development and function of brain endothelial cells. PLoS One 5, e13741 (2010). [DOI] [PMC free article] [PubMed] [Google Scholar]
- 25.Macdonald JA, Murugesan N & Pachter JS Endothelial cell heterogeneity of blood-brain barrier gene expression along the cerebral microvasculature. J. Neurosci. Res 88, 1457–1474 (2010). [DOI] [PubMed] [Google Scholar]
- 26.Vanlandewijck M et al. A molecular atlas of cell types and zonation in the brain vasculature. Nature 554, 475 (2018). [DOI] [PubMed] [Google Scholar]
- 27.Han J et al. Vascular Endothelial Growth Factor Receptor 3 Controls Neural Stem Cell Activation in Mice and Humans. Cell Rep 10, 1158–1172 (2015). [DOI] [PMC free article] [PubMed] [Google Scholar]
- 28.Fontaine RH et al. Vascular endothelial growth factor receptor 3 directly regulates murine neurogenesis. Genes Dev 25, 831–844 (2011). [DOI] [PMC free article] [PubMed] [Google Scholar]
- 29.Hosokawa Y, Hosokawa I, Ozaki K, Nakae H & Matsuo T Cytokines differentially regulate ICAM-1 and VCAM-1 expression on human gingival fibroblasts. Clin. Exp. Immunol 144, 494–502 (2006). [DOI] [PMC free article] [PubMed] [Google Scholar]
- 30.Zhang J et al. Regulation of Endothelial Cell Adhesion Molecule Expression by Mast Cells, Macrophages, and Neutrophils. PLoS One 6, e14525 (2011). [DOI] [PMC free article] [PubMed] [Google Scholar]
- 31.Bruunsgaard H, Pedersen M & Pedersen BK Aging and proinflammatory cytokines. Curr Opin Hematol 131, (2001). [DOI] [PubMed] [Google Scholar]
- 32.Sun BB et al. Consequences Of Natural Perturbations In The Human Plasma Proteome. bioRxiv (2017). [Google Scholar]
- 33.Shultz LD, Ishikawa F & Greiner DL Humanized mice in translational biomedical research. Nat Rev Immunol 7, 118–130 (2007). [DOI] [PubMed] [Google Scholar]
- 34.Ridder D a et al. TAK1 in brain endothelial cells mediates fever and lethargy. J. Exp. Med 208, 2615–23 (2011). [DOI] [PMC free article] [PubMed] [Google Scholar]
- 35.Kokovay E et al. VCAM1 is essential to maintain the structure of the SVZ niche and acts as an environmental sensor to regulate SVZ lineage progression. Cell Stem Cell 11, 220–30 (2012). [DOI] [PubMed] [Google Scholar]
- 36.Elices MJ et al. VCAM-1 on activated endothelium interacts with the leukocyte integrin VLA-4 at a site distinct from the VLA-4/Fibronectin binding site. Cell 60, 577–584 (1990). [DOI] [PubMed] [Google Scholar]
- 37.Miller DH et al. A Randomized, Placebo-Controlled Trial of Natalizumab for Relapsing Multiple Sclerosis. N. Engl. J. Med 354, 899–910 (2006). [DOI] [PubMed] [Google Scholar]
- 38.Chin JE et al. Airway recruitment of leukocytes in mice is dependent on alpha4-integrins and vascular cell adhesion molecule-1. Am. J. Physiol. Cell. Mol. Physiol 272, L219–L229 (1997). [DOI] [PubMed] [Google Scholar]
- 39.Montagne A, Zhao Z & Zlokovic BV Alzheimer’s disease: A matter of blood–brain barrier dysfunction? J. Exp. Med 214, 3151 LP–3169 (2017). [DOI] [PMC free article] [PubMed] [Google Scholar]
- 40.Obermeier B, Daneman R & Ransohoff RM Development, maintenance and disruption of the blood-brain barrier. Nat. Med 19, 1584–96 (2013). [DOI] [PMC free article] [PubMed] [Google Scholar]
- 41.Singh RJR et al. Cytokine stimulated vascular cell adhesion molecule-1 (VCAM-1) ectodomain release is regulated by TIMP-3. Cardiovasc. Res 67, 39–49 (2005). [DOI] [PubMed] [Google Scholar]
- 42.Tchalla AE et al. Elevated Soluble Vascular Cell Adhesion Molecule-1 Is Associated With Cerebrovascular Resistance and Cognitive Function. Journals Gerontol. Ser. A 72, 560–566 (2017). [DOI] [PMC free article] [PubMed] [Google Scholar]
- 43.Merat S, Fruebis J, Sutphin M, Silvestre M & Reaven PD Effect of aging on aortic expression of the vascular cell adhesion molecule-1 and atherosclerosis in murine models of atherosclerosis. journals Gerontol 55, B85–B94 (2000). [DOI] [PubMed] [Google Scholar]
- 44.Richter V et al. Circulating vascular cell adhesion molecules VCAM-1, ICAM-1, and E-selectin in dependence on aging. Gerontology 49, 293–300 (2003). [DOI] [PubMed] [Google Scholar]
- 45.Ballantyne CM & Entman ML Soluble Adhesion Molecules and the Search for Biomarkers for Atherosclerosis. Circulation 106, 766–767 (2002). [DOI] [PubMed] [Google Scholar]
- 46.Okugawa Y et al. Soluble VCAM-1 and its relation to disease progression in colorectal carcinoma. Exp. Ther. Med 1, 463–469 (2010). [Google Scholar]
- 47.Schlesinger M & Bendas G Vascular cell adhesion molecule-1 (VCAM-1)—An increasing insight into its role in tumorigenicity and metastasis. International Journal of Cancer 1, 2504–2514 (2015). [DOI] [PubMed] [Google Scholar]
- 48.Ewers M, Mielke MM & Hampel H Blood-based Biomarkers of Microvascular Pathology in Alzheimer’s disease. Exp. Gerontol 45, 75 (2010). [DOI] [PMC free article] [PubMed] [Google Scholar]
- 49.Matsuda M, Tsukada N, Miyagi K & Yanagisawa N Increased levels of soluble vascular cell adhesion molecule-1 ( VCAM-1) in the cerebrospinal fluid and sera of patients with multiple sclerosis and human T lymphotropic virus type-1-associated myelopathy. J. Neuroimmunol 59, 35–40 (1995). [DOI] [PubMed] [Google Scholar]
- 50.Elahy M et al. Blood-brain barrier dysfunction developed during normal aging is associated with inflammation and loss of tight junctions but not with leukocyte recruitment. Immun. Ageing 12, (2015). [DOI] [PMC free article] [PubMed] [Google Scholar]
- 51.Cook-Mills JM, Marchese ME & Abdala-Valencia H Vascular cell adhesion molecule-1 expression and signaling during disease: regulation by reactive oxygen species and antioxidants. Antioxid. Redox Signal. 15, 1607–38 (2011). [DOI] [PMC free article] [PubMed] [Google Scholar]
- 52.Vestweber D How leukocytes cross the vascular endothelium. Nat. Rev. Immunol 15, 692–704 (2015). [DOI] [PubMed] [Google Scholar]
- 53.Ritzel RM et al. Age-Associated Resident Memory CD8 T Cells in the Central Nervous System Are Primed To Potentiate Inflammation after Ischemic Brain Injury. J. Immunol 196, 3318 LP–3330 (2016). [DOI] [PMC free article] [PubMed] [Google Scholar]
- 54.Yousef H et al. Systemic attenuation of the TGF-β pathway by a single drug simultaneously rejuvenates hippocampal neurogenesis and myogenesis in the same old mammal. Oncotarget 6, 11959–11978 (2015). [DOI] [PMC free article] [PubMed] [Google Scholar]
- 55.Hu X-L et al. Persistent Expression of VCAM1 in Radial Glial Cells Is Required for the Embryonic Origin of Postnatal Neural Stem Cells. Neuron 95, 309–325 (2017). [DOI] [PubMed] [Google Scholar]
- 56.Erdő F, Denes L & de Lange E Age-associated physiological and pathological changes at the blood-brain barrier: A review. J. Cereb. Blood Flow Metab. 37, 4–24 (2017). [DOI] [PMC free article] [PubMed] [Google Scholar]
- 57.Montagne A et al. Blood-Brain barrier breakdown in the aging human hippocampus. Neuron 85, 296–302 (2015). [DOI] [PMC free article] [PubMed] [Google Scholar]
- 58.Bien-Ly N et al. Lack of Widespread BBB Disruption in Alzheimer’s Disease Models: Focus on Therapeutic Antibodies. Neuron 88, 289–297 (2015). [DOI] [PubMed] [Google Scholar]
- 59.Steffen BJ, Breier G, Butcher EC, Schulz M & Engelhardt B ICAM-1, VCAM-1, and MAdCAM-1 are expressed on choroid plexus epithelium but not endothelium and mediate binding of lymphocytes in vitro. Am. J. Pathol 148, 1819–1838 (1996). [PMC free article] [PubMed] [Google Scholar]
- 60.Vukovic J, Colditz MJ, Blackmore DG, Ruitenberg MJ & Bartlett PF Microglia modulate hippocampal neural precursor activity in response to exercise and aging. J Neurosci 32, 6435–6443 (2012). [DOI] [PMC free article] [PubMed] [Google Scholar]
REFERENCES (Methods-only)
- 61.Trapnell C et al. Differential analysis of gene regulation at transcript resolution with RNA-seq. Nat. Biotechnol 31, 46–53 (2013). [DOI] [PMC free article] [PubMed] [Google Scholar]
- 62.Engelhardt B, Vajkoczy P & Weller RO The movers and shapers in immune privilege of the CNS. Nat. Immunol 18, 123–131 (2017). [DOI] [PubMed] [Google Scholar]
- 63.Banks WA From blood-brain barrier to blood-brain interface: New opportunities for CNS drug delivery. Nat. Rev. Drug Discov 15, 275–292 (2016). [DOI] [PubMed] [Google Scholar]
- 64.Muggeo VMR Estimating regression models with unknown break-points. Stat. Med 22, 3055–71 (2003). [DOI] [PubMed] [Google Scholar]
- 65.Muggeo VMR segmented: An R package to Fit Regression Models with Broken-Line Relationships. R News 8, 20–25 (2008). [Google Scholar]
- 66.Yousef H, Czupalla CJ, Lee D, Butcher EC & Wyss-Coray T Papain-based Single Cell Isolation of Primary Murine Brain Endothelial Cells Using Flow Cytometry. Bio-protocol 8, e3091 (2018). [DOI] [PMC free article] [PubMed] [Google Scholar]
- 67.Xaio H, Banks WA, Niehoff ML & Morley JE Effect of LPS on the permeability of the blood–brain barrier to insulin. Brain Res 896, 36–42 (2001). [DOI] [PubMed] [Google Scholar]
- 68.Picelli S et al. Full-length RNA-seq from single cells using Smart-seq2. Nat. Protoc 9, 171 (2014). [DOI] [PubMed] [Google Scholar]
- 69.Darmanis S et al. A survey of human brain transcriptome diversity at the single cell level. Proc. Natl. Acad. Sci 112, 7285–7290 (2015). [DOI] [PMC free article] [PubMed] [Google Scholar]
- 70.Montesano R et al. Increased proteolytic activity is responsible for the aberrant morphogenetic behavior of endothelial cells expressing the middle T oncogene. Cell 62, 435–445 (1990). [DOI] [PubMed] [Google Scholar]
- 71.Czupalla CJ, Liebner S & Devraj K In Vitro Models of the Blood–Brain Barrier BT - Cerebral Angiogenesis: Methods and Protocols. in (ed. Milner R) 415–437 (Springer; New York, 2014). doi: 10.1007/978-1-4939-0320-7_34 [DOI] [PubMed] [Google Scholar]
- 72.Calabria AR, Weidenfeller C, Jones AR, de Vries HE & Shusta EV Puromycin-purified rat brain microvascular endothelial cell cultures exhibit improved barrier properties in response to glucocorticoid induction. J. Neurochem 97, 922–33 (2006). [DOI] [PubMed] [Google Scholar]
- 73.Luo J et al. Glia-dependent TGF-β signaling, acting independently of the TH17 pathway, is critical for initiation of murine autoimmune encephalomyelitis. J. Clin. Invest 117, 3306–3315 (2007). [DOI] [PMC free article] [PubMed] [Google Scholar]
- 74.Czupalla CJ, Yousef H, Wyss-Coray T & Butcher EC Collagenase-based Single Cell Isolation of Primary Murine Brain Endothelial Cells Using Flow Cytometry. Bio-protocol 8, e3092 (2018). [DOI] [PMC free article] [PubMed] [Google Scholar]
- 75.Luo J et al. Long-term cognitive impairments and pathological alterations in a mouse model of repetitive mild traumatic brain injury. Front. Neurol 5, 12 (2014). [DOI] [PMC free article] [PubMed] [Google Scholar]
- 76.Hoffmann A et al. High and Low Molecular Weight Fluorescein Isothiocyanate (FITC)-Dextrans to Assess Blood-Brain Barrier Disruption: Technical Considerations. Transl. Stroke Res 2, 106–111 (2011). [DOI] [PMC free article] [PubMed] [Google Scholar]
- 77.Kijanka G, Prokopowicz M, Schellekens H & Brinks V Influence of aggregation and route of injection on the biodistribution of mouse serum albumin. PLoS One 9, (2014). [DOI] [PMC free article] [PubMed] [Google Scholar]
- 78.van Meer P & Raber J Mouse behavioural analysis in systems biology. Biochem. J. 389, 593 LP–610 (2005). [DOI] [PMC free article] [PubMed] [Google Scholar]
- 79.Wolf A, Bauer B, Abner EL, Ashkenazy-Frolinger T & Hartz AMS A Comprehensive Behavioral Test Battery to Assess Learning and Memory in 129S6/Tg2576 Mice. PLoS One 11, e0147733 (2016). [DOI] [PMC free article] [PubMed] [Google Scholar]
- 80.Leger M et al. Object recognition test in mice. Nat. Protoc 8, 2531 (2013). [DOI] [PubMed] [Google Scholar]
Associated Data
This section collects any data citations, data availability statements, or supplementary materials included in this article.
Supplementary Materials
Data Availability Statement
RNA-seq gene lists with statistics (Fig. 1, Fig. 2, and Extended Data Fig. 1 and 2), full blots (Extended Data Fig.6), and individual data points graphed for Extended Fig. 9n are available as source data files and as Supplementary Tables 1-3 accompanying this article. Requests of datasets obtained from human research will be subject to additional review steps by the IRB that has granted permit for a particular research. Bulk and single cell RNA sequencing datasets that support the findings of this study have been deposited in NCBI GEO with the series accession record GSE127758 [with embedded accession codes GSM3638211 to GSM3638222]. Please contact the corresponding author for additional information.