

Summary
We demonstrate that concurrent administration of poly (ADP-ribose) polymerase (PARP) and WEE1 inhibitors is effective in inhibiting tumor growth but poorly tolerated. Concurrent treatment with PARP and WEE1 inhibitors induces replication stress, DNA damage, and abrogates the G2 DNA damage checkpoint in both normal and malignant cells. Following cessation of monotherapy with PARP or WEE1 inhibitors, effects of these inhibitors persist suggesting that sequential administration of PARP and WEE1 inhibitors could maintain efficacy while ameliorating toxicity. Strikingly, while sequential administration mirrored concurrent therapy in cancer cells that have high basal replication stress, low basal replication stress in normal cells protected them from DNA damage and toxicity, thus improving tolerability while preserving efficacy in ovarian cancer xenograft and PDX models.
Graphical Abstract
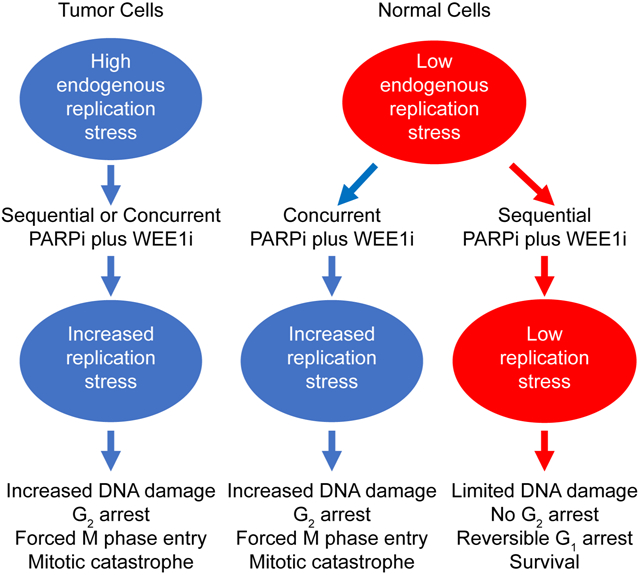
Fang et al. show that sequential inhibition of PARP (PARPi) and WEE1 or ATR has anti-tumor efficacy similar to concurrent treatment but reduced toxicity due to the persistence of DNA damage upon removal of PARPi and differences in basal replication stress between tumor and normal cells, respectively.
Introduction
Aberrant DNA damage responses (DDR) and replication stress (RS) result in accumulation of DNA damage contributing to tumor initiation and progression (Dobbelstein and Sorensen, 2015; Macheret and Halazonetis, 2015; O’Connor, 2015). Oncogene-induced RS, with associated hyperproliferation and excessive replication origin firing, causes accumulation of single strand break (SSB) as well as double strand breaks (DSBs) as a consequence of stalling and collapse of replication forks (RFs) (Branzei and Foiani, 2010; Burrell et al., 2013). Stalled RF decouple replicative helicase from polymerase with a subsequent increase in single strand DNA (ssDNA) that can potentially lead to RPA exhaustion resulting in replication catastrophe in S phase (Beck et al., 2012; Parsels et al., 2018; Toledo et al., 2017; Toledo et al., 2013). ssDNA activates a multi-faceted ATR-dependent RS response including RF protection from nucleases, decreased global replication origin firing, activation of the RRM2 component of ribonucleotide reductase for deoxy-nucleotide (dNTP) production and resolution of stalled RFs via fork regression and restart and/or DNA repair, thus maintaining genomic stability (Berti and Vindigni, 2016). ATR can also activate a S/G2 cell cycle checkpoint to prevent progression of cells with underreplicated DNA (Saldivar et al., 2018). Unrepaired DNA damage can be resolved before entering mitosis through activation of the G2 cell cycle checkpoint. Abrogation of the G2 checkpoint can allow cells with unrepaired DNA damage to enter into premature mitosis resulting in mitotic catastrophe (Haynes et al., 2018; Kawabe, 2004; Shaltiel et al., 2015; Toledo et al., 2017).
Due to aberrant p53 signaling, which abrogates the G1 checkpoint, many cancer cells demonstrate an increased dependence on S and G2 DNA damage checkpoints (Kawabe, 2004). Thus, blocking S and G2 DNA damage checkpoints represent a promising antitumor therapeutic strategy (Castedo et al., 2004; Hayashi and Karlseder, 2013; O’Connor, 2015). Indeed, potent inhibitors of ATR, ATM, CHK1, CHK2 and WEE1, which are key components of the S and G2 checkpoints, are under clinical evaluation. The relative contribution of RS or abrogation of S and G2 DNA damage checkpoints and HR repair to their efficacy remains to be fully elucidated (Buisson et al., 2015; Forment and O’Connor, 2018; Yazinski and Zou, 2016). Furthermore, optimal S and G2 checkpoint targets, particularly in combinations, have not been ascertained (Brown et al., 2017; Leijen et al., 2016a; Leijen et al., 2016b; Ricks et al., 2015; Zhou et al., 2017). This family of compounds has been poorly tolerated in early clinical trials, resulting in termination of a number of candidates or implementation of dose schedules that may limit antitumor efficacy (Do et al., 2015; McNeely et al., 2014; Pilie et al., 2018; Weber et al., 2016).
Poly (ADP-ribose) polymerase (PARP) maintains genomic integrity through SSB repair, regulation of fork stability and RS and repair of one-ended DSB that result from collapsed replication forks (Forment and O’Connor, 2018; Patel et al., 2011; Pommier et al., 2016). PARP1 auto-PARylation leads to its dissociation from DNA, facilitating SSB repair by providing access to repair proteins. The approved PARP inhibitors (PARPi) prevent auto-PARylation and trap PARP on DNA blocking RF progression (Pommier et al., 2016), which can result in DSB. In order to maintain genomic integrity, multiple mechanisms have evolved to repair DSB with homologous recombination (HR) being the only high fidelity DSB break repair process with other DSB repair processes resulting in genomic instability that can lead to cell death. The ability of PARPi to generate DSB that can lead to cell death in HR defective cells such as those with abnormalities in BRCA1 or BRCA2, but not in cells with intact HR, represents a form of synthetic lethality (Ashworth, 2008).
Strong rationale exists for combined therapy with PARP and WEE1 inhibitors. WEE1 is overexpressed and associated with patient outcomes in many cancer types, including ovarian, glioblastoma and breast cancer (Iorns et al., 2009; Mir et al., 2010; Slipicevic et al., 2014). ATR pathway inhibitors, including WEE1i, increase CDK1 activity with subsequent aberrant replication firing, RS, nucleotide deprivation and DSB generation (Beck et al., 2012; Haynes et al., 2018; Parsels et al., 2018; Toledo et al., 2017; Toledo et al., 2013). WEE1i can also abrogate G2 arrest, causing cells with unrepaired DNA damage to enter into mitosis and undergo mitotic catastrophe (De Witt Hamer et al., 2011; Geenen and Schellens, 2017). WEE1i can compromise homologous recombination (HR) through CDK1-mediated phosphorylation of BRCA1 and BRCA2 (Buisson et al., 2017; Drean et al., 2017; Esashi et al., 2005). PARPi induce RS and DNA damage resulting in G2 arrest (Jelinic and Levine, 2014; Kim et al., 2017). WEE1i and PARPi have demonstrated antitumor activity in a number of preclinical models (George et al., 2017; Lallo et al., 2018; Lin et al., 2018; Meng et al., 2018; Parsels et al., 2018). However, overlapping WEE1i and PARPi toxicity profiles suggest it may be challenging to develop combinations, which has been largely confirmed in early clinical trials (Erika Paige Hamilton, 2016; Pilie et al., 2018).
Results
Effects of PARP and WEE1 inhibitors on functional proteomics
We assessed effects of olaparib, a trapping PARPi, and adavosertib, a selective WEEli on total and phosphoprotein levels using reverse phase protein arrays (RPPA) across an array of cell lineages and genomic aberrations (Figures S1 and S2) (see STAR Methods). As protein expression in monolayer (2D) or Matrigel (3D) across doses and time points were highly correlated (Figures S3A and S3B), we combined RPPA data from all conditions (Figures 1A and 1B). Olaparib increased expression or phosphorylation (indicated by “p”) of multiple proteins involved in S and G2 DNA damage checkpoints including Cyclin B1, pRB, pWEE1, CDK1, FOXM1, CHK1/pCHK1, CHK2/pCHK2, ATM/pATM (Figure 1A), recapitulating results with the trapping PARPi talazoparib (Sun et al., 2017), consistent with effects being on target and generalizable. Reflecting the proteomics data, talazoparib induced a dose-dependent G2-M arrest in cancer cell lines (Figure 1C).
Figure 1. PARPi and WEE1i alter protein expression.

(A) Cells were treated with olaparib or DMSO for 3 or 7 days, and protein lysates analyzed for 218 total and phosphoproteins by RPPA. Heatmap represents “rank ordered” changes induced by olaparib by summing median centered protein levels normalized to control. Proteins with consistent decreases are at top (green) and increases are at bottom (red) of y-axis of the heat map.
(B) Cells were treated with DMSO or adavosertib and protein lysates analyzed for 305 total and phosphoproteins by RPPA. Heatmap representation is as in (A).
(C) Representative cell lines were treated with talazoparib for 24 hr and analyzed for cell cycle progression.
(D) OVCAR8 were treated with adavosertib for 24 hr and analyzed for cdc2Y15 and FOXM1 by western blot. Bands were quantified by ImageJ and normalized by ERK2 protein. Intensity values are relative to DMSO.
(E) Cells were treated with indicated compounds for 24 hr and analyzed as in (D).
See also Figures S1-S3.
When cell lines were split into PARPi resistant and sensitive based on olaparib IC50 (Figure S3C), sensitive lines were enriched in mutations in genes involved in HR (BRCA1, ARID1A and ATR), and PI3K signaling (PIK3CA and PTEN). Expression of multiple PI3K pathway components was associated with PARPi sensitivity (Figure S3D). It is unclear whether association of PI3K pathway activity with PARPi sensitivity is direct or reflects a role of PTEN in HR (Konstantinopoulos et al., 2015; Mendes-Pereira et al., 2009). In sensitive lines, PARPi decreased PARP1, indicative of target engagement, increased Cyclin B1 and Cyclin E1, consistent with altered cell cycle progression and RS, and increased BAX, contributing to apoptotic sensitivity (Figure S3E). PARPi effects occurred irrespective of BRCA1/2 and TP53 mutation status.
Adavosertib downregulated its direct target cdc2pY15 indicative of target engagement and also decreased FOXM1, Cyclin E1 and Rad51, consistent with aberrant cell cycle regulation (Figure 1B). H2AXpS140 (γH2AX) and cleaved caspase 7 were increased, reflecting accumulation of DNA damage and induction of apoptosis. Increased γH2AX could be due to RS induction causing DNA damage or G2 checkpoint abrogation decreasing opportunity for DNA repair. Consistent with WEE1i increasing RS or activating a feedback loop, we observed increased pATR and pCHK1/2, which are activated down-stream of SSDNA produced by RS.
PARP and WEE1 inhibition induced opposite effects on two key mitotic gatekeepers cdc2Y15 and FOXM1 consistent with PARPi inducing and WEE1i abrogating G2 arrest (Figures 1D, 1E, S3F and S3G). In combinations, WEE1i overrode the effects of PARPi on cdc2Y15 and FOXM1 protein expression (Figure 1E).
WEE1 inhibition abrogates G2 arrest induced by PARPi and concurrent PARPi and WEE1i therapy induces mitotic catastrophe
PARP inhibition induced a G2 arrest (Figure 2A). WEE1 inhibition increased M phase cells and overrode PARP inhibition promoting entry into M phase (Figure 2A), which was confirmed by western blotting for Cyclin B1, an indicator of G2 arrest, and pH3, an indicator of mitosis (Figure 2B). Similar to WEE1i, both CHK1/2i inhibitors (CHK1/2i, AZD7762) and ATR inhibitors (ATRi, AZD6738) caused PARPi-treated cells to enter M phase (Figures S4A and S4B). Thus, inhibition of multiple G2 checkpoint components overrode PARPi-induced G2 blockade and forced entry of PARPi-treated cells into mitosis.
Figure 2. PARPi and WEE1i alter cell cycle progression and death.

(A) OVCAR8 were treated with DMSO, PARPi, adavosertib, or concurrent treatment for 24 hr and subjected to pH3 and PI flow cytometric analysis.
(B) Cells were treated with DMSO, talazoparib, adavosertib, or concurrent treatment for 24 hr, and western blotted with Cyclin B1 and pH3. Bands were quantified by ImageJ and normalized by ERK2. Intensity values are relative to DMSO.
(C, D) OVCAR8 were exposed to DMSO, talazoparib (0.5 μM), adavosertib (0.5 μM), or concurrent treatment for 24 hr. Cells were stained for γH2AX, pH3 and DAPI (C), or cleaved-caspase3 (clv-caspase3), pH3 and DAPI (D). Scale bar, 25 μM.
(E) Quantification of pH3+, γH2AX+/pH3+, or cleaved-caspase 3+/pH3+cells. For each condition, at least 300 cells were counted. Results are mean±SEM of three independent experiments. p value: Student’s t test.
(F) Representative images of OVCAR8 exposed to DMSO, talazoparib (0.5 μM), adavosertib (0.5 μM), or combination for 0 or 12 hr with medium containing IncuCyte Caspase-3/7 reagent. Red arrowheads indicate mitotic cells. Scale bar, 50 μm.
G2-M blockade induced by talazoparib with or without adavosertib persisted and, in some regimens, increased for at least 12 hr after drug removal. Between 12 and 24 hr, with low dose but not high dose talazoparib, the G2-M cell number decreased and G1 cells increased (Figure S4C). Thus, cell cycle blockade induced by PARPi in the presence or absence of adavosertib is maintained after drug removal.
In synchronized cells, both talazoparib and adavosertib monotherapy delayed cell cycle progression, potentially due to induction of RS (Figure S4D). With talazoparib entry into G2 was delayed and cells did not exit into M phase. In contrast, adavosertib treatment increased M phase cell numbers. Consistent with adavosertib overriding PARPi-induced G2 arrest, M phase cell numbers were markedly increased by concurrent talazoparib and adavosertib treatment.
Talazoparib markedly decreased whereas adavosertib modestly increased the proportion of pH3+ mitotic cells. In contrast, concurrent talazoparib and adavosertib inhibition massively increased the proportion of pH3+ cells (Figures 2C–2E). None of the talazoparib-treated pH3+ cells were γH2AX+ (DNA damage) or cleaved caspase 3+ (apoptosis). WEE1i modestly increased the percentage of γH2AX+ or cleaved caspase 3+ in pH3+ cells. Concurrent PARPi and WEE1i treatment markedly increased the proportion of γH2AX+ or cleaved caspase 3+ in pH3+ cells (Figures 2C-2E). The majority of cleaved caspase 3+ cells were also pH3+ suggesting that apoptosis induced by WEE1i alone or by concurrent PARPi and WEE1i mainly occurred in M phase.
Using IncuCyte live cell analysis, PARPi decreased M phase entry, as indicated by detached rounded cells, whereas WEE1 or ATR inhibition modestly increased M phase entry (Movie S1). As expected, concurrent PARP and WEE1 or ATR inhibition markedly increased M phase cell numbers and induced apoptosis (Figures 2F and S4E-S4H). Taken together, PARPi combined with G2 DNA damage checkpoint inhibition induces mitotic catastrophe and subsequent cell death through apoptosis.
PARP and WEE1 inhibition is effective but poorly tolerated
For 20 of 24 ovarian cell lines encompassing multiple histologic types and mutational profiles, concurrent PARPi and WEE1i therapy was synergistic, with 12 lines showing a combination index (CI) less than 0.5 (Figure 3A). In PARPi sensitive cells, WEE1i addition did not induce synergy. PARPi and WEE1i synergism was most clearly manifest in KRAS or BRAF mutant cells (Figure 3B), which may, in part, be due to KRAS or BRAF mutant cell lines being resistant to PARPi (Sun et al., 2017). When cell lines were split based on CI<0.5, only ATM mutation was associated with marked synergy (p=0.042).
Figure 3. PARP and WEE1 inhibition is synergistic.

(A) Drug response curves for cells treated with talazoparib and adavosertib combinations for 7 days in 3D culture. Data are presented as relative PrestoBlue signal to control. Error bars represent SEM of three independent experiments.
(B) CI values of ovarian cancer cell lines with selected mutations. Black indicates mutation; gray no mutation. Cell lines were divided into synergistic (CI<0.5) and non-synergistic (CI>0.5) groups. Presence or absence of mutation was compared by Student’s t test. *p<0.05.
(C) 2×10⁶ OVCAR8 were injected subcutaneously (s.c.) and grown for 2 weeks in nude mice. Mice were randomized with 6 in each group and treated as indicated. Average tumor volume±SEM (left) and mouse weight±SEM (right) are displayed. p value: one-way ANOVA. **p<0.01.
OVCAR8 xenografts were resistant to talazoparib at the dose used and demonstrated only a modest response to adavosertib, but their growth was inhibited by concurrent PARPi and WEE1i (Figure 3C). However, prolonged PARPi and WEE1i therapy resulted in weight loss and anemia requiring therapy cessation at 28 days (Figure 3C). Following cessation of combination therapy, tumors began to grow, particularly those treated with lower adavosertib doses (Figure 3C). Importantly, combination therapy toxicity was reversible as mice gained weight following treatment cessation (Figure 3C).
DNA damage and activation of DNA damage checkpoints persist in vitro and in vivo
Toxicity of the combination reflects challenges in identifying clinically tolerable dosing schedules for WEE1i alone and, in particular, combinations of PARPi with WEE1i, ATRi, or CHK1/2i. DNA repair by HR is relatively slow suggesting that DNA damage and DNA damage checkpoint induction might persist after drug removal, which is consistent with data shown in Figure S4C. We therefore hypothesized that drug sequencing could maintain efficacy while potentially ameliorating toxicity.
PARPi-induced proteomic changes accumulated over a 7-day culture period (Figure 4A) that mainly persisted following PARPi removal (Figure 4B). Indeed, signatures at 7 days of treatment and 7 days after PARPi removal were highly correlated (Figure 4C). CDK1 and Cyclin B1 increases persisted after talazoparib removal (Figures 4D and 4E) and Cyclin B1 and γH2AX increases persisted after removal of both high (talazoparib) and low (veliparib) trapping PARPi (Figure 4F).
Figure 4. PARPi induced DNA damage and G2-M DNA damage checkpoint activation persists.

(A-B) OVCAR8 in 3D culture were treated with 30 nM or 60 nM talazoparib for indicated times (A) or treated for 7 days before drug wash out and re-culture without drugs for indicated time (B) before analysis by RPPA. Heat map is represented as in Figure 1A.
(C) Protein changes ordered by talazoparib treatment (left column) from (A) and after talazoparib removal (right column) from (B).
(D-E) Expression ratios (treated vs control) of Cyclin B1 (D) and CDK1 (E) at each concentration and time point of talazoparib treatment from RPPA data. “p” represents post-treatment.
(F) OVCAR8 were treated with talazoparib, veliparib, or DMSO in 3D matrigel culture for 7 days, then washed out and re-cultured for 7 days, and western blotted with Cyclin B1 and γH2AX.
(G) 2×10⁶ OVCAR8 were injected s.c. and grown for 3 weeks in nude mice. Vehicle, talazoparib, olaparib, adavosertib were dosed daily to randomized cohorts for 7 days and then stopped. Tumor was obtained from 5-6 mice per group at indicated time points.
(H) IHC with FFPE whole-tumor sections for Cyclin B1. Representative images are from indicated time point.
(I) IHC protein levels from (H) are displayed as fold change for treatment groups compared to vehicle from each time point.
(J) IHC performed from FFPE whole-tumor sections for γH2AX. Representative images are from indicated time points.
(K) Protein levels from IHC from (J) are displayed as fold change for treatment groups compared to vehicle from each time point.
All data are mean±SEM and Scale bar, 50 μm.
Moreover, PARPi-induced Cyclin B1 and γH2AX increases persisted post-treatment cessation in vivo (Figures 4G-K). WEE1i also induced persistent DNA damage in vivo (Figures 4G-K) potentially due to induction of RS and subsequent DNA damage and/or due to decreased DNA damage repair. Thus, both PARPi and WEE1i induce accumulation of DNA damage in vivo that persists after therapy cessation.
We subsequently compared talazoparib or veliparib followed by treatment with WEE1i to concurrent therapy with both inhibitors. With sequential therapy, PARPi induced G2 arrest was largely mitigated, with marked entry into mitosis similar to that observed with concurrent therapy (Figures 5A-5C and S5A). Both sequential and concurrent therapies induced DNA damage in over 80% of mitotic cells (Figures 5B-5D), consistent with WEE1i driving cells with persistent DNA damage into M phase. In addition, sequential therapy increased apoptosis compared to either drug alone albeit slightly less than that induced by concurrent therapy (Figure S5B). Consistent with RS induction, both sequential and concurrent therapies reduced fork speed (Figures 5E and 5F). Importantly, sequential therapy was as effective in blocking cell growth as concurrent therapy with high- and low-trapping PARPi and WEE1i or ATRi in cancer cells (Figures 5G, S5C and S5D). A 7 days preincubation with talazoparib, adavosertib or AZD6738 sensitized cells to a subsequent 7 days incubation with the other inhibitor (Figures 5H and S5E). Thus, the order of PARP or WEE1 addition does not alter efficacy.
Figure 5. Sequential treatment with PARPi and WEE1i is effective in vitro.

(A) Cells were treated with 1-vehicle, 2-talazoparib (250 nM), 3-adavosertib (250 nM), 4-sequential and 5-concurrent treatment and subjected to pH3 and PI flow cytometric analysis.
(B, C) Representative images (B) and quantification (C) of OVCAR8 treated as in (A) stained for γH2AX, pH3 and DAPI. Scale bar, 50 μm. For each condition, at least 300 cells were counted. Data are mean±SEM.
(D) OVCAR8 were treated as in (A) and subjected to Comet analysis. DNA damage is quantified as percentage DNA in tails from 3 independent experiments. Scale bar, 10 μm. Data are mean±SD.
(E, F) OVCAR8 (E) and U2OS (F) cells were treated as in (A) and subjected to DNA fiber analysis. Scale bar, 10 μm. Mean fork speed (kb min−1) is indicated. Data are mean±SD.
(G) Cells were treated with indicated drugs for 14 days, except for sequential therapy that consisted of PARPi for 7 days followed by the other drug for 7 days. Representative photos of colonies stained with crystal violet. Data are mean±SEM.
(H) Cells were pretreated with DMSO or 30 nM talazoparib for 7 days followed by adavosertib (upper), or pretreated with vehicle, 120 nM adavosertib or 240 nM adavosertib for 7 days followed by talazoparib (lower). Data are mean±SEM.
Data across panels are Student’s t test: *p<0.05, **p<0.01, ***p<0.001, ****p<0.0001, n.s.: not significant. See also Figure S5.
Sequential treatment with PARPi and WEE1i ameliorates toxicity to normal cells in vitro
In both MCF-10A mammary epithelial cells and primary human bone marrow-derived mesenchymal stem cells (BM-MSCs), concurrent PARPi and WEE1i was toxic, which was largely mitigated by sequential treatment (Figure 6A). We thus sought to identify processes underlying differential sensitivity of normal cells to concurrent and sequential PARPi and WEE1i.
Figure 6. Sequential treatment of PARPi and WEE1i is less toxic to normal cells in vitro.

(A) Representative photos of colony formation of MCF-10A and BM-MSC treated with different drugs as in Figure 5G stained with crystal violet (upper) or sulforhodamine B (lower).
(B) MCF-10A and BM-MSC were treated as in Figure 5A and subjected to pH3 and PI flow cytometric analysis.
(C, D) Representative images (C) and quantification (D) of MCF-10A cells treated as in Figure 5A and then stained for γH2AX, pH3 and DAPI. Scale bar, 50 μm. Data are mean±SEM.
(E) MCF-10A were treated as in Figure 5A and subjected to Comet analysis. DNA damage is quantified as percent DNA in tails. Scale bar, 10 μm. Data are mean±SD.
(F, G) MCF-10A (F) and BM-MSC (G) were treated as in Figure 5A and subjected to DNA fiber analysis. Scale bar, 10 μm. Mean fork speed (kb min−1) is indicated. Data are mean±SD.
(H) MCF-10A were treated with HU for 24 hr before incubation with EdU. Each dot represents a single cell, inset is %EdU+.
(I) MCF-10A were treated as in Figure 5A with 50 μM HU for 24 hr and subjected to DNA fiber analysis. Mean fork speed (kb min−1) is indicated. Data are mean±SD.
(J) BM-MSC were treated with HU for 24 hr before incubation with EdU. Each dot represents a single cell, inset is %EdU+.
(K) BM-MSC were treated as in Figure 5A with 50 μM HU for 24 hr and subjected to DNA fiber analysis. Mean fork speed (kb min−1) is indicated. Data are mean±SD.
(L) MCF-10A and MCF-10A with doxycycline inducible Cyclin E expression (MCF10A-iCCNE1) were incubated with or without doxycycline (Dox) for 24 hr and subjected to Western blot analysis.
(M) MCF10A-iCCNE1 were incubated with or without Dox for 24 hr and analyzed by EdU flow cytometry. Each dot represents a single cell, inset is %EdU+.
(N, O) MCF10A-iCCNE1 were incubated without Dox (N) or with Dox (O) for 24 hr and then treated as in Figure 5A, and subjected to DNA fiber analysis. Mean fork speed (kb min−1) is indicated. Data are mean±SD.
Data across panels are Student’s ttest: *p<0.05, **p<0.01, ***p<0.001, ****p<0.0001, n.s.: not significant. See also Figure S5.
Concurrent PARPi and WEE1i therapy of MCF-10A induced DNA damage, G2 arrest and entry of cells with DNA damage into M phase similar to tumor cells (Figures 6B-6D). However, sequential therapy did not induce these effects in MCF-10A, but rather induced a G1 arrest (Figure 6B). Further DNA damage induced by sequential treatment was less than that induced by concurrent treatment and M phase MCF-10A were not γH2AX+ (Figures 6C-6E).
In BM-MSCs, talazoparib monotherapy or concurrent therapy induced a modest G2-M arrest that was not present with sequential therapy (Figure 6B). Similar to MCF-10A, concurrent but not sequential therapy induced DNA damage (Figures S5F and S5G). Once again, concurrent but not sequential therapy resulted in many cells carrying DNA damage into M phase.
As concurrent PARPi and WEE1i treatment induced significantly more toxicity than sequential therapy in normal cells, we hypothesized that decreased sequential therapy toxicity may be related to decreased RS induction. This was supported by a lower DNA damage with sequential therapy compared to concurrent therapy. Importantly, both MCF-10A and BM-MSCs have lower basal RS than tumor cells (Fork speed of 1.09 kb min−1 in MCF-10A, and 1.27 kb min−1 in BM-MSCs versus 0.92 kb min−1 in OVCAR8, 0.98 kb min−1 in U2OS) (Figures 5E, 5F, 6F and 6G). Following concurrent treatment, fork speed was decreased in both tumor and normal cells to approximately the same levels (0.34 kb min−1 in OVCAR8, 0.36 kb min−1 in U2OS versus 0.38 kb min−1 in MCF-10A, and 0.27 kb min−1 in BM-MSCs). Critically, sequential therapy had different effects on RS in tumor and normal cell models. Indeed, following sequential therapy, fork speed was only modestly decreased in normal cells (0.75 kb min−1 in MCF-10A, and 0.79 kb min−1 in BM-MSCs) resulting in levels that were only slightly lower than fork speed in untreated cancer cells (0.92 kb min−1 in OVCAR8, 0.98 kb min−1 in U2OS) (Figures 5E, 5F, 6F and 6G). Similar results were observed in OVCAR8 and MCF-10A with BrdU single strand DNA staining as a further indication of RS (Figures S5H and S5I). In the same study, pRPA32 staining confirmed that both sequential and concurrent therapy increased RS in OVCAR8, whereas concurrent but not sequential therapy induced RS in MCF-10A (Figures S5H and S5I). Together, these data indicate that normal cells have less basal RS than tumor cells and that normal cells undergo less RS and DNA damage on sequential therapy compared to concurrent therapy.
We manipulated basal RS to test whether differential responses of normal and tumor cells to sequential therapy was due to differences in basal RS. 50 μM hydroxyurea (HU), that induces RS by depleting nucleotides, was chosen as it decreased fork speed in MCF-10A and BM-MSCs to levels (Figures 6H-6K) similar to basal fork speed in tumor cells (Figures 5E and 5F). In the presence of HU, both PARPi and WEE1i sequential and concurrent therapy induced similar fork speed decreases in both MCF-10A and BM-MSCs (Figures 6I and 6K). Further, in BM-MSCs, HU increased γH2AX induced by sequential therapy, DNA damage being carried into M phase (Figures S5F and S5G). Similarly, Cyclin E induced increases in basal RS rendered MCF-10A sensitive to sequential PARPi and WEE1i induced RS (Figures 6L-6O). Thus, increased basal RS renders normal cells sensitive to sequential PARPi and WEE1i induced RS.
Suppression of RRM2 can deplete dNTPs and induce RS (Pfister et al., 2015). Although concurrent PARPi and WEE1i slightly decreased RRM2 in OVCAR8, neither sequential nor concurrent PARPi and WEE1i obviously changed RRM2 in OVCAR3, CAOV3 and MCF-10A (Figure 7A). Thus, RRM2 does not appear to be critical for influencing the therapeutic index of sequential therapy.
Figure 7. Differential effects of sequential and concurrent PARPi and WEE1i treatment.

(A) Cells were treated with DMSO, talazoparib (250 nM), adavosertib (250 nM), sequentially or concurrently at indicated concentrations for 24 hr and western blotted.
(B) MCF-10A were treated for 24 hr, drugs washed out, cells re-cultured and cell cycle assessed by flow cytometry.
(C-E) MCF-10A were transfected with control or p53 siRNA for 48 hr. Cells were trypsinized and siRNA effect was assessed by western blot (C). Cell cycle was assessed by FITC BrdU as treated in Figure 6B (D), or for cell viability after 6 days (E).
(F) OVCAR8 xenografts were treated as indicated. p values: one-way ANOVA. **p<0.01.
(G) Analysis of talazoparib and olaparib combined (day 28) or sequential with WEE1i in OVCAR8 xenograft mice from day 42. Hemoglobin and red blood cells (RBC) from peripheral blood. Bone marrow cell count from bone marrow smear (Wright’s stain) per oil immersion field (100x). Student’s t test: n.s.: not significant, *p<0.05, **p<0.01.
(H) Different drug-treated tumors were re-cultured in vitro for 5-7 days and then analyzed for sensitivity to PARP or WEE1 inhibition alone or in combination.
Data across panels are mean±SEM.
In response to sequential therapy, MCF-10A underwent G1 arrest (Figure 6B), which could contribute to decreased toxicity. Following sequential drug removal, the G1 arrest was reversible as cells re-entered the cell cycle (Figure 7B). However, following concurrent drug removal, MCF-10A continued to accumulate at G2-M consistent with ongoing DNA damage (Figure 7B). We assessed whether p53 function was required for G1 blockade in MCF-10A. Knockdown of p53 did not markedly alter cell cycle patterns (Figures 7C and 7D) and induced modest resistance to both sequential and concurrent therapy (Figure 7E). p53-independent G1 arrest has been observed in multiple other model systems (McGrail et al., 2018; Ohta et al., 2005).
Sequential administration of PARPi and WEE1i preserves efficacy and increases tolerability in vivo
Consistent with talazoparib and adavosertib (Figure 3C), olaparib or adavosertib monotherapy had only modest activity in OVCAR8 xenografts, whereas concurrent therapy was effective but toxic requiring treatment termination at 28 days (Figure 7F). Strikingly, sequential therapy of 7 days olaparib followed by 7 days adavosertib, or with a 1-day rest period between therapies, preserved efficacy without substantial toxicity as assessed by weight loss throughout the 42-day treatment period (Figure 7F).
Concurrent, but not sequential, talazoparib or olaparib and adavosertib therapy decreased hemoglobin and red blood cell counts indicative of anemia and decreased bone marrow cellularity (Figure 7G). Thus, concurrent therapy induces anemia that is ameliorated by sequential therapy.
Cells cultured from treated OVCAR8 tumors retained sensitivity to PARPi or WEE1i alone or in combination (Figure 7H). Thus, sequential therapy does not appear to induce drug resistance.
Concurrent PARPi and WEE1i therapy of an ovarian high-grade serous carcinoma (HGSOC, TP53S241C and BRCA1/2 wild type, Table S1) model (PDX1) was effective but weight loss at 21 days required treatment termination. Weight loss continued for 7 days post therapy termination but was reversible returning to normal 2 weeks later. Tumor growth inhibition also persisted following treatment termination but tumors eventually regrew in all mice (Figure 8A). We also explored continuous dosing of talazoparib with 2 days of adavosertib bid on day 6 and 7 of each week similar to the clinical schedule. This schedule, although effective, resulted in weight loss that required therapy termination (Figure 8A). Talazoparib monotherapy for prolonged periods also led to weight loss requiring therapy termination (Figure 8A). In contrast, sequential therapy with talazoparib for one week followed by adavosertib for one week controlled tumor growth for 105 days without weight loss.
Figure 8. Sequential administration of PARPi and WEE1i is effective and tolerable.

(A) Tumor volume and mouse body weight of PDX1 receiving indicated treatments (n=6 for each group). Group 4 and 7 were stopped on day 28 due to weight loss; group 3 and 6 were stopped on day 42 due to limited efficacy; group 2 was stopped on day 49 due to weight loss. Group 5 was continued throughout the study. Tumors from group 2, 3, 6, 7 were treated with group 5 sequential treatment strategy starting on day 70.
(B) Tumor volume and mouse body weight of PDX2 receiving indicated treatments (n=5 for each group). Group 4 was stopped on day 21 for weight loss.
(C) Tumor volume and mouse body weight of PDX3 receiving indicated treatments (n=5 for each group). On day 28, Group 1 was changed to intermittent dosing with adavosertib. Group 2 was changed to sequential treatment (5 days treatment and 2 days rest with each drug) on day 28. Group 3 was stopped due to weight loss on day 49. Because results from the two sequential regimens were similar, tumor volume data was combined and compared to adavosertib monotherapy. Differences in tumor volume data were determined by ANOVA at termination of study (p=0.041).
Data across panels are mean±SEM. p values were determined by ANOVA. **p<0.01.
We terminated adavosertib monotherapy, as well as 5 days of talazoparib followed by 2 days of adavosertib due to tumor growth (Figure 8A). At day 70, we initiated sequential talazoparib and adavosertib in models in which treatments had been stopped to determine whether sequential therapy would retain efficacy or reinstitute toxicity in previously treated models (Figure 8A). In each case, sequential talazoparib and adavosertib caused tumor regression, despite large PDX size at initiation of sequential therapy, and was not toxic. While adavosertib monotherapy-treated mice responded rapidly to sequential therapy, responses were variably delayed where mice had received talazoparib alone or in combination potentially due to PARPi resistance engendered by the initial PARPi therapy.
Genomic analysis of sequential therapy treated tumors at 105 days detected only modest changes in detected mutation patterns (Figure S6A and Table S2). One of 5 mice had a BRCA1E1413G aberration, which is not in Cosmic or TCGA and is not known to be functionally relevant. An acquired mutation in otherwise wild type BRCA1 would be expected to increase rather than decrease PARPi efficacy. Thus, mutations do not appear to explain the modest tumor growth noted after 105 days of sequential therapy. Copy number variations (CNV) were primarily deletions (Table S3) associated with changes in “cancer pathways” and, in particular, in PI3K-AKT and DNA damage response pathways including the HR and Fanconi anemia pathways (Figures S6B and S6C).
Sequential therapy decreased WEE1 and WEE1pS642, Cyclin B1 and PLK1 protein (Figure S6D), consistent with continued adavosertib activity and with WEE1i continuing to bypass PARPi-induced G2 arrest during prolonged sequential treatment. Interestingly, ACC1 and ACC1ps79 and FASN that regulate lipid biosynthesis were decreased, consistent with energy stress. Moreover, SLFN11, a marker of PARPi response, was also increased by sequential treatment (Figure S6D).
Effects of concurrent and sequential therapy were recapitulated in a rapidly growing TP53 and BRCA1/2 wild type ovarian cancer model (PDX2) (Figure 8B and Table S4). Response to sequential therapy was delayed, however, tumor control was maintained for the 42 days treatment period without weight loss. Concurrent treatment was terminated for weight loss on day 21.
We initiated therapy when tumors reached 880-1400 mm3 in a TP53G279W/P278A and BRCA1E404G HGSOC model (PDX3) (Figure 8C and Table S5). Concurrent PARPi and WEE1i therapy was omitted due to toxicity. This model was olaparib-resistant despite the BRCA1 mutation and demonstrated exquisite adavosertib sensitivity. Adavosertib monotherapy resulted in weight loss on day 49 requiring therapy termination. Two different sequential therapy regimens were effective and without toxicity in this model: 6 days of each inhibitor with a 1 day rest or 5 days of each inhibitor with a 2 day rest between inhibitors. Following olaparib and adavosertib sequential therapy termination on day 70, tumor control was maintained for the 126 days observation period.
We switched olaparib monotherapy mice to sequential (olaparib 5 days + rest 2 days + adavosertib 5 days + rest 2 days) therapy on day 28 when tumors were growing progressively. In these large tumors, there was no response during the first week of olaparib therapy followed by a marked response with sequential adavosertib with tumors becoming essentially undetectable at 70 days. Following sequential therapy cessation on day 70, tumor control persisted to day 105, at which time a number of tumors progressed. As a control, we switched vehicle treated mice to adavosertib monotherapy, following the sequential therapy approach on day 28 (vehicle 5 days + rest 2 days + adavosertib 5 days + rest 2 days). In these large tumors, adavosertib induced a modest size decrease followed by continued tumor growth. Thus, while continuous adavosertib was highly effective but toxic in this model, an adavosertib monotherapy schedule mimicking the sequential approach was not effective.
We also evaluated an ID8 intraperitoneal syngeneic immunocompetent mouse model. Intermittent monotherapy adavosertib dosing of 3 days per week similar to ongoing clinical schedules had no significant effect, while continuous dosing efficacy was modest (Figure S6E). In this immunocompetent model, sequential dosing with olaparib and adavosertib effectively decreased intraperitoneal tumor growth, however, efficacy was not greater than that observed in immunoincompetent mouse PDX models.
Sequential administration of PARPi and ATRi is effective and tolerable in ovarian cancer PDX models
Monotherapy with talazoparib or the ATRi (AZD6738) only modestly decreased tumor growth in TP53 wild type and BRCA1/2 wild type PDX2 (Figure S6F). Although combined talazoparib and AZD6738 therapy controlled tumor growth, weight loss required treatment termination at 28 days (Figure S6F). Importantly, sequential talazoparib and AZD6738 therapy controlled tumor growth throughout the treatment period without significant toxicity (Figure S6F).
In TP53S241C and BRCA1/2 wild type PDX1 where tumors had reached a large size (300-500mm3) olaparib and AZD6738 monotherapy decreased tumor growth but did not cause regressions likely due to the large initial tumor volume (Figure S6G). Continuous olaparib and AZD6738 was omitted due to toxicity. Both 7 days olaparib and AZD6738 sequential treatment and 5 days of olaparib followed by a 2 days rest then 5 days of AZD6738 and a 2 days rest caused delayed but marked tumor regression without evident weight loss (Figure S6G). Thus, sequential PARPi and ATRi therapy retains efficacy without concomitant toxicity.
Discussion
Concurrent therapy with PARPi and WEE1i at doses mimicking monotherapy doses in clinical trials led to weight loss requiring cessation of therapy in animal models, consistent with multiple human clinical trials that have struggled to identify efficacious doses without attendant toxicity. PARPi and WEE1i monotherapy induced DNA damage and G2 arrest was maintained and, in many cases increased, after removal of drugs. This provided a rationale to explore sequential therapy with the two inhibitors. Strikingly, sequential administration of PARP and WEE1 inhibitors retained the efficacy of concurrent therapy in multiple models while ameliorating toxicity of the combination.
Our data are compatible with a model wherein due to high endogenous RS in cancer cells, both sequential and concurrent therapy with PARPi and WEE1i (or ATRi) further increase RS with subsequent DNA damage and cell death. In normal cells that have low endogenous DNA damage and RS (Hustedt and Durocher, 2016; O’Connor, 2015), concurrent therapy with PARPi and WEE1i (or ATRi) induces RS and DNA damage culminating in cell death. In contrast, in normal cells sequential PARPi and WEE1i therapy induced minimal increases in RS and consequent DNA damage and cell death. Importantly, induction of baseline RS levels in normal cells to similar levels present in cancer cells resulted in increased RS, DNA damage, and cell death upon sequential PARPi and WEE1i therapy. Together, these data argue that endogenous RS in tumor cells, but not in normal cells, underlies efficacy of sequential PARPi and WEE1i therapy in tumors, while ameliorating toxicity in normal cells. Amplification of CCNE1 and oncogenic stress contributes to RS with RS occurring in approximately 30% of all tumors (Bartkova et al., 2006; Chen et al., 2018; McGrail et al., 2018). Thus, ongoing RS or overexpression or amplification of CCNE1 could select patients likely to benefit from sequential PARP and WEE1 inhibitor therapy.
WEE1i, through aberrant CDK activation, results in unscheduled replication origin firing and depletes dNTPs and replication factors (Beck et al., 2012; Parsels et al., 2018; Toledo et al., 2017; Toledo et al., 2013) as well as causing progression of cells with unrepaired DNA damage into M phase (Haynes et al., 2018). The energy requirements for synthesis of dNTPs and DNA repair during RS and DNA damage repair may contribute to energetic stress in PARPi and WEE1i-treated tumors that could contribute to efficacy of the combination. WEE1i increased pATR and pCHK1 levels, suggesting that WEE1i-induced increases in ssDNA activate ATR or that WEE1i activates a feedback loop. Thus, WEE1i likely alters both ATR and CHK1 function while blocking WEE1 could further an imbalance in S and G2 checkpoint regulation. Thus, while RS appears to underlie efficacy of PARPi and WEE1i combinations, there may be additional processes that contribute.
Synergistic activity of PARPi and WEE1i as well as PARPi and ATRi combinations was observed in multiple ovarian cancer models encompassing different histologic subtypes and underlying genomic aberrations (Kim et al., 2017). Although PARPi are most effective in HR deficient tumors (Pilie et al., 2018), HR deficiency was not required to manifest PARP and WEE1 inhibitor synergism. While G1 checkpoint abrogation by TP53 mutation can sensitize cells to WEE1i (Hirai et al., 2009), combination activity was independent of TP53 mutation status. Similar efficacy of combinations of two different PARP trapping and one low-trapping PARPi with WEE1i or ATRi across multiple cell models argues for generalizability.
Sequential administration of PARP and WEE1 inhibitors markedly prolonged the depth and duration of response compared to either inhibitor alone with acceptable toxicity, and indeed resulted in prolonged tumor control following cessation of therapy. Based on the studies herein, patients that have ovarian cancers with different genetic backgrounds and histologies as well as patients previously treated with PARPi are likely to benefit from this approach. Assessing the sequential administration of PARPi and WEE1i in the clinic should therefore now be prioritized in order to optimize the use of these compounds to maximize patient benefit.
STAR★METHODS
CONTACT FOR REAGENT AND RESOURCE SHARING
Further information and requests for resources and reagents should be directed to and will be fulfilled by the Lead Contact: Yong Fang (fangyo@ohsu.edu).
EXPERIMENTAL MODEL AND SUBJECT DETAILS
Animal Studies
All manipulations were approved by MD Anderson Cancer Center (MDACC) Institutional Animal Care and Use Committee (IACUC) under protocol number 00001463-RN00. Mice were randomized to different treatment groups, without blinding. Study groups were followed until either individual tumors or entire cohort measurements reached 2 cm, at which point sacrifice was performed in accordance with Institutional Animal Care and Use Committee (IACUC) protocols. Weight loss of 20% led to therapy termination based on IACUC protocols.
Patient Derived Xenografts (PDXs)
PDXs were established from consented ovarian cancer patient’s samples; the research was done with appropriate approval by the Clinical Investigation Ethical Committee of UT M.D. Anderson, Houston, TX. Sequencing was performed in the CLIA laboratory for the PDX1 and PDX3 and on the T200.2 (322 cancer related genes including genes associated with HR) platform in the Institute for Personalized Cancer Therapy (IPCT) genomic laboratory at UT M.D. Anderson, Houston, TX. Based on the combined CLIA and research data: The PDX1 was TP53S241C and BRCA1/2 wild type. Sequencing of PDX2 (without germline data available) demonstrated known SNPs in ATMD1853N, TP53P72R and BRCA1K1183R that are likely germline and benign. The PDX2 is thus designated as TP53 wild type and BRCA1/2 wild type. The PDX3 was TP53G279W/P278A and BRCA1E404G. Detailed research sequencing information is in Tables S1, S4 and S5.
Cell Lines
Cell lines were from MDACC Characterized Cell Line Core unless designated otherwise. All human cell lines were authenticated by fingerprinting using short tandem repeat testing and were verified to be free of mycoplasma contamination. All cell lines were maintained in a 5% CO2 incubator at 37°C. Primary bone marrow derived-human mesenchymal stem cells (MSCs) were obtained from Texas A&M Regenerative Medicine Center and cultured in alpha-MEM supplemented with 20% FBS and 1% L-glutamine. All analysis was performed on MSCs between passage 2 and passage 6 to ensure stem cell quality (McGrail et al., 2013).
METHOD DETAILS
RPPA
10 human cancer cell lines of different cancer types with a broad range of genomic aberrations [BT474 (PIK3CAK111N and ERBB2Amp), HCC1954 (PIK3CAH1047R, TP53Y163C and ERBB2Amp), HCC1937 (BRCA1G1756P, TP53A306T), MDA-MB-468 (EGFRAmp , PTENc.253+1G>T, TP53A273H), IGROV-1 (BRCA1L654fs*47, TP53T126C), TOV21G (PIK3CA H1047Y and KRASG13C), KLE (TP53Mut), ETN-1 (PTENR130L), SKBr3 (ERBB2Amp), SKOV3 (PIK3CAH1047R and TP53S90fs*33)] were cultured for 7 days in matrigel (3D) or 3 days in monolayer (2D) cultures with doses of olaparib, and 9 ovarian cancer cell lines [HOC8 (BRCA1K1183R and TP53Y234C), OVCAR8 (TP53Y126K and KRASP121H of unknown significance), CAOV3 (TP53Q136Ter), UWB1.289+BRCA1 (TP53D825E and BRCA1 reconstituted), UWB1.289 (TP53D825E and BRCA1Null), OVCAR5 (TP53P72R and KRASG12V), HOC7 (BRCA1K1183R, TP53C275F and KRASG12V), SKOV3 (TP53S90fs*33, PIK3CAH1047A and HER2Amp)] were cultured with a selective adavosertib at an IC50 concentration determined experimentally for each line for 2D and 3D conditions for 6 hr, 16 hr, or 48 hr. Protein lysates were analyzed by RPPA in MDACC Cancer Center Support Grant supported RPPA Core. Antibodies and approaches are described at the RPPA website (https://www.mdanderson.org/research/research-resources/core-facilities/functional-proteomics-rppa-core.html). Heat map represents “rank-ordered” changes induced by each treatment, calculated by summing median-centered protein amount normalized to DMSO. Proteins with consistent decreases are at the top (green) and increases are at the bottom (red) of the y-axis of the heat map.
Flow Cytometry
For cell cycle, cells were fixed in ice-cold 70% ethanol overnight, samples were washed twice with PBS, permeabilized with 0.25% Triton X-100 in PBS for 15 min, and blocked using 1% BSA. Subsequently, cells were incubated with specific antibodies against phospho-Histone H3 (Ser-10) overnight at 4°C. Next, cells were washed three times with PBS and incubated with secondary antibody conjugated to AlexaFluor 488 for 1 hr (Figures 2A, S4A and S4B). In Figures 5A, 6B and S5A, AlexaFluor 488 antibody conjugated pH3 from CST was used overnight at 4°C. Finally, cells were stained with 20 μg/ml propidium iodide (PI) in the presence of 100 μg/ml RNaseA. All samples were analyzed on a FACS Gallios Flow Cytometer (Beckman Coulter). At least 50,000 events were assessed per measurement. For apoptosis, cells were harvested by trypsinization, washed with ice-cold PBS, and finally resuspended in binding buffer. The Dead Cell Apoptosis Kit (Life Technologies) was used as recommended by the manufacturer to stain cells for Annexin V, as well as propidium iodide (PI). After 20 min of incubation in the dark, samples were analyzed on a FACS Gallios Flow Cytometer (Beckman Coulter). Apoptosis was calculated as the fractional difference of Annexin V/PI double-positive population in treated and untreated samples. At least 50,000 events were assessed per measurement. For S phase, the FITC BrdU Flow Kit (BD Biosciences) was used. Samples were analyzed on FACS BD LSRFortessa™ cell analyzer. At least 50,000 events were assessed per measurement.
Western Blot
Cells were lysed with RIPA buffer (Thermo Fisher Scientific) supplemented with Halt™ Protease and Phosphatase Inhibitor (EDTA-free) Cocktail (Thermo Fisher Scientific). After thorough mixing and incubation at 4°C for 10 min, lysates were centrifuged at 15,000 g at 4°C for 15 min, and supernatants collected. Protein content of lysates was determined, and lysates separated by 10% SDS-PAGE, and electro-transferred onto polyvinylidene difluoride (PVDF) membranes. After blocking with 5% non-fat milk in TBST, membranes were incubated with primary antibodies at 4°C overnight, followed by 1:2 000 horseradish peroxidase (HRP)-conjugated secondary antibody (Thermo Fisher Scientific) for 1 hr. Bands were visualized using Pierce ECL Western Blotting Substrate (Thermo Fisher Scientific).
Immunofluorescence Staining
Cells were grown to 30% confluency in 8-well chambers, then treated with indicated drugs. After treatment, cells were fixed with 4% paraformaldehyde for 10 min at room temperature, followed by permeabilization with 0.5% NP-40 and 1% Triton X-100 for 30 min. Cells were then blocked with 5% BSA and incubated with primary antibody (anti-phospho-Histone H3 (Ser-10), 1:200; anti-γH2AX (S140), 1:200; anti-cleaved caspase 3, 1:200; anti-RPA32-pS4/8, 1:500; anti-BrdU, 1:200) overnight, followed by secondary antibody incubation for 1 hr at room temperature. Slides were sealed in mounting medium containing DAPI (Vector Laboratories, H1200) for image acquisition. Cells were observed via Olympus FV1000 confocal laser scanning microscopy (Figures 2C and 2D) or Zeiss spinning disk microscopy (Figures 5B, 6C and S5H). For foci staining, following extraction of insoluble proteins by sequential incubation in cytoskeletal buffer (10 mM Pipes pH 6.8, 100 mM NaCl, 300 mM sucrose, 3 mM MgCl2, 1 mM EGTA, 0.5% Triton-X100) and stripping buffer (10 mM TrisHCl pH 7.4, 10 mM NaCl, 3 mM MgCl2, 1% Tween 40, 0.25% sodium deoxycholate) cells were fixed with formaldehyde. Fixed cells were permeabilized with 1% Triton-X100, blocked in 5% horse serum, and then stained for double strand breaks by γH2AX and mitotic maker pH3. Cells were imaged by fluorescence microscopy (Eclipse TE2000E, Nikon), capturing all images for a given replicate simultaneously to assure no variances in light intensity. For quantification, foci and nuclei were segmented, and then the integrated intensity of all foci normalized to cell area was taken as staining intensity. All analysis was performed in MATLAB (MathWorks).
RNA Interference
siRNA control and siRNA p53 were ON-TARGET plus siRNA SMARTpools purchased from GE Dharmacon. RNA interference (RNAi) transfections were performed using Lipofectamine RNAiMAX Transfection Reagent (Invitrogen) in a forward transfection mode using manufacturer’s guidelines. siRNAs were transfected at 40 nM final concentration.
Double Blocking Assay
Cells were grown to 30% confluency in 6-well plates. Thymidine was added to a final concentration of 2 mM, cells incubated for 18 hr and then thymidine removed by washing with 1×PBS followed by culture in fresh medium for 9 hr. After 9 hr, thymidine was added for another 15 hr. Cells were released by washing with 1×PBS followed by culture with fresh medium with indicated drugs for cell cycle analysis.
IncuCyte Imaging System
OVCAR8 cells were either exposed to DMSO or talazoparib (0.5 μM), adavosertib (0.5 μM), AZD6738 (2.5 μM) or combination with medium containing IncuCyte Caspase-3/7 reagent (Cat. 4440). Images were captured every 15 min in the IncuCyte system. The movie represents images from each treatment every 2 hr.
Viability Measurements
For 2D culture, cells were seeded into 96-well plates and treated with drugs. For 3D culture, 96-well plates were coated with matrigel, cells seeded and medium changed on day 3. Drugs were added for indicated times and concentrations. PrestoBlue was used to assess cell viability. Background values from empty wells were subtracted, and data normalized to vehicle-treated control. Synergistic effects between both compounds were calculated using the CalcuSyn software using the Chou-Talalay equation, which considers both potency (IC50) and shape of the dose-effect curve. CI<0.5 indicates synergism, and CI>0.5 indicates no synergism.
Immunohistochemical Staining (IHC)
IHC staining was performed as previously described (Sun et al., 2018). Formalin-fixed, paraffin-embedded tissues were sectioned at 4 μm and mounted on coated glass slides. Tissue sections were subjected to antigen retrieval and then stained using Dako EnVision + Dual Link system-HRP (DAB+) kit. After mounting, slides were observed under a microscope and pictures taken. Tumor cell staining was assigned a score using a semi-quantitative five-category grading system: 0, no tumor-cell staining; 1, 1-10% tumor-cell staining; 2, 11-25% tumor-cell staining; 3, 26-50% tumor-cell staining; 4, 51-75% tumor-cell staining; and 5, > 75% tumor-cell staining. Staining intensity was assigned a score using a semi-quantitative four-category grading system: 0, no staining; 1, weak staining; 2, moderate staining; and 3, strong staining. Every core was assessed individually and the mean of three readings was calculated for every case. Tumor cell staining score was determined separately by two independent experts under the same conditions. In rare cases, discordant scores were reevaluated and scored on the basis of consensus opinion.
DNA fiber assay
Cells were treated with indicated drugs before fiber analysis (Jackson and Pombo, 1998). First, cells were labeled with 25 μM CldU (1:1 000 from 25 mM stock) for 20 min, washed once with equilibrated medium, and labeled with 250 μM IdU (1:200 from 50 mM stock) for 40 min at 37°C. For MSC assays, conditioned media from an MSC monolayer was used. Cells were collected by trypsinization and resuspended in ice-cold PBS at 5×10⁵ cells/ml. 200 μl of spreading buffer (200 mM Tri-HCl pH7.4, 50 mM EDTA, 0.5% SDS) was added and mixed in each sample, and then 5 μl suspension was pipetted onto a microscope slide. DNA was allowed to run down the slide slowly, air-dried and fixed in methanol/acetic acid (3:1) for 10 min. Slides were washed with H2O, allowed to dry, and then denatured in 2N HCl for 30 min. Slides were washed with PBS and incubated in blocking solution (PBS containing 1% BSA and 0.1% Tween) for 1 hr, and incubated with Rat anti-BrdU [clone BU1/75 (ICR1), Abcam] antibody (1:600 dilution) and Mouse anti-BrdU antibody [clone B44, BD Biosciences] (1:300 dilution) overnight at 4°C. Slides were washed with PBS and fixed in 4% paraformaldehyde for 10 min. After rinsing, the slides were incubated in anti-Rat AlexaFluor 488 antibody (1:500 dilution) and anti-Mouse AlexaFluor 568 antibody (1:500 dilution) for 1 hr at room temperature. After washing, the slides were mounted in Vectashield and analyzed using a Nikon Eclipse TE100.
EdU Staining
Cells were treated with specified doses of hydroxyurea (Sigma) for 24 hr before incubation with 10 mM EdU (CarboSynth) for 20 min. Cells were fixed with formalin, permeabilized with 1% Triton X-100 (Sigma), before performing a click reaction to biotinylate incorporated EdU in 10 mM sodium ascorbate (Sigma), 10 μM Azide-PEG3-biotin (Sigma), and 2 mM CuSO4 (Ricca) for 20 min. After washing, cells were blocked in 1% BSA and then labeled with AlexaFluor 594-conjugated Streptavidin (Molecular Probes). Images were collected on a Nikon Eclipse TE200 microscope and quantified using MATLAB.
Alkaline Single-Cell Electrophoresis (Comet) Assays
Slides were coated with 0.3% agarose and allowed to dry. Cells were treated as described, suspended in low-melting temperature agarose, immediately pipetted onto coated slides and then topped with a glass coverslip. After allowing polymerization at 4°C, coverslips were removed and cells incubated for 12 hr in cold lysis buffer (2.5 M NaCl, 100 mM EDTA, 1% Triton X-100, 10 mM Tris, pH 10). Before electrophoresis, DNA was unwound in 0.3 M NaOH and 2 mM EDTA, and then equilibrated in alkaline running buffer (30 mM NaOH, 2 mM EDTA). Electrophoresis was carried out at 0.7 V/cm for 25 min at 4°C. DNA was stained with propidium iodide, imaged on a Nikon Eclipse TE200 microscope, and quantified using Comet Score v1.6.1.11 (TriTek).
Colony Formation Assay
Cells were seeded in six-well plates (2.5-5×10³ per well) and allowed to adhere overnight. Cells were treated with indicated drugs. Remaining cells were fixed with formaldehyde (4%) for 15 min, stained with 0.5% crystal violet or sulforhodamine B, and photographed using a digital scanner.
Re-culture of Cells from Xenografts
Tumors were minced using sterile scalpels and then treated with collagenase. Cells were cultured in T25 flasks for about 3-5 passages when there were no visible fibroblast cells prior to use. Mouse Experiments
OVCAR8 xenografts
2×10⁶ OVCAR8 cells were injected s.c. into flanks of athymic nude mice (female, 6-8 weeks) in a 1:1 mix of PBS and Matrigel. Mice were randomized into treatment cohorts and drugs administered daily by oral gavage (n = 5-6 per group). Tumor size and mouse weight were measured every week. Tumor volumes were calculated using tumor volume = 1/2(length × width2). In Figure 3C, mice were randomized into treatment cohorts as: vehicle (0.5% methylcellulose or 10% DMSO in (2-Hydroxypropyl)-β-cyclodextrin/PBS solution), talazoparib (0.333 mg/kg/QD), adavosertib (60 mg/kg/QD), adavosertib (100 mg/kg/QD) or the combination of talazoparib and adavosertib (60 mg/kg/QD) or the combination of talazoparib and adavosertib (100 mg/kg/QD); In Figure 7F, mice were randomized into treatment cohorts as: vehicle (0.5% methylcellulose or 10% DMSO in (2-Hydroxypropyl)-β-cyclodextrin/PBS solution), olaparib (50 mg/kg/QD), adavosertib (100 mg/kg/QD), combination of olaparib and adavosertib, sequential olaparib and adavosertib (each drug for 7 days or each drug for 6 days with 1 day rest as indicated).
ID8 intraperitoneal model
3×10⁶ luciferized ID8 cells were injected into the peritoneal cavity of C57BL/6 mice (female, 6–8 weeks). Mice were randomized into treatment cohorts as: vehicle (0.5% methylcellulose or 10% DMSO in (2-Hydroxypropyl)-β-cyclodextrin/PBS solution), olaparib (50 mg/kg/QD), adavosertib (60 mg/kg/QD), sequential olaparib and adavosertib (each drug for 7 days). Drugs were administered daily by oral gavage (n = 5-6 per group). Tumor progression was monitored using a Xenogen IVIS Spectrum in vivo bioluminescence imaging system. Tumor volume was determined on the basis of the total flux (photons per s). Mice reaching a humane endpoint or weighing more than 35 g as a result of tumor growth and/or ascites were sacrificed for analysis.
Patient Derived Xenografts (PDXs)
NSG™ mice (Jackson stock 005557) were used. A small incision of about 0.5 cm was made mid dorsal and a pocket (1.5 cm × 1 cm) created under the skin. Minced fresh tumor tissue (0.1 cm3 per mouse) was placed in the pocket. The incision was closed using surgical wound clips (9 mm). Mice were randomly assigned into different treatment groups. Tumor size and mouse weight were measured every week. Tumor volumes were calculated using tumor volume = 1/2(length × width2).
T200.2 exome sequencing
DNA was obtained from different treated tumors using a DNA extraction kit (Qiagen). Library preparation, target enrichment and sequencing were performed using T200.2 in Institute for Personalized Cancer Therapy (IPCT) genomic laboratory at UT M.D. Anderson, Houston, TX. All classes of genomic alterations, including base substitutions, insertions and deletions (indels), copy number alterations (CNAs) and rearrangements were detected. T200.2 target-capture deep-sequencing data was aligned to human reference assembly hg19 using BWA(Li and Durbin, 2009) and duplicated reads removed using Picard(DePristo et al., 2011). Single nucleotide variants (SNVs) and small indels were called using an in-house developed analysis pipeline, which classified variants into 3 categories: somatic, germline, and loss of heterozygosity based on variant allele frequencies in tumor and matched normal tissues. Copy number alterations were called using a previously published algorithm(Lonigro et al., 2011), which reports gain or loss status of each exon. To evaluate the potential functional consequence of detected variants, they were compared with dbSNP, COSMIC, and TCGA databases, and annotated using VEP, Annovar, CanDrA and other algorithms assessing likely deleterious aberration. Next, we performed functional enrichment analysis by DAVID. All genes in the analysis were used as background. Kyoto Encyclopedia of Genes and Genomes (KEGG) pathways and biological processes in Gene Ontology (GO) were assessed. The pathways and biological processes with p-adjusted<0.05 were considered significant.
QUANTIFICATION AND STATISTICAL ANALYSIS
Two-sided Student’s t test was used to compare differences between two groups of cells in vitro. Data are presented as means ± SEM or means ± SD and p<0.05 is considered significant. Correlation between groups was determined by Pearson’s correlation test. Analysis of variance (ANOVA) was used to compare differences among multiple groups. Data were analyzed and plotted using GraphPad Prism 7 software. Statistical parameters including sample size and statistical significance are reported in the figures and corresponding figure legends.
DATA AND SOFTWARE AVAILABILITY
The T200.2 exome sequencing data generated in this study is available in the Sequence Read Archive (SRA) under accession number SRP159022. Raw data from this manuscript: https://www.ncbi.nlm.nih.gov/sra/docs/
Supplementary Material
Movie S1, related with Figure 2. Real-time imaging of effects of PARPi and WEE1i or ATRi on cell cycle progression and cell death.
OVCAR8 were exposed to DMSO or talazoparib (0.5 μM), adavosertib (0.5 μM), AZD6738 (2.5 μM) or combination with medium containing IncuCyte Cleaved Caspase-3/7 reagent (green). Images were captured every 15 min in the IncuCyte system. The movie collected images from every 2 hr.
Table S1, related with Figure 8. Somatic mutations in PDX1.
Table S2, related with Figure 8. Somatic mutations in treated PDX1 samples (control vs sequential).
Table S3, related with Figure 8. Copy number variation in treated PDX1 samples (control vs sequential).
Table S4, related with Figure 8. Somatic mutations in PDX2.
Table S5, related with Figure 8. Somatic mutations in PDX3.
KEY RESOURCES TABLE
| REAGENT or RESOURCE | SOURCE | IDENTIFIER |
|---|---|---|
| Antibodies | ||
| ERK2 | Santa Cruz Biotechnology | sc-154 |
| Cyclin B1 | Santa Cruz Biotechnology | sc-245 |
| Cdc2Y15 | Cell Signaling Technology | 4539 |
| Cleaved Caspase-3 | Cell Signaling Technology | 9661 |
| FOXM1 | Cell Signaling Technology | 5436 |
| Cyclin E, clone HE12 | Santa Cruz | sc-247 |
| Tet R | Abcam | ab25845 |
| β-actin, clone AC-15 | Sigma | A3854 |
| Anti-γH2A.X (phospho S140) antibody | Abcam | ab22551 |
| phospho-Histone H3 (Ser-10) | Abcam | ab5176 |
| Phospho-Histone H3 (Ser10) (Alexa Fluor® 488) | Cell Signaling Technology | 3465 |
| Phospho RPA32 (S4/S8) Antibody | Bethyl Laboratories | A300-245A |
| Anti-p53R2 + RRM2 antibody | Abcam | ab209995 |
| Anti-BrdU antibody [BU1/75 (ICR1)] | Abcam | ab6326 |
| Anti-BrdU (B44) | BD Biosciences | 347580 |
| Goat Anti-Rabbit Alexa Fluor® 488 (IgG H&L) | Abcam | ab150077 |
| Goat Anti-Mouse Alexa Fluor® 568 (IgG H&L) | Abcam | ab175471 |
| Goat Anti-Rabbit Alexa Fluor® 568 (IgG H&L) | Abcam | ab175471 |
| Goat Anti-Rabbit IgG H&L (Alexa Fluor® 647) | Abcam | ab150079 |
| Goat Anti-mouse IgG H&L (Alexa Fluor® 647) | Abcam | ab150115 |
| Anti-Mouse IgG, HRP-linked | Thermo Fisher Scientific | 62-6520 |
| Anti-Rabbit IgG, HRP-linked | Thermo Fisher Scientific | 65-6120 |
| RPPA antibodies | RPPA Core Facility, MD Anderson Cancer Center | https://www.mdanderson.org/research/research-resources/corefacilities/functional-proteomics-rppa-core.html |
| Biological Samples | ||
| Patient Derived Xenografts (PDXs) | UT M.D. Anderson | N/A |
| Chemicals, Peptides, and Recombinant Proteins | ||
| Talazoparib | Selleck Chemicals | S7048 |
| Olaparib | Institute of Applied Cancer Science (IACS) at UT M.D. Anderson, Houston, TX. | N/A |
| Veliparib | Selleck Chemicals | S1004 |
| Adavosertib | Institute of Applied Cancer Science (IACS) at UT M.D. Anderson, Houston, TX. | N/A |
| AZD6738 | Institute of Applied Cancer Science (IACS) at UT M.D. Anderson, Houston, TX. | N/A |
| AZD7762 | Selleck Chemicals | S1532 |
| ON-TARGETplus Non-targeting Control Pool | Dharmacon | D-001810-10-05 |
| ON-TARGETplus Human TP53 (7157) siRNA | Dharmacon | L-003329-00-0005 |
| Propylene Glycol | Sigma-Aldrich | P4347 |
| (2-Hydroxypropyl)-beta-cyclodextrin | Sigma-Aldrich | 332593 |
| Methyl cellulose | Sigma-Aldrich | M0262 |
| Collagenase/Hyaluronidase | STEMCELL Technologies | 07912 |
| CldU | Sigma-Aldrich | C6891 |
| ldU | Sigma-Aldrich | I7125 |
| EdU | CarboSynth | NE08701 |
| Copper Sulfate | Ricca | 2317-16 |
| Azide-PEG3-Biotin | Sigma | 762024 |
| Sodium Ascorbate | Sigma | 11140 |
| Low-Melt Agarose | Lonza | 50100 |
| Critical Commercial Assays | ||
| Pierce™ ECL Western Blotting Substrate | Thermo Fisher Scientific | 32106 |
| RIPA Lysis and Extraction Buffer | Thermo Fisher Scientific | 89900 |
| Crystal violet solution | Sigma-Aldrich | HT90132-1L |
| Halt™ Protease and Phosphatase Inhibitor Cocktails | Thermo Fisher Scientific | 78441 |
| PrestoBlue® Cell Viability Reagent | Thermo Fisher Scientific | A-13262 |
| EnVision Detection Systems Peroxidase/DAB, Rabbit/Mouse,150 tests | Agilent | K4065 |
| FxCycle™ PI/RNase Staining Solution | Thermo Fisher Scientific | F10797 |
| IncuCyte® Caspase-3/7 Reagent for Apoptosis | Essen BioScience | 4440 |
| MATRIGEL MATRIX GFR 10ML | VWR International | 47743-720 |
| Dead Cell Apoptosis Kit | Life Technologies | V13245 |
| Antifade Mounting Medium with DAPI | Vector Laboratories | H1200 |
| FITC BrdU Flow Kit (RUO) | BD Biosciences | 559619 |
| Lipofectamine® RNAiMAX Reagent | Thermo Fisher Scientific | 13778 |
| Thermo Scientific Nunc 177445 Chamber Slide | Thermo Fisher Scientific | 01838-27 |
| Deposited Data | ||
| T200.2 exome processed sequencing data | This paper | See Tables S1-S5 |
| T200.2 exome raw sequencing data | Sequence Read Archive (SRA) | SRA accession: SRP159022 |
| Experimental Models: Cell Lines | ||
| BT474 | MDACC Characterized Cell Line Core | N/A |
| HCC1937 | MDACC Characterized Cell Line Core | N/A |
| HCC1954 | MDACC Characterized Cell Line Core | N/A |
| MDA-MB-468 | MDACC Characterized Cell Line Core | N/A |
| TOV21G | MDACC Characterized Cell Line Core | N/A |
| IGROV-1 | MDACC Characterized Cell Line Core | N/A |
| KLE | MDACC Characterized Cell Line Core | N/A |
| ETN-1 | MDACC Characterized Cell Line Core | N/A |
| SKBr3 | MDACC Characterized Cell Line Core | N/A |
| SKOV3 | MDACC Characterized Cell Line Core | N/A |
| HOC8 | MDACC Characterized Cell Line Core | N/A |
| OVCAR8 | MDACC Characterized Cell Line Core | N/A |
| CAOV3 | MDACC Characterized Cell Line Core | N/A |
| UWB1.289+BRCA1 | MDACC Characterized Cell Line Core | N/A |
| UWB1.289 | MDACC Characterized Cell Line Core | N/A |
| OVCAR5 | MDACC Characterized Cell Line Core | N/A |
| HOC7 | MDACC Characterized Cell Line Core | N/A |
| OVISE | MDACC Characterized Cell Line Core | N/A |
| MCAS | MDACC Characterized Cell Line Core | N/A |
| ES2 | MDACC Characterized Cell Line Core | N/A |
| HEYA8 | MDACC Characterized Cell Line Core | N/A |
| TOV112D | MDACC Characterized Cell Line Core | N/A |
| KK | MDACC Characterized Cell Line Core | N/A |
| OVCAR4 | MDACC Characterized Cell Line Core | N/A |
| OVTOKO | MDACC Characterized Cell Line Core | N/A |
| HOC1 | MDACC Characterized Cell Line Core | N/A |
| HOC7 | MDACC Characterized Cell Line Core | N/A |
| UPN251 | MDACC Characterized Cell Line Core | N/A |
| A1847 | MDACC Characterized Cell Line Core | N/A |
| PEO | MDACC Characterized Cell Line Core | N/A |
| IGROV1 | MDACC Characterized Cell Line Core | N/A |
| OC316 | MDACC Characterized Cell Line Core | N/A |
| A2780 | MDACC Characterized Cell Line Core | N/A |
| OVCAR3 | MDACC Characterized Cell Line Core | N/A |
| ID8 | Dr. Katherine F. Roby’s lab | N/A |
| MCF-10A | MDACC Characterized Cell Line Core | N/A |
| Human mesenchymal stem cells | Texas A&M Regenerative Medicine Center | N/A |
| U2OS | MDACC Characterized Cell Line Core | N/A |
| Experimental Models: Organisms/Strains | ||
| NCRNU-F sp/sp, CrTac:NCr-Foxn1nu mice | Taconic Biosciences | NCRNU-F |
| C57BL/6J | The Jackson Laboratory | 000664 |
| NOD.Cg-Prkdcscid Il2rgtm1WJl/SzJ | The Jackson Laboratory | 005557 |
| Software and Algorithms | ||
| CalcuSyn | Biosoft | http://www.biosoft.com/w/calcusyn.htm |
| GraphPad PRISM 7 | GraphPad Software | https://www.graphpad.com |
| KEGG | GenomeNet | https://www.genome.jp/kegg/ |
| R | The R Foundation | https://www.r-project.org/ |
| Gene Ontology Consortium | Gene ontology | http://www.geneontology.org/ |
| NIS-Elements Advanced Research | Nikon | www.nikoninstruments.com/Products |
| ZEN lite | ZEISS | https://www.zeiss.com/microscopy/us/products/microscope-software/zen-lite.html |
| MATLAB R2016a | Mathworks | https://www.mathworks.com |
| Comet Score 1.6.1.11 | TriTek | http://autocomet.com/ |
| FlowJo | FlowJo, LLC | https://www.flowjo.com/ |
Highlights:
We characterize effects of PARP and WEE1 inhibitors on functional proteomics.
Concurrent PARP and WEE1 blockade effectively inhibits tumors but is poorly tolerated.
Sequential PARP and WEE1 inhibition minimizes toxicity while maintaining efficacy.
Basal replication stress influences the therapeutic index of sequential therapy.
Significance.
Induction of replication stress combined with selective abrogation of DNA damage repair and DNA damage checkpoints in cancer cells represents an anticancer strategy with multiple drugs entering clinical evaluation. Unfortunately, many agents under evaluation demonstrate unacceptable toxicity. Thus, identifying optimal targets, combinations and sequencing to capitalize on the therapeutic opportunity while maintaining tolerability is critically important. We demonstrate that, in contrast to concurrent therapy, which is effective but poorly tolerated, sequential therapy with PARP and either WEE1 or ATR inhibitors is both effective and well tolerated in multiple relevant cancer models. Therefore, sequential administration of PARP and either WEE1 or ATR inhibitors warrants evaluation as an effective and potentially less toxic therapeutic approach in patients with different cancers.
Acknowledgments
We thank Phil Jones for compounds and Kathy Roby for ID8. Human bone marrow-derived MSCs were from Texas A&M Health Science Center through NIHP40RR017447. Studies were supported by a kind gift from the Adelson Research Foundation, NIH/NCI grants CA217842, CA217685, CA098258, CA210950, HG008100, Komen Foundation SAC110052, Breast Cancer Research Foundation BCRF-17-108, Ovarian Cancer Research Foundation, CPRIT RP170640, and CCSG support grant CA016672 to GBM, Susan G. Komen grant PDF17483544 to DJM. Grants RR160021 and FG-2018-10723 to N.S.
Footnotes
Declaration of Interests: GBM consults with AstraZeneca, ImmunoMET, Ionis, Nuevolution, PDX bio, Signalchem, Symphogen, and Tarveda, has stock options with Catena Pharmaceuticals, ImmunoMet, SignalChem, Spindle Top Ventures and Tarveda, sponsored research from AstraZeneca, Immunomet, Pfizer, Nanostring, and Tesaro, travel support from Chrysallis Bio, and has licensed technology to Nanostring and Myriad Genetics. TAY consults with AstraZeneca, Pfizer, EMD Serono, Clovis, BMS, Ignyta, Roche, Janssen, Atrin, Aduro, and Almac, has sponsored research from AstraZeneca and Vertex and travel support from AstraZeneca, BMS, MSD, Vertex, GSK, EMD Serono and Tesaro. GP has sponsored research from Pfizer. SNW consults for AstraZeneca, Clovis Oncology, Medivation, Merck, Ovation, Pfizer, Roche/Genentech, Takeda, Tesaro and Vermillion. SNW has sponsored research from AstraZeneca, ArQule, Bayer, Clovis Oncology, Cotinga, Novartis, Roche/Genetech, and Tesaro. MO’C is an AstraZeneca full-time employee and shareholder.
Publisher's Disclaimer: This is a PDF file of an unedited manuscript that has been accepted for publication. As a service to our customers we are providing this early version of the manuscript. The manuscript will undergo copyediting, typesetting, and review of the resulting proof before it is published in its final citable form. Please note that during the production process errors may be discovered which could affect the content, and all legal disclaimers that apply to the journal pertain.
References:
- Ashworth A (2008). A synthetic lethal therapeutic approach: poly(ADP) ribose polymerase inhibitors for the treatment of cancers deficient in DNA double-strand break repair. J Clin Oncol 26, 3785–3790. [DOI] [PubMed] [Google Scholar]
- Bartkova J, Rezaei N, Liontos M, Karakaidos P, Kletsas D, Issaeva N, Vassiliou LV, Kolettas E, Niforou K, Zoumpourlis VC, et al. (2006). Oncogene-induced senescence is part of the tumorigenesis barrier imposed by DNA damage checkpoints. Nature 444, 633–637. [DOI] [PubMed] [Google Scholar]
- Beck H, Nahse-Kumpf V, Larsen MS, O’Hanlon KA, Patzke S, Holmberg C, Mejlvang J, Groth A, Nielsen O, Syljuasen RG, and Sorensen CS (2012). Cyclin-dependent kinase suppression by WEE1 kinase protects the genome through control of replication initiation and nucleotide consumption. Mol Cell Biol 32, 4226–4236. [DOI] [PMC free article] [PubMed] [Google Scholar]
- Berti M, and Vindigni A (2016). Replication stress: getting back on track. Nat Struct Mol Biol 23, 103–109. [DOI] [PMC free article] [PubMed] [Google Scholar]
- Branzei D, and Foiani M (2010). Maintaining genome stability at the replication fork. Nat Rev Mol Cell Biol 11, 208–219. [DOI] [PubMed] [Google Scholar]
- Brown JS, O’Carrigan B, Jackson SP, and Yap TA (2017). Targeting DNA Repair in Cancer: Beyond PARP Inhibitors. Cancer Discov 7, 20–37. [DOI] [PMC free article] [PubMed] [Google Scholar]
- Buisson R, Boisvert JL, Benes CH, and Zou L (2015). Distinct but Concerted Roles of ATR, DNA-PK, and Chk1 in Countering Replication Stress during S Phase. Mol Cell 59, 1011–1024. [DOI] [PMC free article] [PubMed] [Google Scholar]
- Buisson R, Niraj J, Rodrigue A, Ho CK, Kreuzer J, Foo TK, Hardy EJ, Dellaire G, Haas W, Xia B, et al. (2017). Coupling of Homologous Recombination and the Checkpoint by ATR. Mol Cell 65, 336–346. [DOI] [PMC free article] [PubMed] [Google Scholar]
- Burrell RA, McClelland SE, Endesfelder D, Groth P, Weller MC, Shaikh N, Domingo E, Kanu N, Dewhurst SM, Gronroos E, et al. (2013). Replication stress links structural and numerical cancer chromosomal instability. Nature 494, 492–496. [DOI] [PMC free article] [PubMed] [Google Scholar]
- Castedo M, Perfettini JL, Roumier T, Andreau K, Medema R, and Kroemer G (2004). Cell death by mitotic catastrophe: a molecular definition. Oncogene 23, 2825–2837. [DOI] [PubMed] [Google Scholar]
- Chen X, Low KH, Alexander A, Jiang Y, Karakas C, Hess KR, Carey JPW, Bui TN, Vijayaraghavan S, Evans KW, et al. (2018). Cyclin E Overexpression Sensitizes Triple-Negative Breast Cancer to Wee1 Kinase Inhibition. Clin Cancer Res 24, 6594–6610. [DOI] [PMC free article] [PubMed] [Google Scholar]
- De Witt Hamer PC, Mir SE, Noske D, Van Noorden CJ, and Wurdinger T (2011). WEE1 kinase targeting combined with DNA-damaging cancer therapy catalyzes mitotic catastrophe. Clin Cancer Res 17, 4200–4207. [DOI] [PubMed] [Google Scholar]
- DePristo MA, Banks E, Poplin R, Garimella KV, Maguire JR, Hartl C, Philippakis AA, del Angel G, Rivas MA, Hanna M, et al. (2011). A framework for variation discovery and genotyping using next-generation DNA sequencing data. Nat Genet 43, 491–498. [DOI] [PMC free article] [PubMed] [Google Scholar]
- Do K, Wilsker D, Ji J, Zlott J, Freshwater T, Kinders RJ, Collins J, Chen AP, Doroshow JH, and Kummar S (2015). Phase I Study of Single-Agent AZD1775 (MK-1775), a Wee1 Kinase Inhibitor, in Patients With Refractory Solid Tumors. J Clin Oncol 33, 3409–3415. [DOI] [PMC free article] [PubMed] [Google Scholar]
- Dobbelstein M, and Sorensen CS (2015). Exploiting replicative stress to treat cancer. Nat Rev Drug Discov 14, 405–423. [DOI] [PubMed] [Google Scholar]
- Drean A, Williamson CT, Brough R, Brandsma I, Menon M, Konde A, Garcia-Murillas I, Pemberton HN, Frankum J, Rafiq R, et al. (2017). Modeling Therapy Resistance in BRCA1/2-Mutant Cancers. Mol Cancer Ther 16, 2022–2034. [DOI] [PMC free article] [PubMed] [Google Scholar]
- Hamilton Erika Paige, J. S.-Z. W., Falchook Gerald, Jones Suzanne Fields, Cook Carl, Mugundu Ganesh, Jewsbury Philip John, O’Connor Mark J., Pierce Andrew J, Li Bob T., Oza Amit M., Infante Jeffrey R., Burris Howard A., David R (2016). A phase Ib study of AZD1775 and olaparib combination in patients with refractory solid tumors.. Journal of Clinical Oncology 34, 1.26578609 [Google Scholar]
- Esashi F, Christ N, Gannon J, Liu Y, Hunt T, Jasin M, and West SC (2005). CDK-dependent phosphorylation of BRCA2 as a regulatory mechanism for recombinational repair. Nature 434, 598–604. [DOI] [PubMed] [Google Scholar]
- Forment JV, and O’Connor MJ (2018). Targeting the replication stress response in cancer. Pharmacol Ther 188, 155–167. [DOI] [PubMed] [Google Scholar]
- Geenen JJJ, and Schellens JHM (2017). Molecular Pathways: Targeting the Protein Kinase Wee1 in Cancer. Clin Cancer Res 23, 4540–4544. [DOI] [PubMed] [Google Scholar]
- George E, Kim H, Krepler C, Wenz B, Makvandi M, Tanyi JL, Brown E, Zhang R, Brafford P, Jean S, et al. (2017). A patient-derived-xenograft platform to study BRCA-deficient ovarian cancers. JCI Insight 2, e89760. [DOI] [PMC free article] [PubMed] [Google Scholar]
- Hayashi MT, and Karlseder J (2013). DNA damage associated with mitosis and cytokinesis failure. Oncogene 32, 4593–4601. [DOI] [PMC free article] [PubMed] [Google Scholar]
- Haynes B, Murai J, and Lee JM (2018). Restored replication fork stabilization, a mechanism of PARP inhibitor resistance, can be overcome by cell cycle checkpoint inhibition. Cancer Treat Rev 71, 1–7. [DOI] [PMC free article] [PubMed] [Google Scholar]
- Hirai H, Iwasawa Y, Okada M, Arai T, Nishibata T, Kobayashi M, Kimura T, Kaneko N, Ohtani J, Yamanaka K, et al. (2009). Small-molecule inhibition of Wee1 kinase by MK-1775 selectively sensitizes p53-deficient tumor cells to DNA-damaging agents. Mol Cancer Ther 8, 2992–3000. [DOI] [PubMed] [Google Scholar]
- Hustedt N, and Durocher D (2016). The control of DNA repair by the cell cycle. Nat Cell Biol 19, 1–9. [DOI] [PubMed] [Google Scholar]
- Iorns E, Lord CJ, Grigoriadis A, McDonald S, Fenwick K, Mackay A, Mein CA, Natrajan R, Savage K, Tamber N, et al. (2009). Integrated functional, gene expression and genomic analysis for the identification of cancer targets. PLoS One 4, e5120. [DOI] [PMC free article] [PubMed] [Google Scholar]
- Jackson DA, and Pombo A (1998). Replicon clusters are stable units of chromosome structure: evidence that nuclear organization contributes to the efficient activation and propagation of S phase in human cells. J Cell Biol 140, 1285–1295. [DOI] [PMC free article] [PubMed] [Google Scholar]
- Jelinic P, and Levine DA (2014). New insights into PARP inhibitors’ effect on cell cycle and homology-directed DNA damage repair. Mol Cancer Ther 13, 1645–1654. [DOI] [PubMed] [Google Scholar]
- Kawabe T (2004). G2 checkpoint abrogators as anticancer drugs. Mol Cancer Ther 3, 513–519. [PubMed] [Google Scholar]
- Kim H, George E, Ragland R, Rafial S, Zhang R, Krepler C, Morgan M, Herlyn M, Brown E, and Simpkins F (2017). Targeting the ATR/CHK1 Axis with PARP Inhibition Results in Tumor Regression in BRCA-Mutant Ovarian Cancer Models. Clin Cancer Res 23, 3097–3108. [DOI] [PMC free article] [PubMed] [Google Scholar]
- Konstantinopoulos PA, Ceccaldi R, Shapiro GI, and D’Andrea AD (2015). Homologous Recombination Deficiency: Exploiting the Fundamental Vulnerability of Ovarian Cancer. Cancer Discov 5, 1137–1154. [DOI] [PMC free article] [PubMed] [Google Scholar]
- Lallo A, Frese KK, Morrow CJ, Sloane R, Gulati S, Schenk MW, Trapani F, Simms N, Galvin M, Brown S, et al. (2018). The Combination of the PARP Inhibitor Olaparib and the WEE1 Inhibitor AZD1775 as a New Therapeutic Option for Small Cell Lung Cancer. Clin Cancer Res. [DOI] [PubMed] [Google Scholar]
- Leijen S, van Geel RM, Pavlick AC, Tibes R, Rosen L, Razak AR, Lam R, Demuth T, Rose S, Lee MA, et al. (2016a). Phase I Study Evaluating WEE1 Inhibitor AZD1775 As Monotherapy and in Combination With Gemcitabine, Cisplatin, or Carboplatin in Patients With Advanced Solid Tumors. J Clin Oncol 34, 4371–4380. [DOI] [PMC free article] [PubMed] [Google Scholar]
- Leijen S, van Geel RM, Sonke GS, de Jong D, Rosenberg EH, Marchetti S, Pluim D, van Werkhoven E, Rose S, Lee MA, et al. (2016b). Phase II Study of WEE1 Inhibitor AZD1775 Plus Carboplatin in Patients With TP53-Mutated Ovarian Cancer Refractory or Resistant to First-Line Therapy Within 3 Months. J Clin Oncol 34, 4354–4361. [DOI] [PubMed] [Google Scholar]
- Li H, and Durbin R (2009). Fast and accurate short read alignment with Burrows-Wheeler transform. Bioinformatics 25, 1754–1760. [DOI] [PMC free article] [PubMed] [Google Scholar]
- Lin X, Chen D, Zhang C, Zhang X, Li Z, Dong B, Gao J, and Shen L (2018). Augmented antitumor activity by olaparib plus AZD1775 in gastric cancer through disrupting DNA damage repair pathways and DNA damage checkpoint. J Exp Clin Cancer Res 37, 129. [DOI] [PMC free article] [PubMed] [Google Scholar]
- Lonigro RJ, Grasso CS, Robinson DR, Jing X, Wu YM, Cao X, Quist MJ, Tomlins SA, Pienta KJ, and Chinnaiyan AM (2011). Detection of somatic copy number alterations in cancer using targeted exome capture sequencing. Neoplasia 13, 1019–1025. [DOI] [PMC free article] [PubMed] [Google Scholar]
- Macheret M, and Halazonetis TD (2015). DNA replication stress as a hallmark of cancer. Annu Rev Pathol 10, 425–448. [DOI] [PubMed] [Google Scholar]
- McGrail DJ, Lin CC, Dai H, Mo W, Li Y, Stephan C, Davies P, Lu Z, Mills GB, Lee JS, and Lin SY (2018). Defective Replication Stress Response Is Inherently Linked to the Cancer Stem Cell Phenotype. Cell Rep 23, 2095–2106. [DOI] [PubMed] [Google Scholar]
- McGrail DJ, McAndrews KM, and Dawson MR (2013). Biomechanical analysis predicts decreased human mesenchymal stem cell function before molecular differences. Exp Cell Res 319, 684–696. [DOI] [PubMed] [Google Scholar]
- McNeely S, Beckmann R, and Bence Lin AK (2014). CHEK again: revisiting the development of CHK1 inhibitors for cancer therapy. Pharmacol Ther 142, 1–10. [DOI] [PubMed] [Google Scholar]
- Mendes-Pereira AM, Martin SA, Brough R, McCarthy A, Taylor JR, Kim JS, Waldman T, Lord CJ, and Ashworth A (2009). Synthetic lethal targeting of PTEN mutant cells with PARP inhibitors. EMBO Mol Med 1, 315–322. [DOI] [PMC free article] [PubMed] [Google Scholar]
- Meng X, Bi J, Li Y, Yang S, Zhang Y, Li M, Liu H, Li Y, McDonald ME, Thiel KW, et al. (2018). AZD1775 Increases Sensitivity to Olaparib and Gemcitabine in Cancer Cells with p53 Mutations. Cancers (Basel) 10. [DOI] [PMC free article] [PubMed] [Google Scholar]
- Mir SE, De Witt Hamer PC, Krawczyk PM, Balaj L, Claes A, Niers JM, Van Tilborg AA, Zwinderman AH, Geerts D, Kaspers GJ, et al. (2010). In silico analysis of kinase expression identifies WEE1 as a gatekeeper against mitotic catastrophe in glioblastoma. Cancer Cell 18, 244–257. [DOI] [PMC free article] [PubMed] [Google Scholar]
- O’Connor MJ (2015). Targeting the DNA Damage Response in Cancer. Mol Cell 60, 547–560. [DOI] [PubMed] [Google Scholar]
- Ohta M, Tateishi K, Kanai F, Watabe H, Kondo S, Guleng B, Tanaka Y, Asaoka Y, Jazag A, Imamura J, et al. (2005). p53-Independent negative regulation of p21/cyclin-dependent kinase-interacting protein 1 by the sonic hedgehog-glioma-associated oncogene 1 pathway in gastric carcinoma cells. Cancer Res 65, 10822–10829. [DOI] [PubMed] [Google Scholar]
- Parsels LA, Karnak D, Parsels JD, Zhang Q, Velez-Padilla J, Reichert ZR, Wahl DR, Maybaum J, O’Connor MJ, Lawrence TS, and Morgan MA (2018). PARP1 Trapping and DNA Replication Stress Enhance Radiosensitization with Combined WEE1 and PARP Inhibitors. Mol Cancer Res 16, 222–232. [DOI] [PMC free article] [PubMed] [Google Scholar]
- Patel AG, Sarkaria JN, and Kaufmann SH (2011). Nonhomologous end joining drives poly(ADP-ribose) polymerase (PARP) inhibitor lethality in homologous recombination-deficient cells. Proc Natl Acad Sci U S A 108, 3406–3411. [DOI] [PMC free article] [PubMed] [Google Scholar]
- Pfister SX, Markkanen E, Jiang Y, Sarkar S, Woodcock M, Orlando G, Mavrommati I, Pai CC, Zalmas LP, Drobnitzky N, et al. (2015). Inhibiting WEE1 Selectively Kills Histone H3K36me3-Deficient Cancers by dNTP Starvation. Cancer Cell 28, 557–568. [DOI] [PMC free article] [PubMed] [Google Scholar]
- Pilie PG, Tang C, Mills GB, and Yap TA (2018). State-of-the-art strategies for targeting the DNA damage response in cancer. Nat Rev Clin Oncol. [DOI] [PMC free article] [PubMed] [Google Scholar]
- Pommier Y, O’Connor MJ, and de Bono J (2016). Laying a trap to kill cancer cells: PARP inhibitors and their mechanisms of action. Sci Transl Med 8, 362ps317. [DOI] [PubMed] [Google Scholar]
- Ricks TK, Chiu HJ, Ison G, Kim G, McKee AE, Kluetz P, and Pazdur R (2015). Successes and Challenges of PARP Inhibitors in Cancer Therapy. Front Oncol 5, 222. [DOI] [PMC free article] [PubMed] [Google Scholar]
- Saldivar JC, Hamperl S, Bocek MJ, Chung M, Bass TE, Cisneros-Soberanis F, Samejima K, Xie L, Paulson JR, Earnshaw WC, et al. (2018). An intrinsic S/G2 checkpoint enforced by ATR. Science 361, 806–810. [DOI] [PMC free article] [PubMed] [Google Scholar]
- Shaltiel IA, Krenning L, Bruinsma W, and Medema RH (2015). The same, only different - DNA damage checkpoints and their reversal throughout the cell cycle. J Cell Sci 128, 607–620. [DOI] [PubMed] [Google Scholar]
- Slipicevic A, Holth A, Hellesylt E, Trope CG, Davidson B, and Florenes VA (2014). Wee1 is a novel independent prognostic marker of poor survival in post-chemotherapy ovarian carcinoma effusions. Gynecol Oncol 135, 118–124. [DOI] [PubMed] [Google Scholar]
- Sun C, Fang Y, Yin J, Chen J, Ju Z, Zhang D, Chen X, Vellano CP, Jeong KJ, Ng PK, et al. (2017). Rational combination therapy with PARP and MEK inhibitors capitalizes on therapeutic liabilities in RAS mutant cancers. Sci Transl Med 9. [DOI] [PMC free article] [PubMed] [Google Scholar]
- Sun C, Yin J, Fang Y, Chen J, Jeong KJ, Chen X, Vellano CP, Ju Z, Zhao W, Zhang D, et al. (2018). BRD4 Inhibition Is Synthetic Lethal with PARP Inhibitors through the Induction of Homologous Recombination Deficiency. Cancer Cell 33, 401–416 e408. [DOI] [PMC free article] [PubMed] [Google Scholar]
- Toledo L, Neelsen KJ, and Lukas J (2017). Replication Catastrophe: When a Checkpoint Fails because of Exhaustion. Mol Cell 66, 735–749. [DOI] [PubMed] [Google Scholar]
- Toledo LI, Altmeyer M, Rask MB, Lukas C, Larsen DH, Povlsen LK, Bekker-Jensen S, Mailand N, Bartek J, and Lukas J (2013). ATR prohibits replication catastrophe by preventing global exhaustion of RPA. Cell 155, 1088–1103. [DOI] [PubMed] [Google Scholar]
- Weber JS, Gibney G, Sullivan RJ, Sosman JA, Slingluff CL Jr., Lawrence DP, Logan TF, Schuchter LM, Nair S, Fecher L, et al. (2016). Sequential administration of nivolumab and ipilimumab with a planned switch in patients with advanced melanoma (CheckMate 064): an open-label, randomised, phase 2 trial. Lancet Oncol 17, 943–955. [DOI] [PMC free article] [PubMed] [Google Scholar]
- Yazinski SA, and Zou L (2016). Functions, Regulation, and Therapeutic Implications of the ATR Checkpoint Pathway. Annu Rev Genet 50, 155–173. [DOI] [PubMed] [Google Scholar]
- Zhou JX, Feng LJ, and Zhang X (2017). Risk of severe hematologic toxicities in cancer patients treated with PARP inhibitors: a meta-analysis of randomized controlled trials. Drug Des Devel Ther 11, 3009–3017. [DOI] [PMC free article] [PubMed] [Google Scholar]
Associated Data
This section collects any data citations, data availability statements, or supplementary materials included in this article.
Supplementary Materials
Movie S1, related with Figure 2. Real-time imaging of effects of PARPi and WEE1i or ATRi on cell cycle progression and cell death.
OVCAR8 were exposed to DMSO or talazoparib (0.5 μM), adavosertib (0.5 μM), AZD6738 (2.5 μM) or combination with medium containing IncuCyte Cleaved Caspase-3/7 reagent (green). Images were captured every 15 min in the IncuCyte system. The movie collected images from every 2 hr.
Table S1, related with Figure 8. Somatic mutations in PDX1.
Table S2, related with Figure 8. Somatic mutations in treated PDX1 samples (control vs sequential).
Table S3, related with Figure 8. Copy number variation in treated PDX1 samples (control vs sequential).
Table S4, related with Figure 8. Somatic mutations in PDX2.
Table S5, related with Figure 8. Somatic mutations in PDX3.
Data Availability Statement
The T200.2 exome sequencing data generated in this study is available in the Sequence Read Archive (SRA) under accession number SRP159022. Raw data from this manuscript: https://www.ncbi.nlm.nih.gov/sra/docs/