Summary
Development of the whole-cell patch-clamp electrophysiology technique has allowed for enhanced visualization and experimentation of ionic currents in neurons of mammalian tissue with high spatial and temporal resolution. Electrophysiology has become an exceptional tool for identifying single cellular mechanisms underlying behavior. Specifically, the role of glutamatergic signaling through α-amino-3-hydroxy-5-methyl-4-isoxazolepropionic acid (AMPA) and N-methyl-D-aspartate (NMDA) receptors underlying behavior has been extensively studied. Here we will discuss commonly used protocols and techniques for performing whole-cell patch clamp recordings and exploring AMPA and NMDA receptor mediated glutamatergic responses and alterations in the context of substance abuse.
Keywords: Electrophysiology, Addiction, Patch-Clamp, AMPA, NMDA, Substance Abuse, Glutamatergic Receptors
1. Introduction:
Overview of Patch Clamp Electrophysiology:
The use of patch clamp electrophysiology dates began in the 1970’s, where Neher and Sakmann developed a technique that allowed for the visualization of the opening and closing of single ion channels within the plasma membrane of muscle cells, termed cell-attached electrophysiology (Figure 1A). Further development of this technique resulted in whole-cell patch-clamp electrophysiology, which reduced the influence of background noise throughout recordings, and allowed for enhanced visualization and further experimentation of ionic currents with higher spatial and temporal resolution. A whole-cell patch is obtained by rupturing the membrane patch without breaking the micropipette-obtained seal, allowing for electrical access to the entire cell, not just ion channels on the cell surface as developed previously (Figure 1B). These techniques were the first to identify whole-cell characteristics including cell firing and all ionic conductance across the plasma membrane, thus revolutionizing the field of neurophysiology. Although still a widely used technique to observe physiological changes in a single cell, over the last few decades, single cell patch-clamp recordings have been further combined with multi-electrode paired recordings, optogenetic approaches, and various other techniques, each allowing for further isolation and study of individual neurons and their behavior in neural circuits. Here we will discuss commonly used protocols and techniques for performing whole-cell patch clamp recordings and exploring α-amino-3-hydroxy-5-methyl-4-isoxazolepropionic acid (AMPA) and N-methyl-D-aspartate (NMDA) receptor-mediated glutamatergic responses and alterations in the context of substance abuse.
Figure 1:
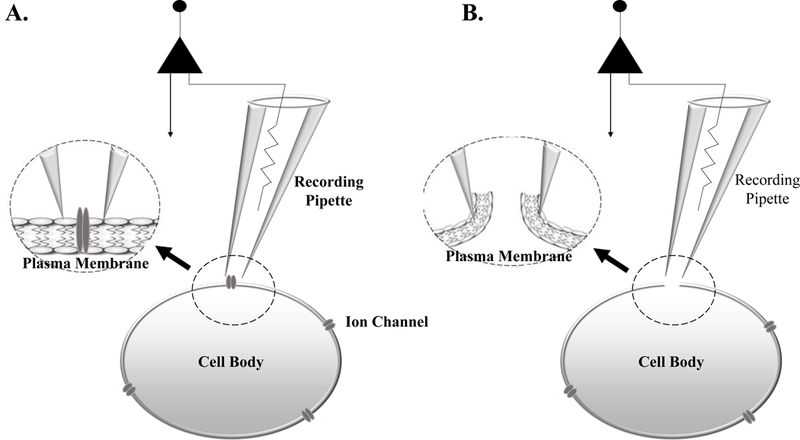
(A) Cell-attached electrophysiology is performed by placing a recording pipette against the plasma membrane, without rupturing through the membrane. This technique allows for the recording of single ion channel conductance. (B) Whole-Cell electrophysiology is conducted when a seal is made between the recording pipette and plasma membrane. Following seal formation, negative pressure is applied to the recording pipette rupturing the plasma membrane, allowing the recording pipette electrical access to the entire cell.
Overview of Glutamatergic Receptors:
AMPA Receptor Physiology and Function:
One category of ionotropic glutamatergic receptors, primarily responsible for fast synaptic transmission, are AMPA (α-amino-3-hydroxy-5-methyl-4-isoxazolepropionic acid) receptors and are known to mediate a vast majority of communication between neurons within the central nervous system. AMPA receptors (AMPARs) are a hetero-oligomeric protein complexes consisting of four subunits (GluA1-GluA4, also known as GluRA-GluRD) which form a tetrameric channel most commonly composed of GluA2-GluA3 and GluA2-GluA1 subunit combinations (1, 2), although there is evidence of other subunit compositions across various brain regions (3, 4).
The subunit composition of each receptor determines its conduction kinetics, ionic permeability and subcellular trafficking properties. Functional studies have shown that variations in the GluA2 subunit (modifications of the Q/R site in pre-mRNA) lead to alterations in calcium permeability, where GluA2 subunits lacking or containing the Q/R site show high and low calcium permeability, respectively (5, 6). Additionally, variations in receptor subunit compositions have been observed across brain regions and give rise to differences in AMPAR mediated currents within different cell types (7). In combination, AMPAR permeability and kinetics can be altered based on subunit composition.
It is interesting to note that AMPA receptors have unique properties that allow them to change functionally in an activity-dependent manner. For example, AMPA receptors play an important role in long-term potentiation (LTP), which is defined as use-dependent strengthening of an individual synapse, and believed to underlie learning and memory. LTP can be induced in slices with brief trains of high frequency stimulation of presynaptic fibers (8, 9). Following this stimulus, the strength of these synaptic connections (i.e., postsynaptic responses to the same stimulus intensity) can be increased as much as five-fold (10). It is well established that LTP induction protocols increase the surface expression of AMPA receptors through exocytosis. However, it has recently been discovered that AMPA receptors containing GluA1 subunits are exocytosed more readily than AMPA receptors consisting of GluA2, GluA3 and GluA4 subunit compositions (11). Due to their kinetics, it is thought that during LTP induction protocols GluA1 subunit containing receptors may promote/facilitate AMPA responses by increasing their expression within the plasma membrane. However, with long term depression (LTD) protocols, GluA2 containing subunits become more prominent within the plasma membrane and may play a role in dampening AMPA-receptor mediated responses (12). Although not yet completely understood, it is clear that trafficking of AMPA receptors can be subunit specific and may play a prominent role in shaping neuronal communication, especially under the influence of addictive substances (13).
Although LTP and LTD induction protocols can induce exocytosis and exocytosis of AMPA receptors (14–16), the activation of these receptors is reliant on presynaptic release of glutamate. Upon presynaptic release, glutamate can then bind to the AMPAR causing it to undergo a conformational change resulting in channel opening. Upon opening, sodium can flow through the channel and into the postsynaptic cell causing post-synaptic membrane depolarization (17, 18) (Figure 2). Postsynaptic depolarization not only aides in fast synaptic transmission (heavily mediated by AMPA receptors) but facilitates activation of NMDA receptors (discussed below). AMPA receptor physiology can be studied using single-cell electrophysiology. Specifically, experiments can be conducted using various AMPAR agonists and NMDAR antagonists, alterations in membrane potentials, and/or changes in solution composition. However, regardless of isolation protocol (specific details and options discussed below), AMPAR currents/potentials are characterized by a short rise and decay times, nearing 1 millisecond and less than 50 milliseconds, respectively.
Figure 2:
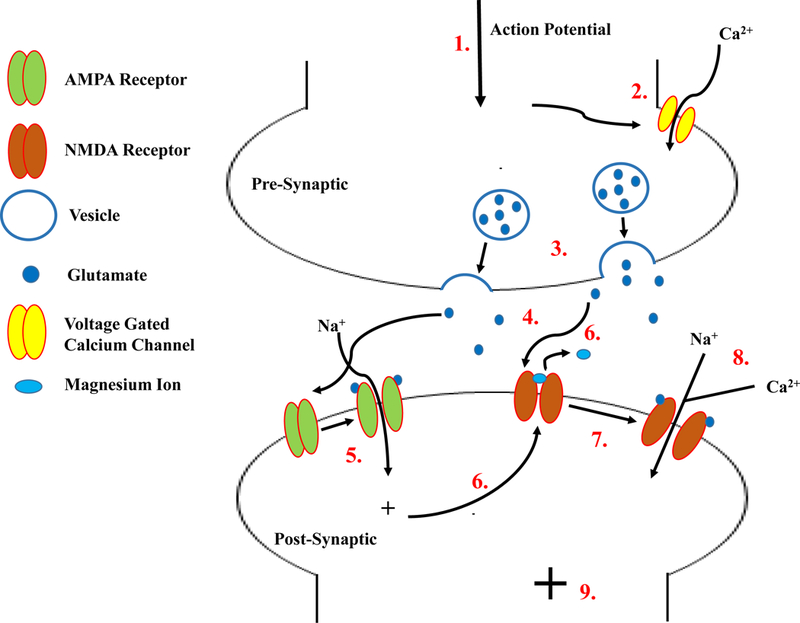
Overview of AMPA and NMDA receptor activation. (1) An action potential enters the synaptic bouton of the presynaptic cell, causing voltage gated calcium channels to open (2). A rise in cytosolic calcium causes glutamate filled vesicles to fuse with the plasma membrane (3) and release glutamate into the synaptic cleft. Glutamate within the cleft binds to both AMPA and NMDA receptors (4) causing AMPA channels to undergo a conformational change and open, allowing sodium to flow into the postsynaptic cell (5). The flow of sodium causes a postsynaptic depolarization, alleviating the magnesium block of NMDA channels (6). In combination, the alleviation of magnesium and binding of glutamate to the NMDA receptor allows them to open (7) and both sodium and calcium to enter the postsynaptic cell (8) causing further depolarization of the postsynaptic cell (9).
NMDA Receptor Physiology and Function:
Another type of ionotropic glutamatergic receptor primarily responsible for synaptic plasticity are NMDA (N-methyl-D-aspartate) receptors (NMDARs). These receptors consist of various subunit combinations, including NR1, NR2 and NR3, and each subtype has many isoforms (i.e., GluN2A, GluN2B, etc.). Different subunit combinations determine the activation and conduction time of the receptor. It has been well established that NMDARs are hetero-oligomeric and composed of multiple NR1 subunits in combination with at least one GluN2 subunit. Interestingly, NR3 subunits must co-assemble with NR1/NR2 complexes in order to be functional; alone these subunits cannot form functional receptors (19).
The activation and inactivation times of NMDARs are much slower than AMPAR, yet these receptors also facilitate changes in synaptic plasticity. Like AMPARs, the subunit composition of these receptors determines their activation and deactivation times. For example, GluN1/GluN2A subunit assemblies have a deactivation constant ranging in tens of milliseconds when activated by glutamate, whereas NR1/NR2D combinations shift the deactivation time to several seconds (19). Interestingly, the composition of NMDAR are known to change developmentally to promote and modify neuronal connectivity during maturation of the nervous system. During early development, it is essential for NMDAR currents to be prolonged in order to promote learning and memory and strengthen the formation of synapses. However, after the initial period of peak plasticity modification, NMDAR currents decrease in duration (i.e. making neurons less plastic). It has been reported that changes in NMDAR containing different subunits throughout development lead to these physiological changes (20, 21), where GluN2B and GluN2D expression is elevated in young animals and supplemented with or replaced by GluN2A subunits over the course of development (19). Interestingly, alterations in NMDAR subunit composition have been reported with chronic use of drugs of abuse, which will be discussed in more detail below.
Interestingly, NMDA receptors are expressed both synaptically and extrasynaptically. While synaptic NMDA receptors play a role in synaptic transmission and plasticity, extrasynaptic NMDA receptors are thought to play a role in promoting cell death (22) and neuronal synchronization (23, 24). Due to their differences in function, it is not surprising that these receptor pools are made up of different subunit compositions with GluN2B and GluN2A subunits showing higher expression levels extrasynaptically and synaptically, respectively (25). Although incompletely understood, these differences in subunit compositions may promote the vastly different functionality observed between these location dependent NMDA receptor pools. These differences in NMDA receptor locations may prove important for the study of addictive substances and their downstream signaling effects associated with synaptic plasticity and cell death.
Unlike AMPARs, the pore of a synaptic NMDAR is blocked by magnesium ions at hyperpolarized potentials (near resting membrane potential). For activation of these receptors to occur, two events must happen simultaneously, making this subtype of glutamatergic receptors ‘coincidence receptors’. Postsynaptic depolarization, due to cation influx through AMPA receptors, leads to alleviation of the voltage-dependent magnesium ion blockade. In addition to alleviatic of the magnesium block, the receptor must also be externally activated by presynaptic release of glutamate. NMDA receptors have the unique activation property that requires detection and pairing of both presynaptic glutamate release an binding to the receptor and postsynaptic depolarization causing alleviation of the magnesium block (Figure 2). The activation and opening of NMDA channels has been shown to increase postsynaptic calcium influx, which has been linked to activation of multiple downstream pathways and changes in synaptic plasticity.
To characterize these responses with single cell electrophysiology, it is extremely common to alter magnesium concentrations of extracellular solutions. Additionally, recordings are routinely conducted in the presence of NMDAR agonists and AMPAR antagonists and at various membrane potentials, dependent on solution composition. However, regardless of isolation protocol (specific details are discussed below) NMDAR currents/potentials are characterized by long rise and decay times, nearing tens of milliseconds and hundreds of milliseconds, respectively, compared to AMPA receptors.
Overview of Addiction:
Addiction is defined as a progressing neurobehavioral disorder characterized by repetitive and compulsive substance seeking and use, despite its detrimental consequences, and repeated unsuccessful attempts at abstinence. Addiction is thought to be caused, in part, by long-lasting maladaptive memories related to drug experiences (26). Abuse of tobacco, alcohol and illicit drugs cost the United States over $740 billion annually (NIDA trends and statistics) and is characterized by repeated use of one or more substances often accompanied by physiologically harmful and detrimental effects. Individuals suffering from addiction often display symptoms including narrowing of the behavioral repertoire in favor of drug-seeking and drug-taking, neglected appearance, physical health issues and difficulties performing everyday activities (i.e. difficulties at work or school). Furthermore, addiction is also characterized by difficulty quitting the substance of abuse, relapse following attempts at abstinence, and intense urges (craving) for the drug.
It is unclear how use of drugs of abuse can lead to addictive traits in some individuals and not others. However, there is evidence to support that drugs of abuse can alter synaptic plasticity in specific brain regions that may give rise to common traits observed with addiction. All commonly abused drugs of addiction are known to target the mesolimbic dopamine system, either directly or indirectly. The mesolimbic dopamine system originates from dopaminergic cell bodies in the ventral tegmental area (VTA) of the midbrain. This region sends dense dopaminergic projections to the prefrontal cortex (PFC) and nucleus accumbens (NAc). All of these areas have been heavily associated with addiction and are thought to undergo neurobiological modifications in the presence of substances of abuse (26), which some have shown to have rapid onset and can be long lasting (27).
Arguably the most well studied cellular modifications due to addictive substances have been characterized in dopaminergic cells of the VTA, and have revealed that drug-induced modifications in dopaminergic cell plasticity and firing patterns may play a substantial role in mediating behavioral changes by modifying reward-related neuronal circuitry. While a large body of literature focuses on drug induced changes in mesolimbic dopaminergic neurons, an additional subset of literature supports the role of glutamate in learning and other adaptive mechanisms in animal models of drug addiction (28–30). For this reason, the study of AMPA and NMDA receptors in addiction has become extremely important and has gained much attention for determining synaptic modifications that may underlie the disease. Thus, in order to properly study the mechanisms of addiction, it is essential to study the effects of abused substances on AMPA and NMDA receptor function in addiction-related brain regions.
This chapter aims to provide a general protocol for using slice electrophysiology for studying AMPA and NMDA receptors, especially in the context of addiction research. Overall, these protocols will step through solution preparation (3.1), slice preparation (3.2), whole cell recordings (3.3), Isolating glutamatergic receptor mediated responses (3.4), various whole-cell induction protocols (3.5), the relevance to of in vitro to in vivo studies (3.6) and common analysis conducted with patch-clamp data (3.7). We will also discuss approaches for finding healthy cell types, drugs used for isolating AMPA and NMDA receptor mediated responses, the relationship and validation of in vitro studies in vivo aswell as new techniques used within the field of neurophysiology and patch-clamp physiology. These protocols provide insight into how slice physiology can aide in the study of neuronal circuits and cellular mechanisms related to and/or caused by addiction.
2. Materials
Regardless of brain region of interest, slice physiology relies heavily on the health of the tissue and cell viability. Slice electrophysiology generally uses three separate solutions, each pertinent in ensuring healthy tissue. The first solution necessary is a cutting solution, a solution generally containing sucrose. A commonly used cutting solution contains: sucrose, 206mM; NaHCO3, 25mM; dextrose, 10mM; KCl, 3.3mM; NaH2PO4, 1.23mM; CaCl2, 1.0mM; MgCl2, 4.0mM, osmolarity adjusted to 295±5 mOsm and pH adjusted to 7.40±0.03. The second solution necessary for slice physiology is the recording buffer, often a modification of a “Krebs” or “Ringer Solution” and referred to as artificial cerebrospinal fluid (aCSF). This solution is used throughout recording and contains: NaCl, 120mM; NaHCO3, 25mM; KCl, 3.3mM; NaH2PO4, 1.23mM; CaCl2, 0.9mM; MgCl2, 2.0mM; dextrose, 10mM, osmolarity adjusted to 295±5 mOsm and pH adjusted to 7.40±0.03. The last solution used is the intracellular solution, which mimics neuronal intracellular fluid and contains: potassium gluconate, 135mM; KCl, 10mM; EGTA, 1.0mM; HEPES, 10mM; MgATP, 2mM; TrisGTP, 0.38.mM, osmolarity adjusted to 285±5 mOsm and pH adjusted to 7.30±0.01. For optimal recordings intracellular solutions should have roughly a 10 mOsm difference (with intracellular being less) from the recording solution, in order to maintain a proper osmotic gradient.
3. Methods
3.1. Solution Preparation
General Steps for making recording and cutting solutions:
Fill graduated cylinder with distilled (ultra-filtered) water to approximately ¾ of the total desired volume.
Add all solvents (excluding MgCl2 and CaCl2 stock solutions) (Figure 3A).
Saturate the solution with 95% O2 / 5% CO2 gas using a gas dispersion stone. Depending on volume the time it takes for complete saturation will be different. With a 2-liter solution, saturation takes approximately 15 minutes. (Figure 3B)
Add MgCl2 and CaCl2 solutions to the saturated solution.
Adjust the pH of the solution to 7.40±0.03 using NaOH or HCl. Ensure that the solution is being constantly stirred to ensure an accurate pH reading. (Figure 3C)
Transfer the solution to a volumetric flask and bring to full volume (1 L) with distilled water.
Obtain an osmolarity reading (using a calibrated osmometer) and adjust the solution to appropriate osmolarity. To decrease and increase osmolarity in recording solutions, add water or NaCl/sucrose, respectively (Figure 3D).
Figure 3:
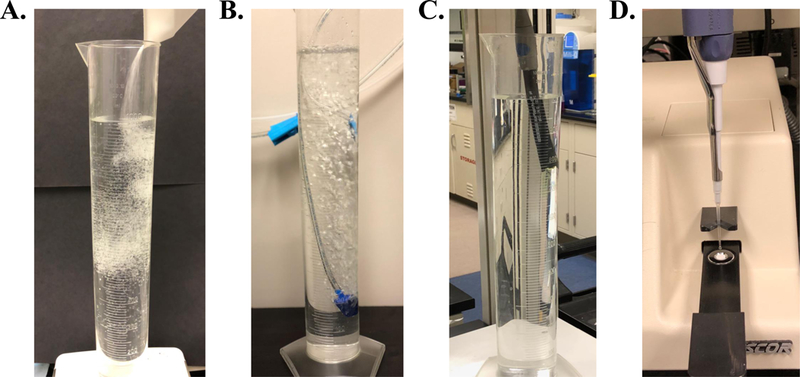
General steps of solution preparation include (A) adding solvents (B) saturation with 95% O2 / 5% CO2 gas followed by adjusting the pH (C) and the osmolarity (D) of the solution to proper physiological ranges.
General Steps for making intracellular solutions:
Start by adding ½ of the total desired volume of distilled (ultra-filtrated) water to the beaker/container.
Place a stir bar into the beaker and spin at low to moderate speed throughout entire solution making process
Add dry potassium gluconate and KCl and allow them to dissolve into solution.
Add EGTA and HEPES (these are generally stock solutions kept at −80°C).
Add Mg-ATP
Add Tris GTP. Because the amount of GTP is very small, it is easiest to order 10-mg pre-weighed aliquots and use the entire volume. Be sure to rinse the aliquot container with water to ensure total amount was added. (See Note 1)
Bring the volume just short of the desired final volume using distilled water
pH the solution to 7.2–7.3 using KOH or HCl.
Adjust the osmolarity to 285–290 mOsm by adding water or potassium gluconate.
Aliquot solution into 1-mL aliquots in 1.7-mL centrifuge tubes.
Place centrifuges tubes into a liquid nitrogen bath to rapidly freeze them. Once they are frozen, store at −80°C if possible.
For solution alterations see note 2 in section 4 below.
3.2. In Vitro Tissue Slice Preparation:
The animal should be sacrificed through rapid decapitation and the brain rapidly removed (i.e., in less than 2 minutes). Although any age animal can be used, tissue from younger animals (2–6 weeks) is often more viable and easier to perform patch clamp recordings.
Once removed, the brain should be placed in a beaker filled with pre-chilled and well oxygenated cutting buffer and placed left on ice for 3 minutes.
After 3 minutes, remove the brain from the beaker, place it on the vibratome cutting block, and mount using a thin layer of cyanoacrylate glue.
Using an automated tissue vibratome, make tissue slices of the desired region. Slices should be kept in the range of 200–300 μm for optimal viability and oxygenation purposes. It is common to use a blade angle of 10–20°, with a slow cutting speed and fast oscillation. We frequently use an automated Leica Microsystems vibratome (Figure 4) which features an oscillating tissue microtome and digital slice thickness controller.
As slices are made, remove them from the brain block using a pair of spring-tension microscissors and transfer each slice to an incubation chamber filled with aCSF (recording buffer) using a truncated disposable pipet. The incubation chamber should be placed in a water bath incubator at 34°C, and the aCSF should be continuously oxygenated with 95% O2 / 5% CO2. See figure 5 for an example of an incubation chamber and water bath.
After all slices have been transferred to the incubation chamber, allow them to incubate at 34°C for 45 minutes. After 45 minutes, the incubation chamber should be removed from the water bath and left to cool to room temperature for a minimum of 10 minutes before transferring slices to a recording chamber.
Figure 4:
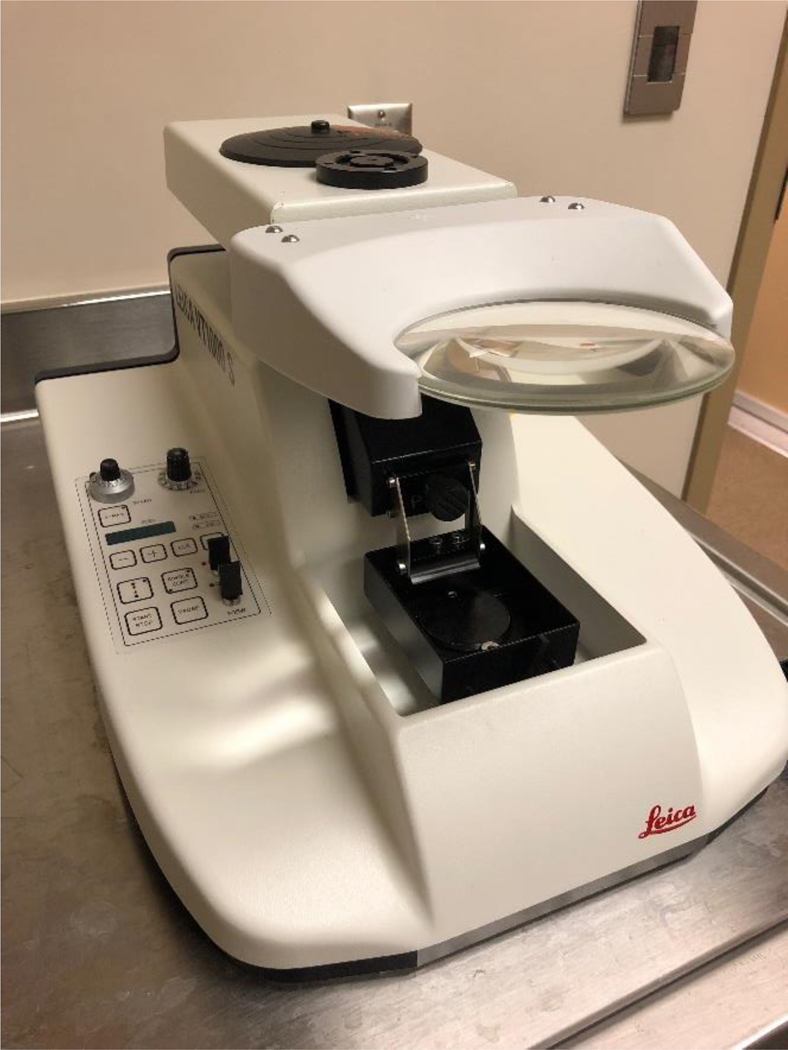
A commonly used motorized, oscillating tissue microtome (vibratome) used for preparing thin (between 100–300 μm thick) tissue slices for electrophysiology (Leica Microsystems, Wetzlar, Germany).
Figure 5:
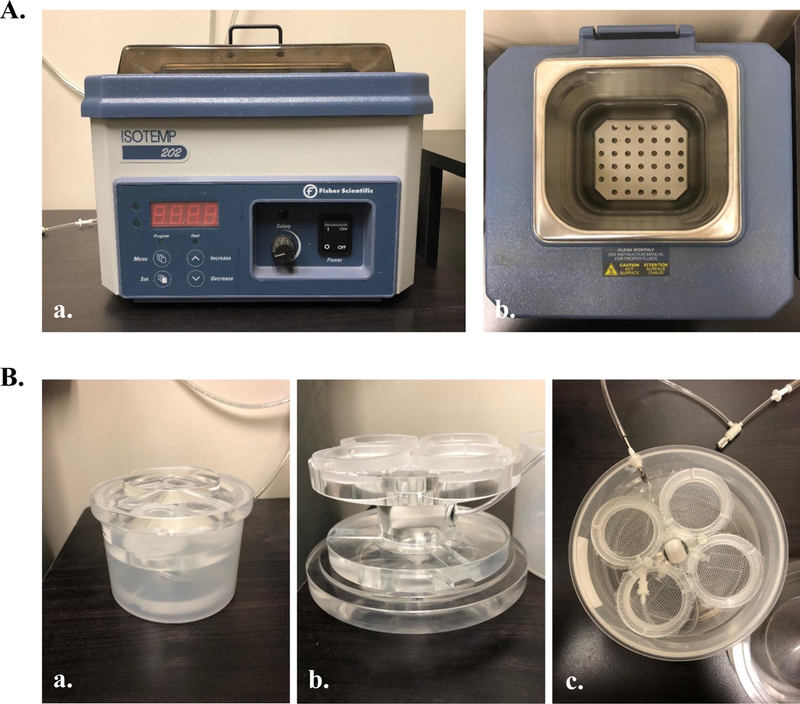
Instruments commonly used for slice incubation. (A) Water incubation bath (Fisher Scientific, Pittsburgh, PA) commonly used to keep slices maintained at 34°C throughout the incubation period. (B) Incubation chamber, equipped with four distinct chambers and a perfusion stone placed in a walled off chamber between the four slice chambers (Automate Scientific, Berkeley, CA). This system is engineered for optimal oxygen saturation (vigorous bubbling) with minimal slice movement, preventing tissue damage.
3.3. Whole-Cell Patch Clamp Recordings in Slices:
After slices have been allowed to cool to room temperature for at least 10 minutes (last step of slice preparation), use a truncated disposable plastic pipette and transfer the one slice to the recording chamber located on the microscope. Depending on recording location, slices should be positioned properly for optimal cell approach (i.e. largest portion of the cell body positioned towards electrode approach location).
Once positioned, slices should be secured by a net/harp (an example harp can be seen in figure 6B). It is essential to remove most of the fluid in the chamber surrounding the slice before harp placement, as excess liquid will cause the slice to shift during placement.
Upon placement of the harp, start a continuous flow of aCSF (recording buffer) at a flow rate of 1–2 mL/minute. The aCSF source should be continuously bubbled to ensure oxygen saturation. Some perfusion systems/options are shown in figure 7.
After ensuring proper flow of the aCSF perfusion, the tissue is ready for visualization. Slice quality and viability can be visually observed by focusing on the tissue at high power and looking for the following characteristics of healthy and unhealthy cells (For examples, see notes 3 and 4 in section 4). See figure 8 for a pictorial representation of healthy and unhealthy cells.
After determining the slice tissue is healthy, locate a single cell on high power using infrared/differential interference contrast (IR/DIC) to approach for recording. See note 5 for additional details.
Before approaching the cell, the recording pipette must be filled with intracellular solution using a microfil needle. Once filled with intracellular solution, the pipette should be placed on the micromanipulator (see figure 9). Apply positive pressure to the pipette using a 10-mL syringe and move the recording pipette so that it is placed in the bath (aCSF flowing through the recording chamber) just above the slice.
Verify that the resistance of the pipette tip is between 4–6 mΩ. For older animals, resistance may need to be modified in order to obtain a proper seal.
After checking the resistance of the recording pipette, use your amplifier or amplifier software to compensate for the resistance in order to prevent an offset in recording data.
While maintaining positive pressure through the recording pipette (which can be observed by the “fire hose effect” protruding from the recording pipette, see figure 10), begin the approach towards the cell. Maintaining positive pressure serves to push any debris out of the way for easier visualization of the cell, and to keep the end of the recording pipette free from debris.
As the cell is approached, a “dimpling” of the cell membrane will occur due to the positive pressure. See note 6 for additional details.
Before removing the positive pressure, begin monitoring pipette resistance. Most recording software has this option built into program. If obtaining recordings in voltage clamp mode, it is also recommended to set a holding potential near cellular resting membrane potential. In the event that the cell has a spontaneous membrane rupture this holding potential will prevent cell death. This holding potential will vary depending resting membrane potential of the cell type.
Once cell dimpling is visualized and the cell does not move from its location (slipping in any direction), rapidly release the positive pressure. The release of pressure will bring the cell body towards the recording pipette tip where a seal between the pipette tip and cell membrane will begin to form. This seal will be apparent by an increase in pipette resistance. For a giga-seal (a seal over 1GΩ in resistance) to be reached, suction (either mouth or syringe induced) is often necessary.
Once a giga-seal is obtained, additional suction should be applied (again, either mouth or syringe induced) to rupture the plasma membrane. This is evident by a rapid reduction in pipette resistance. Additionally, membrane resistance, membrane capacitance, and resting membrane potentials can now be visualized through the recording software. (See note 7 for additional information).
In addition to the cellular characteristics listed above, additional measurements can be used to test for cell health and viability. Some of these measurements include: Spiking characteristics (inter-spike interval, spike frequency, spike amplitude and spike patterns (i.e., doublets/bursting)) and ion channel conductance (sodium and calcium channel conductances are commonly used)
Optional: Many protocols use retrobead labeled and/or genetically encoded fluorescent proteins to label neuronal subtypes. For these, the process of approaching a cell, establishing a giga-seal and breaking into a cell is identical to the steps described above. However, finding fluorescently labeled cells requires the use of additional microscope equipment, including (but not limited to) LED systems and appropriate wavelength filters. These systems allow for visual observation of fluorescent cells within slices. The easiest way to find a healthy and fluorescently labeled cell is to find the brain area of interest and identify a healthy cell for approach (as described above). After finding a healthy cell turn on the LED/equivalent system to verify if that cell is fluorescent. If the cell shows fluorescence, turn off the illumination system and proceed as described above. If the cell does not contain fluorescence, return back to IR/DIC and continue looking for another healthy cell in the area and repeat. As opposed to looking for fluorescent cells and then determining if they are healthy, identifying healthy cells first will quicken the searching process. Figure 11 depicts a retrobead labeled fluorescent cell body under brightfield (A) and blue light illumination with an LED (to visualize GFP retrobeads).
Figure 6:
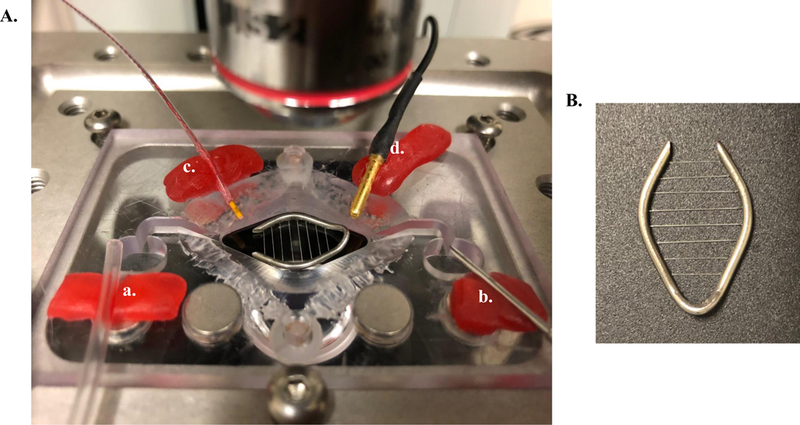
(A) A typical slice recording chamber containing both an inlet (a) and outlet (b) dam for continuous solution flow. This chamber is also equipped with an inline heater (not shown) and bath temperature sensor (c). The microelectrode ground pellet is also shown (d). (B) Slices are positioned and held in place with a metal harp containing 1.5-mm spaced harp strings.
Figure 7:
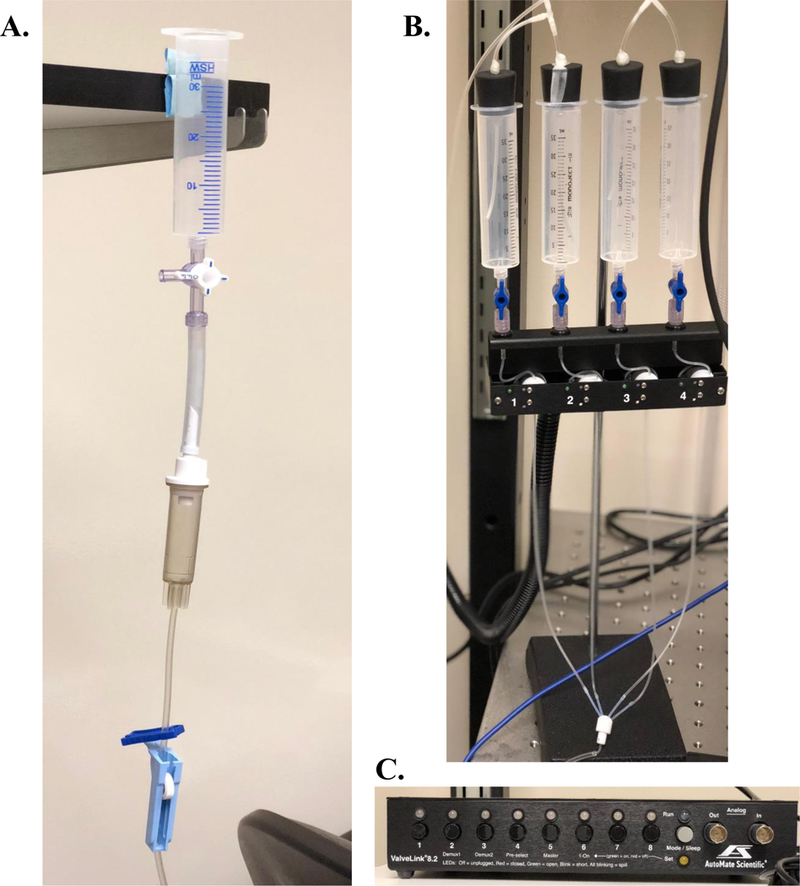
Common perfusion options used in tissue slice electrophysiological studies. (A) Gravity fed, manually operated perfusion option which is equipped with a drip chamber to prevent air bubbles within the inlet line and a roller clamp to modify flow rate. (B) A 4-solution pinch-valve automated perfusion system (Automate Scientific, Berkeley, CA) which can be started and stopped electronically (C). This system is not gravity fed, therefor flow rate is maintained regardless of location and fluid level. This system also prevents air bubbles from entering the recording chamber inlet line. Automated pinch-valve systems also come in 8-and 16-solution options.
Figure 8:
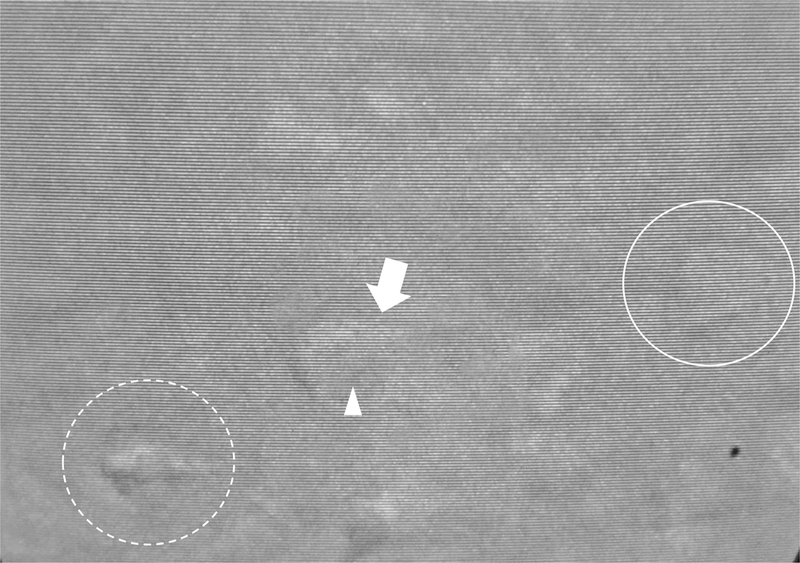
Healthy and unhealthy cells are shown for layer V cells of the medial prefrontal cortex. The solid circle surrounds a healthy cell with preferred pyramidal shape. An unhealthy cell is depicted by the arrow, where the arrowhead shows nuclear swelling encompassing nearly ⅔ of the cell body. The dashed circle depicts an extremely unhealthy cell displaying a shrunken cell body with a ‘wrinkled’ appearance.
Figure 9:
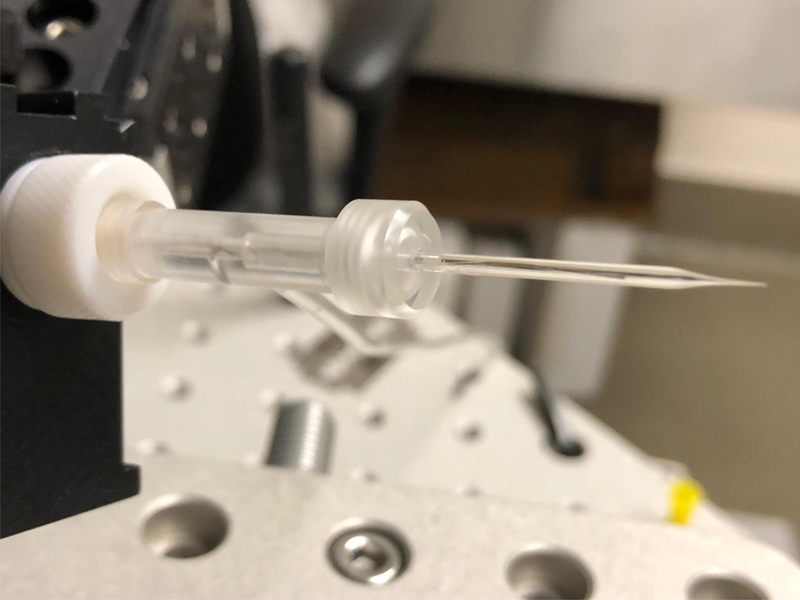
Recording pipette placed in a pipette holder (Molecular Devices, San Jose, CA) located on a micromanipulator (Siskiyou, Grants Pass, OR).
Figure 10:
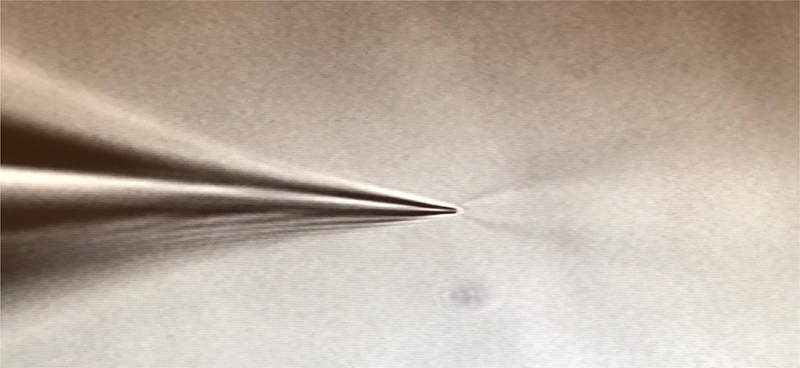
Positive pressure through the recording pipette elicits a ‘firehose effect’ when placed in the bathing solution.
Figure 11:

(A) IR/DIC visualization of a layer V pyramidal cell visualized with white light and (B) under blue light to identify GFP labeled retrobeads located within the soma.
For additional information regarding Adult vs. Young Animals, see note 8.
3.4. Isolating NMDA-and AMPA-Receptor Mediated Potentials/Currents:
Solution Alterations:
Alterations in recording solutions has proven most beneficial for isolating NMDA receptor mediated currents specifically. As discussed above, NMDA receptors are blocked by magnesium ions at resting membrane (more hyperpolarized) potentials. By decreasing the concentration of magnesium in the recording solution, magnesium is prevented from blocking the NMDA receptor pore; therefore, NMDA receptors can be robustly activated at more hyperpolarized potentials. It is common to completely remove magnesium from the recording solution, however many protocols and solution preparations only remove roughly 50 to 75 percent of the normal magnesium concentration to keep the solution physiological.
Pharmacological Isolation:
The most common way for isolating NMDA and AMPA receptor mediated currents is by using pharmacological agents. For isolating AMPAR-mediated and NMDAR-mediated responses, AMPAR agonists and NMDAR antagonists or NMDAR agonists and AMPAR antagonists are used, respectively. Most commonly, these pharmacological agents are added to bathing solutions (recording solutions/aCSF) that are continuously flowing across the tissue (as discussed above). This method is referred to as “bath applied”. An additional method for applying these compounds is through puff application, which allows for localized application of the compounds with the accuracy of targeting a single neuron, even to the level of a single synapse. This technique allows researchers to examine individualized responses and prevent influences from downstream and indirect effects, which could potentially be observed with bath application. Lastly, inclusion of pharmacological compounds within the intracellular solution allows for antagonism of receptors from the inside of the cell. Although less common, this technique allows for single cell isolation of receptors and proves beneficial for blocking currents with a higher efficiency with less equipment (as used for puffing experiments) and is cost efficient (less drug needed than bath application experiments). Table 2 outlines commonly used drugs for isolating AMPA and NMDA receptor mediated responses, the concentration used and the most common application route(s). Commonly used concentrations are optimal for activating the receptor stated in table 2, alterations in this concentration may non-specifically activate other receptor subtypes, especially in instances of greater concentrations.
Table 2:
Commonly used pharmacological agents for isolating AMPA and NMDA receptor mediated responses and application routes.
| Pharmacological Agent |
Receptor Action | Concentration Used (μM) |
Common Application Methods |
|---|---|---|---|
| APV/AP-5 (DL-2-amino- 5-phosphonopentanoic acid) |
NMDA receptor antagonist |
30–50 | bath & puff applied |
| DNQX (6,7- dinitroquinoxaline-2,3 -dione) |
AMPA receptor antagonist |
10–20 | bath & puff applied |
| CNQX (6-cyano-7- nitroquinoxaline-2,3-dione) |
AMPA receptor antagonist |
10–40 | bath & puff applied |
| NMDA (N-methyl-D- aspartate) |
NMDA receptor agonist |
5–100 | bath & puff applied |
| Spermine | AMPA receptor (Ca2+
permeable only) antagonist |
25 | Intracellular solution through recording micropipette |
| Other polyamines | AMPA receptor (Ca2+
permeable only) antagonists |
Varies, depending on the polyamine used |
Intracellular solution through recording micropipette |
Membrane Potential AMPA and NMDA Current Isolation:
Due to the kinetics of these channels and their vastly different activation potentials, it is common to isolate AMPA and NMDA receptor mediated currents by holding the recording cell at different membrane potentials. AMPA receptors can be readily activated at hyperpolarized potentials, thus recording at membrane potentials between −80 mV and −70 mV are ideal for measuring maximal AMPAR-mediated currents. However, because NMDA receptors are blocked by magnesium ions at hyperpolarized potentials, it is readily difficult to obtain NMDAR mediated currents at hyperpolarized potentials. Shifting the holding potential between −25 mV and −35 mV alleviates the magnesium block and allows for maximal NMDAR-mediated currents to be measured. If this manipulation is performed, it is not necessary to lower magnesium concentrations in the recording buffer. . It is necessary to keep in mind that there can be overlap of AMPA and NMDA receptor activation; therefore, it is highly recommended to use pharmacological isolation in combination with alterations in holding membrane potential to ensure complete isolation of each AMPA and NMDA receptor mediated currents.
3.5. Various Induction/Recording Protocols:
Somatic Current Injections
One of the many ways to induce excitatory postsynaptic potentials (EPSPs) is by using somatic current injections. These protocols can be conducted without the use of external stimulation, transgenic animals or viral vectors. While performing a somatic whole-cell patch-clamp recording, current can be injected through the recording pipet to induce cellular depolarization and therefore obtain EPSPs. After following the protocol above for obtaining a somatic recording, a somatic depolarizing current (typically around 50 pA) can be injected into the soma of the recorded neuron. These depolarizations will elicit membrane depolarization in the recorded cell closely resembling an externally (presynaptic transmitter release) stimulated EPSP. For example studies using this technique and these parameters, see (31, 32). Using bath application of NMDA and AMPA receptor agonists and antagonists (see table 2), the currents mediated by these receptors can be pharmacologically isolated. Additionally, alterations in membrane potentials (as discussed above) can aid in isolation of these receptor induced currents. Although less commonly used, somatic current injections can be very beneficial for identifying the effects of drugs and neurotransmitters on AMPA and NMDA receptor mediated currents.
External Stimulation:
One benefit of slice electrophysiology is the study of functional synapses, which are preserved in slice preparations. Therefore, stimulation of afferent fibers can induce excitatory and inhibitory synaptic responses in a postsynaptic cell. One common induction method of excitatory and inhibitory currents is by using external stimulation. External stimulation is conducted when a stimulating electrode is placed within 50–100 μm from the recorded cell and triggered using an electrical stimulation. Most commonly, this method uses concentric bipolar stimulating electrodes, tungsten wire, or stainless steel bipolar electrodes or micropipettes containing high (1–5 M) NaCl concentrations (Figure 12). Once a healthy/approachable cell is found (using the protocol above), move the objective to low power and place the stimulating device within 50–100 μm from the cell body. Once placed, an approach (as outlined above) should be conducted. After establishing a seal, breaking into the cell and establishing cell health, a “stimulus current – evoked response/output” curve should be conducted by increasing stimulus intensity while measuring the evoked response until maximal response is reached. The stimulus intensity should then be adjusted to establish an unsaturated response near the midrange of this curve. If necessary, the stimulating electrode can be removed and relocated either closer to or farther away from the cell to establish an optimal sigmoidal shaped curve. However, removing and relocating a stimulating electrode while already recording from a single cell increases the probability of disrupting the seal and losing the recording. Moving the electrode should be a last resort and deemed absolutely necessary for the experiment to continue.
Figure 12:
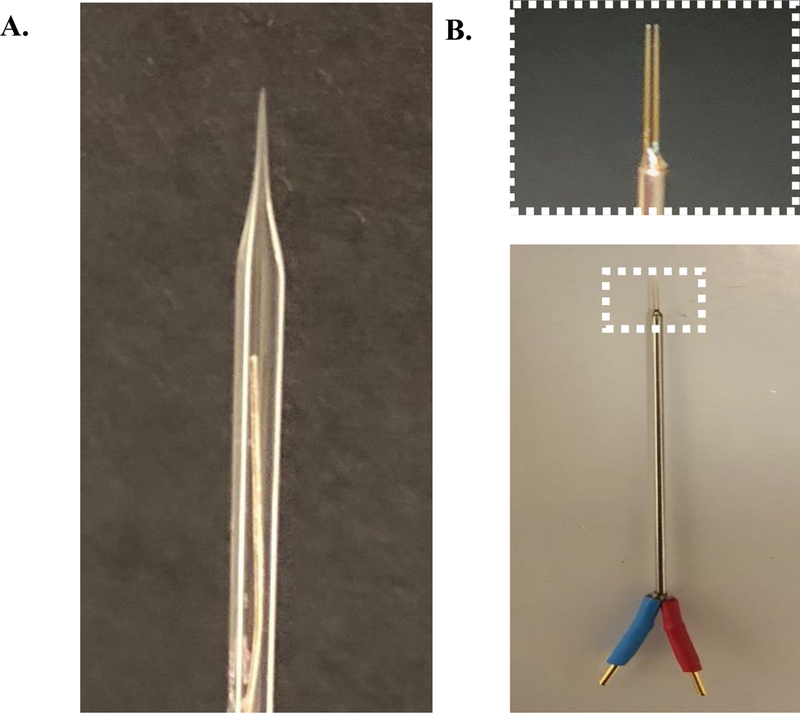
Commonly used external stimulating electrodes in slice electrophysiology. (A) A recording pipette made from 10-mm length 1.5mm O.D. and 0.85mm I.D. capillary glass (Sutter Instruments, Novato, CA) filled with 3M sodium chloride. (B) A bipolar stimulating electrode (FHC, Bowdoin, ME) used for stimulating groups of cells.
Optogenetics:
Optogenetic techniques have revolutionized the field of neurobiology allowing scientists the ability to manipulate neuronal cell populations both in vitro and in vivo with unsurpassed cell type, spatial, and temporal resolution. Using genetically encoded light-sensitive proteins originally isolated from microalgae or other organisms, neurons can be selectively activated using different wavelengths of light. Recent advances in the field of optogenetics allow for both activation and inhibition of populations using different opsins that allow for the passage of sodium and chloride/protons, respectively. The diversity of optogenetic proteins currently available are powerful for ion selection and allow for high levels of spatial and temporal resolution for studying synaptic connectivity.
One method of optogenetics uses a non-specific cell type approach. This approach allows labeling and opsin expression in axonal projections/afferents from specific brain areas without cell-type specificity via the use of panneuronal promoter elements such as synapsin. Opsins are most commonly delivered to a brain area via packaging into viral vectors such as adeno-associated viruses (AAVs) and retroviruses, although genetically engineered animals expressing opsins in various cell types are also available as discussed below. Once delivered to the brain region of interest, the viral vector containing the opsin coding sequence transfects host neurons where it either becomes incorporated into the host genome or exists in an episomal state in the nucleus. Generally, protein expression occurs within 2–3 weeks post-injection, though more rapid expression can be obtained with herpes-type viruses. Most laboratories perform recordings from animals 2-weeks post-injection in order to keep animals within the optimal age range for patch clamp recordings, as well as to allow for recovery from surgical procedures (33,34). After 2-weeks post injection, cell bodies and their axonal projections will contain light-activated channels tagged with a fluorescent molecule (i.e., green fluorescent protein, GFP) as a reporter. With this approach, experimenters should expect to see prominent labeling in every area that neurons of the injected area project to, with greater concentration/intensity in areas where there is stronger innervation. This technique has proved beneficial for studying projection patterns and downstream effects/influences of specific brain regions, regardless of cell type. Additionally, if studies do not require neuronal subtype specificity and focus on regional projections, this methodology does not require transgenic animals and is therefore extremely cost effective. Viral vectors for these experiments are commonly obtained from various academic vector core facilities (i.e., University of Pennsylvania and University of North Carolina at Chapel Hill) as well as commercial vendors (i.e., AddGene, Cambridge, MA).
A major question within the field of neuroscience is how brain functions are driven by specific neuronal cell types. For this reason, Cre-dependent animals have become a widely used tool for expression of opsins in specific neuronal populations with exceptional precision. Cell-type-specific targeting of these proteins is generally achieved through the Cre/lox recombinase system where viral vectors are used to deliver opsin proteins in a Cre-dependent manner, resulting in expression only in Cre-positive cells. Cre-dependent mouse and rat lines have been developed for hundreds of neuronal subtypes and many others are currently in the process of being developed. These animals have greatly enhanced the field of optogenetics and have proven extremely beneficial by allowing scientists the ability to target specific neuronal populations determine cell-specific roles in neural networks.
Although these animals are excellent for labeling neuronal population subtypes, they pose some limitations. Most commonly, incomplete coverage of neurons (i.e. not every cell within that population expresses the opsin) prevents experiments requiring complete labeling of that entire cell population. Additionally, each neuron can vary in the intensity of opsin (also true with non-Cre-dependent expression) which can lead to inconsistencies between animals and cells. Additionally, Cre-dependent animals are often expensive, require breeding at the user’s institution, and are specific for only one neuronal cell type, limiting the possible number of experiments. Furthermore, a major drawback of transgenic animals is the continuous expression of Cre throughout development, which may have detrimental effects on physiological function. Although relatively unexplored, some have suggested that Cre activity can have dramatic developmental deficits as well as promote apoptosis in embryonic tissues (35). While these animals remain on the forefront of technological advances in neurophysiology, it is important to acknowledge that like other techniques the use of these animals comes with limitations and potential drawbacks.
The variety of light activated proteins available for optogenetic techniques is growing daily. However, there are proteins that are more commonly used for excitation and inhibition with their kinetics and expression capabilities already extensively characterized. The most prominently used excitatory opsin is Channelrhodopsin-2 (ChR2), a cation-selective ion channel that allows primarily sodium to pass into the cell upon activation. This channel has the ability to be expressed in a wide variety of tissues types with prominent expression capabilities in mammalian brain tissue, and is widely used in both nonspecific as well as cell-specific neuronal expression. Although there is known light induced desensitization properties of ChR2, it is primarily used for rapid manipulation studies. Other ChR2 variants and opsin proteins, with varied kinetics and activation properties have been developed and are used for studying specific neuronal properties. Optogenetics can also be used for inhibition of neuronal firing. Most commonly, halorhodopsin (NpHR) is a light-activated chloride channel that leads to hyperpolarization of the cell upon opening. Known for its step-like and stable photocurrents, NpHR achieves neuronal inhibition with greater efficiency than other inhibitory opsins. Membrane hyperpolarizations of greater than 100 mV are routinely recorded using NpHR (36), making it one of the most robust optogenetic inhibitors in the field of optogenetics. Other inhibitory proteins such as archaerhodopsin can also be utilized.
3.6. In vivo Relevance of In vitro Recording Protocols
Although this chapter is primarily focused on single-cell whole-cell patch-clamp recordings conducted in mammalian brain slices, it is essential to ensure that results observed in vitro translate to in vivo studies. Thus, studies identifying in vivo effects of drug use on glutamatergic receptors have proven beneficial for validating results observed in whole-cell patch-clamp slice physiology. Changes in NMDA and AMPA receptor mediated responses due to addictive substances in vivo have been heavily studied in animal models and has proven fruitful for validating in vitro findings, for contributing to the understanding the mechanisms underlying addiction, and have proved beneficial for linking behavior with alterations in NMDA and AMPA receptors due to drug intake.
The use of whole-cell patch-clamp electrophysiology in brain slices allows for the study of NMDA and AMPA receptors with controlled parameters yielding less variability between animals and cells. As discussed above, in vitro experiments using slice physiology have shown that commonly abused substances can elicit changes in synaptic plasticity. These results have been partially validated in vivo in dopaminergic neurons of the VTA, where cocaine exposure induces AMPAR mediated LTP within 5 days of a single exposure and was no longer observed after 10 days. These results indicate that changes in LTP from a single cocaine exposure are transient effect that is often difficult to observe in slices (37). In slice physiology, LTP induction protocols have been reported to promote exocytosis of AMPA receptors to the plasma membrane (1, 12), a phenomenon more difficult to observe in vivo. Interestingly, drug consumption (especially cocaine) also induces AMPA receptor recruitment to the plasma membrane, specifically those lacking GluN2A and GluN2B subunits.
A major pitfall of slice physiology alone is the inability to directly link behavior with subcellular changes. The use of in vivo studies have shown that drug abuse induces cellular alterations, which have been further characterized using pharmacological isolation in slices. Recent technological advances have even linked behavior with cellular alterations. Interestingly, optogenetic inhibition of prelimbic afferents of the medial prefrontal cortex, targeting the core of the nucleus accumbens prevents reinstatement of cocaine in rats, and decreases dendritic spine head diameter as well as AMPA/NMDA ratios (38). Recently, low frequency deep brain stimulation within the nucleus accumbens in combination with a dopaminergic D1 receptor antagonist has been shown to abolish drug seeking behavior in mice. This protocol induces mGluR1 dependent LTD thought to depotentiate synapses on D1 receptor containing medium spiny neurons, reversing drug induced plasticity (39). Additionally, NMDA receptor antagonists administered in vivo have been shown to impair lever pressing for cocaine self-administration, while AMPA receptor antagonists impair lever pressing for cocaine, alcohol and amphetamine self-administration (28), directly linking glutamatergic receptors to addictive behaviors. NMDA receptor antagonists have also been shown to block locomotor effects induced by cocaine (40), further indicating the role of NMDA receptors in drug induced behavior. Interestingly, an increase in spine head density, AMPA/NMDA ratios, as well as an increase in GluA1 (AMPA) as well as GluN2A and GluN2B (NMDA) receptor subunits were observed in spiny neurons of the nucleus accumbens following self-administration of nicotine in rats (41). In combination, these studies have contributed significantly to linking behavioral and cellular aspects of addiction, while also suggesting the importance in studying glutamatergic receptors in addiction phenomena.
One recent theory is that cocaine addiction increases plasticity in the brain through alterations of NMDA receptor subunits, reverting the neural environment back to a developmental state within the nucleus accumbens. Silent synapses are extremely abundant within the developing brain and contain a large number NMDA receptors consisting of GluN2B subunits and GluA2-containing AMPA receptors. However, as discussed above, over the course of development NMDA receptors containing GluN2B subunits are downregulated, making the synapse less ‘plastic’. in vivo exposure to cocaine has been shown to generate silent synapses through insertion of new GluN2B-containing NMDARs within the membrane (13, 42), thus making the synapse more prone to synaptic modifications in the presence of cocaine. Enhanced plasticity of these synapses is thought to promote long-lasting memory modifications induced by the drug itself. Furthermore, GluA2-containing AMPA receptors have also been shown to be upregulated due to cocaine withdrawal. The enhanced conductance of GluA2 containing AMPA receptors and an increase in number of AMPARs is thought to increase plasticity and facilitate cocaine-induced memory formation, increasing drug craving and relapse in the presence of certain cocaine-related cues (43). Together, these studies indicate the importance of studying AMPA and NMDA receptor subunits in addiction, as they may lead to new drug targets for preventing relapse. For a review of drug induced glutamatergic subunit alterations, see Russo et al. (44).
While it has been established in vivo and in vitro that AMPA and NMDA receptors play a role in drug seeking and addiction-related physiological changes, a complete understanding of the mechanisms remains unknown. Using a combination of in vivo and in vitro approaches remains most beneficial for studying unknown aspects of the disorder. Importantly, establishing the effects of addictive substances on currents mediated by glutamatergic receptors and subcellular mechanisms for synaptic modifications that may underlie addictive behaviors remains an important aspect in understanding addiction.
3.7. Analysis of Electrophysiological Currents:
Analysis of AMPA and NMDA receptor mediated currents in vitro can be used to:
Estimate the ratio of AMPA to NMDA receptors within a post-synaptic cell and how pharmacological agents and stimulation protocols can alter it.
Determine how a pharmacological agents can alter the kinetics of these receptors.
Determine if pharmacological agents preferentially alter one current over another (i.e. effects on AMPA versus NMDA receptors) providing insight to their overall effects on cellular function (synaptic transmission versus plasticity).
Lend insight into glutamatergic subunit alterations.
Lend insight into overall behavioral changes due to receptor number and kinetic alterations.
Analysis of AMPA/NMDA Ratios:
As discussed above, AMPA and NMDA receptors are responsible for very different physiological aspects (fast synaptic transmission and synaptic plasticity, respectively). For this reason, analysis of the AMPA/NMDA ratio has yielded beneficial in determining the relative expression of AMPA and NMDA receptors at the synapse. Because is difficult to determine the strength of excitatory synapses between different cell types and connections, the AMPA/NMDA ratio provides a normalized measurement for such comparisons due to its independence from positioning electrodes or number of stimulated synapses. It is common to measure an intact (“whole”) EPSP, containing both AMPA and NMDA receptor mediated components, and applying either an AMPA or NMDA receptor antagonist to isolate the NMDA or AMPA receptor mediated current, respectively. Using digital subtraction, the isolated current can then be subtracted from the ‘whole’ EPSP, where the remainder is mediated by the other receptor subtype. For example, if an AMPA antagonist was used, the second measurement should contain only the NMDA receptor mediated current. When subtracted from the ‘whole’ EPSP, the remainder would be current mediated by the AMPA receptor. Once isolated, the amplitude is then taken for each current and a ratio is taken (figure 13). Alterations of this ratio can lend insight into drug-induced behavioral effects.
Figure 13:

Commonly measured characteristics of glutamatergic responses. (A) Decay time is measured as the time it takes for the response to reach 37% of the initial peak amplitude. (B) Rise time is calculated as the time it takes from initial deflection for the response to reach peak amplitude. (C) Response amplitude is measured from baseline to peak. In current clamp this measurement is recorded in millivolts and in voltage clamp this measurement is recorded in nA. (D) The area under the curve is measured as the total area under the curve and above baseline (dotted line).
Analysis of Channel Kinetics:
Most commonly, measurements of NMDA and AMPA receptor kinetics are indicated by changes in rise time, decay time, amplitude and area under the curve. All of these measurements can be taken from the same current trace (figure 13). However, each measurement can indicate very different aspects of the current. Changes in rise time suggest alterations in activation kinetics of the receptor making its activation time quicker (decrease in rise time) or slower (increase in rise time). An alteration in decay time suggests a change in inactivation kinetics of the channel while changes in current amplitude and area under the curve indicate changes in channel permeability. Additionally, changes in decay time can be indicative of GluN2B subunit composition, where an increase in NMDA decay time can indicate an increase in extrasynaptic GluN2B subunit expression, where these subunits have been shown to have preferred distribution patterns (25, 45). In combination, these analyses can lend insight into how channels may be undergoing subunit and kinetic alterations. These measurements are commonly used in experiments identifying pharmacological effects on AMPA and NMDA receptor mediated currents and prove beneficial in determining where pharmacological agents may be having their effects on a synaptic and subcellular level.
4. Notes:
ATP and GTP readily degrade at room temperature, therefore once they have been added to solution the process should be conducted as quickly as possible. For this reason, it is also common to add ATP and GTP just before use to ensure they are not degraded.
There are many different iterations of these solutions. For example, many researchers use a cutting solution completely free of sucrose, as it is known to alter endogenous dopamine release in slices. It is essential to make solutions based on slice preparation and physiological measurements. Intracellular solutions can vary widely depending on the cell type and the measurement to be recorded. Additionally, alterations in recording solution is also common (for example, removing magnesium for the study of NMDA receptors – to be discussed below). It is always important to review previous literature regarding an area of interest before choosing the correct solutions.
Healthy Cells: Cell bodies are round; red blood cells have normal ‘donut’ shaped appearance (suggesting osmolarity is acceptable); lack of debris floating or coming off from the tissue
Unhealthy Cells: Cell bodies are swollen or crinkled; Nuclei of cells are visually apparent; red blood cells are oddly shaped (e.g., cell bodies swollen or crinkled); abundance of debris floating or coming off from tissue.
Generally, healthiest cells are 50–100 μm below the slice surface. These cells are deep enough in the slice that they remain relatively unaffected and undamaged throughout the slicing process. When looking for a healthy cell to approach, the deeper the cell is located, the higher likelihood that it is viable and healthy for longer recordings.
If the cell moves away from the pipette, it is either unhealthy or the approach is too close to the edge of the tissue. If this occurs, slightly retract the pipette and retry the approach. If the cell no longer slips away from the pipette, it can be assumed that the cell is healthy. However, if the cell still slips, it is likely unhealthy and should be disregarded. The degree of cell dimpling will vary across cell types and animal age. However, the approach of the cell should always be directed towards the largest part of the cell body. For example, if recording from a pyramidal (tear drop shaped) cell within the PFC, the approach should be aimed towards the large end of the tear drop. This idea holds true for all cells -the larger the surface area, the easier it is to obtain a seal.
There are many options for recording software (e.g. Axon, Axograph etc.) which provide an interface between the amplifier, digitizer and any other patch-clamp electronics. Digitizers allow for compensation of capacitance and resistance through way of manual control (i.e. nobs and switches present on the digitizer itself) or digital control through the computer software. It is essential to explore the capabilities of the recording software, as some software is only compatible with certain digitizers and amplifiers. For healthy cells, table 1 outlines normal pipet resistance (after breakin), membrane resistance, membrane capacitance and resting membrane potentials have been included for a subset of regularly studied cells. Any large deviations in these ranges should be considered when evaluating the health of a cell.
Adult vs. Young Animals: The steps above are outlined above are primarily for young animal slice prep. When recording from slices made from an older animal (over the age of 6 weeks) there are a few subtle differences to keep in mind. The plasma membranes of these neurons are generally much thicker and require more suction to break into the cell. Some labs recommend using syringe suction for this process, as stronger suction can be applied with ease and more regulation. A modification in recording pipette tip size is also an option. By decreasing the resistance (increasing the size of the pipette tip) less suction is needed to rupture the membrane. However, the larger tip makes it more difficult to obtain a giga-seal. If there are issues obtaining a seal with the 4–6 pipettes, the normal resistance used with slices from young animals, the pipette resistance can also be increased by making the tip smaller. Smaller diameter pipettes allow seals to be easily obtained, but it is important to keep in mind that more suction will be needed to break into the membrane. Additionally, the membrane resistance of cells in older animals is generally higher due to the thicker and heartier cell membrane. It is important to accommodate for this when checking for cell health.
Table 1:
Electrophysiological characteristics of commonly studied cells types in addiction.
| Brain Region | Cell Type | Pipette Resistance (mΩ ) |
Membrane Resistance (mΩ) |
Membrane Capacitance (pF) |
Resting Membrane Potential (mV) |
|---|---|---|---|---|---|
| mPFC | Layer II/III pyramidal cell |
<20 | 155–400 | 70–90 | −55 – −80 |
| Layer V − Type I pyramidal cell |
<20 | 80–150 | 150–220 | −65 – −75 | |
| Layer V − Type II pyramidal cell |
<20 | 70–110 | 120–170 | −65 – −75 | |
| Hypothalamus | POMC neurons | <20 | 1–4 | 20–30 | −35 – −50 |
| AgRP neurons | <20 | 80–110 | 10–20 | −35 – −50 | |
| Nucleus Accumbens |
cholinergic interneurons |
<20 | 70–110 | 10–30 | −60 – −65 |
| Ventral Tegmental Area | dopaminergic neurons |
<20 | 80–180 | 40–70 | −40 – −50 |
5. Conclusion:
The protocols outlined above are aimed to provide guidance in studying glutamatergic receptors within mammalian brain slices. Due to the importance of AMPA and NMDA receptor contributions to neuronal functions, we have provided commonly used experimental protocols for properly isolating AMPA and NMDA receptor mediated currents. The protocols outlined above are commonly modified based on slice preparation and should not be considered the only way to conduct these experiments, but used as a guideline for commonly performed single-cell whole-cell patch clamp electrophysiology procedures for measuring AMPA and NMDA receptor mediated responses. Used properly, these techniques can aid in the study of neuronal circuits and cellular mechanisms related to addiction.
Acknowledgements:
This work was funded by DA036569 (CDG) and AA025590 and DA042172 (MFO).
References:
- 1.Malinow R Malenka RC (2002) AMPA receptor trafficking and synaptic plasticity. Annu Rev Neurosci 25:103–26 [DOI] [PubMed] [Google Scholar]
- 2.Lu W, Shi Y, Jackson AC et al. (2009) Subunit composition of synaptic AMPA receptors revealed by a single-cell genetic approach. Neuron 62:254–68 [DOI] [PMC free article] [PubMed] [Google Scholar]
- 3.Martin LJ, Blackstone CD, Levey AI et al. (1993) AMPA glutamate receptor subunits are differentially distributed in rat brain. Neuroscience 53:327–58 [DOI] [PubMed] [Google Scholar]
- 4.Schwenk J, Baehrens D, Haupt A et al. (2014) Regional diversity and developmental dynamics of the AMPA-receptor proteome in the mammalian brain. Neuron 84:41–54 [DOI] [PubMed] [Google Scholar]
- 5.Lomeli H, Mosbacher J, Melcher T et al. (1994) Control of kinetic properties of AMPA receptor channels by nuclear RNA editing. Science 266:1709–13 [DOI] [PubMed] [Google Scholar]
- 6.Sommer B, Keinanen K, Verdoorn TA et al. (1990) Flip and flop: a cell-specific functional switch in glutamate-operated channels of the CNS. Science 249:1580–5 [DOI] [PubMed] [Google Scholar]
- 7.Geiger JR, Melcher T, Koh DS et al. (1995) Relative abundance of subunit mRNAs determines gating and Ca2+ permeability of AMPA receptors in principal neurons and interneurons in rat CNS. Neuron 15:193–204 [DOI] [PubMed] [Google Scholar]
- 8.Abraham WC, Huggett A (1997) Induction and reversal of long-term potentiation by repeated high-frequency stimulation in rat hippocampal slices. Hippocampus 7:137–45 [DOI] [PubMed] [Google Scholar]
- 9.Dan Y, Poo MM (2006) Spike timing-dependent plasticity: from synapse to perception. Physiol Rev 86:1033–48 [DOI] [PubMed] [Google Scholar]
- 10.Madison DV, Malenka RC, Nicoli RA (1991) Mechanisms underlying long-term potentiation of synaptic transmission. Annu Rev Neurosci 14:379–97 [DOI] [PubMed] [Google Scholar]
- 11.Makino H, Malinow R (2009) AMPA receptor incorporation into synapses during LTP: the role of lateral movement and exocytosis. Neuron 64:381–90 [DOI] [PMC free article] [PubMed] [Google Scholar]
- 12.Malenka RC (2003) Synaptic plasticity and AMPA receptor trafficking. Ann N Y Acad Sci 1003:1–11 [DOI] [PubMed] [Google Scholar]
- 13.Dong Y, Nestler EJ (2014) The neural rejuvenation hypothesis of cocaine addiction. Trends in Pharmacological Sciences 35:374–383 [DOI] [PMC free article] [PubMed] [Google Scholar]
- 14.Lüscher C, Xia H, Beattie EC et al. (1999) Role of AMPA receptor cycling in synaptic transmission and plasticity. Neuron 24:649–58 [DOI] [PubMed] [Google Scholar]
- 15.Song I, Huganir RL (2002) Regulation of AMPA receptors during synaptic plasticity. Trends Neurosci: 25:578–88 [DOI] [PubMed] [Google Scholar]
- 16.Derkach VA, Oh MC, Guire ES et al. (2007) Regulatory mechanisms of AMPA receptors in synaptic plasticity. Nat Rev Neurosci 8:101–13 [DOI] [PubMed] [Google Scholar]
- 17.Traynelis SF, Wollmuth LP, McBain CJ et al. (2010) Glutamate receptor ion channels: structure, regulation, and function. Pharmacol Rev 62:405–96 [DOI] [PMC free article] [PubMed] [Google Scholar]
- 18.Dingledine R, Borges K, Bowie D et al. (1999) The glutamate receptor ion channels. Pharmacol Rev 51:7–61 [PubMed] [Google Scholar]
- 19.Cull-Candy S, Brickley S, Farrant M (2001) NMDA receptor subunits: diversity, development and disease. Curr Opin Neurobiol 11:327–35 [DOI] [PubMed] [Google Scholar]
- 20.Flint AC, Maisch US, Weishaupt JH et al. (1997) NR2A subunit expression shortens NMDA receptor synaptic currents in developing neocortex. J Neurosci 17:2469–76 [DOI] [PMC free article] [PubMed] [Google Scholar]
- 21.Sun W, Hansen KB, Jahr CE (2017) Allosteric interactions between NMDA receptor subunits shape the developmental shift in channel properties. Neuron 94:58–64 [DOI] [PMC free article] [PubMed] [Google Scholar]
- 22.Hardingham GE, Bading H (2010) Synaptic versus extrasynaptic NMDA receptor signalling: implications for neurodegenerative disorders. Nat Rev Neurosci 11:682–96 [DOI] [PMC free article] [PubMed] [Google Scholar]
- 23.Angulo MC, Kozlov AS, Charpak S et al. (2004) Glutamate released from glial cells synchronizes neuronal activity in the hippocampus. J Neurosci 24:6920–7 [DOI] [PMC free article] [PubMed] [Google Scholar]
- 24.Fellin T, Pascual O, Gobbo S et al. (2004) Neuronal synchrony mediated by astrocytic glutamate through activation of extrasynaptic NMDA receptors. Neuron 43:729–43 [DOI] [PubMed] [Google Scholar]
- 25.Papouin T, Ladépeche L, Ruel J et al. (2012) Synaptic and extrasynaptic NMDA receptors are gated by different endogenous coagonists. Cell 150:633–46 [DOI] [PubMed] [Google Scholar]
- 26.Kauer JA, Malenka RC (2007) Synaptic plasticity and addiction. Nat Rev Neurosci 8):844–58 [DOI] [PubMed] [Google Scholar]
- 27.Jones S, Bonci A (2005) Synaptic plasticity and drug addiction. Curr Opin Pharmacol 5:20–5 [DOI] [PubMed] [Google Scholar]
- 28.Jackson A, Mead AN, Stephens DN (2000) Behavioural effects of alpha-amino-3-hydroxy-5-methyl-4-isoxazolepropionate-receptor antagonists and their relevance to substance abuse. Pharmacol Ther 88: 59–76 [DOI] [PubMed] [Google Scholar]
- 29.Kelley AE, Andrzejewski ME, Baldwin AE et al. (2003) Glutamate-mediated plasticity in corticostriatal networks: role in adaptive motor learning. Ann N Y Acad Sci 1003:159–68 [DOI] [PubMed] [Google Scholar]
- 30.Wolf ME (1998) The role of excitatory amino acids in behavioral sensitization to psychomotor stimulants. Prog Neurobiol 54:679–720 [DOI] [PubMed] [Google Scholar]
- 31.Gonzalez-Burgos G, Barrionuevo G (2001) Voltage-gated sodium channels shape subthreshold EPSPs in layer 5 pyramidal neurons from rat prefrontal cortex. J Neurophysiol 86:1671–84 [DOI] [PubMed] [Google Scholar]
- 32.Rotaru DC, Lewis DA, Gonzalez-Burgos G (2007) Dopamine D1 receptor activation regulates sodium channel-dependent EPSP amplification in rat prefrontal cortex pyramidal neurons. J Physiol 581: 981–1000 [DOI] [PMC free article] [PubMed] [Google Scholar]
- 33.Little JP, Carter AG (2012) Subcellular synaptic connectivty of layer 2 pyramidal neurons in the medial prefrontal cortex. J Neuroscience 32: 12808–12819 [DOI] [PMC free article] [PubMed] [Google Scholar]
- 34.Ji G, Neugebauer V (2012) Modulation of medial prefrontal cortical activity using in vivo recordings and optogenetics. Mol Brain 5:36. [DOI] [PMC free article] [PubMed] [Google Scholar]
- 35.Naiche LA, Papaioannou VE (2007) Cre activity causes widespread apoptosis and lethal anemia during embryonic development. Genesis 45:768–75 [DOI] [PubMed] [Google Scholar]
- 36.Gradinaru V, Zhang F, Ramakrishnan C et al. (2010) Molecular and cellular approaches for diversifying and extending optogenetics. Cell 141:154–165 [DOI] [PMC free article] [PubMed] [Google Scholar]
- 37.Ungless MA, Whistler JL, Malenka RC et al. (2001) Single cocaine exposure in vivo induces long-term potentiation in dopamine neurons. Nature 411:583–7 [DOI] [PubMed] [Google Scholar]
- 38.Stefanik MT, Kupchik YM, Kalivas PW (2016) Optogenetic inhibition of cortical afferents in the nucleus accumbens simultaneously prevents cue-induced transient synaptic potentiation and cocaine-seeking behavior. Brain Struct Funct 221:1681–9 [DOI] [PMC free article] [PubMed] [Google Scholar]
- 39.Creed M, Pascoli VJ, Luscher C (2015) Addiction therapy. Refining deep brain stimulation to emulate optogenetic treatment of synaptic pathology. Science 347:659–64 [DOI] [PubMed] [Google Scholar]
- 40.Karler R, Calder LD, Chaudhry IA et al. (1989) Blockade of “reverse tolerance” to cocaine and amphetamine by MK-801. Life Sci 45:599–606 [DOI] [PubMed] [Google Scholar]
- 41.Gipson CD, Kupchik YM, Shen H et al. (2013) Relapse induced by cues predicting cocaine depends on rapid, transient synaptic potentiation. Neuron 77:867–72 [DOI] [PMC free article] [PubMed] [Google Scholar]
- 42.Huang YH, Lin Y, Mu P et al. (2009) In vivo cocaine experience generates silent synapses. Neuron 63:40–7 [DOI] [PMC free article] [PubMed] [Google Scholar]
- 43.Conrad KL, Tseng KY, Uejima JL et al. (2008) Formation of accumbens GluR2-lacking AMPA receptors mediates incubation of cocaine craving. Nature 454:118–21 [DOI] [PMC free article] [PubMed] [Google Scholar]
- 44.Russo SJ, Dietz DM, Dumitriu D et al. (2010) The addicted synapse: mechanisms of synaptic and structural plasticity in nucleus accumbens. Trends Neurosci 33:267–76 [DOI] [PMC free article] [PubMed] [Google Scholar]
- 45.Petralia RS (2012) Distribution of extrasynaptic NMDA receptors on neurons. Scientific World Journal, Article ID 267120 [DOI] [PMC free article] [PubMed] [Google Scholar]


