Abstract
Mechanisms explaining the relationship between obesity and cardiovascular disease (CVD) are needed. Despite growing recognition of the importance of the anucleate platelet transcriptome, low levels of RNA in platelets make assessment difficult. We sought to perform unbiased platelet RNA profiling in obesity by performing a prospective study of severe obesity and weight loss via bariatric surgery on platelet characteristics and mRNA profile in 26 pre-menopausal, non-diabetic women (31.6 ± 8.4 years; BMI 43.0 ± 6.5 kg/m2) who underwent sleeve gastrectomy. Ten women of similar age with normal BMI served as controls. Platelet activation via flow cytometry was assessed before and after surgery. RNAseq was performed on platelet isolates from a subset of 13 subjects (8 obese women and 5 normal-BMI subjects). Platelet count, size and age did not differ between control and obese women. However, platelet surface P-selectin and CD40 were higher in obesity. RNAseq demonstrated 629 differentially abundant transcripts in obesity. Notably, S100A9 and AGER, established markers of cardiovascular risk, were two of the most highly upregulated transcripts (each >2.5 fold). At 6 months post-operatively, subjects lost 26.1 ± 5.8% body weight and inducible platelet P-selectin expression was reduced. Expression of 170 transcripts was affected by surgery, but only a small fraction (46/629) were genes found altered in obesity. We demonstrate that obesity is associated with an altered platelet transcriptome and increased platelet activation, which is partly attenuated by bariatric surgery. These observations suggest that platelets may contribute to increased cardiovascular risk in obesity through a variety of mechanisms.
Keywords: platelet, RNA, obesity, bariatric surgery, cardiovascular diseases
Introduction
Obesity contributes to global cardiovascular disease (CVD) burden and one potential mechanism for this heightened risk is platelet dysfunction in obesity (1–4). Beyond being crucial mediators of hemostasis, platelets are increasingly recognized as immune cells (5). Of particular relevance to atherothrombotic risk, products released during platelet activation, as well as platelet-derived RNAs and miRNAs (both directly and via platelet-derived microparticles) are known to affect function of both macrophages and endothelial cells (6,7).
Despite growing recognition of the importance of the platelet RNA profile, low levels of RNA in platelets make assessment difficult. Nonetheless, previous work targeted specifically at inflammatory genes demonstrated differential expression of a number of transcripts in obesity (8). One of these, S100A9 (also known as MRP14), has been found to be predictive of adverse cardiovascular outcomes in coronary and peripheral artery disease (9,10). Recently, RNA-sequencing (RNAseq) technology has introduced a powerful tool for understanding roles of platelets in various disease states. Reports of whole transcriptomic profiling of platelets are few and largely limited to healthy individuals (11–15), although some reports in disease, specifically CVD, are available (16,17). Notably, unbiased platelet RNA profiling in obesity has not previously been performed. Herein, we report the first RNAseq analysis of human platelets in obesity and following substantial weight loss via bariatric surgery.
Methods
All premenopausal women aged 21–50 years undergoing sleeve gastrectomy (18) at Bellevue Hospital (NY, NY) over a 4 month period were approached for a prospective observational pilot study approved by the NYU School of Medicine IRB. A single gender and limited age range were chosen because of the known differences in platelet gene expression by age and gender (8,19). Patients were excluded if they were active smokers, taking lipid-lowering agents, diabetes medications, anticoagulants, or any medication known to affect platelet function.
Subjects providing informed consent presented to the NYU-HHC CTSI Clinical Research Center after an overnight fast, between 2–6 weeks prior to surgery (in a state of weight maintenance) and at 6 months following surgery, for anthropmetric measures and blood sampling. Blood draws were performed with 19 gauge needles without tourniquets into sodium citrate-containing tubes (BD Vaccutainer, Franklin Lakes, NJ). Assessments of platelet characteristics and platelet isolation for RNA collection began within 15 minutes of blood draw completion.
Premenopausal women, aged 21–50 years, recruited via flyers posted around the medical center, with normal BMI (18.5–24.9kg/m2), but otherwise meeting all enrollment criteria and of similar race and ethnic background as obese subjects, were enrolled as controls. These subjects also were non-smokers and not taking lipid-lowering agents, diabetes medications, anticoagulants, or any medication known to affect platelet function. Control subjects attended a single study visit that was identical to those of obese subjects.
Measures of platelet characteristics and activation
Platelet count and mean platelet volume (MPV) were measured on a Coulter Ac T diff 2® (Beckman Coulter, Brea, CA). Assessment of surface markers of platelet activation (P-selectin with and without exposure to thrombin, and CD40), and reticulated platelets (thiazole orange) was performed on a C6 Plus flow cytometer (BD Accuri, San Jose, CA) as previously described (10). Statistical comparisons were performed with independent samples t-tests (obese versus normal BMI) and paired-samples t-tests (obese before versus obese 6 months after surgery) using SPSS (Armonk, NY).
Platelet RNA isolation and sequencing
RNA from washed platelets was isolated as previously described (17). In short, blood collected with sodium citrate as the anticoagulant was centrifuged (200g × 10min) to obtain platelet-rich plasma (PRP). PRP was centrifuged (1000g × 10min) and the platelet pellet resuspended in Tyrode’s buffer. CD45+ and Glycophorin A magnetic beads (EasySep, STEMCELL, Vancouver, Canada) were used to to limit non-platelet contamination. Depletion effectiveness was assessed by flow cytometry and demonstrated a platelet-to-leukocyte ratio of <1:1×10⁷. Further, there was no detectable CD45 transcript in platelet RNA samples. TRIzol® Reagent (Invitrogen, Carlsbad, CA) was added to purified washed platelet pellets, the pellets disrupted and samples stored at −80C until isolation using Quick-RNA MiniPrep kits (Zymo Research, Irvine, CA) according to the manusfacturer’s instructions.
Deep RNA sequencing of platelet RNA was performed in the NYU Genome Technology Core. Briefly, following demonstration of adequate RNA quality via RNA 6000 Pico kit (Agilent, Santa Clara, CA) analysis, rRNA was depleted using Ribo-Zero Gold (Illumina, San Diego, CA). RNASeq library preps were made using the Illumina TruSeq® Stranded mRNA LT kit on a Beckman Biomek FX instrument, using 500 ng of total RNA as input, amplified by 10 cycles of PCR, and run on an Illumina HiSeq 4000, as single read 50. RNAseq differential expression analysis was performed for three lanes of a single-read 50 Illumina HiSeq 4000 run. Per-read per-sample FASTQ files were generated using the bcl2fastq2 Conversion software (v2.17) to convert per-cycle BCL base call files outputted by the sequencing instrument into the FASTQ format. The alignment program, STAR (v2.4.5a), was used for mapping reads of samples to the human reference genome hg19 and the application FastQ Screen (v0.5.2) was utilized to check for contaminants. Statistical analysis was performed with the R DESeq2 package (Bioconductor v3.3.0).
Obesity- and bariatric surgery-affected genes were identified as those differentially expressed in obese versus control subjects or pre-operative versus post-operative samples, repectively, that met 1) p-value ≤0.05 and 2) abundance threshold cut-off of >1/15000th the expression of beta-actin (base mean counts ≥5). Pathway analyses were completed using IPA (QIAGEN Inc., Germantown, MD) and DAVID 6.8 (NIAID, NIH).
Transcript Validation
The QuantiTech Whole Transcriptome kit (QIAGEN Inc., Germantown, MD) was used to amplify cDNA from isolated platelet RNA according to the manufacturer’s instructions. Fast SYBR Green (Applied Biosystems, Foster City, CA) real time polymerase chain reaction (PCR) mix was then used according to manufacturer’s instructions to quantify expression of several transcripts of interest in amplified cDNA on a QuantStudio 7 Flex (Applied Biosystems, Foster City, CA) quantitative PCR machine. Primer sequences are listed in Table 3.
Table 3.
Primer sequences used in RT-qPCR validation
| Transcript | Forward primer sequence | Reverse primer sequence |
|---|---|---|
| GAPDH | TGTGGGCATCAATGGATTTGG | ACACCATGTATTCCGGGTCAAT |
| S100A9 | GGTCATAGAACACATCATGGAGG | GGCCTGGCTTATGGTGGTG |
| S100A8 | ATGCCGTCTACAGGGATGAC | ACTGAGGACACTCGGTCTCTA |
| AGER | GTGTCCTTCCCAACGGCTC | ATTGCCTGGCACCGGAAA |
| NAPG | CTACCAGAGGCCGTTCAGCTA | CCTGTCGTAAGCGTTCTTCAT |
| ARL8 | CATCGCGTCAGGTCAATTCAG | GTTGTCCTCCTATGTCCCAGA |
| MAPK1 | TACACCAACCTCTCGTACATCG | CATGTCTGAAGCGCAGTAAGATT |
| RPS21 | AGCAATCGCATCATCGGTG | CCCCGCAGATAGCATAAGTTTTA |
Results
Surgical subjects were young (31.6 ± 8.4 years) and severely obese (43.0 ± 6.5kg/m2). There was no difference in baseline characteristics between those 19 subjects who returned for six-month visits and the entire obese cohort (n=26). Normal BMI subjects were of similar age and ethnic background. At six months after surgery, subjects lost 26.1 ± 5.8% body weight (30.4 ± 9.1kg) and significantly reduced BMI and waist circumference (Table 1).
Table 1.
Characteristics of obese and normal BMI subjects
| Obese - baseline | Obese - 6 months post-op | Control | |
|---|---|---|---|
| n = 26 | n=19 | n = 10 | |
| Female sex (percent) | 100 | 100 | |
| Age (years) | 31.6 ± 8.4 | 32.0 ± 3.7 | |
| Weight (kg) | 116 ± 23 | 87 ± 22** | 58 ± 5** |
| BMI (kg/m2) | 43.0 ± 6.5 | 32.1 ± 6.0** | 22.8 ± 2.3** |
| Waist circumference (cm) | 121 ± 14 | 96 ± 14** | 80 ± 5** |
| Platelets (103/uL) | 283 ± 60 | 297 ± 89 | 281 ± 80 |
| Mean platelet volume | 8.4 ± 0.8 | 8.3 ± 0.8 | 8.5 ± 1.0 |
| Reticulated platelets (MFI) | 81 ± 42 | 74 ± 15 | 73 ± 27 |
p<0.01 for comparison with Obese – baseline
Platelet characteristics
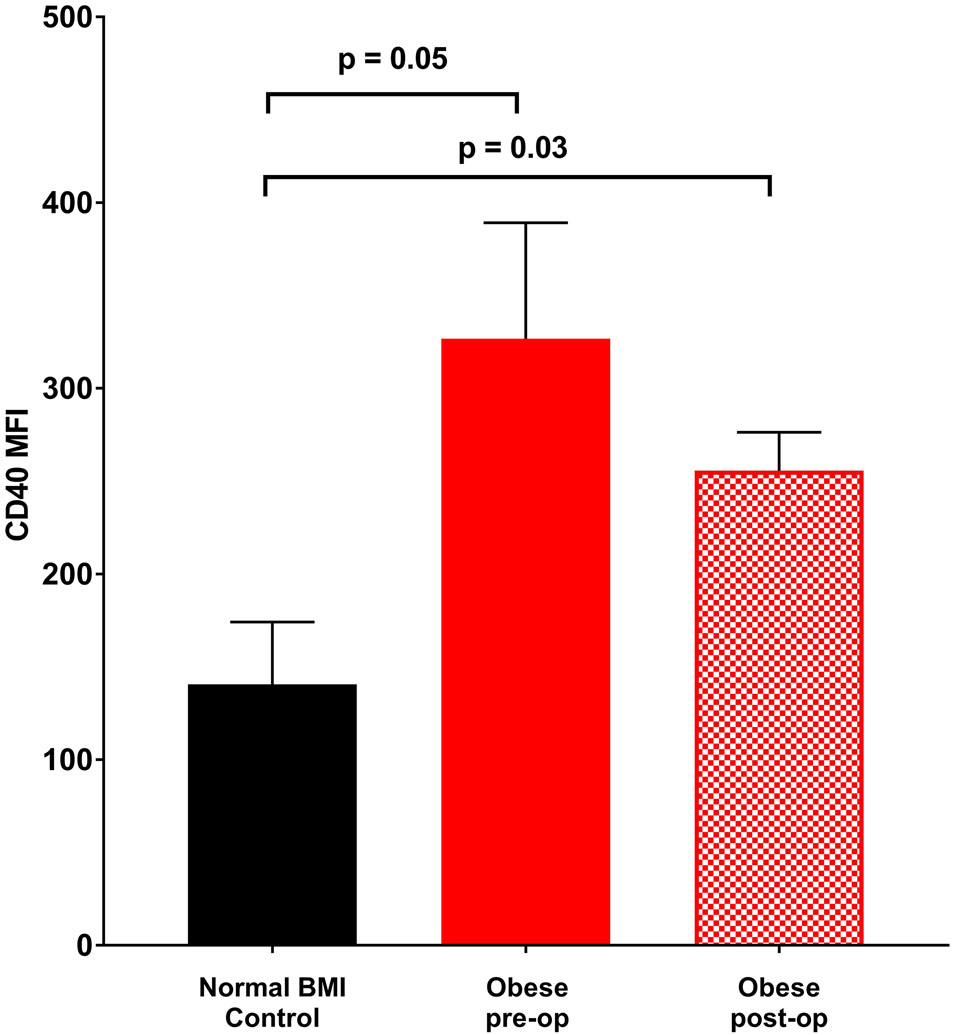
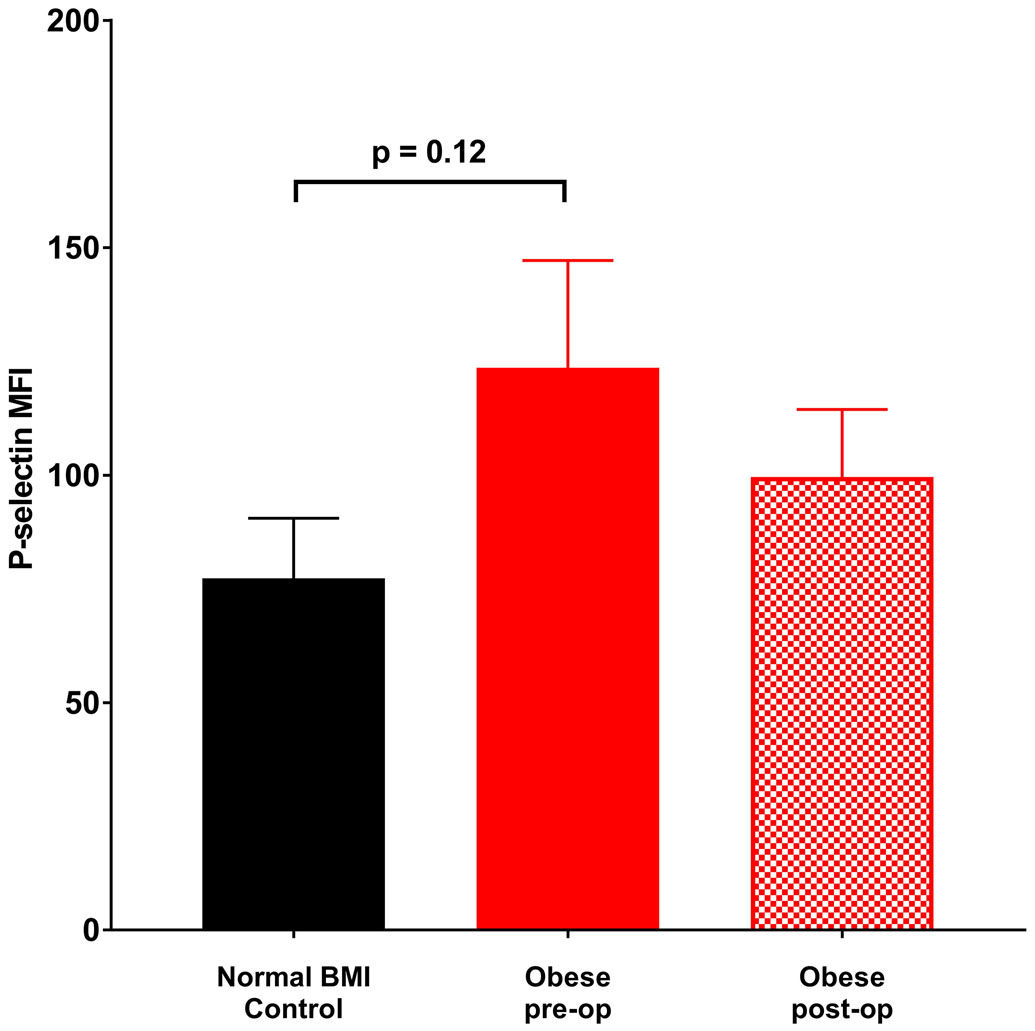
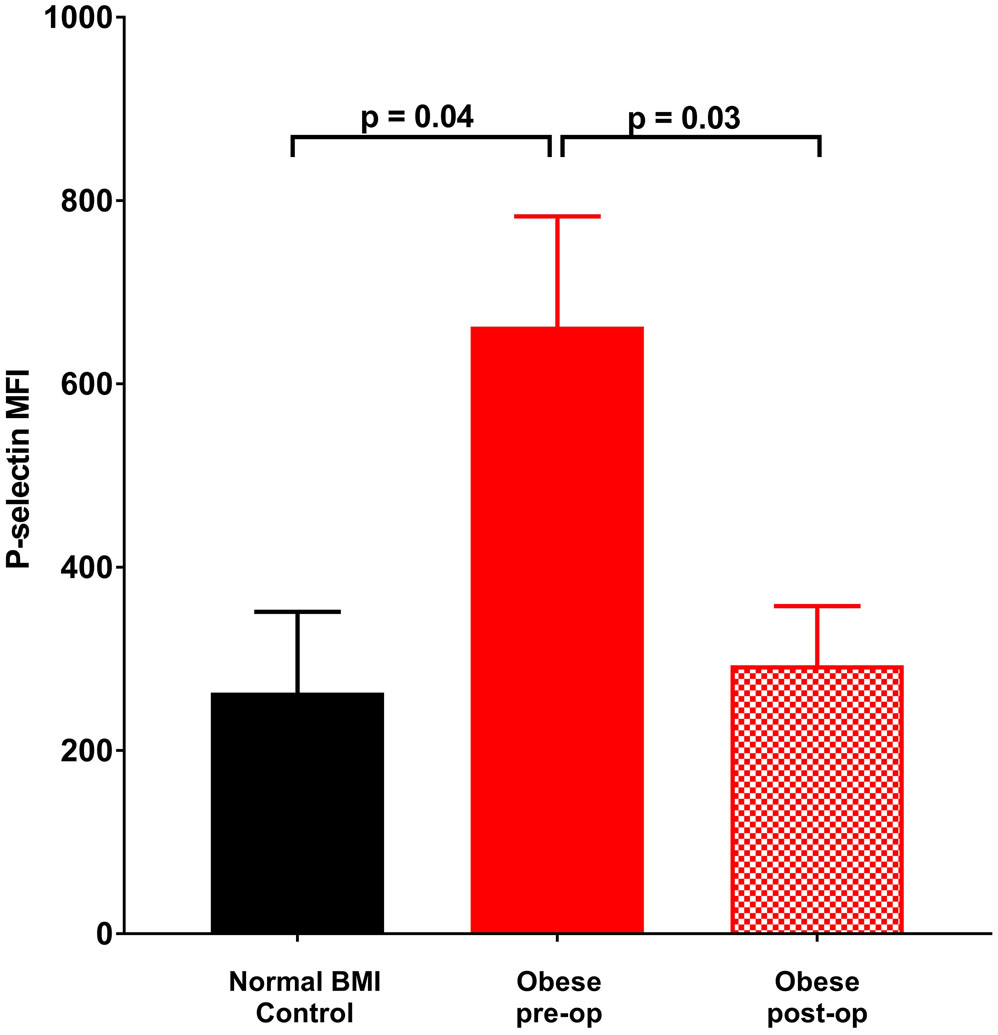
Platelet count, size and age did not differ between obese and normal BMI subjects (Table 1). Further, these measures did not change at six months following sleeve gastrectomy. In contrast, platelet surface CD40 expression was significantly elevated in obese subjects relative to normal BMI women. Additionally, there was a trend towards elevated P-selectin expression on unstimulated platelets from obese subjects which became statistically significant with thrombin exposure (Figures 1a - 1c). Post-operatively, P-selectin expression to thrombin was reduced and similar to normal BMI subjects.
Figure 1.
Mean fluorescence intensity (MFI) (corrected for CD42 MFI) indicative of surface staining of (a) CD40 in the absence of agonist, (b) P-selectin in the absence of agonist, (c) P-selectin on exposure to 0.025 U thrombin. Data represented as mean ± SEM.
Platelet RNA profile
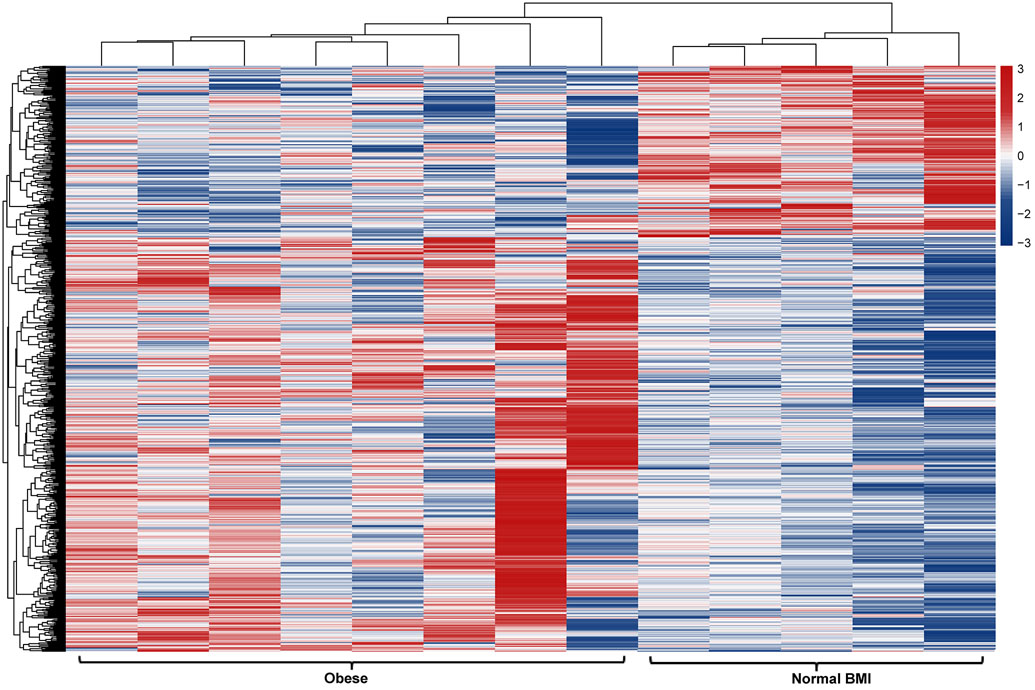
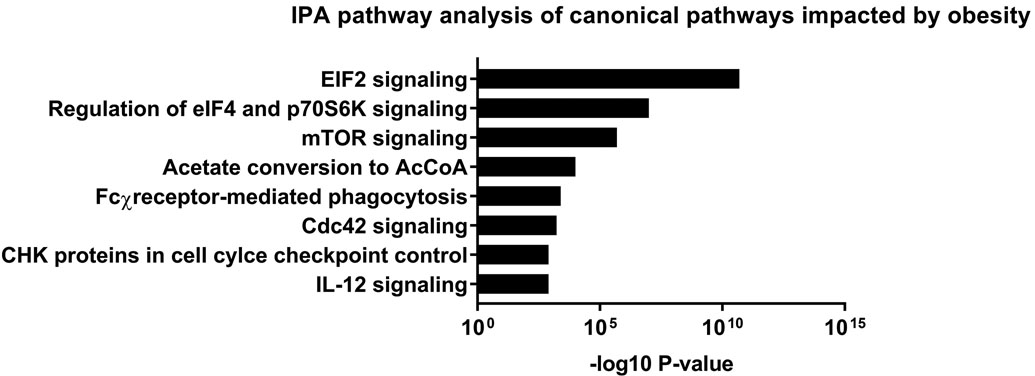
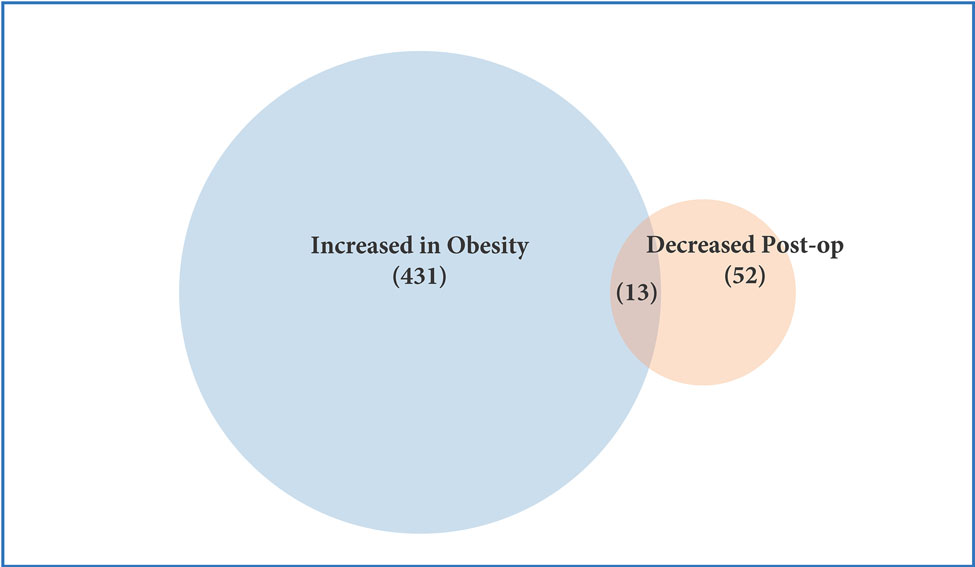
RNAseq in a cohort of 13 – 8 obese and 5 normal BMI subjects – identified 629 differentially expressed transcripts in the platelet RNA profile of obese versus normal BMI women (Figure 2a). Approximately 70% of these transcripts (443/629) exhibited greater expression in obesity, including 89 with more than 2-fold higher expression. 34 genes were expressed at <50% the level of normal BMI subjects. The top differentially expressed transcripts in obesity are presented in Table 2a. Obesity was associated with increased expression of genes involved in a number of pathways related to translation and metabolic regulation (Figure 2b). Upstream factors predicted to be involved in differential platelet RNA expression in obesity were transglutaminase 2, IFNγ, and CEBPα.
Figure 2.
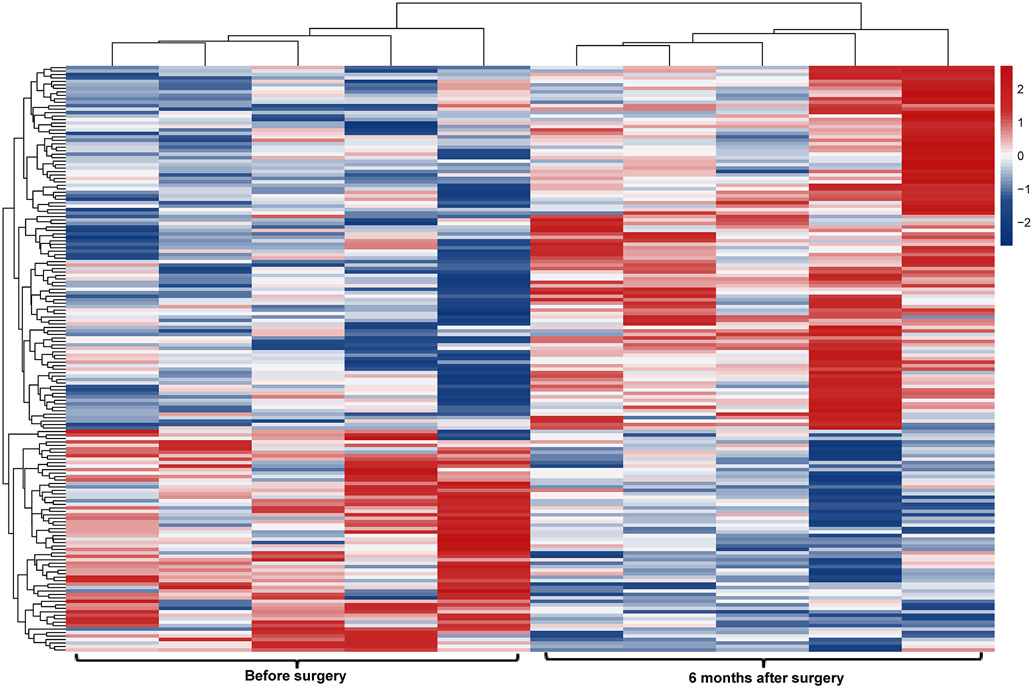
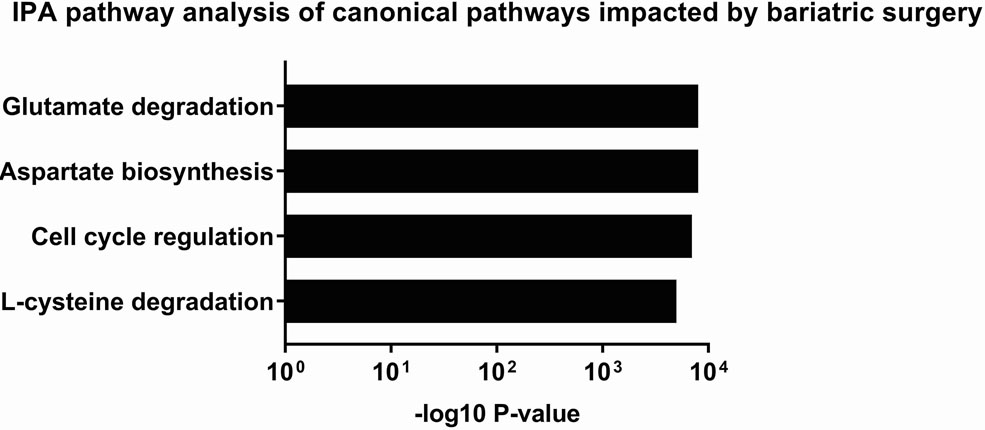
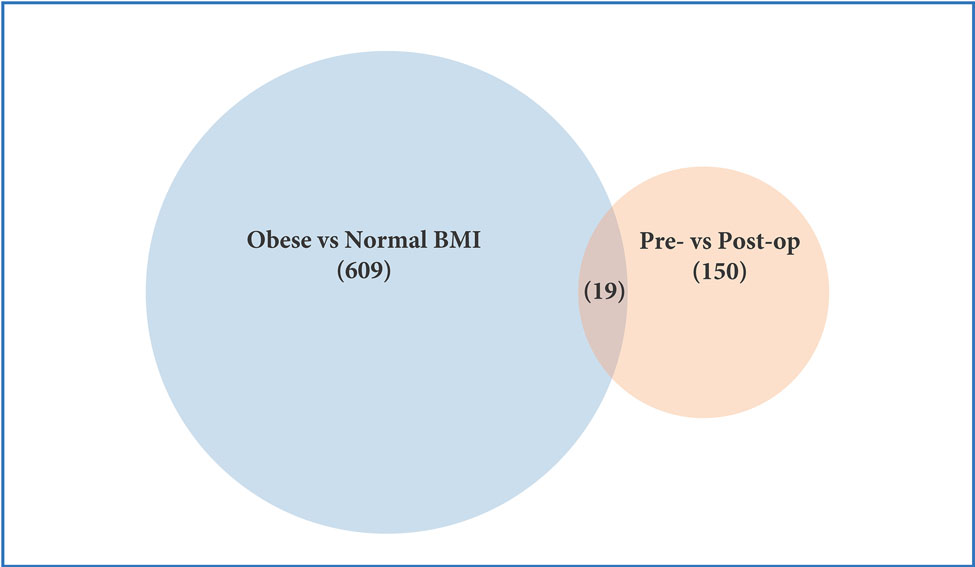
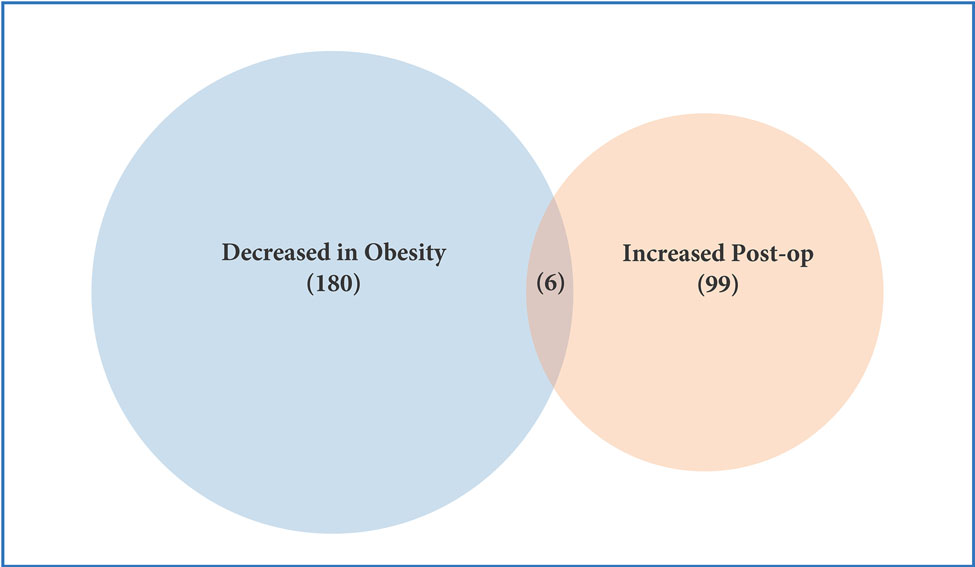
Profiling of platelet mRNA expression in obese women. (a) Heatmap of platelet transcripts differentially expressed between obese women (n=8) and normal BMI women (n=5) with p-value <0.05 and base mean counts >5. (b) Top pathways of platelet transcripts differentially expressed in obese versus normal BMI women. (c) Heatmap of platelet transcripts differentially expressed between obese women (n=5) before and at six months following sleeve gastrectomy with p-value <0.05 and base mean counts >5. (d) Top pathways of platelet transcripts differentially expressed in obese women at six months after sleeve gastrectomy. (e) Venn diagrams representing platelet transcripts differentially expressed in obesity and bariatric surgery.
Table 2.
Top differentially expressed genes (a) in obesity and (b) 6 months following sleeve gastrectomy.
| Gene | Base mean expression | Fold different (obese vs normal BMI) | p-value |
|---|---|---|---|
| LRRC8B | 1774.33 | 0.60 | <0.00001 |
| RP11–757G1.6 | 36.64 | 2.17 | 0.00002 |
| PDE11A | 5.49 | 0.30 | 0.00002 |
| QPCT | 8.99 | 3.26 | 0.00003 |
| TRHDE | 125.68 | 2.58 | 0.00003 |
| PCTP | 646.76 | 0.40 | 0.00003 |
| S100A9 | 670.25 | 2.61 | 0.00007 |
| ANKRD36BP2 | 182.96 | 2.01 | 0.00008 |
| ARL8B | 1022.41 | 0.58 | 0.00012 |
| AC093627.8 | 47.42 | 0.38 | 0.00013 |
| CLEC2D | 23.42 | 2.67 | 0.00014 |
| BLVRB | 33.01 | 2.32 | 0.00017 |
| TTF2 | 30.49 | 0.38 | 0.00032 |
| RP11–885N19.6 | 96.91 | 0.40 | 0.00038 |
| LCN2 | 2081.30 | 0.47 | 0.00038 |
| GABRR2 | 7.67 | 2.69 | 0.00039 |
| TES | 18.13 | 2.68 | 0.00043 |
| AR | 245.37 | 2.11 | 0.00045 |
| WRB | 1591.17 | 2.11 | 0.00059 |
| FCGR3A | 40.20 | 2.54 | 0.00064 |
| NAPG | 655.18 | 0.49 | 0.00085 |
| AGER | 7.09 | 2.55 | 0.00092 |
| PPP1R3E | 33.15 | 1.88 | 0.00114 |
| MARCKS | 28.13 | 2.42 | 0.00123 |
| CHRM3 | 34.49 | 2.29 | 0.00131 |
| Gene | Base mean expression | Fold different (pre vs post-op) | p-value |
|---|---|---|---|
| AL161626.1 | 3865.30 | 2.16 | 0.00005 |
| LTF | 5.00 | 1.80 | 0.00078 |
| CBLB | 19.20 | 0.53 | 0.00093 |
| CDH26 | 14.20 | 1.82 | 0.00179 |
| C14orf159 | 14.10 | 0.56 | 0.00215 |
| PLEKHM1P1 | 12.80 | 0.58 | 0.00272 |
| DXO | 18.80 | 0.58 | 0.00373 |
| MTRNR2L12 | 82.40 | 0.57 | 0.00376 |
| AC015987.2 | 5.40 | 1.63 | 0.00469 |
| IER3IP1 | 7.90 | 1.64 | 0.00492 |
| SMIM6 | 13.50 | 0.59 | 0.00495 |
| PTPN9 | 8.40 | 0.60 | 0.00556 |
| RP11–672A2.3 | 15.60 | 0.59 | 0.00607 |
| EIF3J-AS1 | 6.30 | 0.61 | 0.00657 |
| YEATS4 | 20.00 | 1.68 | 0.00669 |
| PSMD8 | 44.50 | 0.63 | 0.00686 |
| RPIA | 28.60 | 0.61 | 0.00728 |
| CCDC69 | 45.20 | 0.60 | 0.00731 |
| ATP6V1B2 | 296.50 | 0.61 | 0.00778 |
| TRIB1 | 7.90 | 0.63 | 0.00814 |
| L3MBTL4-AS1 | 28.80 | 0.61 | 0.00831 |
| GNG2 | 36.00 | 0.61 | 0.00880 |
| RP11–525A16.4 | 34.20 | 0.61 | 0.00952 |
| BTG1 | 96.60 | 0.62 | 0.00954 |
| GLOD5 | 20.7 | 0.64 | 0.00960 |
Among 5 women who had platelet RNA profiling performed before and 6 months after bariatrc surgery, 170 transcripts were differentially expressed (Figure 2c). Of note, 62% of these transcripts (105/170) were more highly expressed following surgery. The top differentially expressed transcripts following bariatric surgery are presented in Table 2b. 19 of the 629 transcripts differentially expressed in obesity were also found to be affected at 6 months after surgery (Figure 2e, Table 2c). Accordingly, pathway analyses modestly suggested that metabolic pathways different from those identified above (Figure 2b) were altered with surgical weight loss (Figure 2d). Upstream factors predicted to be involved in changes in expression at six months following bariatric surgery were E2F, TCF4, mir-30 and EGR1.
Table 2c.
Genes differentially expressed in obesity and affected by bariatric surgery
| Gene | Fold different in obesity | Rank in obesity | Fold different after surgery | Rank in surgery |
|---|---|---|---|---|
| RP11–757G1.6 | 2.17 | 2 | 0.67 | 39 |
| AC079949.1 | 2.15 | 37 | 0.65 | 40 |
| PTPN23 | 2.33 | 38 | 0.43 | 164 |
| CDK5RAP3 | 2.33 | 42 | 1.51 | 77 |
| GFOD2 | 2.21 | 65 | 0.71 | 152 |
| CDCA7L | 2.21 | 73 | 0.61 | 29 |
| CPNE4 | 0.50 | 100 | 1.60 | 37 |
| ZNF711 | 0.52 | 127 | 1.53 | 64 |
| MRPS30 | 2.07 | 129 | 0.68 | 128 |
| MGAT3 | 0.49 | 148 | 1.51 | 89 |
| NOP9 | 2.00 | 192 | 0.65 | 43 |
| FAM26F | 0.53 | 248 | 1.55 | 50 |
| LTF | 1.83 | 308 | 0.56 | 2 |
| HIST1H3D | 0.63 | 386 | 1.35 | 84 |
| AL161626.1 | 1.69 | 418 | 0.46 | 1 |
| SHQ1 | 1.60 | 419 | 0.69 | 104 |
| PIGC | 1.78 | 435 | 0.67 | 110 |
| FAM212B | 0.63 | 501 | 1.41 | 98 |
| MDC1 | 1.76 | 544 | 0.65 | 59 |
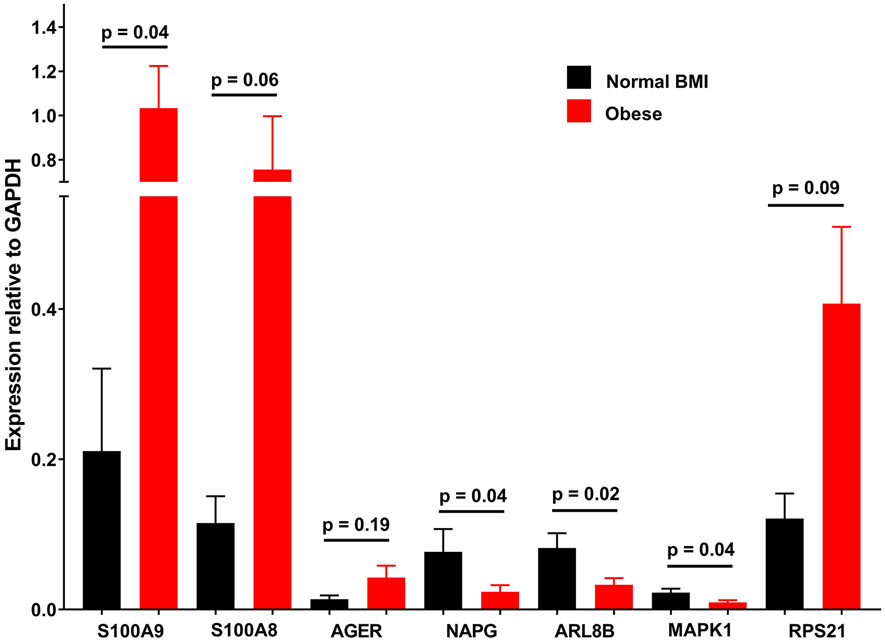
Real time quantitative PCR of several highly differentially expressed transcripts, as well as others in implicated pathways largely validated the RNAseq findings (Figure 3).
Figure 3.
Gene expression (relative to GAPDH) in platelet mRNA samples from obese and normal BMI control subjects measured with quantitative PCR. Data represented as mean ± SEM.
Discussion
We report the first unbiased assessment of the platelet RNA profile in severe obesity as well as the effects of >25% body weight loss following bariatric surgery on this profile. While we observed that common variables, including platelet count, age (reticulated platelets) and MPV did not differ, we found >600 transcripts to be differentially expressed between platelets of obese and matched, normal-BMI women. Additionally, several direct markers of platelet activation, surface CD40 and P-selectin, were greater in obese subjects.
As prior assessments of platelet RNA in obesity were limited to several dozen targeted genes (8,20), most transcripts and implicated pathways that we report are novel. Given increasing recognition of the importance of platelet RNA profile in mediating atherosclerotic cardiovascular disease (ASCVD) (5–7,9,10), we are excited by the wealth of insight potentially provided by our data. Notably, we identified S100A9 as one of the most upregulated transcripts in obese versus normal-BMI subjects. This observation has precedence and profound relevance. Freedman et al. found S100A9 to be one of the most highly upregulated transcripts in platelets in obese subjects in an analysis limited to inflammatory transcripts in the Framingham Offspring Study (8). Further, platelet S100A9 mRNA is elevated in STEMI versus stable coronary artery disease, predictive of adverse ASCVD events, and implicated mechanistically in these adverse outcomes (9,10,21). Our study supports that increased expression of S100A9 in platelets is a novel CVD risk factor associated with obesity.
S100A9 expression and BMI exhibited a strong correlation (r=0.64, p=0.02) in our subjects who were without significant obesity-related metabolic comorbidities. While this suggests that adiposity is the most important single factor driving overexpression of the transcript, S100A9 was not one of the few transcripts affected at 6 months after bariatric surgery. In fact, expression of only 3.2% of obesity-altered transcripts was affected at six months following bariatric surgery. The plasticity of the platelet mRNA profile in obesity is indeed unclear. Recent work suggests that obesity-induced changes in hematopoetic stem cells persist even after normalization of body weight (22). Whether changes in megakaryocytes within the bone marrow (the source of platelet RNA) occurring with obesity are also durable remains unknown.
Beyond the known risk factor S100A9, our data support widespread alteration of the platelet RNA profile in obesity. Notable themes from our analyses include upregulation of several pathways, including: eIF2 and mTOR signaling, and translation broadly. Further, AGER was one of the most upregulated transcripts in severe obesity despite the absence of diabetes in our subjects. Although qPCR demonstrated detectable AGER transcript in >90% of platelet mRNA in this study, the protein product of AGER has yet to be identified in platelets, so the relevance of this observation remains uncertain.
Several additional transcripts influenced by obesity immediately strike us as potentially quite important: ALOX5, CLEC2(B,D,L), CXCL3, MMP9, MYD88, SELP, S100A4, S100A6, TLR1 and WAS. Given platelets’ ability to affect atherothrombosis via transfer of their cargo via microparticles to leukocytes or endothelial cells (6,7), an altered platelet RNA profile, as we demonstrate in obesity, may represent an additional measure of cardiometabolic risk that is separate and independent from more traditional measures of platelet activation and thrombotic potential. Of particular relevance in this regard, weight loss has previously been shown to reduce circulating platelet-derived microparticles in obesity (23).
Platelet expression of P-selectin and CD40 occurs with activation and both proteins mediate interactions of platelets with endothelial and immune cells (24,25). Platelet surface P-selectin and CD40 are felt to promote atherosclerosis through these cellular interactions (26). We specifically observed that P-selectin expression to thrombin was elevated in obese subjects, but that expression was normalized by 6 months after bariatric surgery. Our finding of elevated platelet surface P-selectin expression in severely obese subjects has precedence, and higher P-selectin is hypothesized to partly contribute to excess ASCVD in obesity (27). Elevated platelet P-selectin has been observed in obese adults both with the metabolic syndrome (28,29) and without other cardiovascular risk factors (27). Further, BMI has been independently associated with increased P-selectin expression to agonists among diabetics (30). Given that at 6 months after surgery, most of our subjects (11/19) remained obese (BMI 32.1 ± 6.0 kg/m2), the observed normalization of P-selectin expression to thrombin at this time point suggests that obesity per se may not be a primary factor contributing to increased expression of P-selectin in our subjects pre-operatively, but a currently undetermined factor present in our metabolically healthy subjects that nonetheless improves following bariatric surgery.
While soluble CD40 ligand has been previously noted in obesity, and found to be modifiable with weight loss (31,32), to our knowledge, ours is the first study to directly measure platelet surface CD40 expression in obesity and with weight loss. In contrast to our findings with surface P-selectin, and prior reports of soluble CD40 ligand, platelet surface CD40 remained significantly greater in obese subjects following 6 months of surgical weight loss.
Our study has several limitations. Our cohort consisted of relatively young, metabolically healthy women, not taking antihyperglycemic, lipid-lowering, or platelet-affecting medications. This was purposefully done to reduce confounding from medications (and/or changes in medications following surgery) and the known differences in platelet gene expression with age and gender. Thus, it is not known if our findings can be extrapolated to men and older individuals, or how common medications may influence platelet mRNA profile in obesity. The absence of a comparator weight loss group(s) does not allow for assessment of any weight loss- versus surgical procedure-specific effects. Finally, findings from our 6 month post-sleeve gastrectomy time point may not reflect changes that occur with additional weight loss, non-surgical weight loss, or alternative surgical weight loss techniques.
Nonetheless, this is the first report of an unbiased analysis of the platelet transcriptome in obesity and after bariatric surgery. Our work supports prior reports that S100A9 is increased in obesity, and adds data that suggest modification of this risk factor may be difficult. We also contribute a novel list of differentially expressed transcripts which may lend mechanistic insight to the increased risk of ASCVD in obesity. Finally, in addition to improving established risk factors, we report that bariatric surgery reduces platelet activation and alters the platelet transcriptome. These observations suggest that platelets may contribute to increased cardiovascular risk in obesity through a variety of mechanisms. The relevance of the platelet mRNA changes and whether they are secondary to weight/adipose loss, myriad metabolic effects following bariatric surgery, or a combination, and the durability of these changes remain to be elucidated.
Acknowledgments
This study was funded by an NYU CTSI Pilot Project Grant to Dr. Heffron (UL1TR001445) and RO1HL114978 to Dr. Berger. Dr. Heffron was supported by KL2TR001446 and K23HL135398. The NYU Genome Technology Core is partially supported by P30CA016087.
Footnotes
Declaration of Interests
All authors declare no conflicts of interest.
References
- 1.World Health Organization. Global status report on noncommunicable diseases 2010. 2011. :1–176. [Google Scholar]
- 2.World Health Organization Obesity Fact sheet No 311. 2014.
- 3.Samad F, Ruf W. Inflammation, obesity, and thrombosis. Blood. 2013;122:3415–22. [DOI] [PMC free article] [PubMed] [Google Scholar]
- 4.Anfossi G, Russo I, Trovati M. Platelet dysfunction in central obesity. Nutr Metab Cardiovasc Dis. 2009;19:440–449. [DOI] [PubMed] [Google Scholar]
- 5.Morrell CN, Aggrey AA, Chapman LM, Modjeski KL. Emerging roles for platelets as immune and inflammatory cells. Blood. 2014;123:2759–2767. [DOI] [PMC free article] [PubMed] [Google Scholar]
- 6.Laffont B, Corduan A, Rousseau M, Duchez AC, Lee CH, Boilard E, Provost P. Platelet microparticles reprogram macrophage gene expression and function. Thromb Haemost. 2016;115:311–323. [DOI] [PubMed] [Google Scholar]
- 7.Gidlof O, van der Brug M, Ohman J, Gilje P, Olde B, Wahlestedt C, Erlinge D. Platelets activated during myocardial infarction release functional miRNA, which can be taken up by endothelial cells and regulate ICAM1 expression. Blood. 2013;121:3908–3917, s1–26. [DOI] [PubMed] [Google Scholar]
- 8.Freedman JE, Larson MG, Tanriverdi K, O’Donnell CJ, Morin K, Hakanson AS, Vasan RS, Johnson AD, Iafrati MD, Benjamin EJ. Relation of platelet and leukocyte inflammatory transcripts to body mass index in the Framingham heart study. Circulation. 2010;122:119–129. [DOI] [PMC free article] [PubMed] [Google Scholar]
- 9.Healy AM, Pickard MD, Pradhan AD, Wang Y, Chen Z, Croce K, Sakuma M, Shi C, Zago AC, Garasic J, Damokosh AI, Dowie TL, Poisson L, Lillie J, Libby P, Ridker PM, Simon DI. Platelet expression profiling and clinical validation of myeloid-related protein-14 as a novel determinant of cardiovascular events. Circulation. 2006;113:2278–2284. [DOI] [PubMed] [Google Scholar]
- 10.Dann RHT, Montenont E, Boytard L, Alebrahim D, Feinstein J, Allen N, Simon R, Barone K, Uryu K, Guo Y, Rockman C, Ramkhelawon B, Berger JS. Platelet-derived MRP-14 induces monocyte activation in patients with symptomatic peripheral artery disease. J Am Coll Cardiol. 2018;71:53–65. [DOI] [PMC free article] [PubMed] [Google Scholar]
- 11.Kissopoulou A, Jonasson J, Lindahl TL, Osman A. Next generation sequencing analysis of human platelet PolyA+ mRNAs and rRNA-depleted total RNA. PloS One. 2013;8:e81809. [DOI] [PMC free article] [PubMed] [Google Scholar]
- 12.Rowley JW, Oler AJ, Tolley ND, Hunter BN, Low EN, Nix DA, Yost CC, Zimmerman GA, Weyrich AS. Genome-wide RNA-seq analysis of human and mouse platelet transcriptomes. Blood. 2011;118:e101–111. [DOI] [PMC free article] [PubMed] [Google Scholar]
- 13.Londin ER, Hatzimichael E, Loher P, Edelstein L, Shaw C, Delgrosso K, Fortina P, Bray PF, McKenzie SE, Rigoutsos I. The human platelet: strong transcriptome correlations among individuals associate weakly with the platelet proteome. Biol Direct. 2014;9:3. [DOI] [PMC free article] [PubMed] [Google Scholar]
- 14.Edelstein LC, Simon LM, Montoya RT, Holinstat M, Chen ES, Bergeron A, Kong X, Nagalla S, Mohandas N, Cohen DE, Dong JF, Shaw C, Bray PF. Racial differences in human platelet PAR4 reactivity reflect expression of PCTP and miR-376c. Nat Med. 2013;19:1609–1616. [DOI] [PMC free article] [PubMed] [Google Scholar]
- 15.Schubert S, Weyrich AS, Rowley JW. A tour through the transcriptional landscape of platelets. Blood. 2014;124:493–502. [DOI] [PMC free article] [PubMed] [Google Scholar]
- 16.Eicher JD, Wakabayashi Y, Vitseva O, Esa N, Yang Y, Zhu J, Freedman JE, McManus DD, Johnson AD. Characterization of the platelet transcriptome by RNA sequencing in patients with acute myocardial infarction. Platelets. 2016;27:230–239. [DOI] [PMC free article] [PubMed] [Google Scholar]
- 17.Montenont E, Echagarruga C, Allen N, Araldi E, Suarez Y, Berger JS. Platelet WDR1 suppresses platelet activity and is associated with cardiovascular disease. Blood. 2016;128:2033–2042. [DOI] [PMC free article] [PubMed] [Google Scholar]
- 18.Parikh M, Chung M, Sheth S, McMacken M, Zahra T, Saunders JK, Ude-Welcome A, Dunn V, Ogedegbe G, Schmidt AM, Pachter HL. Randomized pilot trial of bariatric surgery versus intensive medical weight management on diabetes remission in type 2 diabetic patients who do NOT meet NIH criteria for surgery and the role of soluble RAGE as a novel biomarker of success. Ann Surg. 2014;260:617–622. [DOI] [PMC free article] [PubMed] [Google Scholar]
- 19.Simon LM, Edelstein LC, Nagalla S, Woodley AB, Chen ES, Kong X, Ma L, Fortina P, Kunapuli S, Holinstat M, McKenzie SE, Dong JF, Shaw CA, Bray PF. Human platelet microRNA-mRNA networks associated with age and gender revealed by integrated plateletomics. Blood. 2014;123:e37–45. [DOI] [PMC free article] [PubMed] [Google Scholar]
- 20.McManus DD, Beaulieu LM, Mick E, Tanriverdi K, Larson MG, Keaney JF, Jr., Benjamin EJ, Freedman JE. Relationship among circulating inflammatory proteins, platelet gene expression, and cardiovascular risk. Arterioscler Thromb Vasc Biol. 2013;33:2666–2673. [DOI] [PMC free article] [PubMed] [Google Scholar]
- 21.Wang Y, Fang C, Gao H, Bilodeau ML, Zhang Z, Croce K, Liu S, Morooka T, Sakuma M, Nakajima K, Yoneda S, Shi C, Zidar D, Andre P, Stephens G, Silverstein RL, Hogg N, Schmaier AH, Simon DI. Platelet-derived S100 family member myeloid-related protein-14 regulates thrombosis. J Clin Invest. 2014;124:2160–2171. [DOI] [PMC free article] [PubMed] [Google Scholar]
- 22.Lee JM, Govindarajah V, Goddard B, Hinge A, Muench DE, Filippi MD, Aronow B, Cancelas JA, Salomonis N, Grimes HL, Reynaud D. Obesity alters the long-term fitness of the hematopoietic stem cell compartment through modulation of Gfi1 expression. J Exp Med. 2018;215:627–644. [DOI] [PMC free article] [PubMed] [Google Scholar]
- 23.Murakami T, Horigome H, Tanaka K, Nakata Y, Ohkawara K, Katayama Y, Matsui A. Impact of weight reduction on production of platelet-derived microparticles and fibrinolytic parameters in obesity. Thromb Res. 2007;119:45–53. [DOI] [PubMed] [Google Scholar]
- 24.Koupenova M, Clancy L, Corkrey HA, Freedman JE. Circulating Platelets as Mediators of Immunity, Inflammation, and Thrombosis. Circ Res. 2018;122:337–351. [DOI] [PMC free article] [PubMed] [Google Scholar]
- 25.Davi G, Patrono C. Platelet activation and atherothrombosis. New Engl J Med. 2007;357:2482–2494. [DOI] [PubMed] [Google Scholar]
- 26.Gerdes N, Seijkens T, Lievens D, Kuijpers MJ, Winkels H, Projahn D, Hartwig H, Beckers L, Megens RT, Boon L, Noelle RJ, Soehnlein O, Heemskerk JW, Weber C, Lutgens E. Platelet CD40 Exacerbates Atherosclerosis by Transcellular Activation of Endothelial Cells and Leukocytes. Arterioscler Thromb Vasc Biol. 2016;36:482–490. [DOI] [PubMed] [Google Scholar]
- 27.Csongradi E, Nagy B Jr, Fulop T, Varga Z, Karanyi Z, Magyar MT, Olah L, Papp M, Facsko A, Kappelmayer J, Paragh G, Kaplar M. Increased levels of platelet activation markers are positively associated with carotid wall thickness and other atherosclerotic risk factors in obese patients. Thromb Haemost. 2011;106:683–692. [DOI] [PubMed] [Google Scholar]
- 28.Vaduganathan M, Alviar CL, Arikan ME, Tellez A, Guthikonda S, DeLao T, Granada JF, Kleiman NS, Ballantyne CM, Lev EI. Platelet reactivity and response to aspirin in subjects with the metabolic syndrome. Am Heart J. 2008;156:1002.e1–1002.e7. [DOI] [PubMed] [Google Scholar]
- 29.Arteaga RB, Chirinos JA, Soriano AO, Jy W, Horstman L, Jimenez JJ, Mendez A, Ferreira A, de Marchena E, Ahn YS. Endothelial microparticles and platelet and leukocyte activation in patients with the metabolic syndrome. Am J Cardiol. 2006;98:70–74. [DOI] [PubMed] [Google Scholar]
- 30.Schneider DJ, Hardison RM, Lopes N, Sobel BE, Brooks MM. Association between increased platelet P-selectin expression and obesity in patients with type 2 diabetes: a BARI 2D (Bypass Angioplasty Revascularization Investigation 2 Diabetes) substudy. Diabetes Care. 2009;32:944–949. [DOI] [PMC free article] [PubMed] [Google Scholar]
- 31.Desideri G, Ferri C. Effects of obesity and weight loss on soluble CD40L levels. JAMA. 2003;289:1781–1782. [DOI] [PubMed] [Google Scholar]
- 32.Baena-Fustegueras JA, Pardina E, Balada E, Ferrer R, Catalan R, Rivero J, Casals I, Lecube A, Fort JM, Vargas V, Peinado-Onsurbe J. Soluble CD40 ligand in morbidly obese patients: effect of body mass index on recovery to normal levels after gastric bypass surgery. JAMA Surg. 2013;148:151–156. [DOI] [PubMed] [Google Scholar]


