

SUMMARY
Genomics has provided a detailed structural description of the cancer genome. Identifying oncogenic drivers that work primarily through dosage changes is a current challenge. Unrestrained proliferation is a critical hallmark of cancer. We constructed modular, barcoded libraries of human open reading frames (ORFs) and performed screens for proliferation regulators in multiple cell types. Approximately 10% of genes regulate proliferation, with most performing in an unexpectedly highly tissue-specific manner. Proliferation drivers in a given cell type showed specific enrichment in somatic copy number changes (SCNAs) from cognate tumors and helped predict aneuploidy patterns in those tumors, implying that tissue-type-specific genetic network architectures underlie SCNA and driver selection in different cancers. In vivo screening confirmed these results. We report a substantial contribution to the catalog of SCNA-associated cancer drivers, identifying 147 amplified and 107 deleted genes as potential drivers, and derive insights about the genetic network architecture of aneuploidy in tumors.
Graphical Abstract

In Brief
The highly tissue-specific epigenetic landscape of a given cell type establishes its responsiveness to oncogenic proliferation signals and determines which drivers, somatic copy number changes, and anueploidies are selected during tumorigenesis.
INTRODUCTION
Understanding the genetic changes that underlie human cancer is an overarching goal of biomedical research. Sequencing technologies have facilitated the identification of genetic alterations in cancer (McLendon et al., 2008). Analyses of point mutations can identify tumor suppressor genes (TSGs) and oncogenes (OGs) (Davoli et al., 2013; Lawrence et al., 2014; Vogelstein et al., 2013) and their distribution on chromosomes can predict the frequency of cancer somatic copy number alterations (SCNAs), indicating these are driver events (Davoli et al., 2013). However, many oncogenes can be more easily activated through dosage changes than point mutation. A full understanding of cancer drivers will require the systematic identification of all classes of TSGs/OGs. This is a critical undertaking, because SCNAs as a class are observed at higher frequency than mutated drivers.
In addition to the identity of genes driving SCNAs, another key question in cancer evolution is the basis of the tissue-specific differences in the spectrum and frequency of driver mutations and SCNAs (Beroukhim et al., 2010; Zack et al., 2013). Do varying SCNA patterns among tissues arise from differences in the frequency with which they happen (e.g., due to chromatin structure differences), or do they derive from tissue-specific functional selection of the targeted genes?
With the aim of discovering OGs acting through altered expression levels, we developed a modular ORF expression system for gain-of-function (GOF) screens to identify proliferation regulators; we defined genes that significantly enhanced proliferation as GO genes (growth-promoting genes and oncogenes) and genes that suppressed proliferation as STOP genes (suppressors of tumorigenesis or proliferation) (Solimini et al., 2012). Here, we report the systematic identification of proliferation drivers in mammary, fibroblast, and pancreatic cells, uncovering a deeply complex and tissue-specific network of regulation for cell proliferation. These tissue-specific proliferation drivers and related pathways correspond to breast carcinoma (BRCA)-specific or pancreatic adenocarcinoma (PAAD)-specific gene expression in cancer. The genes identified from each cell type are also over-represented in recurrent SCNAs, in a tissue-specific fashion, and help to explain tissue-specific patterns of aneuploidy. Finally, in vivo proliferation screens confirmed the roles of GO and STOP genes in proliferation control in tumors, underscoring the relevance of these candidate cancer drivers.
RESULTS
Modular Barcoded Libraries for Inducible ORF Expression
We designed a Gateway-compatible lentiviral system to enable inducible expression, flexible tagging, and quantitative detection of libraries of barcoded (BC) human ORFs (Figure 1A). We paired ORFs with ~5 BCs per ORF (see STAR Methods) Figures 1A and 1E) and employed strategically located meganuclease sites to allow easy replacement of functional cassettes. We used ORFs from several commercially available collections to generate two libraries (Library 1 and 2), which, in total, contain nearly 30,000 ORFs, corresponding to more than 16,000 unique full-length genes (Table S1). This modular resource allows great flexibility, which will enable these libraries to be used for myriad purposes in the future.
Figure 1. Modular Barcoded Human ORF Libraries and Inducible Expression System.
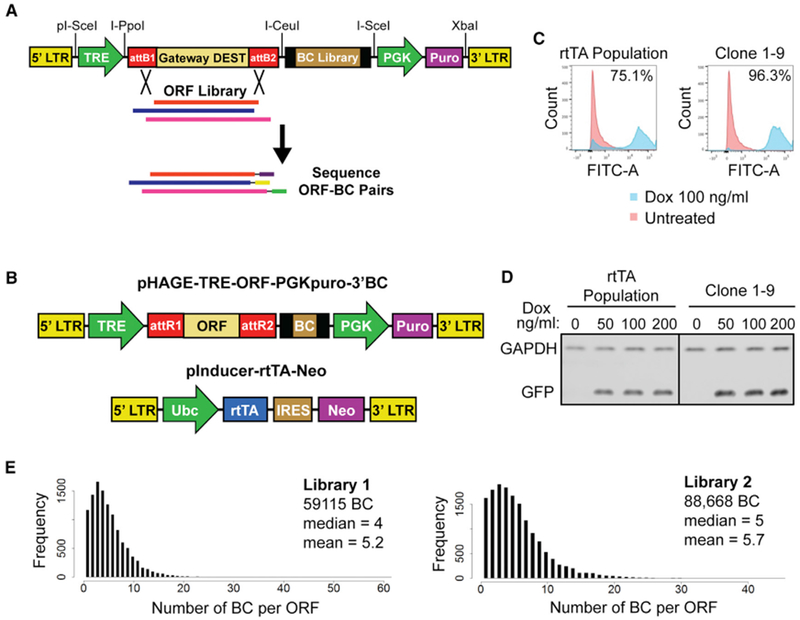
(A) Construction of ORF library expression vector. Libraries of random oligos (BC Library) flanked by primer landing sites were cloned into the vector using rare unique restriction sites I-CeuI and I-SceI. ORF collections were cloned into Gateway DEST site by LR recombination. The libraries were then sheared and resulting ORF-BC pairs were recovered by PCR and identified by paired-end sequencing. LTR, long terminal repeat; TRE, tetracycline responsive element; DEST, Gateway Destination cassette; attB1/2, Gateway recombination sites; PGK, phosphoglycerate kinase 1 promoter; Puro, puromycin resistance gene.
(B) Maps of two-component system for inducible expression of barcoded ORFs. ORFs are expressed from pHAGE-TRE-ORF-PGK puro-3′BC library vector under control of the reverse tetracycline transactivator (rtTA), which is expressed from pInducer-rtTA-Neo. Ubc, ubiquitin C promoter; IRES, internal ribosome entry site; Neo, neomycin resistance gene.
(C) Flow cytometry measurement of induction of GFP expressed from pHAGE-TRE-ORF-PGKPuro-3′BC in either a heterogeneously infected population of rtTA-Neo expressing HMECs or a clonal rtTA-HMEC line (Clone 1-9). Cells were induced with 100 ng/mL dox for 48 hr before analysis or left untreated.
(D) Western blot for GFP expression at indicated dox concentrations (in ng/mL) in parental rtTA-HMEC population and rtTA-HMEC Clone 1-9. GAPDH is used as a loading control.
(E) Distribution of the frequency of ORFs paired to a given number of unique BCs in each of the ORF libraries.
For uniform inducibility, we established hTERT-immortalized human mammary epithelial cell (HMEC) clones in which a TRE promoter drives ORF expression and the reverse tetracycline transactivator (rtTA) protein is provided in trans (Figure 1B). We then transduced our clones with EGFP expressed from our library vector and analyzed GFP levels in the presence or absence of doxycycline (dox). We selected a clone (1-9) exhibiting more uniform GFP induction as compared to the bulk population (Figures 1C and 1D). We also generated rtTA-expressing cells from the immortalized, non-transformed cell lines, human pancreatic nestin-expressing epithelial cells (HPNEs) and IMR90 fibroblasts (Figures S1A–S1C; see STAR Methods).
Proliferation Screens Reveal Striking Cell-Type Specificity among GO Genes
We performed screens with both ORF libraries in the rtTA-HMEC and rtTA-HPNE clonal cell lines. To probe the impact of cell line-age on proliferation regulation, we also performed a screen using Library 1 in the rtTA-IMR90 fibroblasts to compare with our screens in epithelial cells. Cells transduced with the lentiviral library were passaged for 10 population doublings in the presence of dox to identify ORFs whose overexpression impacts proliferation. Changes in ORF abundance were quantified by BC sequencing and analyzed with edgeR (Dai et al., 2014; Robinson et al., 2010) to determine the magnitude (log2FC, i.e., log of the fold change between the end and start of the screen) and significance (p value and false discovery rate [FDR]) of gene enrichment and dropout (see STAR Methods; Table S2).
To examine core cell-cycle regulators, we employed the “Reactome G1 Phase” gene set and found strong correlation in all three pairwise comparisons (Figure 2A). In contrast, the correlations between the entire screen datasets were only 0.3–0.4 (Pearson’s r value) (Figure S2A). There was an asymmetry in the correlations, with more similarity among genes that dropout than enrich and many genes exerting opposing phenotypes in different cell types (Figures S2A and S2B). Only 19 genes scored as GO genes (p < 0.01) in both the HMEC and HPNE Library 1 screens, a 7.5%−8.5% overlap, and only 3 genes enriched in all 3 screens (Figure 2C). There was much higher concordance among STOP genes: >50% of the depleted genes from HPNEs were also depleted in HMECs, with over 100 common STOP genes in all 3 lines. This suggests that pathways leading to cell arrest/death may be more conserved across cell types than those promoting proliferation/survival. Similar results were found in the screen performed with Library 2 in HMECs and HPNEs (Figures S2E and S2H).
Figure 2. Genome Scale Proliferation Screens in Three Human Cell Types Reveal Patterns of Tissue Specificity.
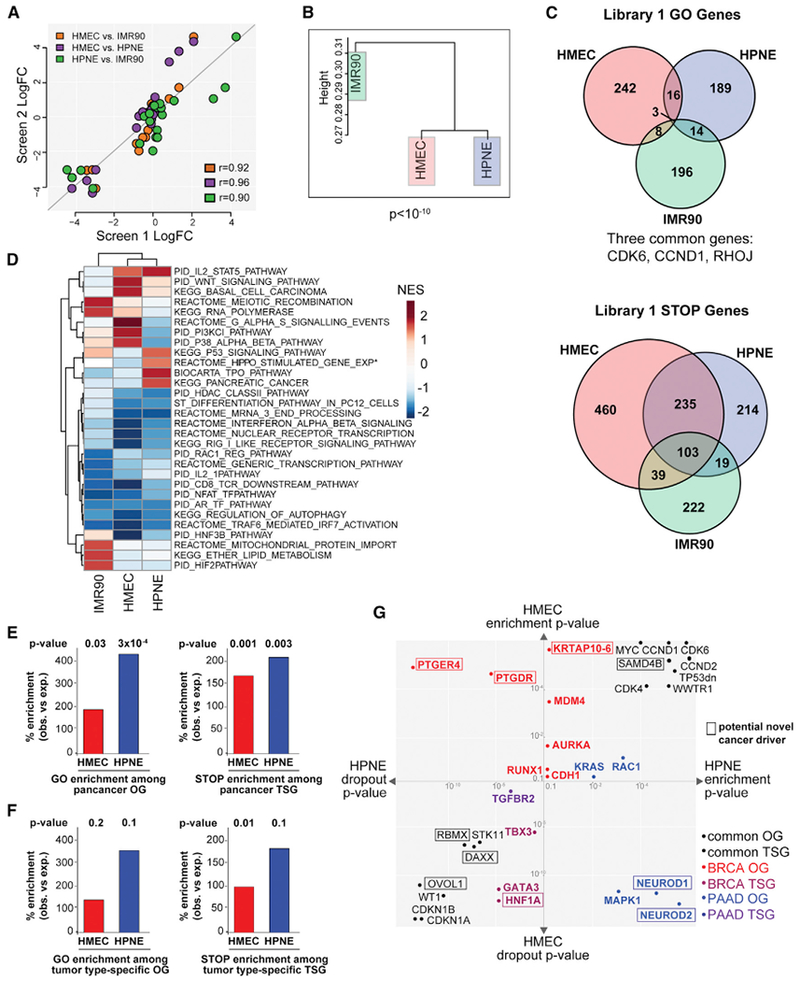
(A) Scatterplot of log2FC of genes from Reactome G1 pathway in each Library 1 screen. Each pairwise comparison is indicated by color. Pearson’s product-moment correlation coefficient is indicated (r).
(B) Hierarchical clustering of Library 1 screen data.
(C) Venn diagrams depicting GO and STOP genes with p < 0.01 from each Library 1 screen.
(D) Heatmap of GSEA normalized enrichment score (NES) for the 5 most enriched gene sets among the top enriched or depleted genes from each screen. Asterisk indicates a nominal p value > 0.05 but < 0.1.
(E and F) Bar plots depicting the percent enrichment (over expected) of GO (left) or STOP (right) genes from the HMEC or HPNE screens in a set of known OGs (left) or TSGs (right). OGs and TSGs are from pancancer analyses (E) or tumor-type-specific analyses (F). GO and STOP genes are defined as the genes with (combined) p value < 0.01. p values are from the one-tailed Fisher’s exact test.
(G) Scatterplot highlighting selected genes from the HMEC and HPNE screens. The axes represent the p value for enrichment (pE) or depletion (pD) in the HMEC (y axis) or HPNE (x axis) screen. Different scales are used for pE and pD because p values for dropout were generally smaller than those for enrichment and genes enriched with p value < e-4 or decreased with a p value < e-10 are not drawn to scale. Genes include OGs and TSGs common or specific for BRCA/PAAD (colored points indicate category) (Table S2H). Putative OGs or TSGs not previously well-characterized are marked by a box. Genes that had significant, opposite behaviors in both cell lines are plotted using their pE and pD as appropriate. “TP53 dn” refers to the dominant negative mutant TP53 ORF.
See also Figure S2.
To examine if our GOF GO genes were required for proliferation, we performed a genome-wide CRISPR proliferation screen in HMECs (Table S2E). We found significant overlap among the GO genes and among the STOP genes in the two screens (Figure S2F; Table S2F). The similarity in proliferation regulators found by these two orthogonal efforts suggests that the GO and STOP genes are bona fide growth-controlling genes.
The differences between HMECs and HPNEs imply complex cell- and tissue-specific networks that promote cell division. Hierarchical clustering indicated that these two epithelial cell types were more closely related to one another than to fibroblasts (Figure 2B), suggesting that major differences in tissue type and lineage may have an important impact on proliferation/survival circuitry. The GO gene differences between HMECs and HPNEs (Figure 2C) are not explained by different media conditions (see STAR Methods for MCF7 and Figure S2G).
To explore proliferation gene functions, we performed gene set enrichment analysis (GSEA) (Subramanian et al., 2005) (Figure 2D; Table S2G). Consistent with the greater similarity among STOP genes, the pathways enriched among these genes are largely the same across cell lines including interferon signaling, mRNA 3′ end processing, regulation of autophagy and generic transcription components. Consistent with the high tissue specificity of GO genes, few common pathways scored. For example, the PI3K pathway is enriched in HMEC but not HNPE GO genes, consistent with the frequent mutation of PI3K pathway genes in BRCA, but not PAAD. Genes associated with pancreatic cancer are likewise enriched among HPNE but not HMEC GO genes. A more complete analysis of GO pathway differences is detailed below and in Figure 3.
Figure 3. Cell-Type-Specific GO Genes Recapitulate Tissue-Specific Expression Signatures.
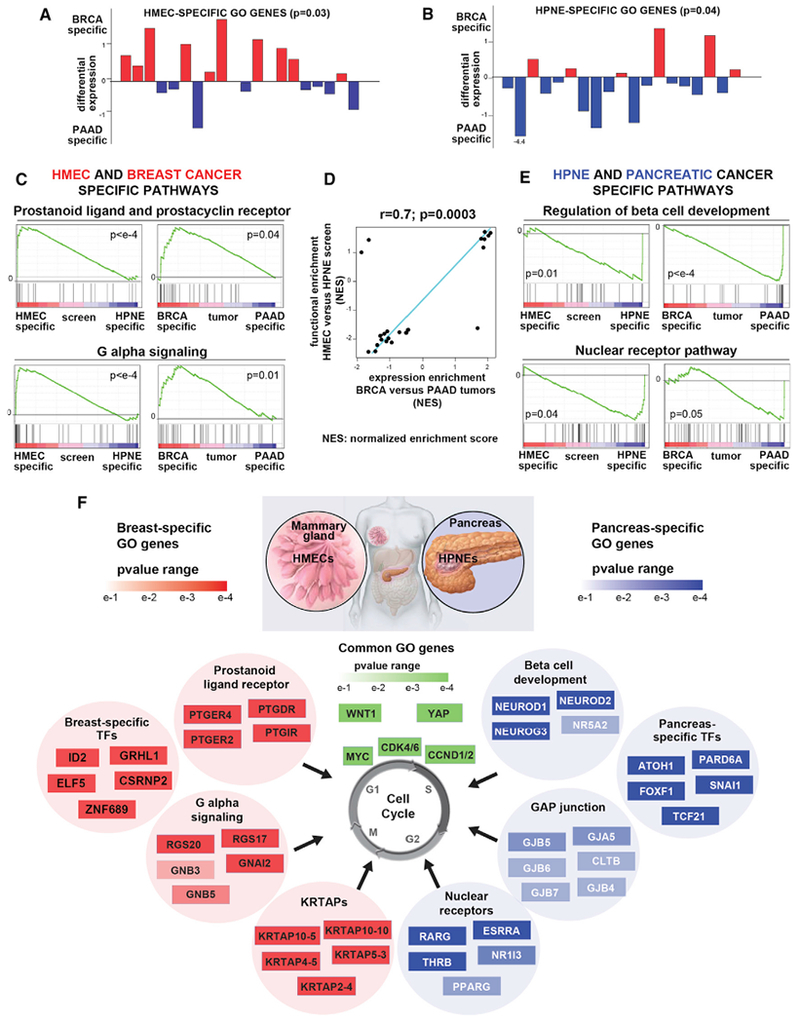
(A and B) Plot of differential expression score for each HMEC-specific (A) or HPNE-specific (B) GO genes. Specific GO genes are defined as genes that enrich ≥3 fold in the HMEC (A) or HPNE (B) screen and do not enrich in HPNE (A) or HMEC (B). p values were calculated by bootstrapping. See Figures S3A and S3B for STOP genes.
(C and E) Pathways with differential expression in breast versus pancreatic tumors and pathways with differential functional enrichment in HMEC versus HPNE screen were identified as described in (D) below. Examples of GSEA plots for the indicated pathways specific for BRCA/HMEC (C) or PAAD/HPNE (E) are shown.
(D) Similarity between pathways with differential expression in breast versus pancreatic tumors (RNA-seq-based differential expression score between BRCA and PAAD, y axis) and pathways with differential functional enrichment in the HMEC versus HPNE screens (differential enrichment score between HMEC and HPNE, x axis). Top-scoring GSEA pathways (FDR <0.1, absolute value of ES > 0.75) are shown (see STAR Methods). Pearson correlation coefficient (r) and p value are shown. NES, normalized enrichment score.
(F) Examples of pathways and/or gene sets enriched among the GO genes specific for HMEC (left) or HPNE (right) are shown. The top 4–6 most enriched genes from each pathway are shown with a heatmap representing their pE in HMEC or HPNE. GO genes that function as transcription factors (TFs) in HMEC or HPNE and are also specifically upregulated in the cognate cancer type are also shown. Genes shown in green were common GO genes in both cell lines.
STOP and GO Genes Are Enriched among Known Cancer TSGs and OGs
We combined the Library1 and Library2 screens by deriving a combined p value (and FDR) for enrichment (pE) or depletion (pD) for each gene in HMECs and HPNEs (Figure S2I; Table S2D; STAR Methods). In each screen, the GO or STOP genes were significantly enriched (>100% enrichment) among Pan-Cancer OGs or TSGs (Futreal et al., 2004), respectively (Figure 2E; Table S2K). Genes enriched in both HMECs and HPNEs include MYC, CDK6, D-type cyclins, and a dominant-negative mutant TP53 clone (Figure 2G) (Wang et al., 2016), and depleted genes include CDKN1A, CDKN1B, and WT1. GO and STOP genes were also enriched in BRCA- or PAAD-specific predicted cancer driver genes (>95% enrichment) (Table S2H; Figure 2F; p value is significant only in one case due to small number of tumor-type-specific TSGs/OGs). Known tissue-specific cancer drivers identified in our screen include GATA3, a mediator of mammary epithelial cell differentiation (Asselin-Labat et al., 2007) and BRCA TSG, that was more dramatically depleted from HMECs than HPNEs (Figure 2G). Conversely, genes involved in the RAS pathway, which is known to be frequently altered in pancreatic but not breast cancer (Eser et al., 2014), were specifically enriched in HPNEs (Figure 2G).
Cell-Type-Specific GO Genes Recapitulate Tissue-Type-Specific Expression Signatures in Cancer
The fact that GO genes are largely cell-type-specific suggests that the positive regulation of proliferation is governed by tissue-specific mechanisms. These genes could provide insight into specific modules regulating mammary and pancreatic cell proliferation and how those pathways are leveraged to promote unrestrained proliferation during tumorigenesis. We explored whether our cell-type-specific GO genes might exhibit tissue-specific expression in BRCA versus PAAD and whether tissue-type-specific gene sets, and pathways are similarly enriched in functional screens (HMEC versus HPNE) and in cancer (BRCA versus PAAD). First, for each gene we derived a differential expression score in tumors, defined as the differential expression between BRCA and PAAD (TCGA dataset, see STAR Methods), as an estimate of the tumor type specificity in gene expression. We found that HMEC- (or HPNE-) specific GO genes show higher expression in BRCA (or PAAD, respectively) (Figures 3A and 3B). An opposite trend was observed for STOP genes (Figures S3A and S3B).
Next, we asked whether the gene sets that enriched in a tissue-specific manner in the screens and the tumors showed similarity. For each gene we derived a differential functional enrichment score defined as the difference between the enrichment score in the HMEC versus HPNE proliferation screens (analogous to the differential expression score; see STAR Methods). By applying GSEA to the genes ranked by either of these scores, we identified pathways differentially specific for HMEC or HPNE and for BRCA or PAAD. This analysis revealed a strong similarity between the pathways enriched functionally in the HMEC (or HPNE) screens and the BRCA (or PAAD) transcriptomes (Figure 3D, p = 0.003; r = 0.7; Figure S3C using a different cutoff for enriched pathways; see also Table S3).
Analysis of these differentially enriched pathways suggests a key role of GPCR signaling in proliferation control in HMECs and BRCA (Figures 2D, 3C, and 3F). One family of GPCRs, the prostanoid ligand receptors, shows especially strong enrichment both among HMEC GO genes and BRCA-expressed genes (Figures 3C and 3F). Interestingly, many GPCRs drop out of the HPNE screen, with several of them scoring as STOP genes (for example, PTGER4 HMEC log2FC = 1.9, HPNE log2FC = −2.2). These receptors bind prostaglandins, bioactive lipid compounds derived from arachidonic acid, and are associated with many cellular functions and altered in cancer (Reader et al., 2011).
One of the pathways enriched in HPNE GO genes and in PAAD-expressed genes is pancreas beta cell development, with two important transcription factors NEUROD1 and NEUROD2 scoring among the top 5 GO genes (Figures 3E and 3F). Notably, these genes are potent STOP genes in HMECs (NEUROD1 HPNE log2FC = 3.8, HMEC log2FC = −1.9; NEUROD2; HPNE log2FC = 4.3, HMEC log2FC = −1.5). NEUROD1 and NEUROD2 have been implicated in pancreas development and NEUROD1 was recently found overexpressed in PAAD (Bailey et al., 2016). Other HPNE GO gene pathways are nuclear receptors, and GAP junctions (Figures 3E and 3F). Many nuclear receptors that act as transcription factors (e.g., PPRAG) have been associated with PAAD progression (Youssef and Badr, 2011).
Finally, we studied the expression of GO genes in tumors and found that the overall expression of GO genes was higher in cell lines or tumors with higher levels of proliferation markers in a tissue-specific manner (Figures S3D and S3E; see STAR Methods). Together, these observations support the cell type specificity of pathways that regulate cell proliferation. Furthermore, the high similarity of cell-type-specific proliferation pathways, as defined by GO genes, with tumor-type-specific GO gene expression supports the relevance of these genes to human cancers.
Discovery of KRTAPs as a Family of Proliferation Genes
Among the most notable pro-proliferative genes in HMECs are the keratin-associated proteins (KRTAPs) (Figure 3F). KRTAPs comprise 4 of the top 10 (p = 3.3 × 10⁻⁸) and 16 of the top 50 (p = 4.0 × 10⁻²⁸) HMEC GO genes. Compared to olfactory receptors, which do not affect proliferation, the distribution of KRTAP log2FC in the HMEC screen is highly skewed toward enrichment (p = 5 × 10⁻⁵) (Figure 4B). In contrast, in HPNE and IMR90 screens, KRTAPs were neutral (Figure 4C). We individually validated the proliferation phenotype of two KRTAP genes in HMECs with other GO genes (Figure 4A).
Figure 4. KRTAPs Are a Family of Candidate Proliferation Drivers.

(A) Individual validation of selected HMEC ORF GO genes by multi-color competition assay (MCA). Bar plot shows the percent of ORF-expressing cells after 6 PDs of culture from a starting mixture of 50:50 with EV cells. Error bars ± SD. Asterisk represents an ORF that was not in the screening library but was included in the validation experiment.
(B) Distribution of HMEC average Log2FC of KRTAP ORFs (top) and neutral gene family Olfactory Receptor ORFs (bottom).
(C) Distribution of average log2FC of KRTAP ORFs in HPNE (top) and IMR90 (bottom) screens.
(D) HMEC average log2FC values for KRTAP ORFs arranged by sub-family. GO gene sub-families are labeled in red, and selected neutral subfamilies are labeled in gray.
(E) Bar plots of normalized expression of KRTAP (GO or neutral) genes in breast cancer subtypes and normal mammary gland tissue. Normal, normal tissue; ER/PR, ER or PR positive; HER2, HER2-positive; TPBC, triple positive breast cancer (ER/PR positive and HER2 positive); TNBC, triple negative breast cancer. Tumor type and p value (Wilcoxon rank sum test) are indicated above each plot.
(F) Heatmap of top enriched gene sets among most overexpressed and under-expressed genes in each sample, based on GSEA analysis of RNA-seq data. The heatmap depicts GSEA normalized enrichment score (NES) for each pathway in each sample and is annotated to reflect some of the predominant trends in indicated clusters.
(G) E2F1 mRNA levels (from RNA-seq) after overexpression of the indicated ORF (and in TP53KO) in HMECs as compared to empty vector (EV). Error bars ± SD.
(H) Western blot for E2F1 protein levels in cells expressing indicated ORF or empty vector (EV). Vinculin (VINC) was used as a loading control. Normalized expression levels are shown below the blot.
(I) Western blot for E2F1 protein levels in cells utilized for (J). Vinculin (VINC) is used as a loading control.
(J) Bar plot showing proliferation rate (shown as percentage change compared to EV control) of HMECs expressing empty vector (EV), KRTAP10-6 (KAP10-6), or KRTAP4-5 (KAP4-5). Cells were transduced with shRNAs targeting E2F1, or with a control shRNA targeting OR11L1. Cells without any shRNA were also tested. Error bars ± SD.
The KRTAP family consists of 101 genes that play critical roles in the formation of hair with expression restricted primarily to hair follicles (Wu et al., 2008). KRTAPs fall into two classes—high/ultrahigh cysteine (HS, subfamilies 1–5, 9–13, 16–17, and 24–29) and high glycine-tyrosine (HGT, subfamilies 6–8 and 19–21) (Wu et al., 2008). The KRTAP GO genes represent only 6 of the 27 KRTAP gene subfamilies, the KRTAP2, KRTAP4, KRTAP5, KRTAP9, KRTAP10, and KRTAP16 HS subfamilies (Figure 4D).
Given their ability to stimulate proliferation at rates similar to oncogenes like MYC, we examined relative KRTAP gene expression in BRCA (from TCGA, see STAR Methods). Comparing expression of the GO KRTAPs as a group to that of the neutrals, we found that in breast cancer GO KRTAP expression was significantly higher than in normal tissue while neutral KRTAPs showed no differences (Figure 4E). Relative increases in GO KRTAP expression were also observed in several other cancer types (Figure S4A). As expected, neither neutral nor HGT KRTAPs showed increased tumor expression in most tissues (Figures S4B and S4C).
The potency of these proliferation regulators begs the question of their function. Thus, we examined gene expression profiles using RNA sequencing (RNA-seq) of cells expressing a potent KRTAP gene, KRTAP10-6, compared to oncogenic proliferation regulators such as CCND1, MYC, SRC, and mutant TP53 (TP53KO) (Figure S4D). GSEA analysis revealed the top enriched pathways upregulated by KRTAP expression are E2F-mediated regulation of DNA replication, G1-S-specific transcription, cell-cycle, translation, and ribosome (Table S4). KRTAP-induced mRNA changes are most closely related to those due to CCND1 expression (Figures 4F and S4E).
CCND1 is an activator of CDK4/6 kinases that promote the G1/S transition by inactivating RB1 (Musgrove et al., 2011). Because the E2F1 transcription factor is inhibited by RB1 and the “E2F-mediated regulation of DNA replication” pathway was enriched after KRTAP expression (Table S4), we examined E2F1 levels and found that expression of 2 independent and potent KRTAPs (10-6 and 4-5) led to a 2-fold increase of E2F1 RNA and protein (Figures 4G and 4H). E2F1 upregulation occurred to a lesser extent after CCND1, but not MYC or SRC, induction (Figures 4G and 4H). To test the functional relevance of E2F1 upregulation, we reduced E2F1 levels to that of control cells in KRTAP-expressing cells using short hairpin RNAs (shRNAs). Neither E2F1-sh4 nor ctr-sh (targeting OR11L1 as negative control),which did not alter E2F1 protein levels, affect proliferation rates of KRTAP-expressing cells. In contrast, 2 shRNAs (1 and 3) that reduced E2F1 to the level of control cells (EV), reversed the increase in proliferation induced by KRTAP (Figures 4I and 4J). These data suggest that KRTAP GO genes are upregulated in cancer and can promote proliferation through upregulation of E2F1.
STOP and GO Genes Are Enriched in Cancer-Associated Focal SCNAs in a Tissue-Specific Manner
A primary goal of this study was to identify genes that are not frequently mutated by point mutation in tumors but whose altered expression or copy number may drive cancer nonetheless. We previously reported that STOP genes identified by LOF genetic screens and by analysis of cancer mutation patterns are enriched in recurrent deletions while GO-like putative oncogenes identified by point mutations are enriched in recurrent amplifications (Davoli et al., 2013; Solimini et al., 2012). If the GOF GO genes are cancer drivers, they should also be enriched in amplicons. Thus, we asked whether recurrent focal regions of SCNA across all cancers contained more GOF STOP and GO genes than expected (Zack et al., 2013). Over 50% more HMEC and HPNE GO genes were found within regions of recurrent pan-cancer focal amplification than expected by chance (HMEC p = 0.01, HPNE p = 0.03) (Figure 5A). We also observed substantial enrichment of both HMEC and HPNE STOP genes in focal deletions (Figure 5B).
Figure 5. GO and STOP Genes Recapitulate Tissue-Specific Patterns of SCNA in Cancer.
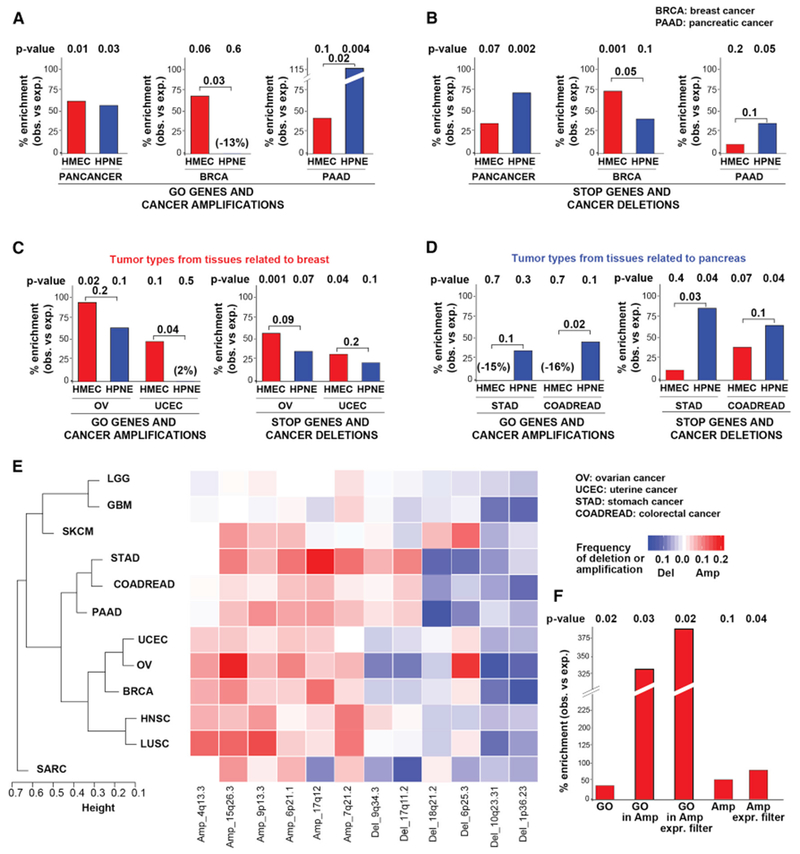
(A and B) Bar plots depicting the percent enrichment (over expected) of HMEC (red) or HPNE (blue) GO (A) or STOP (B) genes in amplicons (A) or deletions (B) from the indicated cancer type. SCNA data are from GISTIC2 analysis of primary tumors (see STAR Methods). p values are from one-tailed Fisher’s exact test. For the tumor-type-specific analyses, bootstrapping-based analysis was performed to test whether the difference between the enrichment for the HMEC and HPNE screens was statistically significant (see STAR Methods).
(C and D) Bar plots as in (A) depicting percent enrichment of HMEC and HPNE GO and STOP genes in tumors related to breast (C) or to pancreas (D).
(E) Heatmap and hierarchical clustering of SCNA patterns across tumor types (Table S5E). Representative SCNAs are shown.
(F) Bar plot showing % enrichment (over expected) of the indicated HMEC gene set among genes depleted from RNAi screens in breast cancer cell lines. GO, top 1,000 HMEC enriched genes; GO in Amp, GO genes within BRCA focal amplicons; GO in Amp Expr Filter, GO genes within BRCA focal amplicons after filtering out low expressed genes in BRCA (bottom 30%); Amp, genes in BRCA focal amplicons; Amp Expr Filter,: genes in BRCA focal amplicons after filtering out low expressed genes. p values are from one-tailed Fisher’s exact test.
Next, we considered whether the tissue-specific nature of GO genes was reflected in the patterns of SCNA. We thus compared HMEC and HPNE GO genes to SCNAs found specifically in BRCA or PAAD, excluding SCNAs common across tumor types. HMEC and HPNE GO genes were preferentially enriched within the recurrent focal amplicons of corresponding cancer types. Strikingly, HMEC GO genes exhibited more than twice the enrichment in BRCA amplicons than HPNEs did (Figure 5A; p = 0.03), while HPNE GO genes showed more than twice the enrichment in PAAD amplicons than HMEC GO did (p = 0.02, see STAR Methods). Using BRCA amplicons predicted by an alternative algorithm, ISAR (Sanchez-Garcia et al., 2014), gave an even more significant enrichment of HMEC GO genes (Figure S5C). We observed similar enrichments of HMEC and HPNE STOP genes in BRCA and PAAD recurrent focal deletions, respectively (Figure 5B).
Finally, we asked whether the GO genes were able to inform which amplified genes are functionally required for proliferation in cancer cell lines. We analyzed HMEC GO genes in RNAi-based proliferation screens in cancer cell lines (McDonald et al., 2017; Tsherniak et al., 2017) and found that HMEC GO genes were significantly enriched (33%, p = 0.02) among the genes required for proliferation in breast cancer cell lines (Figure 5F). The enrichment was higher for GO genes located in recurrent amplicons (335%, p = 0.03). Importantly, the enrichment of these amplified GO genes was much stronger than the enrichment of all genes from recurrent amplicons (49%). This results shows that our experimental screen is able to identify functionally relevant cancer drivers within recurrent cancer amplifications.
Tissue-Specific STOP and GO Genes Underlie SCNA Similarities among Related Tissues
The above results argue that there is a strong lineage specificity underlying the pattern of SCNAs recurrently selected in cancer. To explore this further, we repeated this SCNA analysis in 4 other cancer types that belong to the same body systems as breast or pancreatic cancer. We considered colorectal (COADREAD) and stomach (STAD) adenocarcinomas, both derived from the gastrointestinal tract like PAAD, and ovarian serous cystadenocarcinoma (OV) and uterine corpus endometrial carcinoma (UCEC), both derived from organs belonging to the female reproductive system that respond to hormones, like BRCA. We found HMEC GO genes are more enriched within OV and UCEC amplicons than HPNE GO genes (Figure 5C) while HPNE are more enriched among focal amplicons in STAD and COADREAD cancers than HMEC GO genes (Figure 5D). A similar reciprocal relationship exists for HMEC and HPNE STOP genes and recurring focal deletions in the corresponding related tissues (Figures 5C and 5D).
If the argument that distinct genetic regulatory network architectures underlie the choice of both functional drivers and SCNAs in different cancers is correct, then the cancers that exhibit the most similarity in functional drivers should also show related patterns of recurrent focal SCNAs. We performed unsupervised hierarchical clustering of tumor types based on their distribution of focal SCNA events (see STAR Methods). Consistent with our hypothesis, we found that tumors from related organs—such as tumors from the gastro-intestinal tract (PAAD, COADREAD, STAD) and tumors of organs related to the reproductive system (BRCA, OV and UCEC)—exhibited more similar SCNA patterns (Figure 5E; Table S5E). These results indicate that the tissue-specific patterns of proliferation identified by our GOF screens in HMECs and HPNEs are physiologically relevant, and many of these genes are subject to alteration during tumorigenesis.
GO Genes Improve the Prediction of Tissue-Specific Aneuploidy
We previously showed that the density and potency of TSGs and OGs defined by their point mutational patterns (i.e., Charm and Chrom scores) predict the frequency of deletions and amplifications of arm and whole chromosomes within a pan-cancer tumor set (Davoli et al., 2013). We now performed a similar analysis on breast and pancreatic cancers including the GO genes. We primarily used the difference between the deletion and amplification frequency for each chromosome or arm (Del-Amp Frequency, see STAR Methods) while reporting the individual correlations in Tables S6A–S6D.
We predicted the mutated TSGs and OGs based on genomic data from 184 PAAD and 988 BRCA tumors (see STAR Methods). Based on the density of mutated drivers, we derived a score for each chromosome (ChromTSG-OG) or arm (CharmTSG-OG). We next included the functional proliferation drivers (GO genes) deriving the corresponding CharmTSG-OG-GO and ChromTSG-OG-GO scores (Figure 6A; see STAR Methods). Although scores based on mutated drivers alone correlated with the frequency of deletions and amplifications, including GO genes in the score significantly improved the predictions. For BRCA, including HMEC GO genes improved the prediction of whole chromosome aneuploidy (Del-Amp Freq) from r = 0.26 p = 0.1 to r = 0.4 p = 0.03 and arm aneuploidy from r = 0.45 p = 0.002 to r = 0.51 p = 0.0005 (Figures 6B, 6C, and S6A). Similarly, for PAAD, including the HPNE GO genes improved the prediction of whole chromosome aneuploidy from r = 0.25 p = 0.1 to r = 0.32 p = 0.07 and arm aneuploidy from r = 0.44 p = 0.003 to r = 0.49 p = 0.0008 (Figures 6B, 6D, and S6B). This improvement was tumor-type-specific, as using HPNE GO genes instead of BRCA GO genes did not improve the prediction of BRCA aneuploidy and including the HMEC GO genes in place of HPNE GO genes actually impaired the prediction of PAAD aneuploidy (Figure S6C). This result suggests that the GO genes identified through GOF screens represent true cancer drivers and that their position along the chromo-somes significantly contributes to the selective forces shaping the patterns of aneuploidy during tumorigenesis, in a tissue-specific way.
Figure 6. STOP and GO Genes Help Predict Aneuploidy Patterns and Recapitulate Proliferation Phenotypes in Tumors.
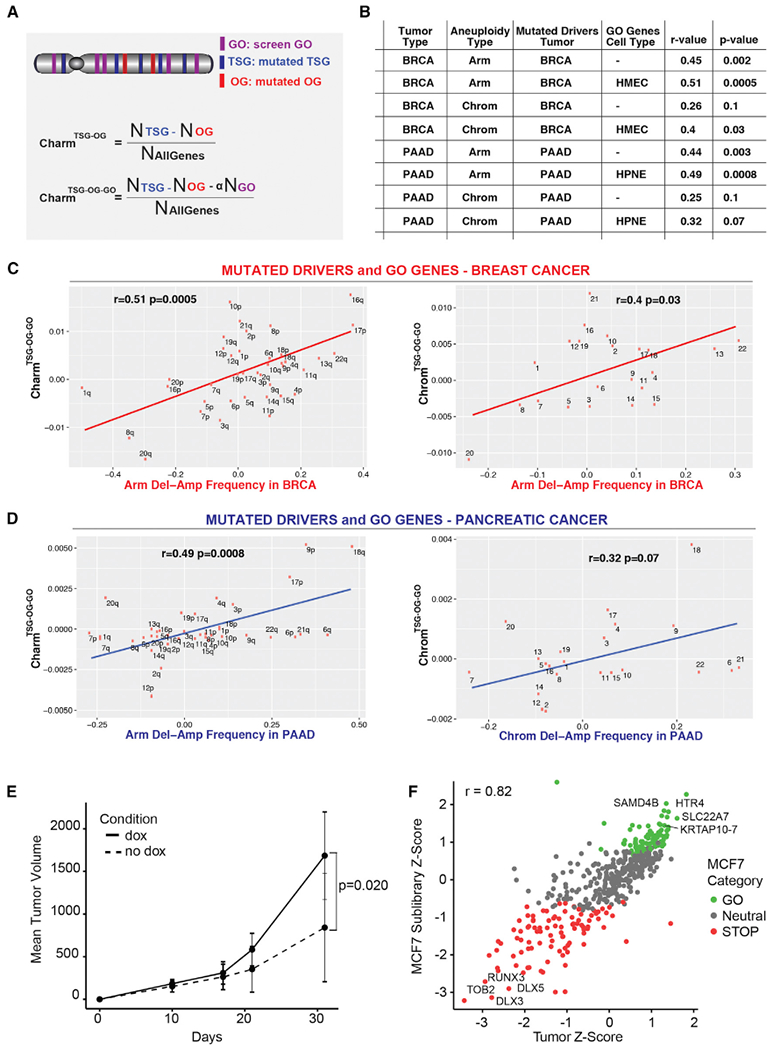
(A) Schematics showing the calculation of the Charm score for mutated drivers (TSG and OG) alone (CharmTSG-OG; above) and mutated drivers plus GO proliferation drivers (CharmTSG-OG-GO; below). Similar methods were utilized to determine the Chrom scores (see STAR Methods).
(B) Table showing the relationship between the deletion-amplification frequency of arm (or chromosomes) for the indicated tumor types with the Charm or Chrom scores derived using the mutated TSG/OG from BRCA or PAAD and the GO genes (when indicated) from HMEC or HPNE. Pearson’s correlation coefficient (r) and p value are indicated.
(C and D) Correlation between the CharmTSG-OG-GO (or ChromTSG-OG-GO) score determined using the mutated TSG/OG from BRCA (C) or PAAD (D) and the HMEC GO genes (C) or HPNE GO genes (D) and the deletion-amplification frequency in BRCA (C) or PAAD (D) at the arm or chromosome level, as indicated.
(E) MCF7 tumor volume over time following implantation of ORF sublibrary cells into cleared mammary fat pads of NSG mice. Tumor volumes from each flank in a single mouse were summed, and the mean was computed across all dox mice (n = 9) and all no dox mice (n = 3). Error bars ± SD. p value was determined by one-tailed Student’s t test.
(F) Scatterplot of the Z score for genes in the MCF7 Sublibrary proliferation screen versus MCF7 Tumor screen, colored according to MCF7 Sublibrary gene category. Pearson’s product-moment correlation coefficient (r) is indicated.
See also Figures S6 and S7 and Table S6.
In Vitro Proliferation Phenotypes Are Recapitulated In Vivo
To address whether our GO and STOP genes control proliferation in vivo, we performed in vitro and in vivo proliferation screens in MCF7 slow growing luminal breast cancer cells using a sublibrary of 309 GO, 131 STOP and 46 neutral genes from the HMEC genome-scale screen (Figures S1D and S7A; STAR Methods). This sublibrary was also rescreened in HMECs and behaved extremely similarly to the genome-scale screen (r = 0.89) (Figure S7B).
Notably, following MCF7 cell implantation into mouse mammary fat pads, tumors grew more rapidly in the presence of dox (Figure 6E). We observed considerable correlation between the performance of the sublibrary in vitro and in vivo (r = 0.82) (Figure 6F; Table S6E). We also observed very high concordance between the in vivo screen and the sublibrary proliferation screen in HMECs (r = 0.67) (Figure S7C). The vast majority of HMEC GO genes enrich in MCF7 tumors, and nearly all HMEC STOP genes drop out from these tumors. As expected, all sets of GO or STOP genes examined enriched or depleted, respectively, in the tumors relative to neutral genes (Figure S7D). Importantly, the KRTAP GO genes in the sublibrary were significantly enriched in the tumors. These results provide functional evidence to suggest that in vitro proliferation screens of non-transformed cells can successfully and efficiently identify genes that promote tumor growth.
Annotation of Putative Cancer Drivers in Recurring SCNA Regions in Cancer
The substantial enrichment of GO and STOP genes in recurrent SCNAs demonstrates successful identification of cancer drivers not found through mutational analyses (Figures 5A and 5B). Among the top 1,000 STOP genes from each screen (ranked by p value), 107 are found within pan-cancer, BRCA, or PAAD focal deletions. Of these 107, only 5 are found among a curated set of nearly 500 known or predicted TSGs (see STAR Methods). Within the 107 deleted STOP genes, we found 13 HMEC and 22 HPNE STOP genes beyond the number expected by random chance (p = 0.009 in HMEC, p = 0.002 in HPNE). This suggests that at least 35 of these genes may function cooperatively as drivers in recurring deletions.
Among genes in pan-cancer, BRCA, or PAAD amplicons, we identified 147 GO genes (using the top 1,000 genes ranked by p value for each screen) (Figure 7; Table S7). Of these, 133 had not been previously linked to cancer based on a curated list of about 600 known or predicted OGs (see STAR Methods). Of the 147 genes, we found 24 more HMEC and 17 more HPNE GO genes than would be expected randomly suggesting at least 41 genes are likely to function as oncogenic drivers (p = 0.0012 in HMEC, p = 0.0045 in HPNE). It is important to note that many more than these 41 are likely to function as drivers. According to the Cancer Gene Island hypothesis (Davoli et al., 2013; Solimini et al., 2012), amplicons are selected based on the net cumulative effect of all genes within the amplicon. Many GO genes identified may exist in a genomic context where the advantage of their amplification within a larger segment is insufficient to confer selectivity due to adjacent genes whose amplification are detrimental. Such GO genes would not be detected in amplicons. However, if transcriptionally upregulated by other means, they could contribute to proliferation.
Figure 7. Annotation of the Cancer Genome with Amplified GO Genes.

Schematic representation of the human genome with recurrent focal amplicons of three cancer datasets (BRCA, PAAD, and pan-cancer) indicated by colored bands. GO genes (defined as the top 1,000 genes from the HMEC and HPNE screens) found within pan-cancer or BRCA peaks (HMEC) or within pan-cancer or PAAD peaks (HPNE) are indicated, and the text color corresponds to the screen in which they scored. Only GO genes that are within the top 70% of expressed genes in cancer are depicted (see STAR Methods). For BRCA peaks, both GISTIC2 and ISAR predictions were considered. Colored tracks to the left of chromosomes indicate relative peak locations. Peaks are not drawn to scale.
See also Table S7.
DISCUSSION
Discovery of a Large Number of Drivers of Proliferation
GOF screens with our genome-scale modular library of barcoded ORFs performed in three human cell types robustly identified many known and previously unappreciated regulators of proliferation and cancer drivers (Figures 2E–2G and 3F; Table S2). These screens identified a total of 391 GO-like drivers of proliferation and 1,269 STOP-like drivers with an FDR <0.05 in at least one of our three genome-scale screens. These results suggest that ~10% of genes analyzed have dosage-dependent effects on cell proliferation. Our GO genes include many known proliferation drivers such as D-type cyclins, CDKs, genes involved in growth factor and survival signaling, and Hippo pathway genes, among others. STOP genes include many known negative regulators of proliferation including CDK inhibitors, apoptotic regulators, and components of interferon signaling. Importantly, the majority of GO and STOP genes do not have previously known connections to proliferation mechanisms.
Among GO genes shared across cell lines was RHOJ, which was a surprise because it was primarily linked to metastasis via a role in actin cytoskeleton modulation and cell migration, not proliferation (Ho et al., 2013; Kim et al., 2016). However, a theoretical paper recently suggested that cell migration could enhance tumor growth by allowing cells to move and escape local constraints on growth such as contact inhibition (Waclaw et al., 2015) potentially explaining RHOJ’s detection.
Striking Cell-Type Specificity among Proliferation Regulators
While common regulators were detected, many genes differed dramatically (sometimes showing opposite effects) in their capacity to regulate proliferation between cell types (Figure 2C). Illustrating these differences are the enrichment of HMEC STOP genes among HPNE GO genes (94% enriched, p = 8 × 10~14) and of HPNE STOP genes among HMEC GO genes (91% enrichment, p = 2 × 10~11). These enrichments are nearly as strong as the enrichment of HMEC and HPNE GO genes among one another (134%, p = 4 × 10~10) (Figure S2I). This observation suggests that not only are proliferation regulatory networks highly cell-type-specific, they may also exhibit significant mutual antagonism between cell types, depending upon the contextual genetic network architecture in which they are expressed.
A dramatic case of cell-type specificity is the pro-proliferative effect of expression of certain KRTAP sub-families in HMEC but not HPNE or IMR90 cells. Our analysis suggests that KRTAPs may promote cell proliferation by promoting S phase entry by inducing E2F upregulation. In addition, KRTAP GO genes are up-regulated in breast tumors, and showed enhanced proliferation in vivo within tumors (Figures 4E, 6F, and S7D). Why KTRAPs function in HMEC and not in HPNE or IMR90 is not known. Perhaps the close relationship of mammary tissue to skin cells and hair follicles due to their shared ectodermal origin may be responsible for a genetic network architecture permissive to KRTAP-driven cell proliferation, while tissues derived from other germ layers lack this architecture. Much work will be required to understand the mechanistic role such tissue-specific factors play in driving proliferation, and the basis of their cell type restrictions.
Discovery of Cancer Drivers in SCNAs
Through this study, we have identified 147 GO genes (proliferation drivers) that map to regions of recurring amplifications in cancer and are likely cancer oncogenes (Figure 7). Oncogenes can act cumulatively when co-amplified or can act alone when transcriptionally upregulated. While we have focused on GO genes, we also found that STOP genes are enriched in focal deletions. Two types of genes should be detected as STOP genes in this GOF screen: those whose overproduction interferes with essential processes to impede proliferation or induce cell death; and those whose expression enhances negative growth control such as CDK inhibitors. The loss of function of the latter group due to focal deletion would be pro-proliferative. This latter group must be significantly large as we found as much as 50% enrichment in recurrent cancer deletions. It is possible that among the STOP genes are previously unappreciated tumor suppressors (not identified by mutational analyses because they are not haploinsufficient) that may contribute to proliferation when simultaneously co-deleted with neighbor STOP genes, or when downregulated transcriptionally beyond the 2-fold level. Altogether, we found a total of 254 STOP and GO genes in regions of recurring SCNAs in cancer, including 76 more than would be expected by chance, indicating a minimum of 76 and a maximum of ~250 drivers of cancer. Analysis of STOP and GO genes in additional cell types should identify even greater numbers of drivers.
Proliferation Phenotypes In Vitro Are Recapitulated In Vivo
A key consideration of in vitro studies with respect to human cancer is whether they are reflective of growth patterns observed in vivo. The majority of GO and STOP genes that regulated proliferation in vitro also regulated proliferation in MCF7 tumors, suggesting that the genes producing growth phenotypes in vitro have relevance for cancer (Figures 6F and S7C). The strong reproducibility of our results in tumors further underscores the utility of gain of function studies for modeling genetic changes in vivo.
A Tissue-Specific Genetic Network Architecture Determines Driver Responsiveness and SCNA Selection
The tissue-specific differences in STOP and GO genes we observed are interesting, but what can they tell us about the cancers derived from different tissues? Several lines of evidence suggest these observations are informative about important aspects of cancer biology. First, GO genes identified in a particular cell type show greater differential expression in tumors derived from that cell type than tumors from unrelated cell types (Figures 3A and 3B). Second, the same pathways enriched in gene sets of differentially expressed genes between BRCA and PAAD tumors are also enriched when comparing the GO gene that are differentially functional between HMEC and HPNE cells (Figures 3C–3F). Third, tissue-specific TSGs and OGs are detected functionally as STOP and GO genes in their cognate cell types. For example, the breast-specific TSG GATA3 inhibits HMEC proliferation when expressed but has only a minor phenotype when expressed in HNPE cells. These findings suggest that both normal cells from a given tissue and cancers derived from the same tissue are specifically sensitive to the same subsets of regulators, many of which are not shared with other tissue types.
STOP and GO genes are enriched within SCNAs, both at the focal and arm/chromosome level (aneuploidy) in cancers suggesting alteration of their expression is undergoing selection in vivo. This enrichment is particularly relevant because this is not only true in pan-cancer SCNAs, but also in tissue-specific SCNAs. The GOF proliferation regulators identified in a given cell type show much stronger enrichment in SCNAs in the cognate tumor type (or in related tumor types) than in tumors from a different tissue origin. This tissue-specific pattern of SCNA enrichment extended, at least in part, to cancers of distinct but functionally related tissues. This relationship among related cancer types suggests that an underlying genetic network architecture related to body plan specification laid down during development, governs the genes and pathways capable of controlling cell proliferation and cancer. This tissue-specific differential sensitivity to proliferation regulators may thus provide an explanation for the selective pressure leading to different patterns of SCNAs and the different spectrum of drivers observed in different cancer types. This differential sensitivity should apply not only to GOF drivers but to all drivers including mutational drivers and could help explain the “long tail” driver patterns seen in pan-cancer analyses (Davoli et al., 2013; Lawrence et al., 2014).
The inducible barcoded ORF libraries and screening strategies developed here are a resource for GOF screening with myriad potential applications. Our GOF screens identified nearly 150 amplified drivers of tumorigenesis, most of which have not been heretofore tied to human cancer (Figure 7), and hundreds more that could be transcriptionally regulated in cancer. Additional screens in other cell types are likely to expand these numbers.
The vast differences between the STOP and GO gene sets identified in our analyses reveal a strongly tissue-specific genetic network architecture that determines the operational efficacy of proliferation drivers in different tissues. How this works is unknown, but we hypothesize that each cell type is epigenetically wired in a largely distinct manner and thus has differing sensitivities to potential growth promoting signals. There are multiple positions within signaling pathways at which lineage specificity could arise. For example, signaling pathways such as the GPCRs, which differentially promote proliferation in HMEC and HPNEs, could elicit different outcomes depending on the availability of various pathway effectors. This is even true for the action of downstream effectors such as transcription factors in which the specific epigenetic chromatin landscape in each tissue can directly influence which targets are transcriptionally accessible and thus what proliferation outcomes occur (e.g., NEUROD1/2 behave as GO genes in HPNE and STOP genes in HMEC).
Our results indicate that the tissue-specific patterns of proliferation regulatory genes we identified are physiologically relevant as many of these genes are subject to alteration during tumorigenesis. The specific enrichment of STOP and GO genes within SCNA regions of tumors from related tissue types indicates that these individual genetic network architectures are uniquely leveraged to explain the tissue-specific patterns of SCNA and aneuploidy observed in human cancer, thereby providing a glimpse into the mechanism of tissue specificity in tumorigenesis. Whether the influence of this exquisite differential architecture extends beyond cancer drivers to other aspects of biology such as therapeutics remains to be determined.
STAR★METHODS
CONTACT FOR REAGENT AND RESOURCE SHARING
Further information and request for reagents may be directed to the Lead Contact, Stephen J. Elledge (selledge@genetics.med.harvard.edu).
EXPERIMENTAL MODEL AND SUBJECT DETAILS
Cell Lines
HMECs (Lonza cat # CC-2551) were immortalized with hTERT, as reported (Solimini et al., 2012), and were maintained in MEGM (Lonza cat # CC-3150). hTERT immortalized HPNEs (also known as HPDEs) were the generous gift of Paul Campbell, and were maintained in a mixture of 1 part M3:BaseF medium (INCELL # M300F-500) with 3 parts DMEM supplemented with 10% FBS, 100 units/mL penicillin, and 0.1 mg/mL streptomycin. U2OS osteosarcoma cells (obtained directly from American Type Culture Collection, HTB-96) were maintained in McCoy’s 5A medium supplemented with 10% (v/v) FBS (Hyclone), 100 units/mL of penicillin, and 0.1 mg/mL streptomycin. 293T cells were maintained in DMEM supplemented with 10% (v/v) FBS (Hyclone), 100 units/mL penicillin, and 0.1 mg/mL streptomycin. Human IMR90 fibroblasts were obtained from American Type Culture Collection and were immortalized with hTERT. Cells were maintained in DMEM-glutamax (Invigtrogen) supplemented with 15% FBS, penicillin–streptomycin, and 0.1 mM nonessential amino acids (Invitrogen). MCF7 cells were the generous gift of the Polyak laboratory, and were maintained in DMEM supplemented with 10% FBS, 10 ug/mL Insulin (Sigma #I0516-5mL), 100 units/mL penicillin, and 0.1 mg/mL streptomycin.
Generation of rtTA Cell Lines
HMEC and HPNE rtTA Clonal Lines
Cells (HMEC or HPNE) were transduced with pInducer-rtTA-Neo lentivirus and selected with 200 ug/mL Neomycin (Thermo Fisher cat # 10131035). Stable cells were then plated at clonal density and clones were isolated and expanded. Clones were transduced with pHAGE-TRE-BC-DEST vector carrying EGFP (pHAGE-TRE-BC-EGFP). While these cells are clonal for rtTA, the EGFP integration is heterogeneous. In HMECs, which are puromycin sensitive, EGFP integrants were selected with 2 ug/mL puromycin treatment for 4 days. In HPNEs, which are puromycin resistant, cells were transduced with a multiplicity of infection (MOI) of approximately 0.8 to mirror screen conditions. This results in a population in which about 60%–70% of cells receive at least one EGFP copy and the remaining cells are not infected, but cannot be selected against. Cells were then induced with dox for 48 hr (100 ng/mL in HMECs, 1 ug/mL in HPNE) and FITC-A levels were analyzed by flow cytometry, and compared to uninduced cells (See Figures 1C and S1A). A clone that showed strong, uniform induction and low background expression of EGFP was selected from each line for further use.
IMR90 and MCF7 rtTA FACS-enriched (ping-pong sorted) Populations
Cells (IMR90 or MCF7) were transduced with pInducer20-EGFP lentivirus (Meerbrey et al., 2011) and selected with 200 ug/mL Neomycin. Stable cells were induced with 1 ug/mL dox for 48 hr, and sorted by FACS to recover the top 10%–15% most GFP-positive cells. Cells were re-seeded after sorting and allowed to recover and expand in the absence of dox. Cells were then sorted (in the absence of dox), to select the bottom 10%–15% of lowest GFP-expressing cells. The resulting population was then analyzed by flow cytometry to compare FITC-A levels in uninduced cells to levels in cells induced with 1 ug/mL dox for 48 hr (see Figures S1B and S1D). As this approach results in increased homogeneity of both rtTA and GFP expression (since they are supplied to cells in cis on the pInducer20-EGFP vector), the resulting population exhibits a more uniform FITC-A signal when induced with dox as compared to the HMEC and HPNE clonal lines, which contain clonal rtTA but heterogenous EGFP expression. These ping-pong sorted lines were then expanded for further use. For the sorting, we utilized the HMS (Harvard Medical School) Immunology Division flow cytometry core facility.
Cells for Gene Expression Profiling
Generation of Stable ORF-Expressing Cell Lines for Gene Expression Profiling
rtTA-HMECs were transduced with pHAGE-TRE-BC-DEST vector carrying KRTAP10-6 ORF or a known OG ORF (CCND1, MYC, SRC) or empty vector (EV). Stable integrants were selected with 2 ug/mL puromycin treatment for 4 days.
Generation of TP53KO Cells
rtTA-HMECs were seeded at 8.5×10⁵ cells per well of a 6 well dish 24 hr before transfection with pX330-U6-Chimeric_BB-CBh-hSpCas9 expressing an sgRNA against TP53 using Lipofectamine LTX (Invitrogen Cat. Number 15338030). The transfection was performed according to manufacturer’s instructions, but using double the recommended amounts of DNA, LTX, and Plus Reagent (for 6 well plate, we used 25 uL LTX, 5 uL Plus reagent and 5 ug DNA. To select the population of TP53 null cells, we cultured cells in the presence of 3 uM nutlin-3a for approximately 3 weeks. Protein levels of p53 and p21 in TP53KO and parental rtTA-HMEC cells were determined by western blot (Figure S4D).
Mice
Female, 6-week old NSG, or NOD scid gamma (NOD.Cg-Prkdcscid Il2rgtm1Wjl/SzJ) immune deficient mice mice were purchased from The Jackson Laboratory. All mouse experiments were approved by the AAALAC-accredited Dana-Farber Cancer Institute IACUC.
Tumor and normal samples datasets
We utilized the datasets for SCNAs (SNP-array based data), RNaseq data and microarray expression data from the TCGA database (https://tcga-data.nci.nih.gov/docs/publications/tcga) for breast adenocarcinoma (BRCA), pancreatic adenocarcinoma (PAAD), lower grade glioma (LGG), glioblastoma (GBM), skin cutaneous melanoma (SKCM), colorectal adenocarcinoma (CRC or COADREAD), stomach adenocarcinoma (STAD), lung squamous cell carcinoma (LUSC), head and neck squamous cell carcinoma (HNSC), ovarian adenocarcinoma (OV), uterine corpus carcinoma (UCEC), lung adenocarcinoma (LUAD), kidney renal clear cell carcinoma (KIRC), thyroid carcinoma (THCA), bladder urothelial carcinoma (BLCA) and sarcoma (SARC). In addition, we also utilized RNaseq data from the GTEx (the Genotype-Tissue Expression) project (https://www.gtexportal.org) for normal pancreatic tissue.
METHOD DETAILS
Library Construction
Strategy to minimize recombination between BC and ORFs
In the course of designing and testing our barcoding strategy in the vector pHAGE-TRE-BC-ORF, we observed recombination between barcodes and their cognate ORFs that occurred at a frequency dependent on the length of homologous sequence residing between the ORF and the BC, which we have reported in detail elsewhere (Sack et al., 2016). We thus opted for a design that minimized this distance, with the BCs located 97 bp downstream of the 3′ end of the ORFs, resulting in a tolerably small recombination frequency of approximately 6%.
Library 1 - pHAGE-CMV-DEST-PGKpuro 3′ BC Library
The 30-mer barcodes were ordered from IDT as oligos, amplified by PCR and subcloned into pHAGE-CMV-DEST-Pmel (SbfI/XhoI). The resulting barcode library is called pHAGE-CMV-DEST-PGKpuro 3′ barcode library (aka Library 1).
The pHAGE-CMV-DEST-PGKpuro 3′ BC barcode library was linearized with BstZ17I and gel purified. Gateway LR reaction (Thermo Fisher) was performed on this library with pools of ORFeome v8.1 entry clones. This barcode library has an average complexity of 5 barcodes per ORF (Figure 1E).
Mapping the Library 1 ORF-BC Pairs
The pHAGE-CMV-ORF-PGKpuro 3′ BC barcode library was linearized with I-SceI, sheared by sonication, end repaired, dA tailed and ligated with an adaptor. After ligation, fragments ranging 300-500 bp were gel purified and 2 rounds of PCR were performed to add appropriate sequences for pair-end sequencing by Illumina. Genes and barcodes comprising Library 1 can be found in Table S1B.
Library 2 -pHAGE-CMV-DEST-PGKpuro 3′ BC (24-mer) Library
The 3′ barcodes (24-mer) were ordered from IDT as oligos, amplified by PCR and subcloned into pHAGE-CMV-DEST-PmeI (SbfI/XhoI). The resulting barcode library is called pHAGE-CMV-DEST-PGKpuro 3′ BC (24-mer) library (aka Library 2).
The pHAGE-CMV-DEST-PGKpuro 3′ barcode library was linearized with BstZ17I and gel purified. Gateway LR reaction was performed on this library with Ultimate ORF entry clones assembled into six pools of about 3000 ORFs each. This barcode library has an average complexity of 5 barcodes per ORF (Figure 1E). An additional pool of approximately 3000 ORFs from the human ORFeome v8.1 and the ORFeome Collaboration was also included in this library, and contains 30-mer BCs.
Mapping the Library 2 ORF-BC pairs
The pHAGE-CMV-ORF-PGKpuro 3′ barcode library was linearized with I-SceI, sheared by fragmentase, end repaired, dA tailed and ligated to an adaptor. After ligation, fragments ranging 300~600 bp were gel purified and 2 rounds of PCR were performed to add appropriate sequences for pair-end sequencing by illumina. Genes and barcodes comprising Library 2 can be found in Table S1C.
pHAGE-TRE-ORF-3′ Barcode Library Pools
TRE promoter was PCRed from pInducer20 (Meerbrey et al., 2011) and cloned into pHAGE-CMV-DEST-PmeI. The promoter was sequence verified and cloned into pHAGE-CMV-ORF-PGKpuro-3′barcode library pools as a pI-SceI/I-PpoI fragment.
Generation of ORF Sublibrary
A sublibrary of ORFs that scored as GO genes, or STOP genes, or performed neutrally in the HMEC screens was assembled from our arrayed ORF collections. ORFs selected as sublibrary GO genes were among the strongest enriched ORFs by combined p value (pE), or by individual screen p value. Additionally, ORFs that enriched with pE < 0.01 and were found within a pan-cancer or BRCA region of focal amplification (Beroukhim et al., 2010; Sanchez-Garcia et al., 2014; Zack et al., 2013) were also included. ORFs selected as sublibrary STOP genes were among the strongest dropouts by combined p value (pD), or by individual screen p value. ORFs selected as Neutral genes had an average Log2FC (between Library 1 and Library 2) between −0.005 – 0.005, and were annotated as bioinformatically unassociated with cancer (Davoli et al., 2013).
Mapping the ORF Sublibrary ORF-BC pairs
The pHAGE-TRE-ORF-PGKpuro 3′ barcode ORF sublibrary was linearized with I-SceI, sheared by fragmentase, end repaired, dA tailed and ligated to an adaptor. After ligation, fragments ranging 400~800 bp were gel purified and 2 rounds of PCR were performed to add appropriate sequences for sequencing by Ion Torrent. Final PCR products were gel purified and prepared for Ion PGM sequencing using the Ion PGM Template OT2 400 Kit (Life Technologies Cat # 4479878) according to manufacturer’s instructions. Sequencing was performed using the Ion PGM Sequencing 400 Kit (Life Technologies Cat # 4482002) and the Ion 318 Chip Kit v2 (Life Technologies Cat # 4484355), according to manufacturer’s instructions. Genes and barcodes comprising the ORF Sublibrary can be found in Table S2I.
Generation of pInducer-rtTA-Neo
rtTA-Neo construct was derived from pInducer20 (Meerbrey et al., 2011). pInducer20 was digested with BstXI, gel-purified and ligated. Resulting vector was sequence verified.
Lentivirus
Virus Production
293T cells were seeded 24 hr before transfection at 1×10⁷ cells per 150 mm dish. For transfection, plasmid DNA was diluted into reduced-serum medium (Opti-MEM, Life Technologies) to a final volume of 3 mL. Twenty-four μg each of target lentiviral plasmid and a lentiviral packaging plasmid mixture (1:1:1:1 of SV40 VSVg, Gag/pol, TAT, and Rev) was added to Opti-MEM. A volume of 108 μl of TransIT-293 reagent (Mirus) was added to diluted DNA, mixed and incubated at room temperature for > 20 min. The volume of TransIT-293 was always equal to 3X the total mass of plasmid DNA in the mixture. Following incubation, resulting lipid complexes were added dropwise to cells. After 14-18 hr, transfection medium was removed and replaced with 15-20 mL of normal culture medium. At 24 to 36 hr following medium replacement, viral supernatants were collected, and treated with 500 units/mL Benzonase with 10X Benzonase Buffer (500 mM Tris-HCl pH 8.0, 10 mM MgCl2, 1 mg/mL bovine serum albumin) at a final concentration of 1X. The mixture was incubated for 30 minutes at 37°C following addition of Benzonase. Lentivirus was then aliquoted and stored at −80°C until use. See Sack et al. (2016) for detailed protocol.
Viral Titering
Lentiviral titers were determined by transducing U2OS cells with serial dilutions of virus by adding diluted viral supernatant directly to culture medium supplemented with 4 μg/mL polybrene. 16 hr after transduction, culture medium was replaced. Two days after transduction, 1.5 μg/mL Puromycin (Clontech) was added to culture medium and replaced every 3 days. Cells were allowed to grow until visible colonies formed (approximately 8-12 days after transduction). Medium was then removed and cells were stained with 0.5% Methylene Blue in 50% ethanol for 30-60 s. Colonies were counted and used to determine titer based on the volume of virus used.
Screens
Genome Scale Screens
HMEC.
HMEC-rtTA 1-9 clone cells were transduced in independent triplicates with Library 1 and Library 2 lentivirus at an average representation of 1000X (screens for each library were maintained separately). Culture medium was supplemented with 8 ug/mL polybrene (Sigma) at the time of transduction, and was changed the following day. Cells were selected with 2 ug/mL Puromycin, and were expanded. Ten days after infection, initial cell pellets containing ≥ 1000X representation were collected and stored at −80°C to use as reference samples. Remaining cells were split into two branches, at sufficient quantity to maintain ≥ 1000X representation. One branch was induced with 100 ng/mL doxycycline (dox), and the other was passaged in the absence of dox, each for 10 population doublings (PDs). At this time, cell pellets maintaining representation were collected and frozen at −80°C.
HPNE.
HPNE-rtTA clone cells were transduced in independent triplicates with Library 1 and Library 2 lentivirus at an average representation of 1000X. Culture medium was supplemented with 8 ug/mL polybrene (Sigma) at the time of transduction, and was changed the following day. Cells were not selected, as they are already puromycin resistant. Eleven days after infection, initial cell pellets containing ≥ 1000X representation were collected and stored at −80°C to use as reference samples. Remaining cells were seeded at sufficient quantity to maintain ≥ 1000X representation, were induced by addition of 1 ug/mL dox to culture medium, and were passaged for 10 PDs. At this time, cell pellets maintaining representation were collected and frozen at −80°C.
IMR90.
Though immortalized, hTERT-IMR90 cells can still show sensitivity to high oxygen levels. Thus, though the IMR90-rtTA line was generated and expanded at 21% oxygen tension, from the time cells were seeded for transduction, through the duration of the screen, they were incubated at 3% oxygen tension. Cells were transduced in independent triplicates with Library 1 lentivirus at an average representation of 1000X, with 8ug/mL polybrene (Sigma). Medium was changed the following day, and eleven days after infection, initial cell pellets containing ≥ 1000X representation were collected and stored at −80°C to use as reference samples. Remaining cells were seeded at sufficient quantity to maintain ≥ 1000X representation, were induced by addition of 1 ug/mL dox to culture medium, and were passaged for 5 PDs. At this time, cell pellets maintaining representation were collected and frozen at −80°C. Though we carried cells for 10 PDs, we ultimately used the 5 PD time point to compare to our other screens. This was because HMECs and HPNEs each took about 2.5-3 weeks to reach 10 PDs, while IMR90s required approximately 8 weeks to complete 10 PDs. Thus, we selected a time point that more closely matched the time in culture of the HMECs and HPNEs.
CRISPR HMEC Screen.
A previously described library (Martin et al., 2017) of gRNAs targeting 18,166 genes with 5 gRNAs per gene for a total of approximately 91,000 gRNAs cloned into the lentiCRISPR V2 puro vector (Addgene plasmid #52961) was used to screen HMEC-hTERT cells. Pooled virus was prepared by transfecting 293T cells with the library plasmid pool with psPax2 (Addgene plasmid #12260) and pMD2.G (Addgene plasmid #12259) lentiviral packaging vectors using TransIT-293 transfection reagent (Mirus cat# MIR 2700). Viral supernatants were harvested at 48 and 72 hr post transfection and concentrated with lenti-X concentrator solution (Clontech cat# 631231). HMEC-hTERT cells were infected at a low MOI (0.2) with a representation of 500 in triplicate. Cells were selected with 1 mg/mL puromycin (Clontech cat# 631306) for 3 days until an uninfected control plate completely died. An initial cell pellet was taken as PD0, cells were grown an additional 11 population doublings (PD11), and a final cell pellet was collected.
HMEC Sublibrary Screen.
HMEC-rtTA 1-9 clone cells were transduced in independent triplicates with sublibrary lentivirus at an average representation of 1000X. Culture medium was supplemented with 8 ug/mL polybrene (Sigma) at the time of transduction, and was changed the following day. Cells were selected with 2 ug/mL puromycin and were expanded. Initial cell pellets containing ≥ 1000X representation were collected and stored at −80°C to use as reference samples. Remaining cells were seeded at sufficient quantity to maintain ≥ 1000X representation, were induced by addition of 100 ng/mL dox to culture medium, and were passaged for 10 PDs. At this time, cell pellets maintaining representation were collected and frozen at −80°C.
MCF7 in vivo and in vitro Screens
Preparation of Cells and in vitro Screen
MCF7-rtTA cells were transduced in independent triplicates with sublibrary lentivirus at an average representation of 1000X. Culture medium was supplemented with 8ug/mL polybrene (Sigma) at the time of transduction, and was changed the following day. Cells were selected with 2 ug/mL puromycin and were then seeded at excess representation and induced with 1 ug/mL dox for 48 hr. Cells from each replicate were collected, counted, and split into two branches. One branch was reseeded at sufficient quantity to maintain ≥ 1000X representation, and these cells subsequently passaged for 10 PDs, for the in vitro proliferation screen. The other branch was resuspended in FBS-free medium, at a concentration of 2.5×10⁶ cell per 37.5 uL, for injection into mice (see below). Sufficient cells for bilateral injection (2 flanks) into four mice per replicate (3 dox, 1 no dox) were prepared. Additionally, initial cell pellets containing ≥ 1000X representation were collected at this time, and stored at −80°C to use as reference samples.
In vivo Screen
Mice were inoculated subcutaneously with estrogen pellets (17β-estradiol) two days prior to injection of MCF7 cells. Hair was removed from the hypergastrium of mice to expose the fourth nipple between the rear legs. Tumor cells in FBS-free culture medium (see above) were resuspended in equal volume of Matrigel on ice. Mice were anesthetized in an induction chamber by exposure to 2%–2.5% vaporized isoflurane in oxygen. Skin was disinfected with 70% ethanol and tumor cells were injected bilaterally into mammary fat pads, using a 27GX1/2 syringe. 2.5×10⁶ cells resuspended in a final volume of 75 uL were injected into each flank. Four mice were implanted with cells from each replicate (n = 12 total). Within each replicate, three mice were fed with dox food and one mouse was fed with no-dox food (n = 9 dox, n = 3 no dox, total). Tumor diameters were measured each week with a caliper. Tumor volumes in mm3 were calculated according to the formula X = d2 × D/2 (d = short diameter, D = long diameter). Tumors were harvested when they reached approximately 1000 mm3; all mice were euthanized using CO2 on the same day. Tumors were cut into 2×2×2 mm pieces and transferred to 1.5 mL tubes, snap-frozen in liquid nitrogen, and stored at −80°C. Tumors smaller than approximately 500 mm3 were not harvested.
DNA Isolation, BC PCR, and Sequencing
Genome Scale Screens
Screen cell pellets were thawed and lysed in Lysis Buffer (10 mM Tris pH 8.0, 10 mM EDTA, 0.5% SDS, 0.75 mg/mL Proteinase K) at 55°C overnight. Genomic DNA (gDNA) was extracted using Phase Lock tubes (5 PRIME) with Phenol:Chloroform and then Chloroform. RNase A was added to a final concentration of 25 μg/mL and following incubation overnight at 37°C, gDNA was again extracted using Phase Lock tubes with Phenol:Chloroform, followed by two Chloroform extractions. DNA was ethanol precipitated, recovered by centrifugation, and washed three times with 70% ethanol. Dried pellets were resuspended in 10 mM Tris-Cl, pH 8.5 and BCs were PCR amplified with Phusion High-Fidelity DNA Polymerase (NEB Cat # M0530S) in three PCR steps for BC recovery, addition of Illumina adaptors, and sample indexing (Meyer and Kircher, 2010). The first round of PCR was performed using common primers flanking the unique BC region. The reaction contained a total mass of DNA equal to gDNA from cells covering 1000X representation, with individual 100 μl reactions containing 10 μg gDNA, 1X Phusion HF Buffer, 200 μM dNTPs, 1 μM each of ORF.BC1.for and ORF.BC1.rev and 4 units of Phusion Polymerase. Reactions for each replicate were pooled, and 5 μl of pooled PCR1 was used as the template for a 100 ml PCR2 reaction containing 1X Phusion HF Buffer, 250 μM dNTPs, 2 μM each of primers ISP-ORF.BC1.for, and 4 units of Phusion Polymerase. A third PCR reaction was performed to add indices and allow sample multiplexing. The 100 ml PCR3 reaction contained 2 μl of PCR2 product, 1X Phusion HF Buffer, 250 μM dNTPs, 2 μM each of primers P7-Index-ISP (Meyer and Kircher, 2010) and P5-ORF.BC1.rev (5′ AATGATACGGCGACCACCGACTAGTTCCGCTTACACAGCT 3′), and 4 units of Phusion Polymerase. PCR3 products were gel-purified using QiaQuick Gel Extraction columns (QIAGEN). Samples were sequenced on an Illumina HiSeq 2500 with the primer heyME19.
CRISPR HMEC Screen
Genomic DNA was isolated by phenol:chloroform extraction (Thermo cat# 15593-049 and Sigma cat# C2432) and gRNAs were PCR amplified using Q5 high-fidelity polymerase (NEB cat# M0491) with barcoded primers for sequencing on an Illumina NextSeq 500.
HMEC Sublibrary Screen
Genomic DNA was isolated from HMEC Sublibrary screen pellets using the GeneJET Genomic DNA Purification Kit (ThermoFisher Cat. # K0722), according to manufacturer’s instructions. PCRs were performed using a total mass of 2.6 ug (across four 100 uL reactions). PCRs were performed with conditions and primers described above, for Genome Scale Screens. PCR3 products were gel-purified using QiaQuick Gel Extraction columns (QIAGEN). Samples were sequenced on an Illumina HiSeq 2500 with the primer heyME19.
MFC7 screen cell pellets and tumors
Tumors were resuspended in Lysis Buffer (10 mM Tris pH 8.0, 10 mM EDTA, 0.5% SDS, 0.75 mg/mL Proteinase K) with a homogenizer, then incubated at 55°C overnight. Cell pellets were resuspended in Lysis Buffer without homogenization, and were also incubated at 55°C overnight. gDNA extraction was performed as described above, for Genome Scale Screens. PCRs were performed using a total mass of 18 ug (across three 100 uL reactions) for cell pellets and 24 ug (across four 100 uL reactions) for tumors (to compensate for inclusion of stromal tissue). PCRs were performed with conditions and primers described above, for Genome Scale Screens. PCR3 products were gel-purified using QiaQuick Gel Extraction columns (QIAGEN). Samples were sequenced on an Illumina HiSeq 2500 with the primer heyME19.
Test for the impact of media conditions on screen results
To test the impact of media conditions on the screen results, we performed the sublibrary screen (see above: ‘Generation of ORF Sublibrary’) in different cell lines including the MCF7 breast cancer cells, which grow in media more similar to HPNE media than HMEC media. Clustering analysis confirmed that ORFs expressed in MCF7 cells behaved more similarly to HMECs than HPNEs, with which they share similar medium (Figure S2G), suggesting that the cell type specificity in the GO genes identified in the genome-scale screens captures differences related to intrinsic properties of the different cell types.
Western Blots
Cells were lysed in 1 × NuPAGE LDS sample buffer supplemented with 1 × Bond-Breaker TCEP (Life Technologies) on ice. Whole-cell lysates were briefly sonicated and boiled for 8 min at 95°C. Samples were loaded onto Tris-glycine 4%–20% or 4%–12% gradient gels (Life Technologies). Western blotting was performed with the following primary antibodies: GFP(Clontech), c-Myc (Cell Signaling Technology), p53 (Cell Signaling Technology), p21 (Calbiochem), GAPDH (Santa Cruz Biotechnology), Vinculin (Sigma-Aldrich), E2F1 (Cell Signaling #3742). Alexa Fluor-conjugated secondary antibodies (Life Technologies) were used and signal was detected with a LI-COR Odyssey Fc Imager and analyzed using ImageStudio.
Multi-color Competition Assay
Multi-color competition assays (MCA) were performed as described (Smogorzewska et al., 2007). GFP-expressing HMECs were seeded in equal numbers with HMECs expressing the ORF of interest, or empty vector (EV). The actual percentage of non-colored cells was determined 24 hr after plating by flow cytometry. Cells were then passaged for 6 PDs, and analyzed again by flow cytometry. The change in non-colored cells over time was computed, and normalized to the performance of EV-expressing cells. Assays were performed in triplicate and data are represented as mean normalized percent non-colored cells ± SD.
RNA-Seq
Stable cells expressing selected ORFs and TP53KO cells were plated at equal density and induced with dox for 96 hr (100 ng/mL). Cells were lysed and RNA extracted using the QIAGEN RNeasy kit per manufacturer’s instructions. Poly-A tailed mRNAs were enriched using the NEBNext Poly(A) mRNA Magnetic Isolation Module per manufacturer’s instructions. Poly-A tailed mRNAs were then prepped into RNA-seq libraries using NEBNext Ultra RNA Library Prep Kit for Illumina. RNA-Seq libraries were amplified and indexed using NEBNext Multiplex Oligos for Illumina per manufacturer’s instructions. Libraries were sequenced on an Illumina HiSeq 2500.
E2F1 shRNAs and related experiments
For the experiments shown in Figures 4H–4J, HMEC-rtTA 1-9 clone cells were transduced with the indicated ORF (inducible vectors) or empty vector. When indicated, cells were also infected with the indicated shRNA cloned into the pGIPZ vector. For the proliferation experiment, 100,000 cells were seeded in each well in six well plates, treated with doxycycline (100 ng/mL) for six days and counted every two days. The average proliferation rate (number of population doublings per day) was determined for each condition. For western blotting, cell lysate was prepared after doxycycline treatment for at least 2 days. The following shRNAs were utilized: ctr: shRNA targeting the neutral control gene (not expressed in HMEC and not scoring in the HMEC screen) OR11L1(ACCACCTGTTGCCT GAAATCAAT); E2F1 sh-1 (GGAGTTCATCAGCCTTTCCCCA), E2F1-sh2(TAAGAGCAAACAAGGCCCGATC), E2F1 sh3 (GTGGACTC TTCGGAGAACTTT) and E2F1-sh4 (ATGAGACCTCACTGAATCTGAC).
QUANTIFICATION AND STATISTICAL ANALYSIS
Sequence Alignment
Illumina HiSeq reads were aligned with Bowtie 2 (Langmead and Salzberg, 2012; Langmead et al., 2009). Alignments were performed in end-to-end mode for Library 1 (30-mer BCs) and for the ORF Sublibrary (24-mer BCs), and were performed in local mode for Library 2 (mix of 30-mer and 24-mer BCs).
Screen Data Analysis
Genome Scale Screen Data Analysis
Initial Analysis.
Counts for different BCs reporting for the same ORF clone were summed, to generate a single count value for each ORF Clone. Changes in ORF abundance were computed using the Bioconductor edgeR package (Dai et al., 2014; Robinson et al., 2010), with start (PD0) and end (PD10) samples compared in a paired fashion within each replicate. EdgeR was used to determine the Log2FC, p value, and FDR for each ORF. For the plot in Figure 2A, we downloaded the “Reactome G1 Phase” gene set from the Molecular Signature Database (38 members, http://software.broadinstitute.org/gsea/msigdb/cards/REACTOME_G1_PHASE.html, DOI: 10.3180/REACT_1590.1) (Fabregat et al., 2018; Milacic et al., 2012). Log2FC from each screen for the 21 genes from this set represented in our screens list were plotted in a pairwise manner. We performed clustering of Log2FC values for all genes in Library 1 using complete linkage and (1-correlation coefficient) as a distance metric. p values were assigned using the pvclust R package (Suzuki and Shimodaira, 2006).
HMEC Screen Data Analysis.
As the HMEC screen contained both a PD0 cell population and a PD10 no dox population, we ran edgeR twice, using each of these as the reference for the PD10 + dox cells. Overall, results were highly similar regardless of the choice of reference sample (Figures S2C and S2D). However, we observed slightly superior enrichment of a positive control gene set (known and predicted targets of recurrent focal amplicons in cancer) (Zack et al., 2013) among the GO genes derived from the PD10 no dox cells version of the analysis than among the GO genes derived by using the PD0 samples as the reference (Library 1 − PD0 norm = 158% enriched, p = 0.009; PD10 no dox norm = 473% enriched, p = 0.002. Library 2 − PD0 norm = 132% enriched, p = 0.042; PD10 no dox norm = 203% enriched, p = 0.013. p values from one-tailed Fisher’s exact test, GO genes defined as genes that enrich with p < 0.01). For analyses shown in Figures 2A and 2B, directly assessing the screen performance and similarity across cell lines, we used the PD0-normalized HMEC screen data, for consistency. However, all remaining analyses used the PD10 no dox sample for normalization.
HPNE and IMR90 Screen Data Analysis.
The HPNE and IMR90 screens were each analyzed with edgeR using PD0 samples as a reference. Paired analysis was performed for each replicate, comparing the end samples to the references. In the HPNE Library 2 screen, one replicate became contaminated before the start of the screen. To compensate for this, one of the remaining two replicates was split at the time of initial dox induction, and these two samples were maintained independently throughout the remainder of the screen. These two samples were then each paired with the same initial reference sample during analysis.
CRISPR Screen Data Analysis.
Sequencing reads were aligned to the initial library and counts were obtained for each gRNA. MAGeCK(Li et al., 2014) was used to calculate p values, FDRs (or adjusted p values), and log2 fold changes for comparison between the final PD11 and initial PD0 samples.
Combined p Values (pE and pD).
The combined p values were determined to obtain a unified score from the results of the Library 1 and Library 2 screens. Library 1 and Library 2 screens were analyzed individually using edgeR as described above, obtaining a Log2FC and corresponding p value for each gene. A combined p value (from the Library 1 and 2 screen p values) was calculated using the Fisher’s method (Fisher, 1948). For each gene two combined p values were calculated, one for enrichment (pE) and one for dropout (pD), starting from the one-tailed p values calculated for each gene for enrichment or dropout respectively. In case a gene was absent from one Library, a p value of 0.5 was considered for that Library to calculate the combined p value. A minimum p value threshold of e-200 was considered. False discover rate (FDR or adjusted p value) was determined using the Holm method. Though multiple isoforms were present in the libraries for some genes, we retained only one record per gene for further analysis. We used the signed negative log of the edgeR p value (signedNegLogP) to determine which isoform was kept—the highest signedNegLogP was retained in the data used to calculate the combined p value for enrichment (pE) while the lowest (most negative) signedNegLogP was retained in the data used to calculate p value for dropout (pD).
Comparison of ORF and CRISPR Gene Sets.
The common universe of genes with screening results from both the HMEC ORF screen and the HMEC CRISPR screen was used for analysis. HMEC GO genes (pE < 0.01) and HMEC STOP genes (pD < 0.01) were used for comparison. CRISPR GO and STOP genes were defined as genes with Mageck adjusted p value < 0.3 for enrichment (STOP genes) or for depletion (GO genes). Comparisons were also performed using an adjusted p value of 0.2 as a cutoff (see Table S2F). Significance was tested by one-tailed Fisher’s exact test.
Venn Diagrams.
Gene lists with a single entry for each unique HUGO gene symbol were generated for each screen by retaining the ORF with the lowest p value for each gene in cases where multiple ORFs corresponded to the same gene. Data from each cell line were then compiled, and incomplete observations were excluded.
Comparison of Genes in both Libraries.
To further assess the reproducibility and sensitivity of the two screens, we compared the performance of genes with ORFs present in both libraries and found that their behavior was positively correlated in both HMECs and HPNEs (Figure S2E). In generating these plots (Figure S2E), only one ORF per gene was considered from each library. The ORF selected was the one with the largest absolute value Log2FC in each screen. HUGO gene symbol was used to determine whether the same gene was present in both libraries, thus in some cases, it is possible that the ORFs from each library may represent different isoforms. Additionally, the presence of differing sequence variants or truncations between the ORFs in each library could result in divergent behavior.
GSEA.
GSEA of genome scale screen data was performed using GSEA PreRanked weighted mode (Mootha et al., 2003; Subramanian et al., 2005). Log2FC values for each screen were computed into Z scores, and the average Z score of all ORFs corresponding to a given gene (across Library 1 and Library 2 for HMEC and HPNE) was calculated, and used to generate the GSEA rank ordered list. GSEA was run considering all the canonical pathways gene sets (c2.cp.V5.1.symbols) and using the default settings for HMEC and HPNE; the same settings were used for the IMR90 data, except the minimum gene set size was reduced to 10 (from default = 15), to compensate for the smaller size of this dataset. To generate the heatmap, the five gene sets with the highest and lowest normalized enrichment scores (NES) were selected from each screen. Redundant gene sets were excluded (including, in some cases, gene sets that were non-redundant in name but contained similar genes) and additional gene sets added so that each screen had a total of ten gene sets represented. The gene set “REACTOME_YAP1_AND_WWTR1_TAZ_STIMULATED_GENE_EXPRESSION” was abbreviated as “REACTOME_HIPPO_STIMULATED_GENE_EXP” in Figure 2D, because YAP1, WWTR1 and TAZ are Hippo pathway effectors. NES scores were used to plot the heatmap, and clustering was performed using Manhattan distance and complete linkage.
Comparison to Pancancer Known Cancer Drivers.
For plots depicted in Figure 2E, HMEC and HPNE GO and STOP genes (derived from combined screen data; GO = genes with pE < 0.01, STOP = genes with pD < 0.01) were examined for enrichment of known pancancer OGs and TSGs. These lists were derived from the Cancer Gene Census (Futreal et al., 2004) and were used as training sets in the design of the TUSON algorithm for identification of drivers based on patterns of cancer somatic mutations (Davoli et al., 2013). Significance was determined using a one-tailed Fisher’s exact test, considering all genes for which screen data was available as the gene universe. We assessed the robustness of these effects by varying our cutoffs for consideration as a GO or STOP gene in each screen and found that these effects persisted when considering GO/STOP genes that scored with FDR < 0.3, or when using a cutoff of the top/bottom 1000 genes (Table S2K). We continued to use pE/pD < 0.01 as the definition of GO/STOP genes throughout this study so that we could include more genes than the more stringent FDR cutoff.
For the plot in Figure 2F, we derived a list of tissue-specific OGs and TSGs for breast and pancreatic cancer according to the analysis of point mutations in tumors (TUSON Explorer) and Cancer Gene Census (Table S2H). For the TSGs and OGs derived from point mutations, we applied the TUSON algorithm (Davoli et al., 2013) to somatic point mutations from whole exome sequencing from 988 breast and 184 pancreatic adenocarcinomas (data from 2016_01_28, Table S2H). We considered the genes with a p value < 0.01 for TSGs and with a p value < 0.05 for OGs. In addition we also considered genes considered TSGs or OGs in breast and/or pancreatic cancer (based on deletion or amplification/overexpression, respectively) according the Cancer Gene Census (Table S2H) (Futreal et al., 2004; Santarius et al., 2010). In addition in Figure 2F, MAPK1 and RAC1 are also presented as genes important for RAS/MAPK pathway and for pancreatic cancer.
MCF7/HMEC in vitro and in vivo Screen data analysis
MCF7/HMEC in vitro screen.
Raw counts for each BC reporting for the same ORF clone were summed, to generate a single count value for each ORF Clone. Changes in ORF abundance were computed using the Bioconductor edgeR package (Dai et al., 2014; Robinson et al., 2010), with start (PD0) and end (PD10) samples compared in a paired fashion within each replicate. Genes with MCF7 proliferation FDR < 0.2 were classified as GO genes if they became enriched and STOP genes if they became depleted. Remaining genes were classified as Neutral.
MCF7 in vivo screen.
Tumors were excised (after 30 days from injection) and analyzed by NextGen sequencing. Counts for different BCs reporting for the same ORF clone were summed, to generate a single count value for each ORF Clone. Tumor samples were considered as paired to the initial (PD0) sample from the same replicate, and counts were analyzed by edgeR to quantify changes in ORF abundance. In total, 5 tumors each from replicate A and B, and 6 tumors from replicate C were included in the analysis, each compared to the corresponding replicate PD0 cell pellet.
Analysis of Tumor Growth.
For the tumor growth curves, tumor volumes from the two flanks of each mouse were summed. The mean and standard deviation of the summed tumor volumes of all dox mice (n = 9) and all no dox mice (n = 3) were computed, and plotted (Figure 6E). A one-tailed Student’s t test was performed to compare the final tumor volumes of dox and no dox mice. ANOVA showed that there was no significant difference between the dox mice in each of the three independent replicates (p = 0.899).
Analysis of Gene Sets in Tumors.
Gene sets used in this analysis were defined as follows (lists can be found in Table S6F): Top GO Genes – genes found within the top 100 (ranked by pE) GO genes of the Genome-scale screens (Library 1 or 2) in HMEC and at least one other cell type (HPNE or IMR90). Top STOP Genes – genes found within the top 100 (ranked by pD) STOP genes of the Genome – scale screens (Library 1 or 2) in HMEC and at least one other cell type (HPNE or IMR90). Pan-Cancer Amp/Del – genes found within GISTIC2.0 pan-cancer SCNAs, filtered for expressed genes (see below: SCNA Overlap Analysis). BRCA Amp/Del – genes found within GISTIC2.0 BRCA SCNAs, filtered for gene expression. KRTAP – all the KRTAP genes included in the sublibrary. MCF7 Neutrals – all genes defined as Neutral in the in vitro proliferation MCF7 screen (see above). Screen – all data from in vivo screen. Gene sets were each compared to MCF7 Neutrals and to the entire screen; p values were determined by one-tailed Wilcoxon Rank-Sum test.
Integrated analysis of tissue-specific expression in cancer and functional enrichment
Generation of differential functional enrichment score
We calculated a differential enrichment score for each gene between its enrichment in the HMEC screens and its enrichment in the HPNE screens as follows. For each geneg, the delta enrichment score (ΔE) is derived from its NegLogPvalue for enrichment (E) in the HMEC and HPNE screen as follows (Z represents Z score transformation):
Generation of differential expression score between breast and pancreatic cancer
We also calculated a differential expression level between breast cancer samples and pancreatic cancer samples as follows, using the TCGA RNaseq data. To this aim we utilized the Limma package (Ritchie et al., 2015) and applied the standard limma pipeline to RNaseq data after voom transformation (Law et al., 2014). For each gene g, the delta expression level (ΔL) is derived from its T statistics (T) resulting from the Limma analysis:
GSEA
GSEA analysis using the GSEA PreRanked weighted mode (Mootha et al., 2003; Subramanian et al., 2005) using pathways from REACTOME, BIOCARTA and KEGG databases was then applied to both the differential enrichment score and differential expression level distributions, considering all the available gene signatures from these databases. The correlation among the GSEA NES (normalized enrichment score) between the differential functional enrichment score (screens) and differential expression level (tumors) distributions presented in Figure 3D was determined considering the pathways with an FDR < 0.1 and absolute value of the enrichment score ES > 0.75. A similar result is found by considering different threshold (FDR <0.1; ES > 0.6; Figure S3C). See also Tables S3A–S3D.
Integrated analysis of tumor type-specific expression of cell-type-specific GO genes
For Figures 3A and 3B and Figures S3A and S3B we derived a list of HMEC and HPNE specific GO and STOP genes and plotted their differential expression score in tumors (BRCA versus PAAD). For the cell type specific GO genes, we considered the GO genes showing an enrichment of more than 3 fold in one cell line and a decrease of at least 0.3 fold in the other cell line. For the STOP genes, we considered the STOP genes showing a depletion of at least 4 fold in one cell line and an increase of at least 0.4 fold in the other cell line. The genes were further filtered to exclude those that showed presence of truncation in the libraries as compared to RefSeq sequence. Significance of the enrichment in the expression in either one of the tumor type was determined by bootstrapping, by deriving a random set of 50 genes (1000 times) and comparing the median of the differential expression score among these genes to the one from the HMEC-specific or HPNE-specific GO genes.
General essential genes based on CRISPR screens
We utilized a recently published dataset of CRISPR screens in six different cancer cell lines (Hart et al., 2015) as well as a screen performed in our lab (in HMEC described above) to derive a set of genes that are essential in all cell lines. To define general essential genes, we considered the genes that are essential (dropout ranking position lower than 1000) in at least 5 (of the 7) cell lines. The dropout ranking position was defined using the essentiality score described in Hart et al. or the log2FC (dropout) for the screen performed in our lab.
KRTAP Data Analysis
KRTAP sequence analysis
Only KRTAPs that are members of a few gene subfamilies scored as GO genes in our screen, while the others did not show any proliferation phenotype in the screen. To substantiate these negative screen results, we confirmed the ORF sequences of selected clones from non-scoring KRTAP subfamilies, and found that the library contains full-length, wild-type ORFs for all sequences examined.
KRTAP Log2FC Plots
For plots in Figures 4B and 4C, KRTAP and OR average (mean) Log2FC values were derived from combined p value data. In cases where more than one clone for a given gene is present in one library, the average Log2FC value for enrichment and dropout will differ. In these cases, we used the average Log2FC value associated with the lower p value (pE or pD). The p value provided in the text for the difference between the distributions of KRTAPs and ORs (Figure 4B) was derived by Wilcoxon Rank Sum test.
Analysis of KRTAP gene expression in cancer/normal samples
We utilized RNaseq data from TCGA. We considered the RSEM (RNA-seq by Expectation-Maximization) value for each gene in tumor and normal samples; the distribution of this expression value in tumor and normal samples is shown in Figures 4 and S4. A two sample t test was used to compare the distribution in the expression level between tumor and normal samples. We considered all of the GO gene KRTAP subfamilies as a group (KRTAP genes scoring as GO genes in the HMEC screens), and compared their expression to that of the non-proliferative KRTAP subfamilies (KRTAP genes not scoring as GO genes in the HMEC screens), which we refer to as Neutral KRTAPs. Subfamilies for which at least three members were present in our libraries and all included genes failed to achieve a pE of < 0.05 were included in the Neutral KRTAP set. The GO gene KRTAP subfamilies are the following: KRTAP2, 4, 5, 9, 10. The neutral KRTAP subfamilies are the following: KRTAP3, 6, 13, 19. We also assessed the expression of the HGT KRTAPs, none of which scored as GO genes in our screen, corresponding to the following subfamilies: KRTAP6, 7, 8, 19, 20, 21. Breast cancer tumors were classified as follows: ER/PR positive and HER2-negative (luminal A); HER2-positive and ER/PR negative; triple negative and triple positive (ER/PR positive and HER2 positive, luminal B) breast cancers.
RNA Seq Analysis
RNaseq read files were aligned to the human genome (hg38/GRCh38) using HISAT2 with default parameters and the —dta option for downstream transcript assembly (Kim et al., 2015). Aligned reads were annotated using a matched build of all known gene transcripts and spliceforms. Sorted bam files from this alignment were then assessed for transcript frequency using the featureCounts application of the Subread suite, defining features at the exon-level (Liao et al., 2014).
We filtered raw counts to remove transcripts that had less than 20 reads across all samples. Counts were then normalized with Limma’s voom function and differential expression was determined with Limma’s general linear model. The accession number for the RNA-seq data reported in this paper is GEO: GSE109326.
For Figure 4F, principal component analysis was performed on normalized read distributions from RNA-seq of each sample (HMECs expressing indicated ORF or TP53KO rtTA HMECs). For the heatmap in Figure 4G, GSEA analysis was performed on each sample utilizing ‘C2 curated pathways’. Clustering (Euclidean distance and complete linkage) was performed utilizing the NES values of the top 20 pathways most depleted or enriched pathways in each sample.
SCNA Overlap Analysis
Determination of GO and STOP Gene Sets
For data in Figure 5, GO and STOP genes considered were all genes that had a combined pE < 0.01 (GO) or combined pD < 0.01 (STOP) in the HMEC or HPNE screens. Results for these comparisons are in Tables S5A–S5E.
Determination of SCNA Peaks Included in Analysis
The genes found within recurrent focal SCNA peaks in cancer were derived from available GISTIC2 analyses on TCGA tumor datasets (analyses 2016_01_28; from https://confluence.broadinstitute.org/display/GDAC/Home). For the pan-cancer SCNAs, we utilized previously published data (Zack et al., 2013). In some cases, GISTIC2 identifies peaks containing large numbers of genes, many of which may be passengers, and may dampen enrichments that would be otherwise detectable. Thus, we opted to filter out large peaks in certain cases. For the pan-cancer analyses, we considered the complete published set of predicted amplified peaks. However, among the predicted deleted peaks, peaks containing 100 or more genes comprised more than 50% of the total set of deleted genes. We thus chose to exclude these, and retained only peaks containing fewer than 100 genes (Table S5). As tissue-specific analyses are generally based on smaller numbers of samples making it more difficult to define peak boundaries, we excluded peaks with 100 or more genes from all of these datasets prior to comparison with our screens (Table S5). In two cases (PAAD and UCEC), this filtering resulting in the elimination of more than 75% of the predicted genes from each the amplicon and deletion predictions. Thus, in these cases, we relaxed the filter and considered all genes in peaks containing fewer than 250 genes (Table S5). For all the analyses except the pan-cancer ones, we considered the genes in SCNAs that are specific to each of the six tumor types analyzed. To do so, from the list of genes in SCNAs of a given tumor type, we excluded the genes found in at least 5 out of 6 tumor types.
Determination of Gene Universe
The gene universe for comparisons was restricted to only hg19-annotated genes for which data were available in the HMEC screens or the HPNE screens (the gene universe for each cell-line was determined independently). For the data in Figures 5A–5D, the gene universe was then further restricted to include only genes that are among the top 70% most expressed genes in the cancer type being considered, according to the mean expression of each gene in cancer cell lines (CCLE) derived from the cancer type of interest (Tables S5C–S5D) (Barretina et al., 2012). Thus, the gene universe differs for each comparison considered. Data in Figures S5A and S5B show comparisons of HMEC and HPNE STOP and GO genes to cancer SCNAs without expression filtering. In these analyses the gene universe was restricted only to hg19 annotated genes for which data were available in the HMEC screens or the HPNE screens.
Performing SCNA Overlap Comparisons
To compare GO and STOP gene sets to regions of focal amplification or deletion, respectively, we determined the number of intersecting genes and assembled 2×2 contingency tables using the appropriate gene universe (as described above) for each comparison. Significance was determined by one-tailed Fisher’s exact test. Note that in some cases, the number of genes used in comparisons was very small, resulting in p values that failed to reach the threshold for significance. This was especially true for HPNE GO gene comparisons to STAD and COADREAD, each of which have small numbers of amplified genes (Figure 5D).
In order to test whether the enrichment of GO or STOP genes was significantly different between HMEC and HPNE, we performed bootstrapping analysis. Specifically, we performed random sampling (10,000 times) on the list of genes deleted or amplified (SCNAs) and determined in each case the difference in the percentage enrichment of HMEC versus HPNE. Based on the resulting distribution, we determined the Z-score (and p value) associated with the observed result assuming that the null hypothesis is true, i.e., that there is no difference in the enrichment between HMEC and HPNE.
Multi-Cancer SCNA Overlaps in Figure 7
For the enrichments and p values shown in Figure 7, HMEC GO genes were compared to all genes found within a pan-cancer or BRCA (GISTIC2 or ISAR) peak and HPNE GO genes were compared to all genes found within a pan-cancer or PAAD peak. The top 1000 genes (ranked by pE) from each screen were used as the GO gene set in this comparison. Genes represented in the ORF libraries that are also among the top 70% of genes expressed in pan-cancer (based on CCLE, see above) were considered as the gene universe for these comparisons
SCNA Clustering Analysis
Information on copy number data per tumor sample and list of recurrent focal SCNA peaks (deletions and amplifications) in the different tumor types were derived from available GISTIC2 analyses on TCGA tumor datasets (analyses 2016_01_28; from https://confluence.broadinstitute.org/display/GDAC/Home). Between Deletions and Amplifications, 95 SCNA focal peaks were considered (Table S5E). For each tumor type and each SCNA focal peak, we calculated the frequencies of samples having deletions and amplifications using the thresholds −0.2 and 0.2 respectively for the log copy ratios in each tumor sample. Within each tumor type (j), for each SCNA peak region (i), we calculated a score (Wi) based on the difference between its frequency of amplification (FA) and its frequency of deletion (FD):
After determining a score for each SCNA parameter in each type of tumor, unsupervised hierarchical clustering using complete linkage was performed, utilizing a distance metric based on correlation (Pearson correlation, dissimilarity score = 1-cor(x,y)).
Comparison of GO and STOP genes to Cancer Drivers
For the comparison of amplified GO genes to known cancer drivers in the discussion, the following datasets were used to compile the list of known and likely oncogenic drivers: TUSON top 250 OGs (Davoli et al., 2013), 54 Mut-Driver oncogenes and 10 amplified driver oncogenes listed in (Vogelstein et al., 2013), and all genes annotated as dominantly acting in the Cancer Gene Census (Futreal et al., 2004). We additionally included tissue-specific known drivers: BRCA and PAAD specific OGs predicted by TUSON for BRCA or PAAD with p < 0.1 were included. The combined set of all of these known and likely oncogenic drivers contains 598 unique genes (See Table S7B).
A similar list was compiled of known and high confidence predicted tumor suppressor drivers: TUSON top 300 TSGs, 71 Mut-Driver TSGs and 3 homozygously deleted TSGs from Vogelstein et al. (2013), and all genes annotated as recessively acting in the Cancer Gene Census. Tissue-specific TSGs predicted by TUSON (p < 0.1) for breast and pancreatic cancers were also included. The combined set of all of these known and likely TSGs contains 473 genes (See Table S7B).
Comparison of GO genes with cancer cell line RNAi datasets
For Fig, 5F, we utilized two recently published RNAi datasets on a panel of cancer cell lines (McDonald et al., 2017; Tsherniak et al., 2017), and specifically to the breast cancer cell lines (since this analysis involves HMEC GO genes). For both datasets, we have utilized the essentiality score based on the metrics utilized in each study: RSA-based metrics for McDonald et al. (2017) and ATARIS-based metrics for Tsherniak et al. (2017). For each of the datasets, we have then defined essential genes (depleted) the genes showing an essentiality score that is lower than 2.5 median absolute deviations from the median. The ‘general essential’ genes derived as described above (see ‘General essential genes based on CRISPR screens’) were filtered out from the analysis as they represent genes that are predicted to be essential in any cell type, both normal and tumor. As the GO gene set for the Fisher exact test, we used the HMEC GO genes defined as the top 1000 genes (based on p value ranking). We then performed the Fisher exact test considering different classes of genes: 1. HMEC GO genes; 2. HMEC GO genes within focal amplifications (GISTIC2 amplifications); 3. HMEC GO genes within focal amplifications (GISTIC2 amplifications) after filtering out low expressed genes (genes with expression leve lower than 30th percentile based on breast cancer cell lines from CCLE); 4. Genes in breast focal amplifications; 5. Genes in focal breast cancer amplifications not scoring as GO genes in the HMEC screen. See also Table S5F.
GO gene expression and proliferation signature in cancer cell lines and primary tumors
For Figures S3D and S3E, we considered the gene expression data from breast and pancreatic cell lines (CCLE) or breast and pancreatic adenocarcinomas (TCGA). We considered cancer cell lines or tumor samples from breast or pancreatic cancer and, as a proxy of their proliferation index, we considered their cell cycle (or proliferation) score, i.e., the average expression of a set of cell cycle markers, as previously described (Davoli et al., 2017). Based on this proliferation score, we grouped the cancer cell lines or tumor samples in those with low (lower than 30th percentile) or high proliferation score (higher than 70th percentile). Then for each group of cell lines or tumors we derived the average expression level of the HMEC or HPNE GO genes (top 1000 genes) within breast or pancreatic cancer cell lines or tumor samples. p values are derived from Wilcoxon test. See also Tables S3E and S3F.
Charm and Chrom scores and correlation with arm and chromosome frequency of deletion and amplification
We utilized the TUSON algorithm (Davoli et al., 2013) to predict mutated TSGs and OGs based on somatic point mutations from whole exome sequencing from 988 breast and 184 pancreatic adenocarcinomas (data from 2016_01_28, Table S2h). For the GO genes, we utilized the HMEC or HPNE GO genes enriching in the screens with a p value equal or lower than 0.01 and with a fold change (end to start) equal or higher than 2 (log2FC equal or higher than 1). The number of GO genes is 139 or 140 for HMEC and HPNE respectively. For the frequency of chromosome- and arm-level deletion and amplification, we applied GISTIC2 (default settings, (Mermel et al., 2011) to the available SNP array data from the 1080 breast and 184 pancreatic adenocarcinomas (TCGA, same data as for mutations). To distinguish arm and chromosome events, among the arm-level SCNA events, all cases where both arms of a chromosome had the same copy number change (in value and sign) were considered as chromosome SCNA events, while all the others were considered as arm SCNA events. In the Figure panels (Figures 6 and S6) the aneuploidy data is presented through the Deletion-Amplification frequency (the frequency of amplification and the frequency of deletion for each chromosome or arm are inversely correlated) that represents the difference between the frequency of deletions and the frequency of amplification for each arm or chromosome. Individual correlations for deletion and amplification frequency are in Table S6.
The Charm and Chrom scores were calculated in a way similar to the one described in Davoli et al. (2013). For each chromosome arm, the Chrom or Charm score represents the density of the cancer drivers (TSGs, OGs, GO genes) contained on each arm. More specifically, given our list of predicted TSGs (TSG), OGs (OG) and GO genes (GO) and all genes (All) in each chromosome arm, we determined the Charm scores for that arm as follows:
where N is the number of genes for the indicated gene category.
In order to combine the cumulative effects of TSGs and OGs, the CharmTSG and CharmOG were taken with opposite signs as their effects on tumorigenesis go in opposite directions. Thus the combined CharmTSG–OG was calculated as follows:
We note that for both BRCA and PAAD, the number of predicted TSGs is much higher than the number of predicted OGs (which is only 3-5 genes, Table S2h), thus this score is largely dependent on the CharmTSG score.
The CharmTSG–OG–GO was calculated by including in the CharmGO score as follows:
where the ratio between NTSG and NGO serves to normalize the total number of GO genes to the total number of TSGs.
Since the GO genes (from experimental screens) are derived in a different way from the mutated TSGs and OGs (from analysis of somatic point mutations), we set out to determine the a factor that represent that ‘weight’ of GO genes compared to TSG. To do this, we considered the combination of 30% of the BRCA and 30% of the PAAD samples as a training set. More specifically, to determine α, we determined the CharmTSG–OG–GO score considering the combined set of cancer drivers (TSGs, OGs) from BRCA and PAAD and GO genes from HMEC and HPNE. We then considered the Del-Amp frequency across the training set (defined above) and determined a to maximize the r-coefficient for the correlation with the CharmTSG–OG–GO score. The resulting a factor is 0.75, suggesting that the ‘weight’ of each GO gene is slightly lower than the potency of each TSG.
Finally, the correlations between the Charm scores discussed in the paper were determined based on the rest of the BRCA and PAAD datasets, i.e., the test set. We determined the Charm scores based on the BRCA TSGs/OGs and the HMEC GO genes or the PAAD TSGs/OGs and the HPNE GO genes, respectively. We then determined the correlation (Pearson) between the Charm scores and the frequencies of deletion, amplification, and deletion-amplification, which we report. When indicated, we performed control analyses where we utilize the HPNE GO genes with the BRCA TSG/OG and the HMEC GO genes with the PAAD TSG/OG. A similar analysis was performed for whole chromosomes (Chrom scores), where the same α factor was utilized.
DATA AND SOFTWARE AVAILABILITY
The accession number for the RNA-seq data reported in this paper is GEO: GSE109326. Other raw data related to the genetic screens and tumor data analysis will be available at http://elledgelab.med.harvard.edu/.
ADDITIONAL RESOURCES
Detailed information regarding screen optimization and protocol for lentiviral packaging and Benzonase treatment: http://www.g3journal.org/content/6/9/2781.full
Supplementary Material
KEY RESOURCES TABLE
| REAGENT or RESOURCE | SOURCE | IDENTIFIER |
|---|---|---|
| Antibodies | ||
| Living Colors A.v. Monoclonal GFP Antibody (JL-8) | Clontech Laboratories | Cat # 632381; RRID:AB_2313808 |
| c-Myc (D84C12) Rabbit mAb | Cell Signaling Technology | Cat # 5605S; RRID:AB_1903938 |
| GAPDH rabbit polyclonal Antibody (FL-335) | Santa Cruz Biotecnology | Cat # sc-25778; RRID:AB_10167668 |
| Mouse monoclonal anti-vinculin Antibody | Sigma-Aldrich | Cat # V9131; RRID:AB_477629 |
| anti-p53 ser15 rabbit antibody #9284 | Cell Signaling Technology | Cat # 9284s |
| anti-p21 antibody | Calbiochem/EMD | Cat # OP64 |
| E2F1 antibody | Cell Signaling Technology | Cat # #3742 |
| Chemicals, Peptides, and Recombinant Proteins | ||
| Clontech Labs Doxycycline (5g) | Fisher Scientific | Cat # NC0424034 |
| Critical Commercial Assays | ||
| GeneJET Genomic DNA Purification Kit | Thermo Fisher Scientific | Cat # K0722 |
| NEBNext Ultra RNA Library Prep Kit for Illumina | NEB | E7530S |
| RNeasy Plus Mini Kit | QIAGEN | 74134 |
| NEBNext Multiplex Oligos for Illumina (Index Primers Set 1) | NEB | E7335S |
| NEBNext Poly(A) mRNA Magnetic Isolation Module | NEB | E7490S |
| Deposited Data | ||
| Human cancer gene expression data | TCGA | https://tcga-data.nci.nih.gov/docs/publications/tcga |
| CCLE cancer gene expression data | Cancer Cell Line Encyclopedia | Barretina et al., 2012 |
| SCNA data | TCGA | https://tcga-data.nci.nih.gov/docs/publications/tcga? |
| RNA-seq | This paper | GSE109326 |
| Experimental Models: Cell Lines | ||
| rtTA-HMEC clone 1-9 | This paper | N/A |
| rtTA-HPNE clone 5-12 | This paper | N/A |
| rtTA-IMR90 cells | This paper | N/A |
| rtTA-MCF7 cells | This paper | N/A |
| rtTA-HMEC 1-9 p53−/− | This paper | N/A |
| hTERT-HMECs | Solimini et al., 2012 | N/A |
| hTERT-IMR90s | This paper | N/A |
| hTERT-HPNEs | Campbell lab | N/A |
| MCF7s | Polyak lab | N/A |
| Experimental Models: Organisms/Strains | ||
| NSG (NOD.Cg-Prkdcscid Il2rgtm1Wjl/SzJ) | The Jackson Laboratory | Cat # 005557; RRID:IMSR_JAX:005557 |
| Recombinant DNA | ||
| Human genome-scale ORF Libraries 1 and 2 | This paper | N/A |
| HMEC ORF sublibrary | This paper | N/A |
| pInducer-rtTA-Neo | This paper | N/A |
| pHAGE-TRE-ORF-BC-3′ | This paper | N/A |
| pInducer20-EGFP | This paper | N/A |
| pX330-U6-Chimeric_BB-CBh-hSpCas9 | Cong et al., 2013; Addgene | Plasmid #42230 |
| lentiCRISPR V2 puro vector | Addgene | Plasmid #52961 |
| psPax2 | Addgene | Plasmid #12260 |
| pMD2.G | This paper | Plasmid #12259 |
| E2F1sh-1 GGAGTTCATCAGCCTTTCCCCA | This paper | N/A |
| E2F1sh-2 TAAGAGCAAACAAGGCCCGATC | This paper | N/A |
| E2F1sh-3 GTGGACTCTTCGGAGAACTTT | This paper | N/A |
| E2F1sh-4 ATGAGACCTCACTGAATCTGAC | This paper | N/A |
| OR11L1 -sh (control sh, ctr-sh) ACCACCTGTTGCCTGAAATCAAT | This DaDer | N/A |
| Sequence-Based Reagents | ||
| PCR Primer ORF.BC1.For: CCAGTAGGTCCACTATGAGT | This paper | N/A |
| PCR Primer ORF.BC1.Rev: CTAGTTCCGCTTACACAGCT | This paper | N/A |
| PCR Primer ISP-ORF.BC1 .For: GTGACTGGAGTTCAGACGTGTGCTCTTCCGATCTCCAGTAGGTCCACTATGAGT | This paper | N/A |
| PCR Primer P5-ORF.BC1.Rev: AATGATACGGC GACCACCGACTAGTT CCGCTTACACAGCT | This paper | N/A |
| PCR Primer P7-Index-ISP: CAAGCAGAAGACGGCATACGAGATxxxxxxxGTGACTGGAGTT CAGACGTGT | Meyer and Kircher, 2010 | N/A |
| Sequencing Primer heyME19: GCGACCACCGACTAGTTCCGCTTACACAGCT | This paper | N/A |
| TP53 sgRNA: GTTGCAAACCAGACCTCAGG | This paper | N/A |
| Software and Algorithms | ||
| edgeR | Robinson et al., 2010 | http://www.bioconductor.org/packages/release/bioc/html/edgeR.html; RRID:SCR_012802 |
| GSEA | Mootha et al., 2003; Subramanian et al., 2005 | http://software.broadinstitute.org/gsea/index.jsp; RRID:SCR_003199 |
| Bowtie 2 | Langmead et al., 2009; Langmead and Salzberg 2012 | http://bowtie-bio.sourceforge.net/bowtie2/index.shtml |
| limma | Ritchie et al., 2015 | https://bioconductor.org/packages/release/bioc/html/limma.html |
| Mageck | Li etal., 2014 | https://sourceforge.net/projects/mageck/ |
| GISTIC2 | Mermel et al., 2011 | http://archive.broadinstitute.org/cancer/cga/gistic |
Highlights.
Barcoded genome-scale ORF expression libraries allow gain-of-function screens
Regulators of proliferation exhibit a striking degree of tissue-specificity
Proliferation driver genes help predict focal SCNAs and cancer aneuploidy patterns
Approximately 250 candidate cancer drivers identified in recurring SCNAs
ACKNOWLEDGMENTS
We thank K. Polyak, P. Campbell, M. Vidal, K. Mengwasser, and R. Patel for reagents. T.D. was supported by 1K99CA212621-01. R.J.B. was supported by an Alex’s Lemonade Stand Foundation-Center of Excellence. T.D.M. is supported by a Damon Runyon fellowship. This work was supported by NIH grants to S.J.E. and K.-K.W., and a DOD Breast Cancer Research Program and Ludwig grant to S.J.E. T.F.W. was supported by CPRIT (RP120583), the NIH/NCI (1R01CA178039-01 and NCI-P30CA125123), the DOD Breast Cancer Research Program (BC120604), and Adrienne Helis Melvin Medical Research Foundation. S.J.E. is an investigator with the Howard Hughes Medical Institute.
Footnotes
SUPPLEMENTAL INFORMATION
Supplemental Information includes seven figures and seven tables and can be found with this article online at https://doi.org/10.1016/j.cell.2018.02.037.
DECLARATION OF INTERESTS
The authors declare no competing interests.
SUPPORTING CITATIONS
The following reference appears in the Supplemental Information: Santarius et al., 2010.
REFERENCES
- Asselin-Labat M-L, Sutherland KD, Barker H, Thomas R, Shackleton M, Forrest NC, Hartley L, Robb L, Grosveld FG, van der Wees J, et al. (2007). Gata-3 is an essential regulator of mammary-gland morphogenesis and luminal-cell differentiation. Nat. Cell Biol 9, 201–209. [DOI] [PubMed] [Google Scholar]
- Bailey P, Chang DK, Nones K, Johns AL, Patch A-M, Gingras M-C, Miller DK, Christ AN, Bruxner TJC, Quinn MC, et al. ; Australian Pancreatic Cancer Genome Initiative (2016). Genomic analyses identify molecular subtypes of pancreatic cancer. Nature 531, 47–52. [DOI] [PubMed] [Google Scholar]
- Barretina J, Caponigro G, Stransky N, Venkatesan K, Margolin AA, Kim S, Wilson CJ, Lehar J, Kryukov GV, Sonkin D, et al. (2012). The Cancer Cell Line Encyclopedia enables predictive modelling of anticancer drug sensitivity. Nature 483, 603–607. [DOI] [PMC free article] [PubMed] [Google Scholar]
- Beroukhim R, Mermel CH, Porter D, Wei G, Raychaudhuri S, Donovan J, Barretina J, Boehm JS, Dobson J, Urashima M, et al. (2010). The land-scape of somatic copy-number alteration across human cancers. Nature 463, 899–905. [DOI] [PMC free article] [PubMed] [Google Scholar]
- Cong L, Ran FA, Cox D, Lin S, Barretto R, Habib N, Hsu PD, Wu X, Jiang W, Marraffini LA, and Zhang F (2013). Multiplex genome engineering using CRISPR/Cas9 systems. Science 339, 819–823. [DOI] [PMC free article] [PubMed] [Google Scholar]
- Dai Z, Sheridan JM, Gearing LJ, Moore DL, Su S, Wormald S, Wilcox S, O’Connor L, Dickins RA, Blewitt ME, and Ritchie ME (2014). edgeR: a versatile tool for the analysis of shRNA-seq and CRISPR-Cas9 genetic screens. F1000Res. 3, 95. [DOI] [PMC free article] [PubMed] [Google Scholar]
- Davoli T, Xu AW, Mengwasser KE, Sack LM, Yoon JC, Park PJ, and Elledge SJ (2013). Cumulative haploinsufficiency and triplosensitivity drive aneuploidy patterns and shape the cancer genome. Cell 155, 948–962. [DOI] [PMC free article] [PubMed] [Google Scholar]
- Davoli T, Uno H, Wooten EC, and Elledge SJ (2017). Tumor aneuploidy correlates with markers of immune evasion and with reduced response to immunotherapy. Science 355, eaaf8399. [DOI] [PMC free article] [PubMed] [Google Scholar]
- Eser S, Schnieke A, Schneider G, and Saur D (2014). Oncogenic KRAS signalling in pancreatic cancer. Br. J. Cancer 111, 817–822. [DOI] [PMC free article] [PubMed] [Google Scholar]
- Fabregat A, Jupe S, Matthews L, Sidiropoulos K, Gillespie M, Garapati P, Haw R, Jassal B, Korninger F, May B, et al. (2018). The Reactome Pathway Knowledgebase. Nucleic Acids Res. 46 (D1), D649–D655. [DOI] [PMC free article] [PubMed] [Google Scholar]
- Fisher RA (1948). Questions and answers #14. Am. Stat 2, 30–31. [Google Scholar]
- Futreal PA, Coin L, Marshall M, Down T, Hubbard T, Wooster R, Rahman N, and Stratton MR (2004). A census of human cancer genes. Nat. Rev. Cancer 4, 177–183. [DOI] [PMC free article] [PubMed] [Google Scholar]
- Hart T, Chandrashekhar M, Aregger M, Steinhart Z, Brown KR, MacLeod G, Mis M, Zimmermann M, Fradet-Turcotte A, Sun S, et al. (2015). High-Resolution CRISPR Screens Reveal Fitness Genes and Genotype-Specific Cancer Liabilities. Cell 163, 1515–1526. [DOI] [PubMed] [Google Scholar]
- Ho H, Soto Hopkin A, Kapadia R, Vasudeva P, Schilling J, and Ganesan AK (2013). RhoJ modulates melanoma invasion by altering actin cytoskeletal dynamics. Pigment Cell Melanoma Res. 26, 218–225. [DOI] [PMC free article] [PubMed] [Google Scholar]
- Kim D, Langmead B, and Salzberg SL (2015). HISAT: a fast spliced aligner with low memory requirements. Nat. Methods 12, 357–360. [DOI] [PMC free article] [PubMed] [Google Scholar]
- Kim C, Yang H, Park I, Chon HJ, Kim JH, Kwon WS, Lee WS, Kim TS, and Rha SY (2016). Rho GTPase RhoJ is associated with gastric cancer progression and metastasis. J. Cancer 7, 1550–1556. [DOI] [PMC free article] [PubMed] [Google Scholar]
- Langmead B, and Salzberg SL (2012). Fast gapped-read alignment with Bowtie 2. Nat. Methods 9, 357–359. [DOI] [PMC free article] [PubMed] [Google Scholar]
- Langmead B, Trapnell C, Pop M, and Salzberg SL (2009). Ultrafast and memory-efficient alignment of short DNA sequences to the human genome. Genome Biol. 10, R25. [DOI] [PMC free article] [PubMed] [Google Scholar]
- Law CW, Chen Y, Shi W, and Smyth GK (2014). voom: Precision weights unlock linear model analysis tools for RNA-seq read counts. Genome Biol. 15, R29. [DOI] [PMC free article] [PubMed] [Google Scholar]
- Lawrence MS, Stojanov P, Mermel CH, Robinson JT, Garraway LA, Golub TR, Meyerson M, Gabriel SB, Lander ES, and Getz G (2014). Discovery and saturation analysis of cancer genes across 21 tumour types. Nature 505, 495–501. [DOI] [PMC free article] [PubMed] [Google Scholar]
- Li W, Xu H, Xiao T, Cong L, Love MI, Zhang F, Irizarry RA, Liu JS, Brown M, and Liu XS (2014). MAGeCK enables robust identification of essential genes from genome-scale CRISPR/Cas9 knockout screens. Genome Biol. 15, 554. [DOI] [PMC free article] [PubMed] [Google Scholar]
- Liao Y, Smyth GK, and Shi W (2014). featureCounts: an efficient general purpose program for assigning sequence reads to genomic features. Bioinformatics 30, 923–930. [DOI] [PubMed] [Google Scholar]
- Martin TD, Cook DR, Choi MY, Li MZ, Haigis KM, and Elledge SJ (2017). A role for mitochondrial translation in promotion of viability in K-Ras mutant cells. Cell Rep. 20, 427–438. [DOI] [PMC free article] [PubMed] [Google Scholar]
- McDonald ER 3rd, de Weck A, Schlabach MR, Billy E, Mavrakis KJ, Hoffman GR, Belur D, Castelletti D, Frias E, Gampa K, et al. (2017). Project DRIVE: a compendium of cancer dependencies and synthetic lethal relationships uncovered by large-scale, deep RNAi screening. Cell 170, 577–592. [DOI] [PubMed] [Google Scholar]
- McLendon R, Friedman A, Bigner D, Van Meir EG, Brat DJ, Mastrogianakis GM, Olson JJ, Mikkelsen T, Lehman N, Aldape K, et al. ; Cancer Genome Atlas Research Network (2008). Comprehensive genomic characterization defines human glioblastoma genes and core pathways. Nature 455, 1061–1068. [DOI] [PMC free article] [PubMed] [Google Scholar]
- Meerbrey KL, Hu G, Kessler JD, Roarty K, Li MZ, Fang JE, Herschkowitz JI, Burrows AE, Ciccia A, Sun T, et al. (2011). The pINDUCER lentiviral toolkit for inducible RNA interference in vitro and in vivo. Proc. Natl. Acad. Sci. USA 108, 3665–3670. [DOI] [PMC free article] [PubMed] [Google Scholar]
- Mermel CH, Schumacher SE, Hill B, Meyerson ML, Beroukhim R, and Getz G (2011). GISTIC2.0 facilitates sensitive and confident localization of the targets of focal somatic copy-number alteration in human cancers. Genome Biol. 12, R41. [DOI] [PMC free article] [PubMed] [Google Scholar]
- Meyer M, and Kircher M (2010). Illumina sequencing library preparation for highly multiplexed target capture and sequencing. Cold Spring Harb. Protoc 2010, pdb.prot5448. [DOI] [PubMed] [Google Scholar]
- Milacic M, Haw R, Rothfels K, Wu G, Croft D, Hermjakob H, D’Eustachio P, and Stein L (2012). Annotating cancervariants and anti-cancer therapeutics in reactome. Cancers (Basel) 4, 1180–1211. [DOI] [PMC free article] [PubMed] [Google Scholar]
- Mootha VK, Lindgren CM, Eriksson K-F, Subramanian A, Sihag S, Lehar J, Puigserver P, Carlsson E, Ridderstrale M, Laurila E, et al. (2003). PGC-1 a-responsive genes involved in oxidative phosphorylation are coordinately downregulated in human diabetes. Nat. Genet 34, 267–273. [DOI] [PubMed] [Google Scholar]
- Musgrove EA, Caldon CE, Barraclough J, Stone A, and Sutherland RL (2011). Cyclin D as a therapeutic target in cancer. Nat. Rev. Cancer 11, 558–572. [DOI] [PubMed] [Google Scholar]
- Reader J, Holt D, and Fulton A (2011). Prostaglandin E2 EP receptors as therapeutic targets in breast cancer. Cancer Metastasis Rev. 30, 449–463. [DOI] [PMC free article] [PubMed] [Google Scholar]
- Ritchie ME, Phipson B, Wu D, Hu Y, Law CW, Shi W, and Smyth GK (2015). limma powers differential expression analyses for RNA-sequencing and microarray studies. Nucleic Acids Res. 43, e47. [DOI] [PMC free article] [PubMed] [Google Scholar]
- Robinson MD, McCarthy DJ, and Smyth GK (2010). edgeR: a Bio-conductor package for differential expression analysis of digital gene expression data. Bioinformatics 26, 139–140. [DOI] [PMC free article] [PubMed] [Google Scholar]
- Sack LM, Davoli T, Xu Q, Li M, and Elledge SJ (2016). Sources of error in mammalian genetic screens. G3 (Bethesda) 6, 2781–2790. [DOI] [PMC free article] [PubMed] [Google Scholar]
- Sanchez-Garcia F, Villagrasa P, Matsui J, Kotliar D, Castro V, Akavia UD, Chen BJ, Saucedo-Cuevas L, Rodriguez Barrueco R, Llobet-Navas D, et al. (2014). Integration of genomic data enables selective discovery of breast cancer drivers. Cell 159, 1461–1475. [DOI] [PMC free article] [PubMed] [Google Scholar]
- Santarius T, Shipley J, Brewer D, Stratton MR, and Cooper CS (2010). A census of amplified and overexpressed human cancer genes. Nat. Rev. Cancer 10, 59–64. [DOI] [PubMed] [Google Scholar]
- Smogorzewska A, Matsuoka S, Vinciguerra P, McDonald ER 3rd, Hurov KE, Luo J, Ballif BA, Gygi SP, Hofmann K, D’Andrea AD, and Elledge SJ (2007). Identification of the FANCI protein, a monoubiquitinated FANCD2 paralog required for DNA repair. Cell 129, 289–301. [DOI] [PMC free article] [PubMed] [Google Scholar]
- Solimini NL, Xu Q, Mermel CH, Liang AC, Schlabach MR, Luo J, Burrows AE, Anselmo AN, Bredemeyer AL, Li MZ, et al. (2012). Recurrent hemizygous deletions in cancers may optimize proliferative potential. Science 337, 104–109. [DOI] [PMC free article] [PubMed] [Google Scholar]
- Subramanian A, Tamayo P, Mootha VK, Mukherjee S, Ebert BL, Gillette MA, Paulovich A, Pomeroy SL, Golub TR, Lander ES, and Mesirov JP (2005). Gene set enrichment analysis: a knowledge-based approach for interpreting genome-wide expression profiles. Proc. Natl. Acad. Sci. USA 102, 15545–15550. [DOI] [PMC free article] [PubMed] [Google Scholar]
- Suzuki R, and Shimodaira H (2006). Pvclust: an R package for assessing the uncertainty in hierarchical clustering. Bioinformatics 22, 1540–1542. [DOI] [PubMed] [Google Scholar]
- Tsherniak A, Vazquez F, Montgomery PG, Weir BA, Kryukov G, Cowley GS, Gill S, Harrington WF, Pantel S, Krill-Burger JM, et al. (2017). Defining a cancer dependency map. Cell 170, 564–576. [DOI] [PMC free article] [PubMed] [Google Scholar]
- Vogelstein B, Papadopoulos N, Velculescu VE, Zhou S, Diaz LA Jr., and Kinzler KW (2013). Cancer genome landscapes. Science 339, 1546–1558. [DOI] [PMC free article] [PubMed] [Google Scholar]
- Waclaw B, Bozic I, Pittman ME, Hruban RH, Vogelstein B, and Nowak MA (2015).A spatial model predicts that dispersal and cell turnover limit intra-tumour heterogeneity. Nature 525, 261–264. [DOI] [PMC free article] [PubMed] [Google Scholar]
- Wang Y, Xu Q, Sack L, Kang C, and Elledge SJ (2016). Again-of-function senescence bypass screen identifies the homeobox transcription factor DLX2 as a regulator of ATM-p53 signaling. Genes Dev. 30, 293–306. [DOI] [PMC free article] [PubMed] [Google Scholar]
- Wu D-D, Irwin DM, and Zhang Y-P (2008). Molecular evolution of the keratin associated protein gene family in mammals, role in the evolution of mammalian hair. BMC Evol. Biol 8, 241. [DOI] [PMC free article] [PubMed] [Google Scholar]
- Youssef J, and Badr M (2011). Peroxisome proliferator-activated receptors and cancer: challenges and opportunities. Br. J. Pharmacol 164, 68–82. [DOI] [PMC free article] [PubMed] [Google Scholar]
- Zack TI, Schumacher SE, Carter SL, Cherniack AD, Saksena G, Tabak B, Lawrence MS, Zhsng CZ, Wala J, Mermel CH, et al. (2013). Pan-cancer patterns of somatic copy number alteration. Nat. Genet 45, 1134–1140. [DOI] [PMC free article] [PubMed] [Google Scholar]
Associated Data
This section collects any data citations, data availability statements, or supplementary materials included in this article.
Supplementary Materials
Data Availability Statement
The accession number for the RNA-seq data reported in this paper is GEO: GSE109326. Other raw data related to the genetic screens and tumor data analysis will be available at http://elledgelab.med.harvard.edu/.