Abstract
Intrinsically disordered proteins (IDPs) exist in highly dynamic conformational ensembles, which pose a major obstacle for drug development targeting IDPs because traditional rational drug design relies on unique three-dimensional structures. Here, we analyzed the conservation (especially structural conservation) of potentially druggable cavities in 22 ensembles of IDPs. It was found that there is considerable conservation for potentially druggable cavities within each ensemble. The average common atom percentage of potentially druggable cavities is as high as 54%. The average root-mean-squared deviation of common atoms ranges between 1 and 8 Å for multichain IDPs, and a common pocket is kept after direct alignment of cavities. In addition, the conservation of potentially druggable cavities varies among different proteins. In the comparison of multi- and single-chain IDPs, some multichain IDPs have an extremely high conservation, whereas another multichain IDPs’ conservation appears worse, and the single-chain IDPs have relatively moderate conservations. This study is a new attempt to generally assess the potentially druggable cavities in IDPs for taking IDPs as druggable targets, and this work also lends support to the opinion of IDPs tending to bind to “multiconformational affinity” compounds.
1. Introduction
Intrinsically disordered proteins (IDPs) have attracted a considerable interest owing to their vital functions in physiological processes1−5 and their abundant existence in all species.6−9 Numerous IDPs are associated with human diseases such as cancer, cardiovascular disease, neurodegenerative diseases, and diabetes.10−13 Therefore, IDPs have been recognized as important targets in drug design.14−17 On the other hand, IDPs usually exist in highly dynamic conformational ensembles as “protein clouds”,17−19 and ligands may bind to IDPs in a way of “ligand clouds around protein clouds”.20 This is a major obstacle for drug design targeting IDPs because traditional rational drug design relies on the unique three-dimensional structure of proteins.21,22 As a result, the progress in drug designs for IDPs is limited,23−30 most cases were carried out by experimental screening, and only a rare example was achieved via rational design.27
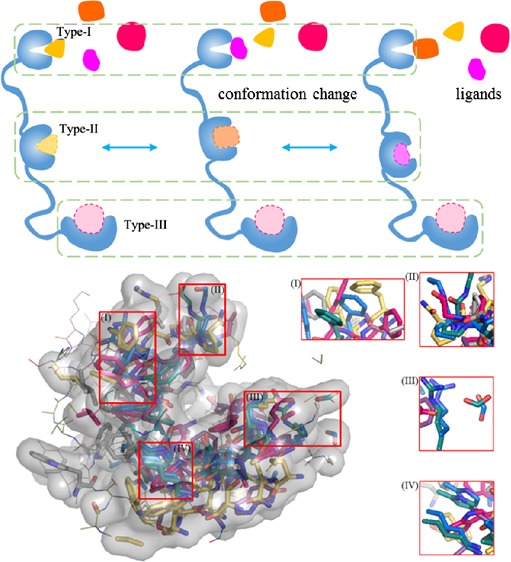
A prerequisite of small-molecule drug design is the druggability of protein targets, that is, whether they have suitable cavities for ligand binding.31,32 The druggability is usually accessed based on the size, shape, and physicochemical properties of the surface cavities. The average cavity number per 100 residues is ∼3.4 for IDPs, slightly larger than that for ordered proteins (∼2.8).33 Surprisingly, the average potentially druggable probability of cavities in IDPs was estimated to be 9%, almost twice that for ordered proteins (5%).33 However, it should be clarified that these numbers and druggability of IDPs are averages for many distinct conformations in their ensembles. In this regard, the conservation of particular cavities is critical and should be further considered. A schematic analysis is demonstrated in Figure 1. Intuitively, there are three types of cavities existing in IDPs, the cavities of type-I are structural conservatives in different conformations of a certain ensemble; their druggability is poor and cannot be used for drug design. For the cavities of type-II, although they all maintain good druggability, their constituents or conformation or both changes across the ensemble, that is, the cavity conservation is poor; therefore, they cannot be used as drug targets either. The cavities of type-III, on the other hand, have good druggability and maintain a good conservation among most conformations of the ensemble, which are ideal drug target sites to focus on. The number and location of three types of cavities are not confined similar to schematics.
Figure 1.
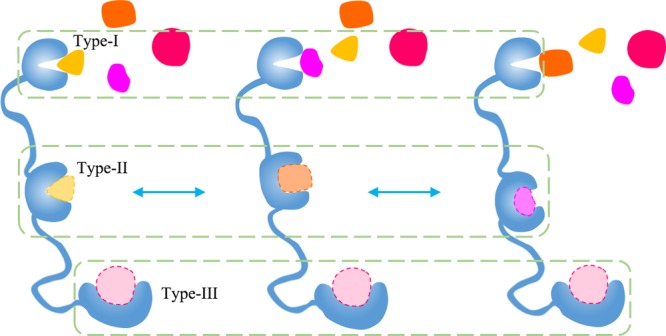
Schematic diagram illustrating the interplay between the druggability and conservation of cavities in IDPs. Type-I cavities maintain good conservation but poor druggability. Type-II cavities maintain druggability but have low structural conservation for the binding site because of conformational changes. Type-III cavities keep both good druggability and conservation, which are ideal drug targets.
In this article, we put forward methods to study the conservation of potentially druggable cavities in IDPs and their possibility of being drug targets, which may be used for finding targets before screening ligands against IDPs.
2. Results and Discussion
2.1. Data for Analysis
The analyzed dataset was constructed based on pE-DB, a database for the deposition of structural ensembles of IDPs based on nuclear magnetic resonance (NMR) spectroscopy, small-angle X-ray scattering (SAXS), and other data measured in solution.34 Ensembles in pE-DB usually contain a high number of conformations (with an equal weight in the spirit of important sampling in statistics), which is necessary for the analysis of cavity conservation. For a full analysis, the oncoprotein c-Myc is also included in our dataset, for which structure-based rational inhibitor design has been successfully performed,27 and the conformational ensemble was obtained from large-scale molecular dynamics (MD) simulations.20
All conformational ensembles are analyzed using the program CAVITY developed by Yuan et al.31 to provide information about their binding cavities, such as the number of cavities in each conformation, their druggability, and geometrical parameters. The predicted cavities are classified by CAVITY into three types according to their CavityDrugScore: druggable, undruggable, and amphibious (its druggability is not good as the potentially druggable cavities but still better than the undruggable ones). A brief introduction about CAVITY can be found in Materials and Methods. Only potentially druggable cavities are further analyzed because of their potential in drug design. It is noted that CAVITY and other existing druggability analyzing algorithms have been trained on globular proteins; therefore, their accuracy may drop for IDPs. However, in a recent successful example on c-Myc,27 Yu et al. used CAVITY to identify potential druggable cavities and used Glide (a virtual screening program originally developed for ordered proteins) to screen potential binding compounds, and finally 7 out of 273 tested compounds exhibited a good activity in further experiments. This seems to suggest that CAVITY and other existing algorithms may be used for IDPs as a helpful first step before more accurate algorithms are developed specifically.
Comparing all cavities with each other directly is not reasonable in conservation analysis because the number of cavities for one protein alone is large. In addition, some cavities are obviously in different parts of the protein and cannot be consistent, and thus a direct comparison would decrease the overall consistency. Therefore, a simple clustering to group the cavities of a protein was artificially performed. We have calculated the mean sequence position (δ) of all residues for each cavity to approximately estimate its specific position within the protein. For a protein with a wide range of δ values, cavities are artificially divided into 1–3 groups to reduce unnecessary comparison and improve accuracy. The classification results are shown in the Supporting Information. Cavity conservation is evaluated within each group.
The resulting dataset and some of their average properties are listed in Table 1. Among pE-DB, 6 ensembles (1AAB, 3AAD, 4AAD, 5AAD, 6AAD, and 9AAA) have too few potentially druggable cavities and are thus discarded in our analysis. We have divided the systems into single chain and multichain, which contain 12 and 7 ensembles, respectively. The conformation number of the multichain ensembles is much smaller than that of the single-chain ones, and their analysis results are less accurate statistically (see the Supporting Information for a brief discussion on the effect of sample size). Therefore, we only discuss the multichain systems very briefly (in Figure 9 below), whereas the emphasis is put on the single-chain ones.
Table 1. Properties of the Examined IDPs in pE-DB.
| pE-DB id | name | method | conf. number | druggable cavity number | average atom number of druggable cavity | pcommon | rmsd (Å) | |
|---|---|---|---|---|---|---|---|---|
| single chain | 1AAA | phosphorylated Sic1 | SAXS & NMR | 32 | 8 | 227.1 | 0.40 ± 0.19 | 6.59 ± 1.63 |
| 1AAD | β-synuclein | NMR | 575 | 431 | 263.1 | 0.43 ± 0.20 | 7.83 ± 3.08 | |
| 2AAA | unbound p27KID domain | MD | 130 | 6 | 204 | 0.67 ± 0.12 | 5.14 ± 0.92 | |
| 2AAD | α/β-synuclein hybrid | NMR | 576 | 511 | 281.2 | 0.38 ± 0.18 | 8.14 ± 2.73 | |
| 4AAB | Sendai nucleocapsid protein | NMR | 13 718 | 1300 | 214.8 | 0.62 ± 0.16 | 7.08 ± 1.79 | |
| 5AAA | ParE2-associated antitoxin (PaaA2) | SAXS & NMR | 50 | 20 | 272.1 | 0.61 ± 0.15 | 7.23 ± 1.78 | |
| 6AAA | p15PAF | SAXS & NMR | 4939 | 1967 | 247.8 | 0.52 ± 0.19 | 7.76 ± 2.24 | |
| 6AAC | K18 domain of Tau protein | NMR | 995 | 9 | 280.1 | 0.49 ± 0.20 | 8.71 ± 3.38 | |
| 7AAC | N-TAIL measles nucleoprotein | NMR | 995 | 46 | 295.0 | 0.62 ± 0.17 | 10.26 ± 2.90 | |
| 8AAC | protein enhancer of sevenless 2B | SAXS & NMR | 1700 | 64 | 192.8 | 0.55 ± 0.15 | 6.97 ± 1.68 | |
| 9AAC | α-synuclein | NMR | 576 | 400 | 255.4 | 0.42 ± 0.18 | 7.83 ± 2.53 | |
| n.a. | c-Myc370–409 | MD | 16 716 | 47 | 152.7 | 0.53 ± 0.17 | 5.49 ± 1.68 | |
| multichain | 2AAB | heat shock protein β-6 (HSPB6) fragment (24–160) | SAXS | 8 | 7 | 290.9 | 0.25 ± 0.16 | 8.44 ± 1.52 |
| 3AAA | CYNEX4 flexible multidomain FRET probe | SAXS | 17 | 11 | 572.5 | 0.32 ± 0.17 | 8.04 ± 4.54 | |
| 3AAB | heat shock protein β-6 (HSPB6) fragment (40–160) | SAXS | 4 | 15 | 492.4 | 0.79 ± 0.23 | 2.66 ± 2.88 | |
| 4AAA | CYNEX4 T266 mutant flexible multidomain FRET probe | SAXS | 16 | 13 | 519.9 | 0.26 ± 0.14 | 5.01 ± 4.32 | |
| 5AAC | phosphorylated Sic1 with the Cdc4 subunit of an SCF ubiquitin ligase | SAXS & NMR | 44 | 71 | 390.2 | 0.50 ± 0.19 | 3.65 ± 2.46 | |
| 7AAA | heat shock protein β-6 (HSPB6) | SAXS | 6 | 18 | 359.4 | 0.25 ± 0.16 | 6.60 ± 2.43 | |
| 8AAA | heat shock protein β-6 (HSPB6) fragment (57–160) | SAXS | 3 | 8 | 675 | 0.58 ± 0.16 | 1.75 ± 0.62 |
Figure 9.
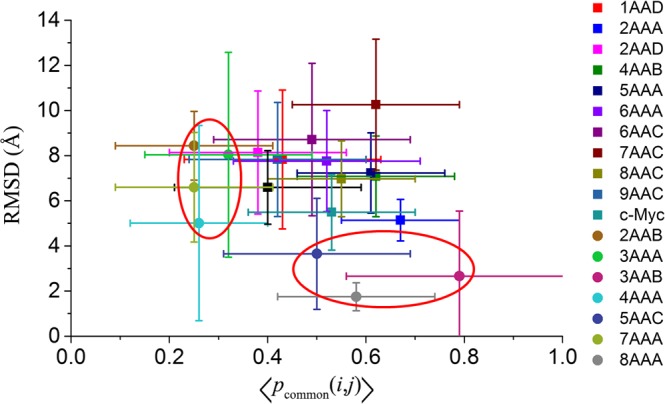
Average common atom percentage and rmsd of single-chain systems (squares) and multichain systems (circles). Better conservation for chains is found when the corresponding data points are located in the bottom-right corner.
2.2. Surface Area, Volume, and pKd (Fundamental Information of a Cavity)
CAVITY provides information about the surface area and volume of each single cavity and predicts the binding pKd with properly designed ligands.31 We have calculated the average and standard deviation of these properties of potentially druggable cavities for each ensemble and plot the results of single-chain systems in Figure 2.
Figure 2.
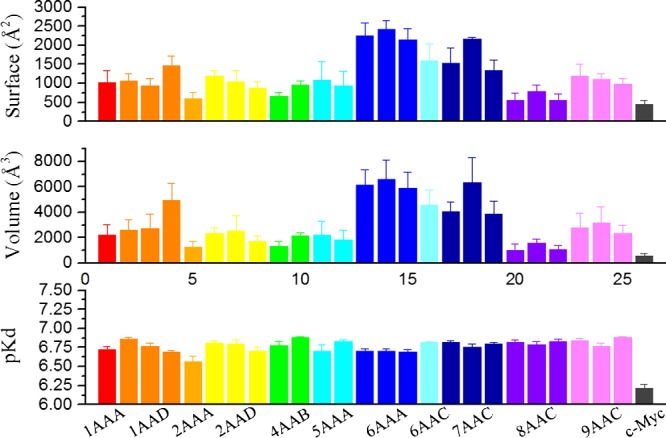
Histograms illustrate the properties (surface area, volume, and pKd) of potentially druggable cavities from different ensembles of single-chain IDPs. Cavities in each ensemble were divided into 1–3 groups as listed in Table S2.
The results of Figure 2 clearly show that the average surface area and the volume of potentially druggable cavities of a protein ensemble differ from those of another ensemble. 6AAA (p15PAF) has the largest cavity surface area and volume. The standard deviations within an ensemble are smaller, suggesting the consistency in the size of potentially druggable cavities. On the other hand, the predicted pKd (ligand-binding affinity) is high and similar, except for c-Myc, indicating these IDPs have the ligand binding sites for drug design. As shown in Figure 2, it is reliable to divide some of the ensembles into 1–3 groups because the difference of the surface area and volume between different groups is large, and if mixed together, the overall results will omit important differences.
Compared to the ordered proteins, the potentially druggable cavities of IDPs have larger surface area and volume (see the Supporting Information). From the geometric perspective, the deeper the pocket, the stronger its ability to bind small molecule is. The ratio of volume/surface approximately reflects the average depth of cavities. The calculated average volume/surface ratio of potentially druggable cavities is 2.29 Å for IDPs, almost doubles that for order proteins (1.33 Å). It reflects the structural basis underlying the excellent druggability of IDPs.
2.3. Figure Factor (Shape Parameter of a Cavity)
To quantitatively measure the cavity shape and study its structural conservation, we refer to the algorithms in geography and use the following Boyce–Clark figure factor35,36
| 1 |
to analyze the geometry of the cavity vacant (the vacant space surrounded by cavity wall) by projecting it onto a plane perpendicular to the maximum depth direction of the cavity. In eq 1, ri is the radial length from the centroid of the planar graph to the boundary, and n is the number of equally spaced radials taken. The figure factor quantitatively measures the difference between the considered shape and a standard circle. Its value ranges from 0 for a standard circle to 200 for a straight line, and it is equal to ∼8.9 for a square.36 In addition, the maximum depth of cavities provided by CAVITY is also analyzed. The results of the figure factor and maximum depth of potentially druggable cavities in single-chain IDPs are shown in Figure 3 with representative cavities. The average figure factor varies over a wide range. The lowest figure factor is found in 2AAD, whose cavity vacant is circular in shape. The largest figure factor is found in 6AAC, whose cavity vacant is highly irregular. The conservation of cavities in terms of the standard deviation in different proteins is different. Better conservation with lower standard deviation relative to the mean of the figure factor is observed in 2AAA, 4AAB, and 5AAA, whereas the conservation in 1AAA, 2AAD, and 9AAC is relatively worse. In addition, the three parts (groups) in 7AAC or 8AAC are obviously different in the average figure factor.
Figure 3.
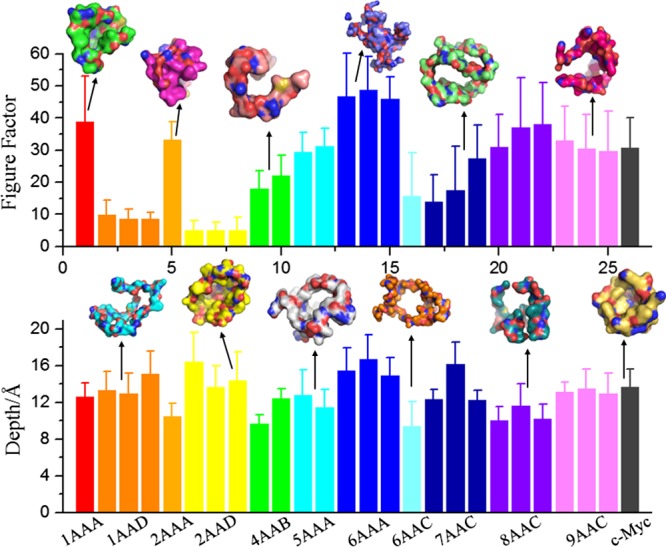
Histograms showing the average figure factor and maximum depth of potentially druggable cavities in different ensembles of single-chain IDPs. Error bars represent standard deviations. Representative cavities with figure factor and depth values similar to the average values in each ensemble are displayed as space filled models.
2.4. Common Atom Percentage (Composition Parameter of a Cavity)
To measure the composition conservation of potentially druggable cavities, we compare two cavities and calculate the percentage of common atoms as
| 2 |
where ncommon(i,j) is the number of common non-H atoms appearing in both cavity i and cavity j, and ni and nj are the non-H atom number of cavity i and j, respectively. It is noted that cavities of each conformation were divided into 1–3 groups according to the residue number range as described above, and ncommon(i,j) is computed only for i and j belonging to the same group.
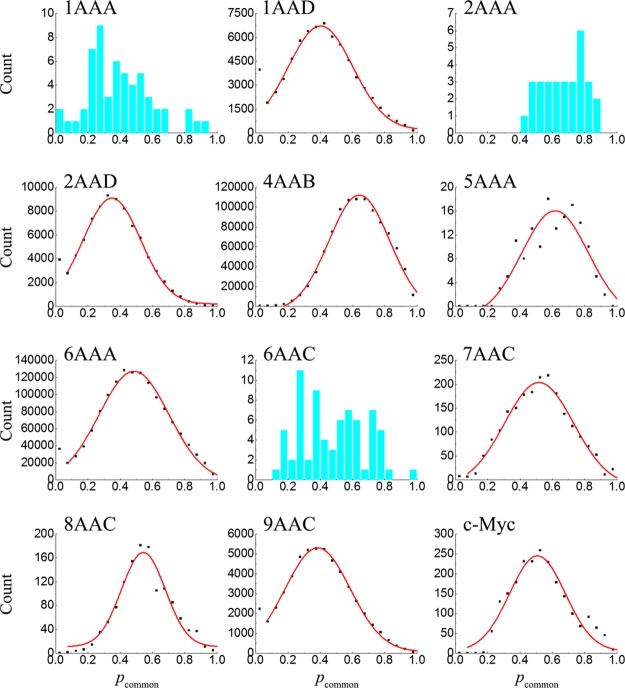
Figure 4 shows that a high proportion of potentially druggable cavities are well-conserved in composition with pcommon(i,j) larger than 50%. The most conserved systems are 2AAA, 4AAB-1, 5AAA-2, 7AAC-1, and 7AAC-3, which have an average pcommon of 0.67 ± 0.12, 0.64 ± 0.16, 0.65 ± 0.13, 0.64 ± 0.18, and 0.65 ± 0.17, respectively, indicating that the shift of potentially druggable cavities among conformations is small. The overall average of pcommon for potentially druggable cavities in single-chain IDPs is 0.518, which is close to the value determined previously for all cavities (0.52).33 The least conserved systems are 2AAD-2 (with ⟨pcommon(i,j)⟩ = 0.33 ± 0.18) and 9AAC-2 (with ⟨pcommon(i,j)⟩ = 0.35 ± 0.19).
Figure 4.
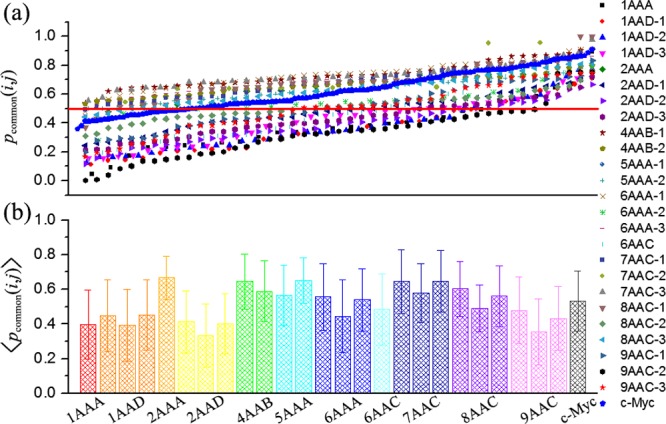
Common-atom percentage of potentially druggable cavities in different ensembles. (a) pcommon(i,j) plotted in ascending order for each ensemble. The data points are evenly spaced within each ensemble to span the full horizontal range. Some values were omitted to avoid crowding. Red lines indicate the level of 50%. (b) Average of pcommon(i,j) in different ensembles. Error bars represent the standard deviation.
The distribution of pcommon(i,j) for each ensemble is given in Figure 5. The distributions are all wide, with the tails approaching the upper limit of pcommon = 1. After removing the first data point for uncorrelated cavities with pcommon ≈ 0, 9 of all 12 ensembles can be well-described by a Gaussian distribution (solid lines in Figure 5). The remaining three ensembles have relatively small numbers of conformations and potentially druggable cavity data for fitting.
Figure 5.
Distribution of the common atom percentage of potentially druggable cavities for different conformational ensembles. Red lines are fitted to the scattering data with a Gaussian function.
2.5. Root–Mean-Squared Deviation (Parameter of a Conformation Change of a Cavity)
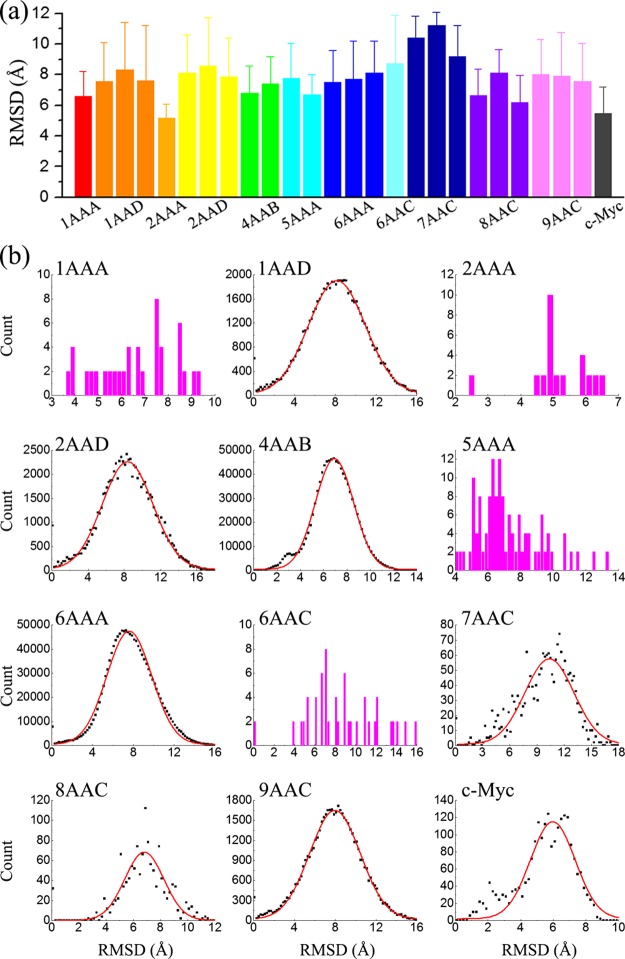
The root-mean-squared deviation (rmsd) of the atomic positions between two structures is often used to characterize the conformational differences of ordered proteins. To measure the conformation conservation of potentially druggable cavities, we calculated the rmsd based on common atoms between any two cavities in an ensemble, as explained in the Materials and Methods. The results are presented in Figure 6.
Figure 6.
(a) Average rmsd of potentially druggable cavities for different ensembles. Error bars represent standard deviations. (b) Distribution of the rmsd of potentially druggable cavities for different conformational ensembles. Red lines are fitted to the scattering data with a Gaussian function.
The average rmsd values of potentially druggable cavities in different ensembles vary from 5.14 Å for 2AAA and 5.49 Å for c-Myc to 11.21 Å for 7AAC-2 (Figure 6a). The rmsds are significantly larger than what was determined previously for all cavities (∼3.5 Å).33 The reason for the difference is because potentially druggable cavities are usually larger and contain more atoms. In general cases, the more atoms in comparison, the relatively larger rmsd value is. On the other hand, the rmsd distribution is wide (Figure 6b), with considerable cavities possessing small rmsd values.
To present the conserved conformations of potentially druggable cavities in IDPs more intuitively, we have drawn two examples of aligned cavities in Figure 7. For 2AAA, among the 130 conformations in the ensemble, there are only six potentially druggable cavities. After alignment (Figure 7a), a common pocket is clearly exposed. At the same time, magnification of a few local regions (insets in Figure 7) shows that the spatial deviation among the corresponding chemical groups is small. For c-Myc in which inhibitors have been successfully designed, although the conformations are highly diverse as revealed previously,20 the potentially druggable cavities are still in good conservation and the opening of the pocket is not disrupted, as shown in Figure 7b. Such a structural diversity for c-Myc has not prohibited the design of inhibitors against c-Myc. Therefore, potentially druggable cavities of IDPs are well-conserved in conformation. This lends support to the optimism of rational drug design for IDPs.
Figure 7.
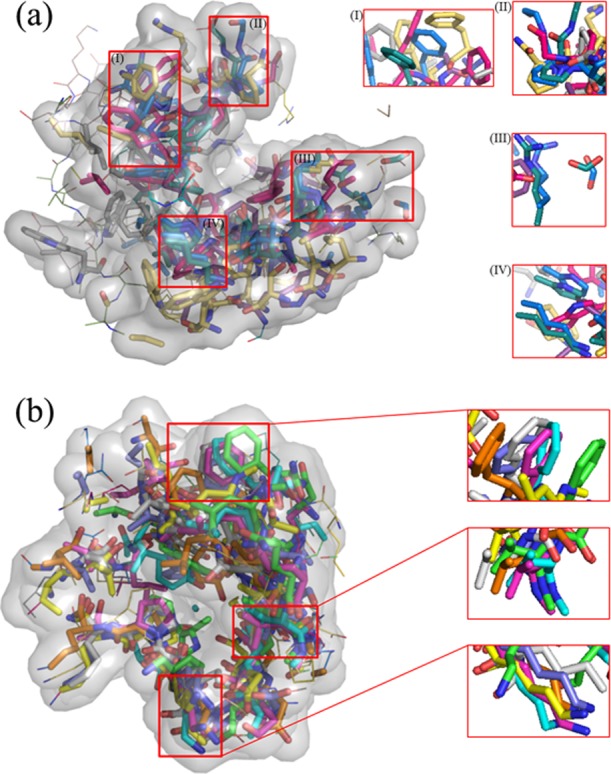
Examples of potentially druggable cavities that are aligned together to demonstrate the conformational conservation in (a) 2AAA and (b) c-Myc. In each panel, a potentially druggable cavity was chosen as the reference conformation to align other cavities based on common atoms. Common atoms are shown in sticks and surfaces, whereas other parts are shown as lines. Insets are magnified sections. Graphics is prepared using PyMOL.
In general, the ensembles of IDPs in the pE-DB database that we considered have many conformations in each entry [compared with the protein data bank (PDB) dataset], which greatly facilitates the conservation analysis. PDB also provide some useful structures of IDPs, for example, a Disprot-pdb dataset with 15 entries was constructed (listed in Table 2) by selecting proteins with more than 10 conformations and at least 50% of the solved amino acids in the PDB structure being shown disordered in DisProt.33 However, the number of conformations in Disprot-pdb is small, and only a few provide sufficient amount of potentially druggable cavities for the conservation analysis. Analysis on the few systems from Disprot-pdb is shown in Figure 8. The potentially druggable cavities in the Disprot-pdb dataset can be seen to have high common atom percentage values (>70%) and low RMSD values (<4 Å), being more conservative than those in the pE-DB dataset. The alignment of cavity conformation (Figure 8b–d) also illustrates the existence of a common pocket and the spatial coincidence of groups from different conformations.
Table 2. Properties of the Examined IDPs in Disprot-pdb.
| disport id | name | conf. number | total cavity number | druggable cavity number | disorder percent (%) | pcommon | rmsd (Å) |
|---|---|---|---|---|---|---|---|
| 1ZR9 | zinc finger protein 593 | 20 | 46 | 4 | 52 | 0.72 ± 0.10 | 3.90 ± 0.84 |
| 1ZYI | methylosome subunit pICln | 15 | 74 | 22 | 58 | 0.74 ± 0.21 | 2.08 ± 0.68 |
| 2KOG | vesicle-associated membrane | 20 | 68 | 10 | 79 | 0.35 ± 0.23 | 4.32 ± 2.11 |
| 1HN3 | cyclin-dependent kinase inhibitor 2A | 20 | 40 | 6 | 100 | 0.72 ± 0.11 | 4.07 ± 0.86 |
| 2LM0.A | protein AF9 chimera | 10 | 55 | 10 | 100 | 0.79 ± 0.06 | 4.40 ± 0.88 |
| 1IVT | lamin A/C | 15 | 59 | 0 | 58 | 0.51 ± 0.35 | 1.38 ± 0.82 |
| 1FTT | homeobox protein Nkx-2.1 | 20 | 51 | 0 | 74.2 | 0.52 ± 0.26 | 2.56 ± 1.57 |
| 1USS | histone H1 | 10 | 40 | 0 | 93 | 0.52 ± 0.26 | 2.67 ± 1.20 |
| 1ANP | atrial natriuretic factor | 11 | 6 | 0 | 100 | 0.96 ± 0.03 | 1.94 ± 0.38 |
| 1KDX.B | cyclic AMP-responsive element-binding protein 1 | 17 | 12 | 0 | 100 | 0.72 ± 0.17 | 1.83 ± 0.50 |
| 1TBA.A | transcription initiation factor TFIID subunit 1 | 25 | 68 | 0 | 100 | 0.66 ± 0.23 | 2.83 ± 1.17 |
| 1VZS | ATP synthase-coupling factor 6, mitochondrial | 34 | 140 | 2 | 100 | 0.56 ± 0.21 | 2.94 ± 1.10 |
| 1WXL | FACT complex subunit Ssrp1 | 30 | 65 | 0 | 100 | 0.54 ± 0.28 | 1.82 ± 1.16 |
| 2K7M | gap junction α-5 protein | 10 | 45 | 1 | 100 | 0.51 ± 0.27 | 3.72 ± 1.37 |
| 2LJ9 | Calvin cycle protein CP12-2, chloroplastic | 20 | 10 | 0 | 100 | 0.77 ± 0.11 | 4.45 ± 1.21 |
Figure 8.
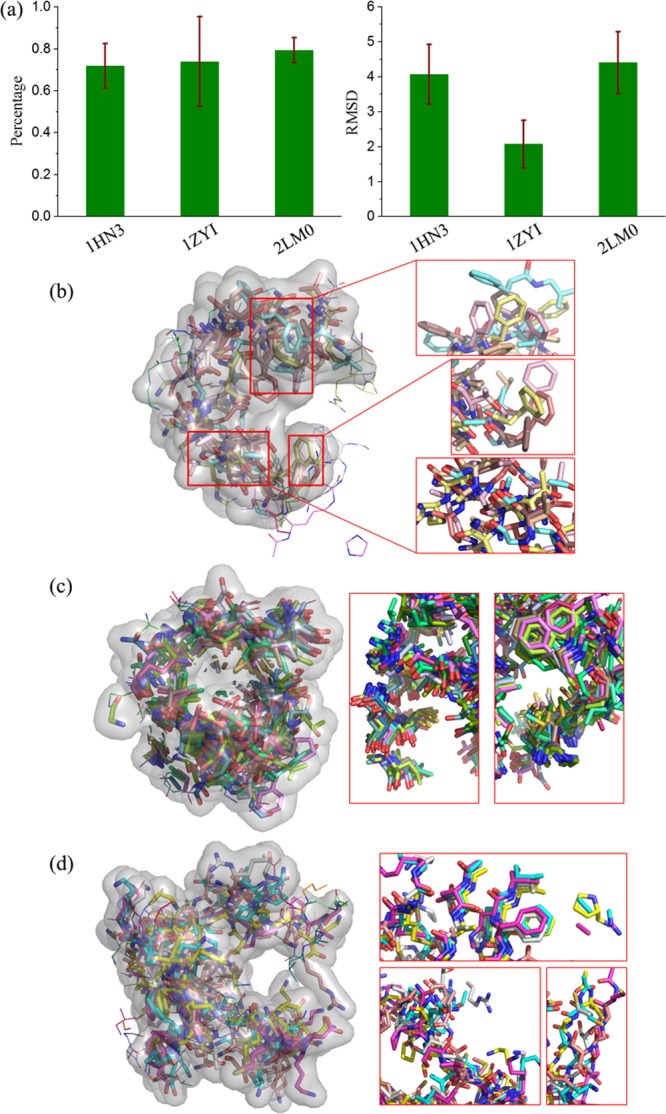
Conservation of potentially druggable cavities of a few examples from the Disprot-pdb dataset.33 (a) Average common atom percentage and rmsd for cyclin-dependent kinase inhibitor 2A (PDB ID: 1HN3), methylosome subunit pICln (PDB ID: 1ZYI), and the protein AF9 chimera (PDB ID: 2LM0). (b–d) Aligned potentially druggable cavities in 1HN3 (b), 1ZYI (c), and 2LM0 (d).
What is more, another small conformational ensemble of c-Myc370–409 (Apo and Holo states) calculated the consistence of the binding pockets in representative conformations, which have virtually screened the inhibitors with computation and been experimentally proved.27 The common atom percentage (pcommon) and rmsds are 0.58 ± 0.19 and 4.32 ± 0.23, respectively, which are almost same with the consistent results in our study.
2.6. Multichain Proteins (Oligomeric Proteins)
An oligomer is a short multimer formed by a smaller number of monomer units.37 In contrast to the above single-chain proteins, the cavity in oligomeric proteins often consists of more than two chains. In the same way as single-chain protein analysis, we also analyzed the surface area/volume, pKd, figure factor, common atom percentage, and rmsd of potentially druggable cavities in oligomeric IDPs, and the results are shown in Table 1 and the Supporting Information. In general, the conservation of potentially druggable cavities in multichain proteins is better than that in single-chains, and the average rmsd of common atoms ranges between 1 and 8 Å. That is, because the multichain protein should be more conformationally stable than single-chain protein. The difference between multichain and single chain ensembles can be determined intuitively by plotting the average common atom percentage of every ensemble and the corresponding rmsd in one graph, which is shown in Figure 9.
It can be seen from Figure 9 that the conservation of the different ensembles is quite different. For multichain ensembles, the data points of 2AAB, 3AAA, 4AAA, and 7AAA are located primarily on the left side of the plot, which is indicated by a red ellipse. On the other hand, data points of 3AAB, 5AAC, and 8AAA are located in the bottom right part of the plot. The points of single-chain IDPs, however, are more centrally located in the graph. Multichain ensembles appear to have larger range of conservation, from which some multichain IDPs have an extremely high conservation, whereas another multichain IDPs’ conservation appears worse. For 5AAC, the conservation of different parts varies considerably. The pcommon of the three parts are 0.40, 0.28, and 0.84, respectively. Further analysis and aligned images are reported in the Supporting Information.
Three are three groups of protein/peptide with more than one ensemble in pE-DB: synuclein, CYNEX4, and HSPB6. For synuclein, there are α-, β-, and α/β-hybrid-types, their pcommon (0.42 ± 0.18, 0.43 ± 0.20, 0.38 ± 0.18) and rmsd (7.83 ± 2.53, 7.83 ± 3.08, 8.14 ± 2.73) are highly consistent. For CYNEX4, after the wide type is mutated into T266D, the conservation of potentially druggable cavities slightly decreases from 0.32 ± 0.17 to 0.26 ± 0.14. For HSPB6, there are four ensembles with different fragment lengths between 104 and 160, and both pcommon and rmsd exhibit high fluctuations, which may result from the length difference or the small conformation numbers of ensembles.
2.7. Some Remarks
In general, the global druggability of IDPs is affected by three important factors: the probability of druggable cavities in the conformation ensemble; the expected pKd values of druggable cavities with ligands; and the conservation of druggable cavities, that is, the possibility of a ligand to bind to many conformations. It is noted that even if the probability of druggable cavities is low, effective inhibition to IDPs is still possible because the binding of a ligand to druggable cavities would stabilize the corresponding conformations and change the ensemble distribution. In our current study, it is difficult to quantitatively clarify the relative importance of these factors because ligands are not explicitly considered in the analysis. However, in a recent combined experimental and computational study on c-Myc, it was revealed that all six active compounds identified in experiments for c-Myc are “multiconformational affinity” compounds (i.e., compounds that bind to various groups of conformations with similar affinity) in virtual screening.27 This suggests that the last factor is essential for drug design upon IDPs. More future works are needed to understand the druggability and design strategy difference between IDPs and ordered proteins.
On the other hand, conformational ensembles are the basis of the drug design targeting IDPs. Reliable force fields are essential for accurate characterization of conformational ensembles of IDPs, as the number of degrees of conformational freedom far exceeds the number of available experimental observables. Most previous force fields were developed to target ordered proteins.38 In recent years, some force fields have also been developed to improve their accuracy in modeling IDPs.39,40 For example, a newly modified CHARMM36m was demonstrated to generate conformational ensembles in agreement with the experimental data.40 The improved force fields for IDPs are highly favorable for ensemble construction and drug design targeting IDPs.
3. Conclusions
In summary, we have systematically analyzed the conservation of potentially druggable cavities of IDPs from the pE-DB dataset. Although IDPs lack rigid structures and exist in highly dynamic conformational ensembles, there is considerable conservation for their potentially druggable cavities. For example, the predicted binding pKd has a narrow range between 5.81 and 6.99, and the average common atom percentage can reach 54%. The rmsd is in the range of 1–8 Å for multichain systems, and direct alignment shows that a common binding pocket is usually exposed. In addition, the ensembles with partial-ordered structure were compared with the IDPs, concluding that the pcommon and rmsd of potentially druggable cavities for partially ordered ensembles are similar with that for IDPs. We also calculated the conservation of binding pockets in IDP c-Myc370–409 that have been experimentally proved getting inhibitors by a virtual screen, whose pcommon and rmsd are consistent with the results we analyzed in other systems. This work leads to optimism of attempt for rational drug design, targeting the disordered region of proteins.
4. Materials and Methods
4.1. Datasets
pE-DB (http://pedb.vib.be) is an openly accessible database for the deposition of structural ensembles of IDPs based on NMR, SAXS, and other data measured in solution.34 Each ensemble in pE-DB is composed of a high number (dozens to hundreds or even more) of conformations, which provides a large number of samples to analyze the conservation of potentially druggable cavities. We analyzed all 24 entities (ensembles) of pE-DB but discarded six of them (1AAB, 3AAD, 4AAD, 5AAD, 6AAD, and 9AAA) because they had too few potentially druggable cavities to analyze any possible conservation. We also incorporated c-Myc into the dataset. C-Myc is a transcription factor that is activated upon dimer formation with its partner protein Max and is expressed constitutively in most cancer cells.25 Large-scale MD simulations have been conducted to determine the ensemble of c-Myc370–409, where the conformations are highly diverse.20 In total, the main dataset we used contains 19 entries and are listed in Table 1.
Disprot-pdb is another source of IDP structures, which was constructed by combining the information from the database of protein disorder (DisProt)41 and the protein data bank (PDB).42 The disorder percentage of proteins in DisProt ranges from 0 to 100%, and the structures solved in the PDB may belong to either ordered or disordered regions of the proteins. For analysis, our Disprot-pdb dataset is constructed by selecting proteins with more than 10 conformations and 50% of solved residues in the PDB structure-labeled disordered in DisProt (listed in Table 2). However, many entries in Disprot-pdb have too few potentially druggable cavities to enable the conservation analysis. As a result, only three systems from Disprot-pdb are briefly discussed in Figure 8.
It is noted that the available ensemble data of IDPs are usually less accurate than the structure data of ordered proteins. Generating reliable disordered ensembles is a notoriously difficult problem because of the inherent underdetermined nature of the problem. It is still impossible to accurately determine protein structural ensembles from the available experimental data, for example, NMR spectroscopy and SAXS data. As a result, the available ensembles of IDPs inevitably contain systematic bias/artifacts depending on the structural calculation algorithms, the experimental data used, and molecular models employed in structural generation. This large uncertainty may lead to misleading observations on some specific systems, such that some IDPs appear to contain more conserved cavities, whereas others do not. In this sense, the determined globally average properties would be relatively more reliable than those for specific systems because the uncertainty is reduced in averaging over all ensembles. On the other hand, in a prospective view, by exploiting the growing amount of available structural data and the increasingly accurate force fields as a priori knowledge40 and combining emerging experimental and computational approaches,43 it will progressively enable reliable quantification of structural ensembles of IDPs.44 Last, considering that drug design targeting IDPs is still in its infancy, any revealed insights on the druggability of IDPs would be useful even if they are not as accurate as those for ordered proteins.
4.2. Cavity Calculations
The druggability analysis is an important step in a drug discovery project.32,45,46 We used the program CAVITY developed by Yuan et al.31 to predict druggable cavities in the protein surface. Here, we provide a very brief introduction on CAVITY for the convenience of audiences. More details can be found from the original paper of Yuan et al.31,47
CAVITY searches the cavities through the following approach: (1) mesh the space occupied by the whole protein molecule (default length 0.5 Å, which is less than ∼2 Å resolution of crystal structure) with 3D grids; (2) identify the characteristics (i.e., occupied, nonoccupied, and boundary) of each grid points by a water molecule (radius 1.4 Å) rolling the surface of protein; (3) erase all of the nonoccupied lattices accessible using a sphere with a default radius of 10 Å; (4) a shrink-and-expansion algorithm is carried out to separate conjoint cavities and remove improper cavities, where any cavities with maximum depth greater than the “maximal joint depth” are subject to separation, and too shallow cavities are discarded.
After cavities were detected, CAVITY evaluates their druggability based on their geometrical structure and physical chemistry properties. Three kinds of probe atoms are used to identify the physical–chemical properties of grid points: sp3-N as hydrogen bonds donor, sp2-O as hydrogen bond receptor, and sp3-C as hydrophobic group. The interaction between the probe and the protein is evaluated using the SCORE algorithm by Wang et al.48 Finally, various characteristics of cavities are identified: volume, surface area, maximum depth, hydrophobic surface, edge layer area, and the areas of the hydrogen bond donor and receptor. A predicted pKd (the potential binding affinity of the cavity with properly designed ligands) and a CavityDrugScore were calculated from the characteristics whose formulas have been optimized based on some training datasets. It is noted that the induced-fit effect and the entropy effect were not considered in CAVITY, which may decrease the actual pKd of IDPs because the binding effect of a small molecule would be partially compensated by the conformational adjustment of IDPs.49 According to the obtained CavityDrugScore, detected cavities are classified by CAVITY into three categories: druggable (CavityDrugScore ≥ 600), amphibious (−180 < CavityDrugScore < 600), and undruggable (CavityDrugScore ≤ −180). In this article, only predicted druggable cavities were further analyzed.
To measure the cavity shape, we refer to the algorithms in geography and use the Boyce–Clark figure factor,35,36 as given in eq 1 by flattening the cavity vacant along the maximum depth (z) direction into a two-dimensional shape. The conservation of potentially druggable cavities was further measured by the common atom percentage and rmsd as described here. For a particular potentially druggable cavity (i) in an ensemble, we selected a cavity (j) from each conformation (J) that has the highest common atom percentage with i among all cavities of the conformation J, whereas the comparisons between other cavities and the cavity i are omitted. After calculating the common atom percentage, we extracted the coordinates of the common atoms between cavity i and each of these picked cavities j and calculate their rmsds. Conservation is higher when the average common atom percentage is large and the average rmsd is small.
Acknowledgments
This work was supported by the National Natural Science Foundation of China (grant 21633001) and the Ministry of Science and Technology of China (grant 2015CB910300). The authors thank Huaiqing Cao, Hao Ruan, and Jinxin Liu for helpful discussions.
Supporting Information Available
The Supporting Information is available free of charge on the ACS Publications website at DOI: 10.1021/acsomega.8b02092.
Discarded IDPs; classification of cavities for examined IDPs; summary of the surface area/volume, pKd, figure factor, pcommon, and rmsd of potentially druggable cavities in multi-chain IDPs; the ordered proteins dataset; and statistical analysis about sample size (PDF)
Author Contributions
B.C., M.L., and Z.L. conceived the research. B.C. and T.L. wrote the pcommon and rmsd calculation code. B.C., M.Y., and Y.Z. analyzed and rationalized the data. All authors wrote the article and critically commented to the manuscript.
The authors declare no competing financial interest.
Supplementary Material
References
- Dunker A. K.; Brown C. J.; Lawson J. D.; Iakoucheva L. M.; Obradović Z. Intrinsic Disorder and Protein Function. Biochemistry 2002, 41, 6573–6582. 10.1021/bi012159+. [DOI] [PubMed] [Google Scholar]
- Dyson H. J.; Wright P. E. Intrinsically Unstructured Proteins and Their Functions. Nat. Rev. Mol. Cell Biol. 2005, 6, 197–208. 10.1038/nrm1589. [DOI] [PubMed] [Google Scholar]
- Tompa P. Intrinsically Disordered Proteins: A 10-year Recap. Trends Biochem. Sci. 2012, 37, 509–516. 10.1016/j.tibs.2012.08.004. [DOI] [PubMed] [Google Scholar]
- Uversky V. N. A Decade and a Half of Protein Intrinsic Disorder: Biology Still Waits for Physics. Protein Sci. 2013, 22, 693–724. 10.1002/pro.2261. [DOI] [PMC free article] [PubMed] [Google Scholar]
- Xie H.; Vucetic S.; Iakoucheva L. M.; Oldfield C. J.; Dunker A. K.; Uversky V. N.; Obradovic Z. Functional Anthology of Intrinsic Disorder. 1. Biological Processes and Functions of Proteins with Long Disordered Regions. J. Proteome Res. 2007, 6, 1882–1898. 10.1021/pr060392u. [DOI] [PMC free article] [PubMed] [Google Scholar]
- Pushker R.; Mooney C.; Davey N. E.; Jacqué J.-M.; Shields D. C. Marked Variability in the Extent of Protein Disorder Within and Between Viral Families. PLoS One 2013, 8, e60724. 10.1371/journal.pone.0060724. [DOI] [PMC free article] [PubMed] [Google Scholar]
- Di Domenico T.; Walsh I.; Tosatto S. C. E. Analysis and Consensus of Currently Available Intrinsic Protein Disorder Annotation Sources in the MobiDB Database. BMC Bioinf. 2013, 14, S3. 10.1186/1471-2105-14-s7-s3. [DOI] [PMC free article] [PubMed] [Google Scholar]
- Oates M. E.; Romero P.; Ishida T.; Ghalwash M.; Mizianty M. J.; Xue B.; Dosztányi Z.; Uversky V. N.; Obradovic Z.; Kurgan L.; Dunker A. K.; Gough J. D2P2: Database of Disordered Protein Predictions. Nucleic Acids Res. 2013, 41, D508–D516. 10.1093/nar/gks1226. [DOI] [PMC free article] [PubMed] [Google Scholar]
- Xue B.; Dunker A. K.; Uversky V. N. Orderly Order in Protein Intrinsic Disorder Distribution: Disorder in 3500 Proteomes from Viruses and the Three Domains of Life. J. Biomol. Struct. Dyn. 2012, 30, 137–149. 10.1080/07391102.2012.675145. [DOI] [PubMed] [Google Scholar]
- Midic U.; Oldfield C. J.; Dunker A. K.; Obradovic Z.; Uversky V. N. Protein Disorder in the Human Diseasome: Unfoldomics of Human Genetic Diseases. BMC Genomics 2009, 10, S12. 10.1186/1471-2164-10-s1-s12. [DOI] [PMC free article] [PubMed] [Google Scholar]
- Babu M. M.; van der Lee R.; de Groot N. S.; Gsponer J. Intrinsically Disordered Proteins: Regulation and Disease. Curr. Opin. Struct. Biol. 2011, 21, 432–440. 10.1016/j.sbi.2011.03.011. [DOI] [PubMed] [Google Scholar]
- Uversky V. N.; Oldfield C. J.; Dunker A. K. Intrinsically Disordered Proteins in Human Diseases: Introducing the D2 Concept. Annu. Rev. Biophys. 2008, 37, 215–246. 10.1146/annurev.biophys.37.032807.125924. [DOI] [PubMed] [Google Scholar]
- Zhu M.; De Simone A.; Schenk D.; Toth G.; Dobson C. M.; Vendruscolo M. Identification of Small-molecule Binding Pockets in the Soluble Monomeric Form of the Aβ42 Peptide. J. Chem. Phys. 2013, 139, 035101. 10.1063/1.4811831. [DOI] [PMC free article] [PubMed] [Google Scholar]
- Uversky V. N. Intrinsically Disordered Proteins and Novel Strategies for Drug Discovery. Expert Opin. Drug Discovery 2012, 7, 475–488. 10.1517/17460441.2012.686489. [DOI] [PubMed] [Google Scholar]
- Csermely P.; Korcsmáros T.; Kiss H. J. M.; London G.; Nussinov R. Structure and Dynamics of Molecular Networks: A Novel Paradigm of Drug Discovery a Comprehensive Review. Pharmacol. Ther. 2013, 138, 333–408. 10.1016/j.pharmthera.2013.01.016. [DOI] [PMC free article] [PubMed] [Google Scholar]
- Metallo S. J. Intrinsically Disordered Proteins Are Potential Drug Targets. Curr. Opin. Chem. Biol. 2010, 14, 481–488. 10.1016/j.cbpa.2010.06.169. [DOI] [PMC free article] [PubMed] [Google Scholar]
- Dunker A. K.; Uversky V. N. Drugs for “Protein Clouds”: Targeting Intrinsically Disordered Transcription Factors. Curr. Opin. Pharmacol. 2010, 10, 782–788. 10.1016/j.coph.2010.09.005. [DOI] [PubMed] [Google Scholar]
- Uversky V. N. Dancing Protein Clouds: The Strange Biology and Chaotic Physics of Intrinsically Disordered Proteins. J. Biol. Chem. 2016, 291, 6681–6688. 10.1074/jbc.r115.685859. [DOI] [PMC free article] [PubMed] [Google Scholar]
- Wallin S. Intrinsically Disordered Proteins: Structural and Functional Dynamics. Res. Rep. Biol. 2017, 8, 7–16. 10.2147/rrb.s57282. [DOI] [Google Scholar]
- Jin F.; Yu C.; Lai L.; Liu Z. Ligand Clouds around Protein Clouds: A Scenario of Ligand Binding with Intrinsically Disordered Proteins. PLoS Comput. Biol. 2013, 9, e1003249. 10.1371/journal.pcbi.1003249. [DOI] [PMC free article] [PubMed] [Google Scholar]
- Cheng Y.; LeGall T.; Oldfield C. J.; Mueller J. P.; Van Y.-Y. J.; Romero P.; Cortese M. S.; Uversky V. N.; Dunker A. K. Rational Drug Design via Intrinsically Disordered Protein. Trends Biotechnol. 2006, 24, 435–442. 10.1016/j.tibtech.2006.07.005. [DOI] [PubMed] [Google Scholar]
- Zhang C.; Lai L. Towards Structure-based Protein Drug Design. Biochem. Soc. Trans. 2011, 39, 1382–1386. 10.1042/bst0391382. [DOI] [PubMed] [Google Scholar]
- Chene P. Inhibition of the p53-MDM2 Interaction: Targeting a Protein-protein Interface. Mol. Cancer Res. 2004, 2, 20–28. [PubMed] [Google Scholar]
- Erkizan H. V.; Kong Y.; Merchant M.; Schlottmann S.; Barber-Rotenberg J. S.; Yuan L.; Abaan O. D.; Chou T.-h.; Dakshanamurthy S.; Brown M. L.; Üren A.; Toretsky J. A. A Small Molecule Blocking Oncogenic Protein EWS-FLI1 Interaction with RNA Helicase A Inhibits Growth of Ewing’s Sarcoma. Nat. Med. 2009, 15, 750–756. 10.1038/nm.1983. [DOI] [PMC free article] [PubMed] [Google Scholar]
- Hammoudeh D. I.; Follis A. V.; Prochownik E. V.; Metallo S. J. Multiple Independent Binding Sites for Small Molecule Inhibitors on the Oncoprotein c-Myc. J. Am. Chem. Soc. 2009, 131, 7390–7401. 10.1021/ja900616b. [DOI] [PubMed] [Google Scholar]
- Srinivasan R. S.; Nesbit J. B.; Marrero L.; Erfurth F.; LaRussa V. F.; Hemenway C. S. The Synthetic Peptide PFWT Disrupts AF4-AF9 Protein Complexes and Induces Apoptosis in t(4;11) Leukemia Cells. Leukemia 2004, 18, 1364–1372. 10.1038/sj.leu.2403415. [DOI] [PubMed] [Google Scholar]
- Yu C.; Niu X.; Jin F.; Liu Z.; Jin C.; Lai L. Structure-based Inhibitor Design for the Intrinsically Disordered Protein c-Myc. Sci. Rep. 2016, 6, 22298. 10.1038/srep22298. [DOI] [PMC free article] [PubMed] [Google Scholar]
- Zhang Z.; Boskovic Z.; Hussain M. M.; Hu W.; Inouye C.; Kim H.-J.; Abole A. K.; Doud M. K.; Lewis T. A.; Koehler A. N.; Schreiber S. L.; Tjian R. Chemical Perturbation of an Intrinsically Disordered Region of TFIID Distinguishes Two Modes of Transcription Initiation. eLife 2015, 4, e07777. 10.7554/elife.07777. [DOI] [PMC free article] [PubMed] [Google Scholar]
- Cobbert J. D.; DeMott C.; Majumder S.; Smith E. A.; Reverdatto S.; Burz D. S.; McDonough K. A.; Shekhtman A. Caught in Action: Selecting Peptide Aptamers Against Intrinsically Disordered Proteins in Live Cells. Sci. Rep. 2015, 5, 9402. 10.1038/srep09402. [DOI] [PMC free article] [PubMed] [Google Scholar]
- Neira J. L.; Bintz J.; Arruebo M.; Rizzuti B.; Bonacci T.; Vega S.; Lanas A.; Velázquez-Campoy A.; Iovanna J. L.; Abián O. Identification of a Drug Targeting an Intrinsically Disordered Protein Involved in Pancreatic Adenocarcinoma. Sci. Rep. 2017, 7, 39732. 10.1038/srep39732. [DOI] [PMC free article] [PubMed] [Google Scholar]
- Yuan Y.; Pei J.; Lai L. Binding Site Detection and Druggability Prediction of Protein Targets for Structure-based Drug Design. Curr. Pharm. Des. 2013, 19, 2326–2333. 10.2174/1381612811319120019. [DOI] [PubMed] [Google Scholar]
- Halgren T. A. Identifying and Characterizing Binding Sites and Assessing Druggability. J. Chem. Inf. Model. 2009, 49, 377–389. 10.1021/ci800324m. [DOI] [PubMed] [Google Scholar]
- Zhang Y.; Cao H.; Liu Z. Binding Cavities and Druggability of Intrinsically Disordered Proteins. Protein Sci. 2015, 24, 688–705. 10.1002/pro.2641. [DOI] [PMC free article] [PubMed] [Google Scholar]
- Varadi M.; Kosol S.; Lebrun P.; Valentini E.; Blackledge M.; Dunker A. K.; Felli I. C.; Forman-Kay J. D.; Kriwacki R. W.; Pierattelli R.; Sussman J.; Svergun D. I.; Uversky V. N.; Vendruscolo M.; Wishart D.; Wright P. E.; Tompa P. pE-DB: a database of structural ensembles of intrinsically disordered and of unfolded proteins. Nucleic Acids Res. 2014, 42, D326–D335. 10.1093/nar/gkt960. [DOI] [PMC free article] [PubMed] [Google Scholar]
- Boyce R. R.; Clark W. A. V. The Concept of Shape in Geography. Geogr. Rev. 1964, 54, 561–572. 10.2307/212982. [DOI] [Google Scholar]
- Maceachren A. M. Compactness of Geographic Shape: Comparison and Evaluation of Measures. Geogr. Ann. B Hum. Geogr. 1985, 67, 53–67. 10.2307/490799. [DOI] [Google Scholar]
- Ponstingl H.; Kabir T.; Gorse D.; Thornton J. M. Morphological Aspects of Oligomeric Protein Structures. Prog. Biophys. Mol. Biol. 2005, 89, 9–35. 10.1016/j.pbiomolbio.2004.07.010. [DOI] [PubMed] [Google Scholar]
- Mackerell A. D. Jr. Empirical Force Fields for Biological Macromolecules: Overview and Issues. J. Comput. Chem. 2004, 25, 1584–1604. 10.1002/jcc.20082. [DOI] [PubMed] [Google Scholar]
- Best R. B.; Zhu X.; Shim J.; Lopes P. E. M.; Mittal J.; Feig M.; MacKerell A. D. Jr. Optimization of the Additive CHARMM All-Atom Protein Force Field Targeting Improved Sampling of the Backbone Phi, Psi and Side-chain chi(1) and chi(2) Dihedral Angles. J. Chem. Theory Comput. 2012, 8, 3257–3273. 10.1021/ct300400x. [DOI] [PMC free article] [PubMed] [Google Scholar]
- Huang J.; Rauscher S.; Nawrocki G.; Ran T.; Feig M.; de Groot B. L.; Grubmüller H.; MacKerell A. D. Jr. CHARMM36m: An Improved Force Field for Folded and Intrinsically Disordered Proteins. Nat. Methods 2017, 14, 71–73. 10.1038/nmeth.4067. [DOI] [PMC free article] [PubMed] [Google Scholar]
- Sickmeier M.; Hamilton J. A.; LeGall T.; Vacic V.; Cortese M. S.; Tantos A.; Szabo B.; Tompa P.; Chen J.; Uversky V. N.; Obradovic Z.; Dunker A. K. DisProt: The Database of Disordered Proteins. Nucleic Acids Res. 2007, 35, D786–D793. 10.1093/nar/gkl893. [DOI] [PMC free article] [PubMed] [Google Scholar]
- Berman H.; Henrick K.; Nakamura H.; Markley J. L. The Worldwide Protein Data Bank (wwPDB): Ensuring a Single, Uniform Archive of PDB Data. Nucleic Acids Res. 2007, 35, D301–D303. 10.1093/nar/gkl971. [DOI] [PMC free article] [PubMed] [Google Scholar]
- Schwalbe M.; Ozenne V.; Bibow S.; Jaremko M.; Jaremko L.; Gajda M.; Jensen M. R.; Biernat J.; Becker S.; Mandelkow E.; Zweckstetter M.; Blackledge M. Predictive Atomic Resolution Descriptions of Intrinsically Disordered hTau40 and alpha-Synuclein in Solution from NMR and Small Angle Scattering. Structure 2014, 22, 238–249. 10.1016/j.str.2013.10.020. [DOI] [PubMed] [Google Scholar]
- Sormanni P.; Piovesan D.; Heller G. T.; Bonomi M.; Kukic P.; Camilloni C.; Fuxreiter M.; Dosztanyi Z.; Pappu R. V.; Babu M. M.; Longhi S.; Tompa P.; Dunker A. K.; Uversky V. N.; Tosatto S. C. E.; Vendruscolo M. Simultaneous Quantification of Protein Order and Disorder. Nat. Chem. Biol. 2017, 13, 339–342. 10.1038/nchembio.2331. [DOI] [PubMed] [Google Scholar]
- Volkamer A.; Kuhn D.; Grombacher T.; Rippmann F.; Rarey M. Combining Global and Local Measures for Structure-Based Druggability Predictions. J. Chem. Inf. Model. 2012, 52, 360–372. 10.1021/ci200454v. [DOI] [PubMed] [Google Scholar]
- Hussein H. A.; Geneix C.; Petitjean M.; Borrel A.; Flatters D.; Camproux A.-C. Global Vision of Druggability Issues: Applications and Perspectives. Drug Discovery Today 2017, 22, 404–415. 10.1016/j.drudis.2016.11.021. [DOI] [PubMed] [Google Scholar]
- Yuan Y. X.An Integrated System for de noνo Drug Design. Ph.D. Dissertation, Peking University, 2012, pp 10–23. [Google Scholar]
- Wang R.; Liu L.; Lai L.; Tang Y. SCORE: A New Empirical Method for Estimating the Binding Affinity of a Protein-Ligand Complex. J. Mol. Model. 1998, 4, 379–394. 10.1007/s008940050096. [DOI] [Google Scholar]
- Huang Y.; Liu Z. Do Intrinsically Disordered Proteins Possess High Specificity in Protein-Protein Interactions?. Chem.—Eur. J. 2013, 19, 4462–4467. 10.1002/chem.201203100. [DOI] [PubMed] [Google Scholar]
Associated Data
This section collects any data citations, data availability statements, or supplementary materials included in this article.


