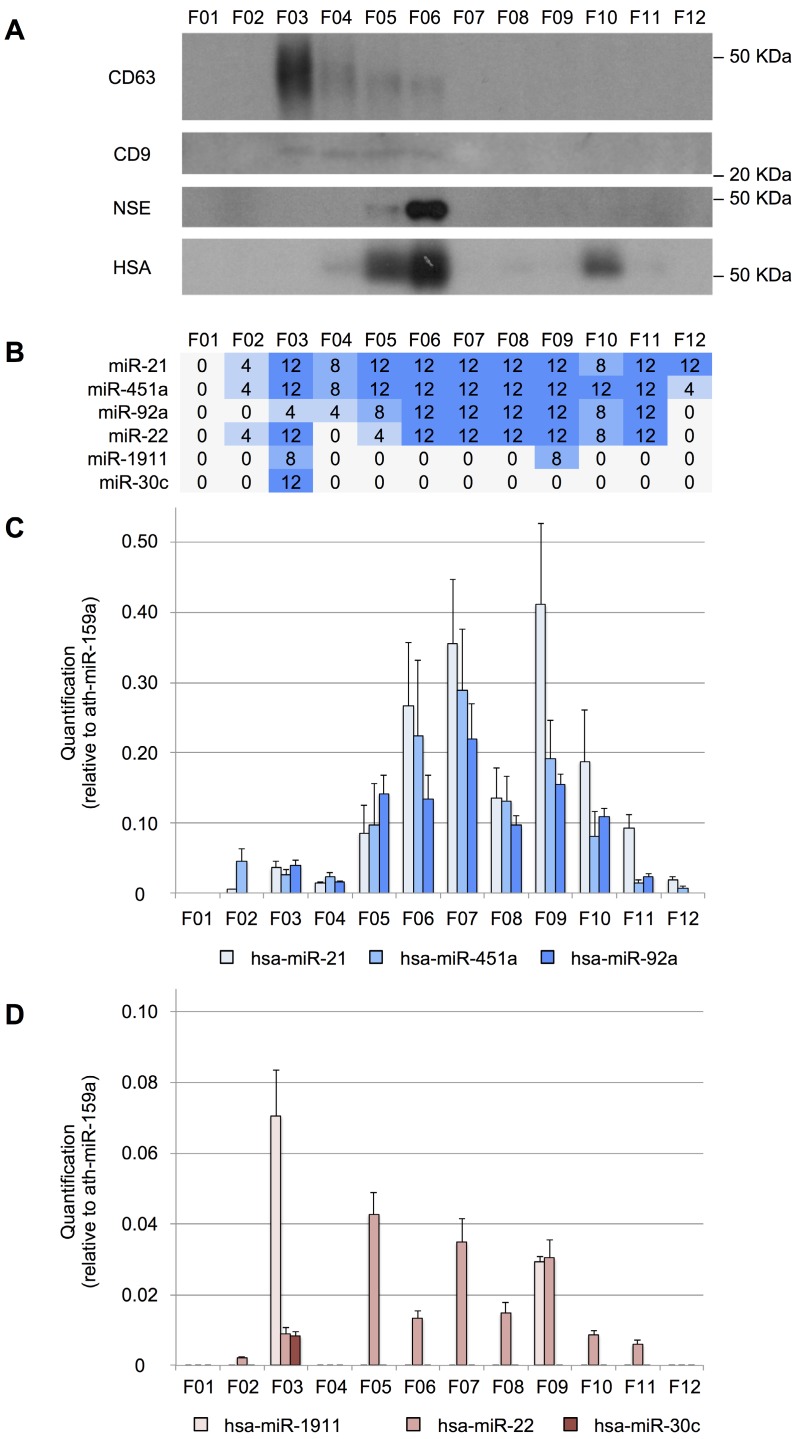
Figure 3.
Size-exclusion chromatography analysis of CSF. A, Western blot analysis of CD63, CD9, neuron-specific enolase (NSE), and human serum albumin (HSA) proteins. Molecular weights are shown in KDa. B, the number of TaqMan RT-qPCR replicates (from a total of 12) in which the studied miRNAs were detected. C, quantification (relative to ath-miR-159a) of miR-21-5p, miR-451a, and miR-92a-3p and D, of miR-1911-5p, miR-22-3p, and miR-30c-5p.

