Abstract
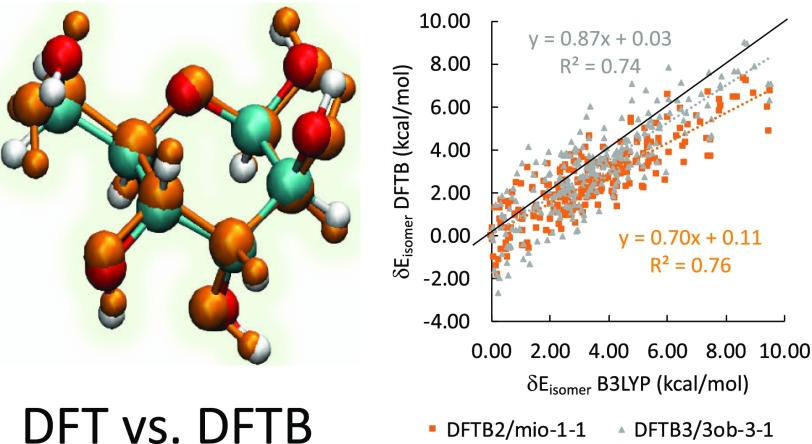
Density functional theory (DFT) is a widely used methodology for the computation of molecular and electronic structure, and we confirm that B3LYP and the high-level ab initio G3B3 method are in excellent agreement for the lowest-energy isomers of the 16 glucose epimers. Density-functional tight-binding (DFTB) is an approximate version of DFT with typically comparable accuracy that is 2 to 3 orders of magnitude faster, therefore generally very suitable for processing large numbers of complex structures. Conformational isomerism in sugars is well known to give rise to a large number of isomer structures. On the basis of a comprehensive study of glucose epimers in vacuo and aqueous solution, we found that the performance of DFTB is on par to B3LYP in terms of geometrical parameters excluding hydrogen bonds and isomer energies. However, DFTB underestimates both hydrogen bonding interactions as well as torsional barriers associated with rotations of the hydroxy groups, resulting in a counterintuitive overemphasis of hydrogen bonding in both gas phase as well as in water. Although the associated root mean squared deviation from B3LYP within epimer isomer groups is only on the order of 1 kcal/mol, this deviation affects the correct assignment of major isomer ordering, which span less than 10 kcal/mol. Both second- as well as third-order DFTB methods are exhibiting similar deviations from B3LYP. Even after the inclusion of empirical dispersion corrections in vacuum, these deviations remain for a large majority of isomer energies and geometries when compared to dispersion-corrected B3LYP.
1. Introduction
For over a century, scientists have long been intrigued by the isomeric and structural complexity in carbohydrates.1,2 With a wide range of possible molecular configurations for even the simplest of sugars, there has been enormous interest by the community in examining the highly configurable nature of saccharides as subtle changes to its configuration can result in significantly different properties. The conformational flexibility also complicates our attempts to capture and describe the equally subtle intramolecular interactions and hyperconjugation effects that are often cooperative in nature.3 Two commonly studied monomer units, the five-membered cyclic aldofuranoses and six-membered cyclic aldopyranoses, have been investigated extensively in numerous experimental and theoretical publications for their conformation, ranging from microwave, rotational, and NMR spectroscopy studies3−5 to classical molecular mechanics (MM),6−8 semiempirical methods,9−11 density functional theory (DFT),12−15 and high level ab initio studies.16 Additionally, hybrid quantum-classical quantum mechanics QM/MM approaches have also been employed to simulate enzyme kinetics in the hydrolysis of glycosidic bonds in sugars.11
A relevant series of studies conducted on the cyclic aldopyranoses between 2004 and 2007 and a more recent study in 2012 on glycan analogs have shown that DFT with the functional B3LYP17 and a 6-311++G(d,p) basis set are capable of reproducing or describing experimental results, conformations, and geometries in vacuo.18−22 Furthermore, a DFT-based molecular dynamics study of glucose and its epimers in aqueous solution, represented by the continuum COSMO solvation model,23 has reported anomeric ratios close to experimental values.24 Despite such encouraging progress, the considerable cost of DFT when computing even medium-size systems (i.e., hundreds of atoms) limits its use for the studies of large sugar systems.25 When considering potentially larger, complex carbohydrate networks such as cellulose or glycan, density-functional tight-binding (DFTB), as a conceptual approximation to DFT that is roughly 2 to 3 orders of magnitude faster than DFT, holds the promise of supplementing its more costly counterpart at larger scales.26−28 Compared to other semiempirical methods such as AM129 and PM3,30,31 DFTB has proven itself to be both reasonably accurate—being able to reproduce different sugar conformations alongside other biological systems,11,32−34 while remaining computationally efficient. Considering the extensive use semiempirical methods in the QM/MM studies of DNA and RNA sugars, it is vital for these approaches to correctly describe sugar puckering profiles.35
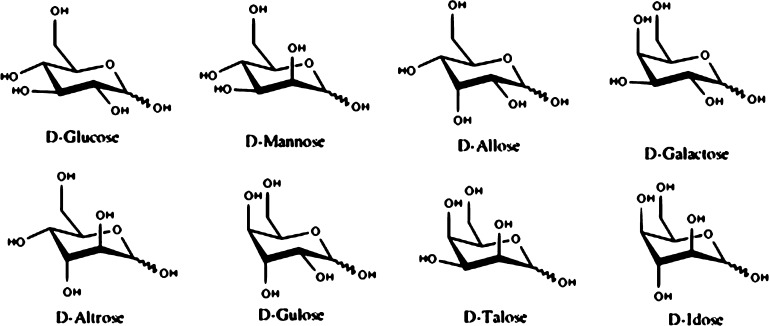
As near-linear scaled DFTB approaches such as the fragment molecular orbital DFTB method36−38 and the divide-and-conquer DFTB method39,40 aims to push the limits of purely semiempirical quantum chemistry methods by allowing the computation of macromolecules, a domain that is traditionally under classical methodologies such as MM, it is essential that their underlying methodology is sufficiently accurate to predict structural and physiochemical properties in the systems they simulate. For this reason, we provide here a comprehensive evaluation of glucose epimers of the most stable conformations of d-aldopyranoses, the 4C1d-aldopyranoses (Figure 1), using the standard second-order DFTB, referred to as DFTB241 or SCC-DFTB, and the standard third-order DFTB, or DFTB3.42 We assess the accuracy and characteristics of the semiempirical approach against first-principles DFT by comparing optimized geometries and relative electronic energies in both the gas and aqueous phase. However, unlike previous DFTB benchmark studies that emphasized on the puckering characteristics of the sugar ring,10,11,35 we further investigate the performance of the DFTB2 and DFTB3 methods in terms of hydrogen bonding and torsional potentials and find a complex relationship that affects the overall isomer energetics via the molecular structure.
Figure 1.
Chair conformations of 4C1d-aldopyranoses.
2. Computational Methodology
2.1. Quantum Chemical Calculations
All initial structures reported in this paper were obtained from ref (24) for both gas phase and aqueous solution. All structures were visualized using the program VMD.43 The programs GAMESS-US44 and Gaussian 09 and revisions D1 and E145 were used throughout the study for DFTB and DFT calculations. The initial structures were first re-optimized using GAMESS-US with the B3LYP functional with a 6-311++G(d,p) basis set before performing any additional calculations. Single-point energy calculations were performed from these geometries using the ab initio G3B3, QCISD(T)/6-31G(d), MP2/6-311+G(2df,2p), and HF/6-311+G(2df,2p) levels of theory in Gaussian 09 as well as two commonly used first-principles DFT functionals, B3LYP and Perdew–Burke–Ernzerhof (PBE) with a 6-311++G(d,p) basis set in GAMESS-US. For brevity, the large 6-311+G(2df,2p) basis set will be denoted as G3Large in the remainder of this paper. Additionally, single-point energy calculations were also performed with DFT (B3LYP and PBE) with a STO-3G minimum basis set for comparison with G3B3. For DFTB, single-point energy calculations from B3LYP optimized geometries were carried out with DFTB2 and DFTB3 with the DFTB parameter sets mio-1-146 and 3ob-3-1,47 respectively.
All geometry optimizations started from the same initial B3LYP/6-311++G(d,p) geometries and were carried out using DFTB2/mio-1-1 and DFTB3/3ob-3-1 for DFTB. The convergence criteria for optimization were set to 2 × 10⁻⁶ au for the gradient. Calculations in aqueous solution were carried out using the conductor-like polarized continuum model, or C-PCM,48,49 as implemented in GAMESS-US, with a very high tesserae density of 960 for all implicit solvent calculations and a tight cavity in Gaussian 09. All structures were confirmed as local minima by carrying out frequency calculations to ensure there were no imaginary frequencies.
2.2. Definitions Used To Characterize Conformations
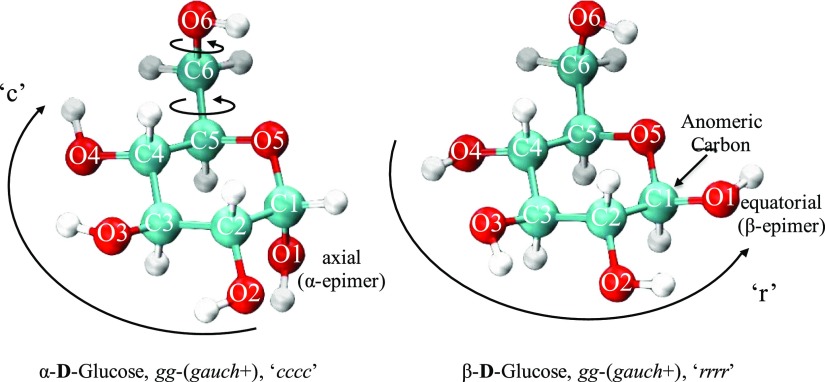
Owing to the large number of possible conformations within the 4C1 ring conformation, the study adopts the nomenclature and notions also found in ref (24). Each structure is categorized by their respective epimer shown in Figure S1 (in the Supporting Information) and denoted by one of two anomeric forms, α or β, depending on the orientation of their anomeric site C1–O1 (axial or equatorial with respect to the ring) as portrayed in Figure 2. The anomeric isomerism contributes two types of conformations to the total number of possible isomers. The rotation around the C5–C6 bond that constitutes the primary alcohol structure allows for three distinct conformations to be adopted on top of the anomeric designation, gauche–trans (gt), gauche–gauche (gg), or trans–gauche (tg), with regards to the dihedral angle of the hydroxymethyl group O5–C5–C6–O6 positioned at >0°, ∼180°, <0°, respectively. The rotation of the C6–O6 bond that controls the orientation of the hydroxyl group H–O6 produces an additional three conformations, gauche+ (g+), trans (t), or gauche– (g−), with regards to the dihedral angle of C5–C6–O6–H positioned at >0°, ∼180°, <0°, respectively. The clockwise or counter-clockwise orientation of secondary hydroxyl groups on C1, C2, C3, and C4 positions are labeled as “c” or “r”, respectively, with the label “0” used when the orientation is neither “c” nor “r”. These degrees of freedom contribute an additional 34 = 81 distinct conformations. In total, there are 8 × 2 × 3 × 3 × 34 = 11 664 different possible conformations, following our classification scheme. If non-4C1 ring isomers, such as the energetically less favorable 1C4 chair isomers, and the even less favorable skewed and boat ring conformations were considered, the number of isomers would be even higher.
Figure 2.
Atomic labeling of d-glucose in ball and stick representation and the internal rotations of C5–C6 which would produce the configurations gg, gt, and tg, respectively, and C6–O6 which would produce the configurations g+, t, and g–, respectively. The orientation of each hydroxyl group on C1, C2, C3, C4 is denoted “c” in the clockwise direction, “r” in the counterclockwise direction, or “0” for neither.
The number of previously optimized structures from ref (24) are listed in Table S1, while the number of optimized B3LYP/6-311++G(d,p), DFTB2/mio-1-1, DFTB3/3ob-3-1 geometries are listed in Table S2, taking into consideration only cases where corresponding structures were found at all three levels of theory. Comparisons between structures were carried out using the root mean square deviation (RMSD) of atomic positions with respect to B3LYP optimized structures in vacuum and B3LYP-PCM optimized structures in implicit solvent. In the case of heavy atoms (defined in this paper as non-hydrogen atoms such as carbon and oxygen) geometry comparisons, only those with the same gg, gt, or tg conformations as the reference B3LYP or B3LYP-PCM geometry were used. Likewise, every (gg/gt/tg, g+/t/g–, c/0/r) isomer must be identical to the reference B3LYP or B3LYP-PCM geometry when comparing all atoms, including hydrogen.
3. Results and Discussion
Before discussing the benchmark results, we briefly review the general understanding of glucose isomerism in the field. Aldohexoses that commonly form in nature, glucose, followed in abundance by galactose and mannose, are what we can refer to as “common” sugars. All other five aldohexose epimers do not occur naturally and need to be chemically synthesized. Interestingly, the talose epimer turns out to be energetically lower than glucose in static theoretical calculations both in vacuum and aqueous solution; however, its number of stable low-energy conformations is relatively small when compared to glucose or mannose.24 The anomeric isomerism of glucose derivatives strongly depends on the epimer and the solvent environment they are in. For example, d-mannose the experimental preference is for the α anomer in aqueous solutions,50 whereas the β anomer of d-glucose are usually preferred in water and α in dimethyl sulfoxide and ionic liquids.51 Other rotational isomerism such as hydroxyl rotations are usually not resolvable due to low energetic barriers that can be easily overcome at room temperature, but can be studied computationally.
The benchmark results from our study will be presented as follows. In Section 3.1, we present a benchmark for a number of ab initio and first-principles methodologies against highly accurate G3B352,53 energies based on B3LYP/6-311++G(d,p) geometries. In Section 3.2, we report the comparison of DFTB optimized geometries, focusing only on the molecular skeleton involving “heavy” elements, along with epimer isomer energetics discussed in Section 3.3. To understand the differences between DFTB and DFT isomer energies in terms of hydrogen bonding, we report the details of molecular geometries including orientations of the hydroxyl groups (all atom geometrical comparison) in Section 3.4. In Section 3.5, we elaborate on the relationship between torsional potentials and hydrogen bonding for DFT and DFTB. In recent years, empirical dispersion corrections have been widely employed in the study of noncovalent interactions, and therefore we assess their effect on energetics and geometries in Section 3.6, where we present results for DFTB2-D3H4,54 DFTB3-D3(BJ),55 and B3LYP-D3(BJ)56 methods.
3.1. Ab Initio and First-Principles Single-Point Isomer Energies
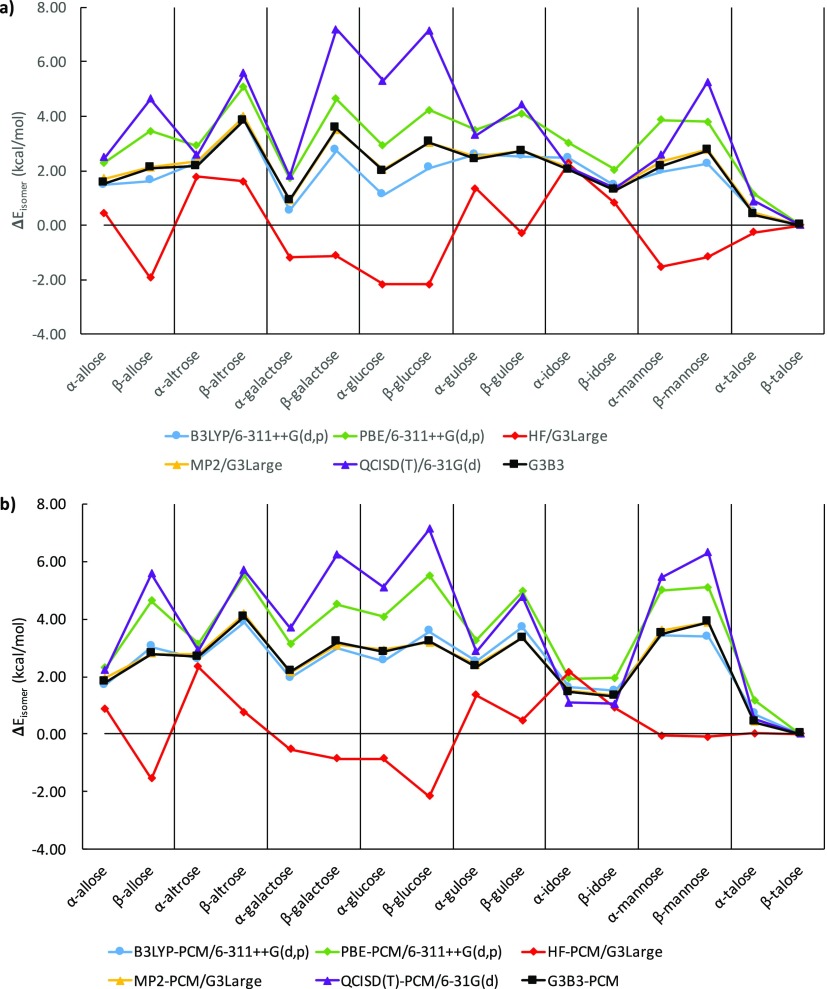
The G3B3 method has often been used as an accurate ab initio model that is able to reproduce experimental data57−60 and employed as a theoretical reference for other high-level methods.61,62 In Figure 3, we define ΔEisomer as the global relative energy difference between the lowest G3B3 energy isomer of all α and β conformations both in gas phase and water, β-talose, and the lowest energy isomer of other α and β epimers, comparing HF/G3Large, MP2/G3Large, QCISD(T,FC)/6-31G(d), B3LYP/6-311++G(d,p), and PBE/6-311++G(d,p) levels of theory against G3B3 with B3LYP/6-311++G(d,p) optimized geometries in vacuum and solutions.
Figure 3.
Comparison of single-point isomer energies, relative to the lowest energy isomer of the most stable talose epimer in G3B3, (a) in vacuum and (b) in implicit solvent.
Of the five ab initio and first-principles methods, MP2/G3Large energies match G3B3 energies best, both in vacuum and in implicit solvent, whereas HF/G3Large displays a severe mismatch. The latter is attributable to the lack of electron correlation, which is known to be important for the description of hydrogen bonded systems.63 DFT methods using an STO-3G minimum basis set further deviates by up to ∼20 kcal/mol from the G3B3 isomer energies (shown in Figure S2 in the Supporting Information). While both B3LYP and PBE are in relatively good agreement with G3B3, B3LYP provides a much closer agreement. The excellent performance of the B3LYP method for the description of sugar isomerism has been discussed in previous publications.18−21 Therefore, we consider B3LYP/6-311++G(d,p) as a reliable, computationally feasible method to benchmark the performance of conventional DFTB.
3.2. Molecular Geometry Parameters for Heavy Atoms
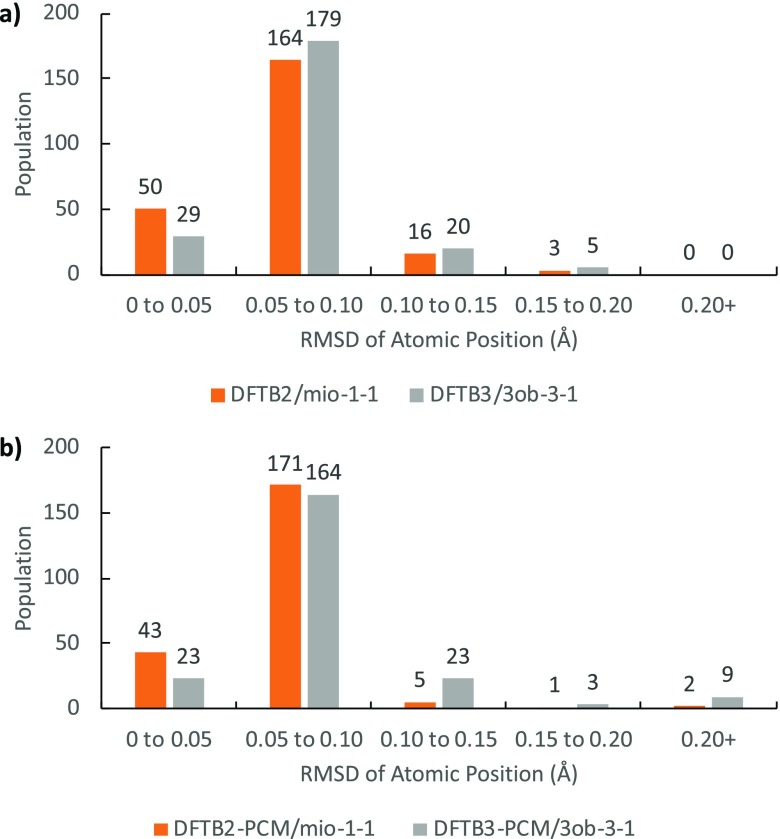
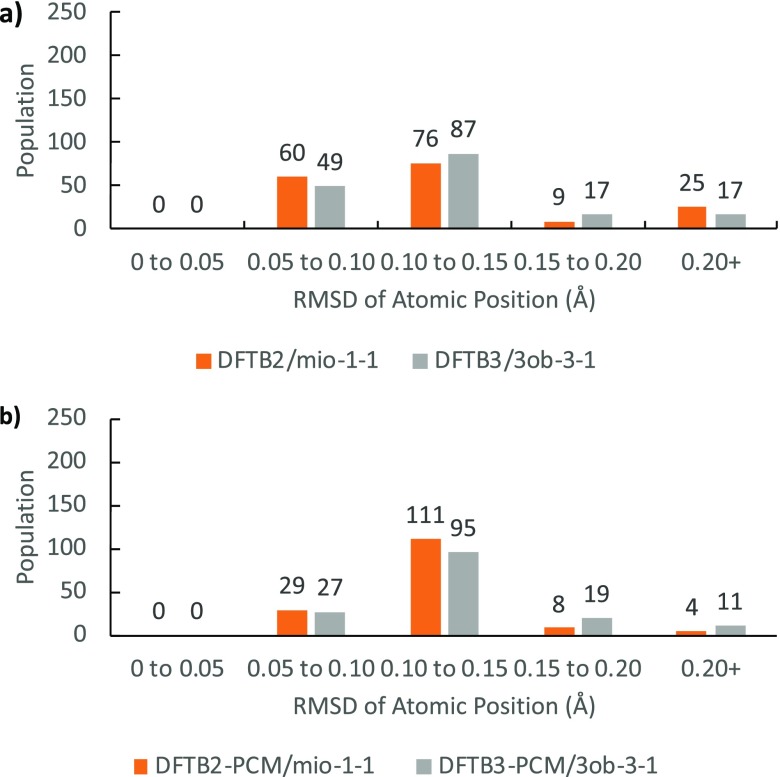
In Table 1, the mean absolute deviation (MAD), RMSD, and maximum deviation (MAX) are summarized for the heavy elements both in vacuum and in implicit water solvent. Figure 4 shows the RMSD distribution for DFTB-optimized heavy atom positions against B3LYP reference geometries in both gas phase and aqueous solution in form of a histogram using 0.05 Å (bins).
Table 1. MAD, RMSD, and MAX of RMSD of Atomic Position Values of Heavy Atoms (Å) for DFTB2 and DFTB3 vs Optimized B3LYP Geometries.
| method |
||||
|---|---|---|---|---|
| DFTB2 | DFTB3 | DFTB2-PCM | DFTB3-PCM | |
| MAD | 0.07 | 0.07 | 0.07 | 0.08 |
| RMSD | 0.07 | 0.08 | 0.07 | 0.09 |
| MAX | 0.17 | 0.18 | 0.22 | 0.33 |
Figure 4.
Distribution of geometries according to RMSD of atomic position values for structures, (a) in vacuum and (b) in implicit solvent (excluding hydrogen).
Superposing the heavy atoms of DFTB geometries to B3LYP, DFTB2 performs better than DFTB3 overall in the optimization of geometries. This tendency is particularly visible in solution with the DFTB3 population tending toward higher RMSD atomic position values. However, both methods reproduce geometries that are in very close agreement to B3LYP as the majority of structures possess RMSD of atomic position below 0.10 Å. The average difference in bond lengths in the gas phase is 0.008 Å for DFTB2 (−0.009 Å for C–C bonds and 0.026 Å for C–O bonds) and 0.010 Å for DFTB3 (0.012 Å for C–C bonds and 0.009 Å for C–O bonds). Similarly, in implicit water, the average difference in bond lengths is 0.009 Å for DFTB2-PCM (−0.009 Å for C–C bonds and 0.026 Å for C–O bonds) and 0.010 Å for DFTB3-PCM (0.011 Å for C–C bonds and 0.011 Å for C–O bonds). We note that DFTB2 systematically shortens the C–C bonds while elongating C–O bonds up to 0.026 Å on average. On the other hand, DFTB3 consistently elongates bonds by 0.010 Å except for the anomeric C–O bond (which is in near perfect agreement). Because of error cancellation in DFTB2 C–C and C–O bond length differences, the average bond length difference in DFTB2 and DFTB3 appears to be similar. However, the bond length differences in C–C and C–O bonds are much more systematic in DFTB3.
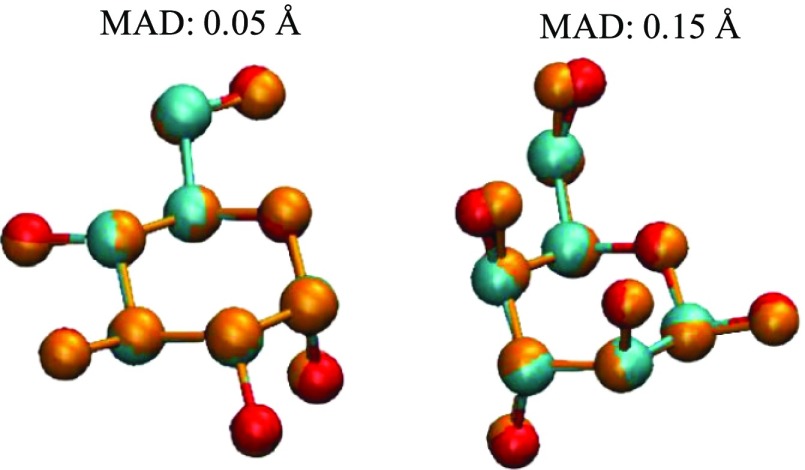
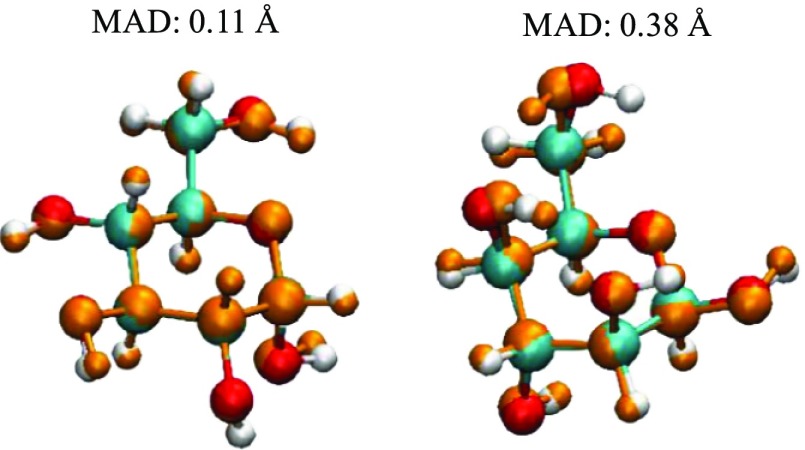
Nevertheless, when considering DFTB in general, C–C and C–O bonds only deviate from 0.01 to 0.03 Å when compared to the more expensive B3LYP/6-311++G(d,p) geometries in both the gas phase and in solvent, thus can be considered as excellent agreement between the two methods when it comes to the core ring structure. Given such small differences in bond lengths, other geometrical parameters such as bond angles and dihedral angles of primary and secondary hydroxyl oxygen atoms would play a heavier role in influencing the RMSD of the atomic positions. This can be observed from geometries with higher RMSD values as shown in Figure 5.
Figure 5.
Comparisons of heavy atoms between optimized B3LYP (red and cyan for oxygen and carbon, respectively) and DFTB (orange) structures.
3.3. Relative Isomer Energy Performance
3.3.1. Single-Point Energies
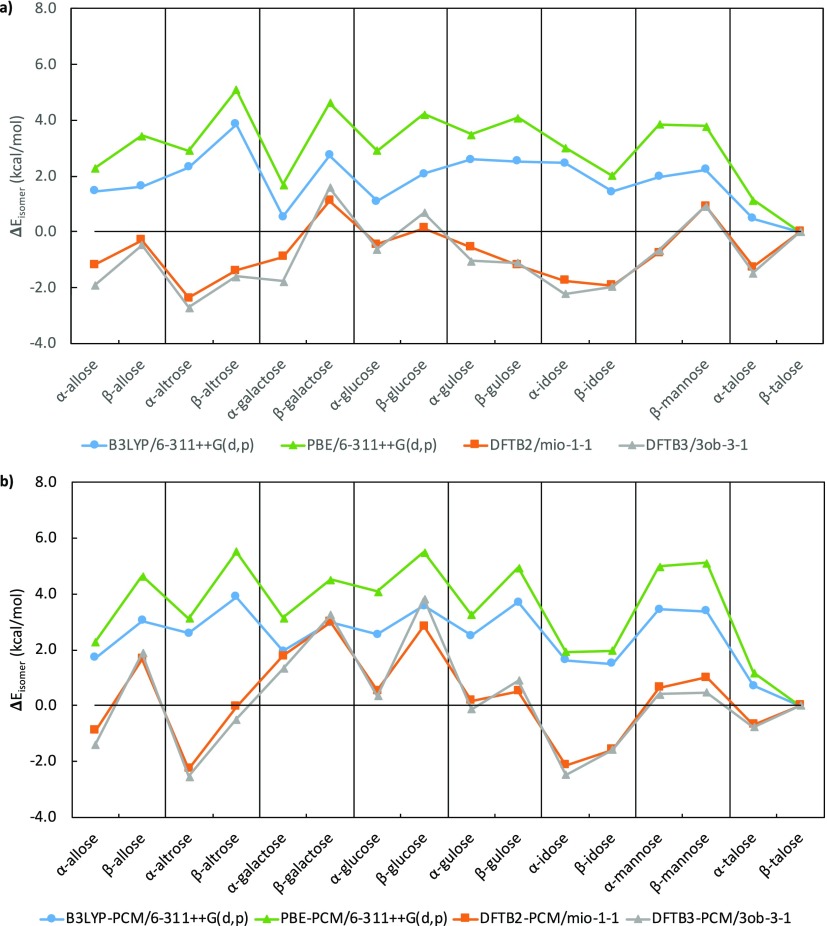
A straightforward analysis of DFTB energy performance can be obtained by comparing DFTB single-point energies with DFT single-point energies at B3LYP geometries. In this comparison, we also included PBE energies. Similar to Figure 3, we define ΔEisomer as global energy difference between the lowest energy isomer, but with B3LYP energies instead of G3B3, for both gas phase and water. Figure 6 shows the corresponding ΔE curves for DFTB2, DFTB3, and PBE using the same reference global minimum structure. From the single-point energies, it is immediately apparent that the ΔE curves for the two DFTB methods are in close agreement with one another, while the two DFT methods exhibits a similar trend but with larger individual differences. Strikingly, the lowest energy epimer in DFTB is not β-talose, but α-altrose in the case of vacuum, with α-altrose and α-idose being the two lowest energy epimers in solution. It needs to be emphasized that the span of ΔE values between epimers are similar for DFT and DFTB in the gas phase (∼5 kcal/mol), while the range of ΔE in solution for DFTB methods is wider than DFT (∼7 kcal/mol vs ∼5 kcal/mol). Because of the similar energy windows, the energy difference between the lowest α and β conformers in DFTB is similar to that of B3LYP, up to a 2.5 kcal/mol deviation and the energy ordering between anomeric isomers identical, with the only exceptions being talose (all cases), idose (gas phase DFTB3 and both DFTB methods in solution), and mannose (in solution, DFTB2). Therefore, the small differences in isomer energy highlight that DFTB can be as accurate as other flavors of DFT with a large basis set when considering anomers. Further evaluations of DFTB and B3LYP can be achieved from analyzing anomeric populations and ratios; however, that would require a larger number of conformations (ideally, with all low energy conformations for each epimer) and therefore is beyond what is presented in this paper.
Figure 6.
Comparison of lowest-energy DFTB and B3LYP single-point isomer energies for each epimer relative to the lowest energy isomer of the most stable talose epimer for B3LYP; (a) in vacuum and (b) in implicit solvent.
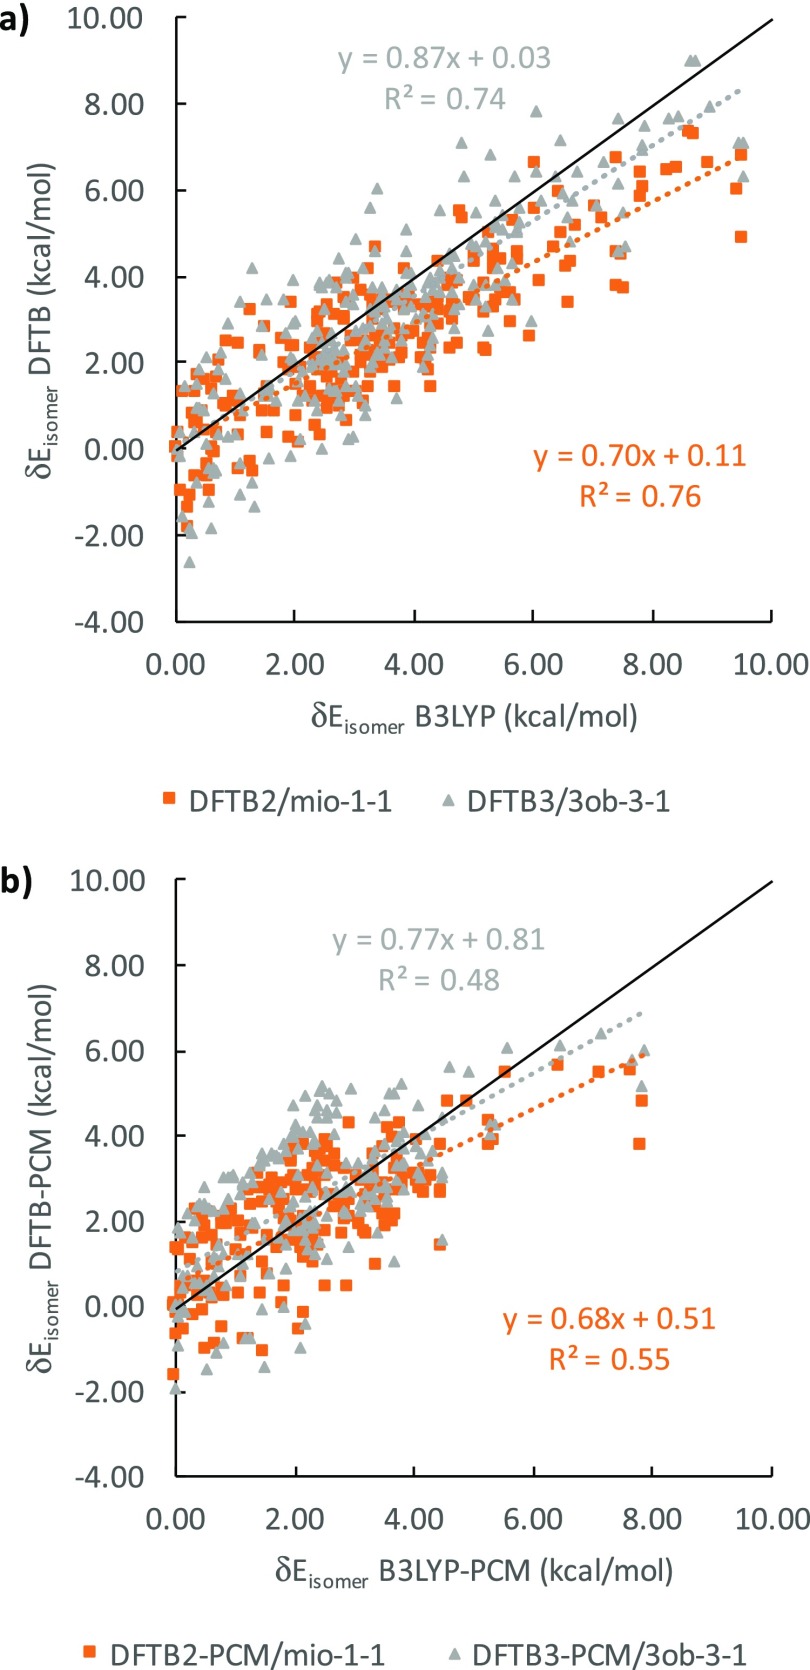
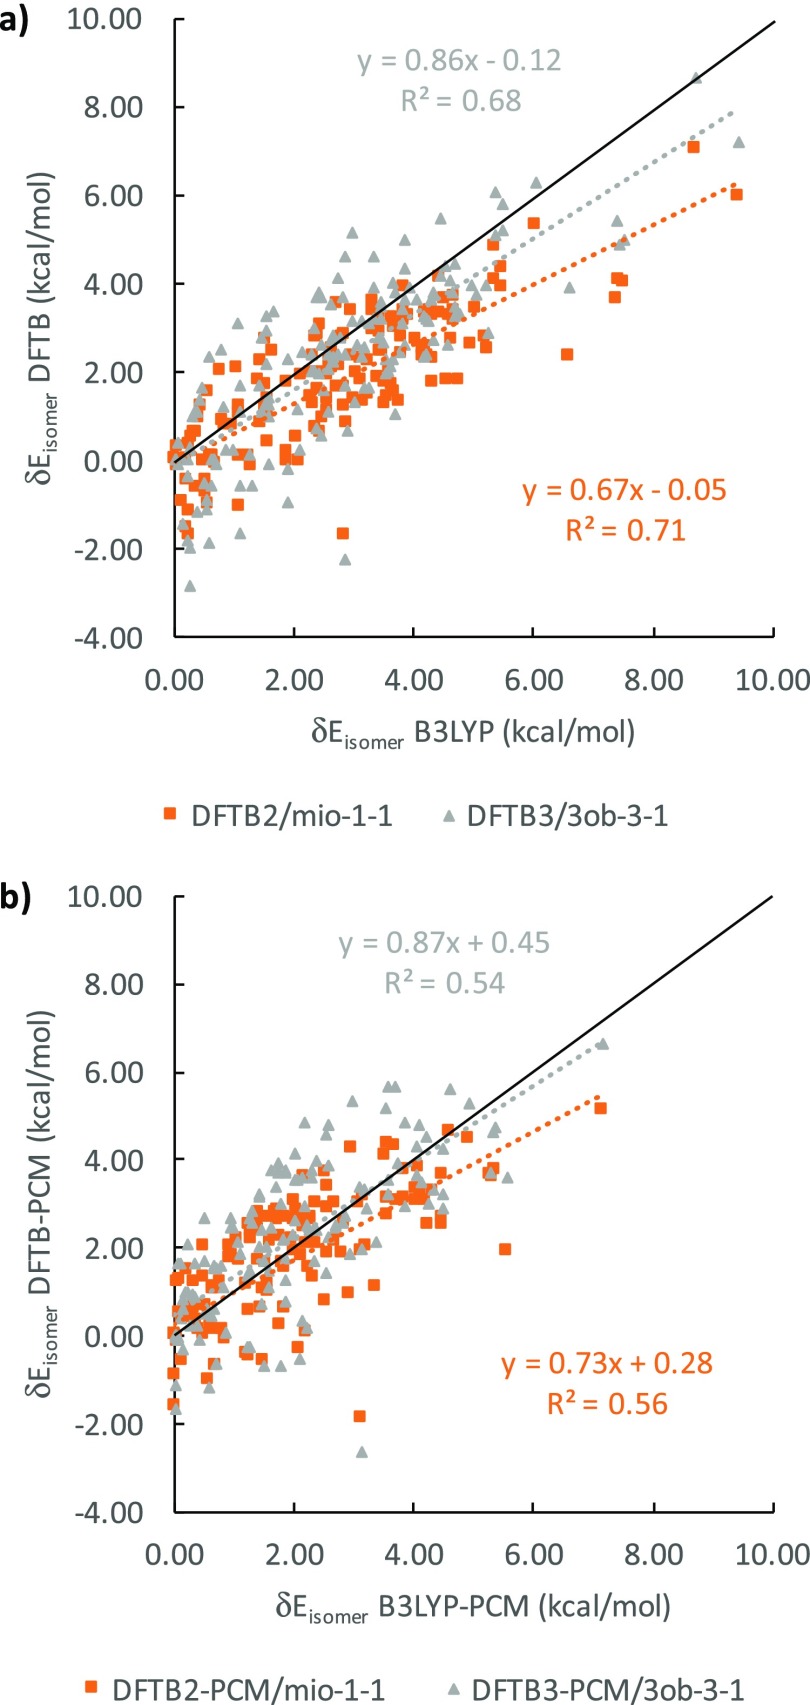
We now introduce δEisomer values to compare isomer energies within the α and β anomer groups of a particular epimer, using the lowest energy isomer, identified by B3LYP, as reference. In Table 2, we present the results for gas phase and for solution. Figure 7 graphically depicts the correlation between B3LYP and DFTB δEisomer energies in gas phase (Figure 7a) and in solution (Figure 7b), where the ideal agreement with B3LYP result in a slope of 1.0 and an intercept of 0.0.
Table 2. MAD, RMSD, Mean Signed Deviation (MSD), and MAX of δEisomer (kcal/mol) of DFTB2/DFTB2-PCM and DFTB3/DFTB3-PCM Single-Point Energies with Respect to B3LYP/B3LYP-PCM Energiesa.
| method |
||||
|---|---|---|---|---|
| DFTB2 | DFTB3 | DFTB2-PCM | DFTB3-PCM | |
| MAD | ||||
| α-conformations | 0.88 | 0.75 | 0.80 | 0.98 |
| β-conformations | 1.33 | 1.14 | 0.94 | 1.11 |
| overall | 1.11 | 0.95 | 0.87 | 1.05 |
| RMSD | ||||
| α-conformations | 1.10 | 1.00 | 0.97 | 1.24 |
| β-conformations | 1.61 | 1.40 | 1.20 | 1.43 |
| overall | 1.38 | 1.22 | 1.10 | 1.34 |
| MSD | ||||
| α-conformations | –0.59 | –0.08 | 0.08 | 0.50 |
| β-conformations | –1.10 | –0.66 | –0.38 | 0.18 |
| overall | –0.85 | –0.37 | –0.16 | 0.33 |
| MAX | ||||
| α-conformations | 3.81 | 2.87 | 2.41 | 2.60 |
| β-conformations | 4.62 | 3.15 | 4.09 | 3.03 |
For explanation of the reference, see text.
Figure 7.
Comparison of DFTB and B3LYP relative single-point energies for all epimers (a) in vacuum and (b) in implicit solvent. The solid black line when y = x with a slope of 1.
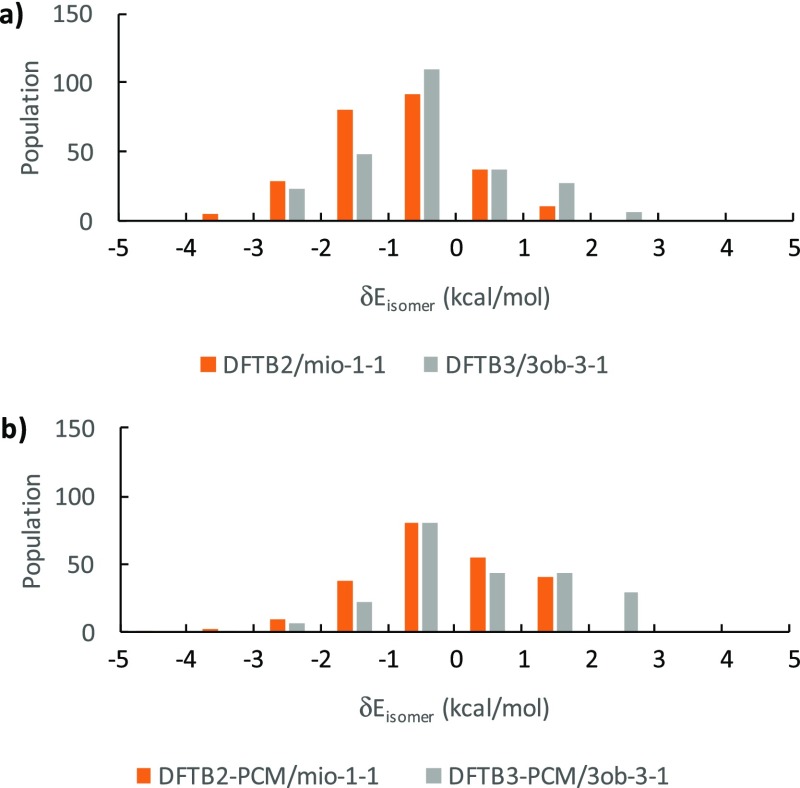
The general scattering of DFTB2 and DFTB3 against B3LYP δEisomer values, measured by the determination of R2 coefficient of the linear regression, is better in the gas phase than in solution. The scattering for DFTB2 is also slightly better for DFTB3, but DFTB3 generally outperforms DFTB2, in terms of slope and intercept. The slopes for each linear regression relation are all lower than 1, indicating a general tendency by DFTB methods to underestimate the range of δEisomer values, whereas the intercepts are all positive, signaling a systematic DFTB overestimation of the individual isomer energies within their respective anomer groups. The gas phase intercepts for the gas phase are only up to 0.1 kcal/mol whereas intercepts in solution reach up to 0.8 kcal/mol. From Figure 7, we conclude that DFTB3 reproduces B3LYP energetics slightly better than DFTB2 at the cost of greater data point scattering and that adding PCM reduces the accuracy of the DFTB energetics in solution, in terms of slopes, intercepts, and R2 values.
Table 2 reports anomer group-resolved deviations from B3LYP energies in terms of MAD, RMSD, MSD, and MAX. Surprisingly, these quantities do not show a significant performance difference between gas and solution phase as shown in Figure 7 but reveal that β anomer groups have slightly larger errors than the α anomers. Overall, both methods show similar performance for isomer energies with MAX values deviating at most 4.7 kcal/mol in vacuum and 4.1 kcal/mol in implicit solvent, MADs around 1 kcal/mol, with RMSD values around 1.3 kcal/mol or less. The low MAD and RMSD values seem incongruent to the relatively low R2 values discussed above. This discrepancy can be explained by the fact that R2 is a relative measure of deviation, whereas both MAD and RMSD are absolute measures of deviation. The absolute deviations of DFTB methods from B3LYP are small, due to the fact that the δE values themselves are also small, up to 10 kcal/mol, hence MAX values up to 4.7 kcal/mol will result in a relative large scatter. To further deconvolute the data in Figure 7, we plot in Figure 8 the distribution of relative single-point energies for DFTB2 and DFTB3 in vacuum (Figure 8a) and in implicit solvent (Figure 8b). This analysis reveals that DFTB2 trends toward negative deviations for δEisomer from B3LYP values, whereas DFTB3 trends toward positive deviations.
Figure 8.
Distribution of single-point δEisomer (a) in vacuum and (b) in implicit solvent.
3.3.2. Optimized Energies
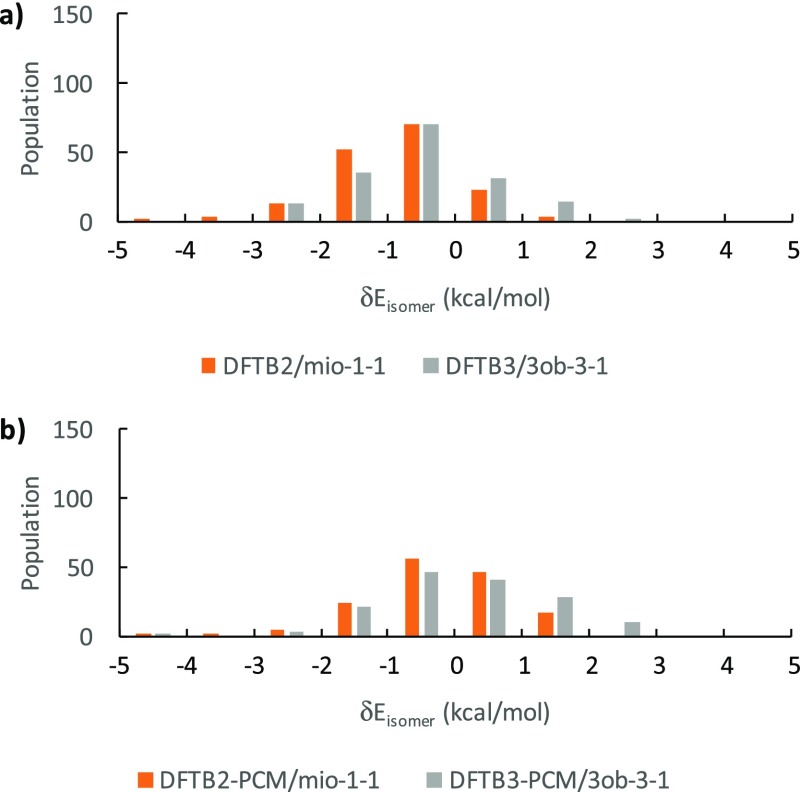
From single-point energies, we transition to compare isomer energies after geometry optimizations at their respective levels of theory, DFTB2, DFBT3, and B3LYP. Analogous to the single-point energy comparisons shown in Table 2, Table 3 lists MAD, RMSD, MSD and MAX values for the optimized structures in gas phase and solution, while Figure 9 graphically shows the corresponding data and linear regression of δE with Figure 10 shows the distribution of relative energies for DFTB2 and DFTB3-optimized geometries in vacuum (Figure 10a) and in implicit solvent (Figure 10b).
Table 3. MAD, RMSD, MSD, and MAX of δEisomer of DFTB2/DFTB2-PCM and DFTB3/DFTB3-PCM Optimized Energies with Respect to B3LYP/B3LYP-PCM Energies (kcal/mol).
| method |
||||
|---|---|---|---|---|
| DFTB2 | DFTB3 | DFTB2-PCM | DFTB3-PCM | |
| MAD | ||||
| α-conformations | 0.84 | 0.74 | 0.71 | 0.96 |
| β-conformations | 1.20 | 1.11 | 0.89 | 0.91 |
| overall | 1.02 | 0.92 | 0.78 | 0.94 |
| RMSD | ||||
| α-conformations | 1.15 | 1.10 | 0.98 | 1.30 |
| β-conformations | 1.54 | 1.36 | 1.16 | 1.16 |
| overall | 1.35 | 1.23 | 1.06 | 1.25 |
| MSD | ||||
| α-conformations | –0.69 | –0.27 | –0.05 | 0.36 |
| β-conformations | –1.08 | –0.69 | –0.45 | 0.02 |
| overall | –0.88 | –0.48 | –0.21 | 0.22 |
| MAX | ||||
| α-conformations | 4.53 | 5.09 | 4.98 | 5.77 |
| β-conformations | 4.24 | 3.07 | 3.66 | 2.66 |
Figure 9.
Comparison of optimized DFTB and B3LYP relative isomer energies for all epimers (a) in vacuum and (b) in implicit solvent. The solid black line when y = x with a slope of 1.
Figure 10.
Distribution of optimized δEisomer (a) in vacuum and (b) in implicit solvent.
We note that only 322 structures were compared as opposed to 481 structures in the single-point isomer energy comparison discussed above. Visual inspection of Figure 10a indicates that a large number of the energetically high-lying isomers have “disappeared” due to non-existent corresponding minima in the DFTB2/DFTB3, first for certain gg, gt, or tg configuration when considering only heavy atoms, then for certain hydroxyl rotations from the primary and secondary hydroxyl groups, a phenomenon we will further discussed in Section 3.4. Thus, only 322 structures correspond to identical minima structures in all three methods in the optimized comparison.
The smaller number of data points available in this comparison have influenced the R2 determination coefficient of the linear regressions, which are slightly “improved” in solution (DFTB2: 0.56, DFTB3: 0.54) but reduced by about 0.05 in gas phase (DFTB2: 0.71, DFTB3: 0.68). Despite these opposing trends, the general scattering patterns of DFTB2 and DFTB3 methods around B3LYP δEisomer values in the gas phase are still better than in solution. The slope of the DFTB3 curve still generally outperforms DFTB2, while the intercept in both methods remains small in gas phase and dropped by about 0.4 kcal/mol in solution. We conclude, as in the case of the single-point energy comparison, that DFTB3 reproduces B3LYP energetics slightly better than DFTB2 at the cost of greater data point scattering. However, adding PCM during geometry optimization now improves the accuracy of the DFTB energetics in solution in terms of slopes, while R2 values for solution are still worse than those for the gas phase.
Table 3 reports anomer group-resolved information analogous to Table 2 for the single-point energy comparison. The data in Table 3 show with similar deviations in the MAX the single-point comparison (gas phase slightly better than in solution, DFTB3 slightly higher than DFTB2), with β anomer groups providing larger errors than α anomers. Consistent with our single-point energy comparison, the data in Figure 10 reveal that DFTB2 trends toward negative deviations for δEisomer from B3LYP values, whereas DFTB3 trends toward positive deviations.
In summary, Tables 2 and 3 provide insight into the relative isomer energetics for DFTB relative to B3LYP: (a) DFTB epimer energetics performance for α conformations is notably better than for β conformations, a trend that is particularly true in vacuum, but less pronounced in implicit solvent, and (b) relative isomer energies in implicit solvent are considerably less overestimated than in vacuum, namely roughly 0.6 kcal/mol difference between gas phase and PCM MSDs.
3.4. Molecular Geometry Parameters for All Atoms including Hydrogen
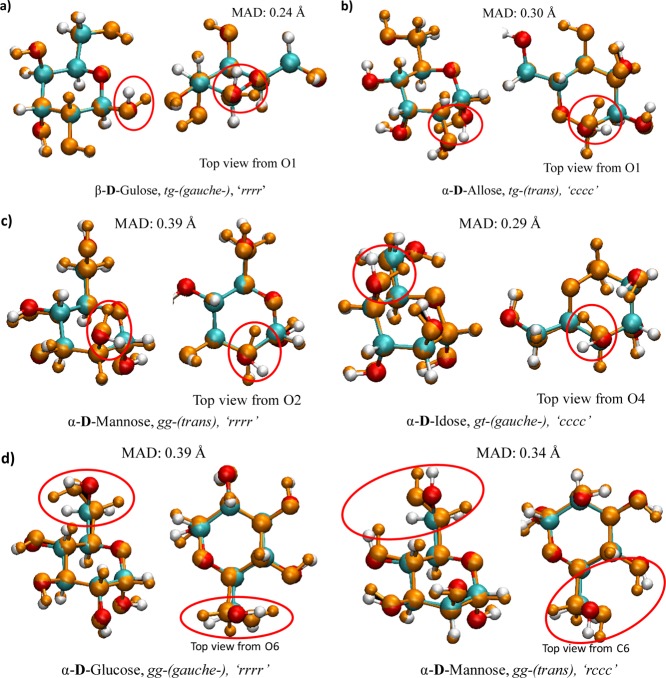
Analogous to the geometry analysis presented in Section 3.2 for nonhydrogen atoms, Figure 11 shows the RMSD distribution for DFTB-optimized atom positions against B3LYP reference geometries in both gas phase and aqueous solution in the form of a histogram, this time including hydrogen atoms. We observe a significant decrease in the population of the smallest RMSD values due to “incompatible” geometries between B3LYP and DFTB. As mentioned in Section 3.2, changes in the torsional angles associated with oxygen atoms on primary and secondary hydroxyl substituents contribute substantially to the RMSD of atomic position. When including the differences between DFTB and B3LYP average O–H and C–H bond lengths, the changes in bond lengths in the gas phase and in solvent are negligible, increasing only to ∼0.010 Å for DFTB2 (this includes 0.020 Å for O–H bonds and 0.025 Å for C–H bonds) and ∼0.001 Å in DFTB3 (0.005 and 0.007 Å for O–H bonds in gas and implicit water and 0.014 Å for C–H bonds in both gas and implicit water). Nevertheless, the RMSD of atomic position values with hydrogen atoms included are roughly doubled from the heavy atom comparison, as apparent in Table 4, due to the internal rotations of the primary and secondary hydroxyl groups. This increased difference in atom positions can also be seen in Figure 12, although we note that the right-hand structure difference is not considered in the RMSD value because of its incompatibility between the B3LYP and DFTB structure according to the applied compatibility criterion. We find that high values of atomic position RMSDs in compatible structures greater than 0.20 Å originate largely from internal hydroxyl rotation.
Figure 11.
Distribution of geometries according to RMSD of atomic position values (hydrogen included) compared to B3LYP (a) in vacuum and (b) in implicit solvent.
Table 4. MAD, RMSD, and the MAX of RMSD of Atomic Position Values (Å) for DFTB2 and DFTB3 vs Optimized B3LYP Geometries.
| method |
||||
|---|---|---|---|---|
| DFTB2 | DFTB3 | DFTB2-PCM | DFTB3-PCM | |
| All Atoms | ||||
| MAD | 0.13 | 0.13 | 0.12 | 0.14 |
| RMSD | 0.14 | 0.14 | 0.13 | 0.15 |
| MAX | 0.38 | 0.39 | 0.36 | 0.49 |
Figure 12.
Comparisons of structures from Figure 5 including hydrogen atoms between optimized B3LYP (red, cyan, and white) and DFTB (orange) structures.
In vacuum, four apparent types of geometry changes can occur when re-optimizing DFT structures with both DFTB methods, two commonly found in gas phase and solution and one exclusively for each case. The most common of these in gas phase, arbitrarily called type 1, involve the re-orientation of the hydroxyl group attached to the anomeric carbon C1 (see Figure 13a). This geometry change affects only β conformations, namely the rotation of the equatorial hydroxyl group on carbon C2. Compared to the near perpendicular orientation of the hydroxyl hydrogen with respect to the plane of the ring in B3LYP, the orientation of the C1 hydroxyl group in DFTB2 and DFTB3 is roughly parallel to the plane of the ring. We find that, for this change to occur, both hydroxyl groups on C1 and C2 must also be in their “r” configuration. Type 2 (Figure 13b) occurs when a “c” orientated axial hydroxyl group on C1 (α conformer) re-orientates from pointing toward the equatorial hydroxyl group on C2 in B3LYP to the axial hydroxyl group on C3 in DFTB. Type 3 (Figure 13c) involves an “r” oriented, axial C2 hydroxyl group or a “c” oriented, axial C4 hydroxyl group, where outward pointing hydroxyl groups in B3LYP turn “inward” toward the O5 oxygen of the ring structure, with all occurrences of this type being observed only in α conformations.
Figure 13.
Types of changes found in DFTB optimization (a–c) in vacuum and (d) in implicit solvent: (a) re-orientation of C1 hydroxyl group, type 1, (b) re-orientation of C1 hydroxyl group from C2 to C3 hydroxyl group, type 2, (c) re-orientation of C2 or C4 hydroxyl group, type 3, and (d) re-orientation of gg toward tg by internal C5–C6 rotation, type 4.
In solution, type 2 (and to a lesser extent type 1) changes can also be found in compatible structures with RMSD of atomic position values greater than 0.20 Å. However, the most prevalent changes in aqueous solution involve the primary hydroxyl group and the C5–C6 bond, which we arbitrarily label as type 4. Although the geometry remains as gg, the internal rotation of the C5–C6 bond rotates gg toward tg as portrayed in Figure 13d. The question now arises whether such hydroxyl group rotations in Figure 13 are related to differences between B3LYP and the DFTB methods in the description of torsional potentials or of the hydrogen bonding.
3.5. Relationship between Torsional Potential and Hydrogen Bonding
It has long been known that the semiempirical DFTB methods exhibit deficiencies in the description of hydrogen bonding,64,65 a critical feature in carbohydrates. It is also known that DFTB methods tend to underestimate torsional barriers,26,66 as do most pure DFT functionals. We therefore devised a series of torsional potential energy calculations involving four different test molecules, cyclohexanol with the hydroxyl group in both equatorial and axial positions and 1,2- and 1,3-cyclohexanediol for equatorial and axial hydrogen bonding, respectively. Cyclohexanol allows the study of the OH torsions in the absence of hydrogen bonding and can be used to extract the torsional potential contribution from OH rotations breaking a hydrogen bond in the two relevant cyclohexanediols. Relaxed torsional potential energy scans were computed for all four molecules at the B3LYP/6-311++G(d,p) level of theory using Gaussian 09 to obtain reference geometries along a single OH group rotation. These geometries were then used in single-point energy calculations by GAMESS-US. These rotations are shown in Figures S3 and S4 in the Supporting Information. The hydroxyl groups at each position (the axial or equatorial position in cyclohexanol or the hydrogen bond donor OH group in the cyclohexanediols) were rotated in 30° increments up to 360°. Because the torsional potential in DFTB is determined by the PBE functional,67 we also computed a corresponding PBE potential energy scans with the 6-311++G(d,p) basis set for comparison.
3.5.1. Cyclohexanol
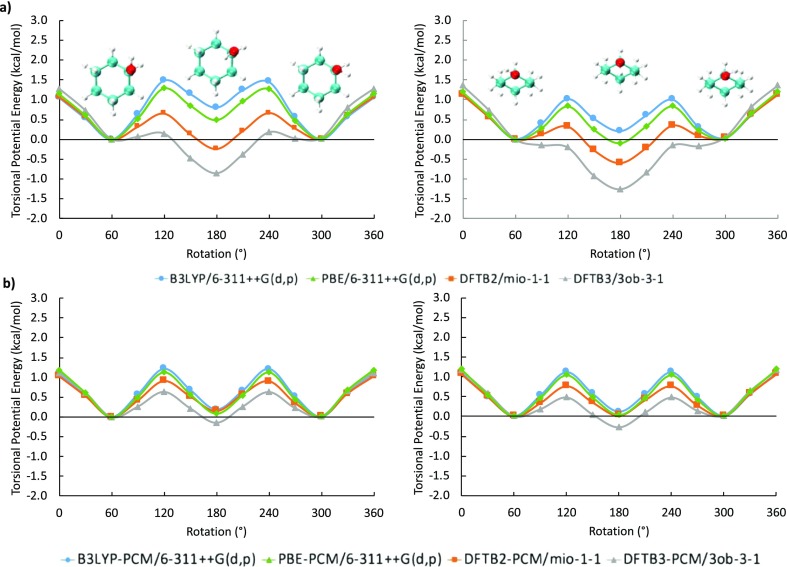
We first discuss the energetics for single hydroxyl rotations in the cyclohexanol test molecule for both axial and equatorial conformations. Figure 14 compares the corresponding torsional potential energies between DFT and DFTB methods in the gas phase (Figure 14a) and in solution (Figure 14b). Compared to both B3LYP and PBE functionals, both DFTB methods predict potential energy curves that are noticeably lower between 60° and 300° for the axial conformation in both vacuum and implicit solvent, with DFTB3 underestimating rotational barriers even more strongly than DFTB2. These differences in solvent are marginal at best, roughly −0.3 to −0.4 kcal/mol with respect to B3LYP. The largest differences are observed in the gas phase axial conformation around 180°, which converts the DFT local minima into global DFTB energy minima, more so in DFTB3 than in DFTB2. In the equatorial conformation, these effects are less noticeable, and here the global minimum only changes position to 180° in DFTB3.
Figure 14.
Torsional potential energy vs degree of rotation plots for cyclohexanol both (a) in vacuum and (b) in implicit solvent. Left: Axial hydroxyl group, right: equatorial hydroxyl group.
3.5.2. 1,2- and 1,3-Cyclohexanediols
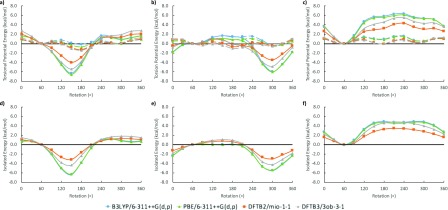
We now consider the case of hydroxyl rotation in the cyclohexanediols. Starting with the optimized 1,2- and 1,3-cyclohexanediols geometries possessing hydrogen-bonded hydroxyl groups, we performed potential energy surface scans for the axial–axial, axial–equatorial, and equatorial–equatorial hydrogen bond interactions. By rotating the hydrogen bond donor away from the hydrogen bond acceptor, we obtained potential energy curves for vacuum and implicit solvent shown in Figures 15 and 16, similar to those shown in Figure 14 for the cyclohexanol molecule. The resulting potential energy curves are now a combination of both torsional potentials and hydrogen bond interactions. In order to separate these two energy contributions, we eliminate the hydrogen contribution by computing single-point energies for the rotation of the hydrogen bond donor OH group by replacing the acceptor OH group by a hydrogen atom at a fixed distance of 1.1 Å from the carbon atom. The energy difference between the hydrogen-bonded cyclohexanediols and the “non-hydrogen bonded” cyclohexanes is then considered as the isolated hydrogen bond energy. This isolated quantity is significantly smaller than DFT in both DFTB methods, with a noticeable improvement for DFTB3 over DFTB2. This is similar to what was previously as reported by Gaus et al. in 2011 when DFTB3 was first devised.42
Figure 15.
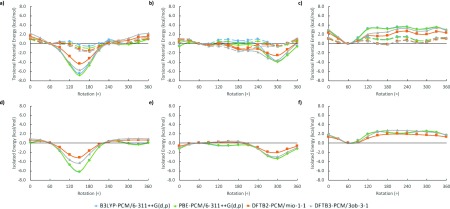
Torsional potential energy vs degree of rotation plots for 1,2- and 1,3-cyclohexanediol in vacuum. (From left to right) The energies of axial–axial, axial–equatorial, and equatorial–equatorial hydrogen bond interactions, respectively. (Top, a–c) The solid line represents the energy of a two hydroxyl group system and the dashed line represents the energy of a single hydroxyl group system. (Bottom, d–f) Isolated hydrogen bond energy.
Figure 16.
Torsional potential energy vs degree of rotation plots for 1,2- and 1,3-cyclohexanediol in implicit solvent. (From left to right) The energies of axial–axial, axial–equatorial, and equatorial–equatorial hydrogen bond interactions, respectively. (Top, a–c) The solid line represents the energy of a two hydroxyl group system and the dashed line represents the energy of a single hydroxyl group system. (Bottom, d–f) Isolated hydrogen bond energy.
We notice considerable discrepancies between DFT and DFTB in the energetics of isolated hydrogen bond energies for both cyclohexanediols. For all three isolated hydrogen bond interactions (Figures 15d–f and 16d–f), a second, local energy minimum can always be seen in the DFT, a characteristic that is absent in DFTB. This absence results in a smoothened isolated hydrogen bond energy contribution with no additional stabilization besides the global minimum. We attribute this incorrect behavior of both DFTB methods to the lack of structural features in the deformation density, which is represented only by point charges instead of a multipolar expansion as suggested by Bodrog and Aradi.68
From our analysis it appears that, in addition to the incorrect global minimum of the DFTB hydroxyl torsional potentials, DFTB also incorrectly smooths the hydrogen bond energy contributions to the torsional potential energy curve. The combination of these features results in an increased affinity for hydrogen bonds in DFTB, relative to DFT. In comparing optimized DFTB structures which retained their original B3LYP configuration, we found that the total number of hydrogen bonds formed (up to 2.5 Å) in DFTB optimized geometries in both vacuum and implicit solvent are considerably higher than in B3LYP (537 vs 580 vs 573 for B3LYP, DFTB2, and DFTB3, respectively, and 453 vs 512 vs 510 for B3LYP-PCM, DFTB2-PCM, and DFTB3-PCM, respectively). In addition, as shown in Figure S5, the hydrogen bond distances found in both DFTB methods are noticeably shorter than in DFT despite their lower energy contributions. This trend is particularly true for the two shortest hydrogen bond interactions, the axial–axial hydrogen bond and the axial–equatorial hydrogen bond. Both distances are shortened by up to ∼0.15 Å in both DFTB methods. However, the distance of equatorial–equatorial hydrogen bonds remains relatively the same, consistent with the smallest DFTB deviations from DFT for this particular interaction.
The behavior described above is counterintuitive, given the fact that both DFTB flavors are known to underestimate hydrogen bonded interactions. Although there is a lowering in torsional barriers for DFTB in equatorially bounded hydroxyl groups, which supposedly increases the chances of hydroxyl group rotations (i.e.—type 1 changes seen in Figure 13a), the overall energetics of DFTB torsional potentials in equatorially bounded hydroxyl groups are still much closer to that of B3LYP when compared to its axially bounded counterpart. As a result, the characteristics of a rotating equatorially bounded hydroxyl groups in DFTB are similar to that of an equatorially bounded hydroxyl groups in B3LYP, while axially bounded hydroxyl groups in DFTB are more likely to rotate relative to B3LYP. This rotation ultimately results in the changes as illustrated in Figure 13b,c. While a study for the internal C5–C6 rotation had not been explicitly analyzed for the changes found in Figure 13d, it is likely such rotation are influenced by the lowered rotational barriers found in DFTB, allowing rotation of the O6–H group to hydrogen bond the adjacent O4.
3.6. Empirical Dispersion Corrections on Glucose and Its Epimers
Since the early 2000s, the importance of dispersion corrections for describing noncovalent interactions, in particular hydrogen bonding interactions, has been widely recognized.69−72 At very little cost, noncovalent dispersion can be treated efficiently using the so-called “Grimme D3” empirical corrections.69,70 To analyze the effects of such dispersion corrections in the context of our benchmark study, we first compare the ΔEisomer and δEisomer values between B3LYP and B3LYP-D3(BJ),56 before summarizing the effects for dispersion corrections on DFTB2 and DFTB3 energies and geometries in vacuum. For DFTB2-D3H4,54 the program Cuby73 was utilized to compute D3H4 corrections, while B3LYP-D3(BJ) and DFTB3-D3(BJ)55 were computed directly within GAMESS-US. We note that the D3(BJ) parameters are optimized individually for B3LYP and DFTB3, and the effects are therefore not immediately transferrable.
3.6.1. Dispersion Effects on B3LYP Energies
When discussing changes in isomer energies between epimers, ΔEisomer, the D3 correction reduces the MAX of B3LYP from G3B3 by ∼0.3 kcal/mol, while MAD and RMSD values remain essentially unchanged (Table S3 and Figure S6). Additionally, B3LYP isomer energies in the same anomeric epimer group, δEisomer (Table S4 and Figure S7), show very little distinction between the two approaches. While a more in-depth study with DFT and a higher level theory would be needed to pinpoint the general differences between B3LYP and B3LYP-D3(BJ) in sugars, the similarity between B3LYP and B3LYP-D3(BJ) energies hints at a relatively minor role for dispersion in terms of energetics. In carbohydrates, the primary noncovalent interaction comes in the form of hydrogen bonding. Dispersion forces such as van der Waals would likely play a more significant role at shorter distances, but most intramolecular hydrogen bonds in the sugars investigated were found to be fairly long (rHA > 2.0 Å), even for the relatively strong axial–axial hydrogen bond interactions. Thus, while dispersion effects are likely affecting the shorter axial–axial hydrogen bond interactions the most, these subtle differences are difficult to differentiate in this study.
3.6.2. Isomer Energies
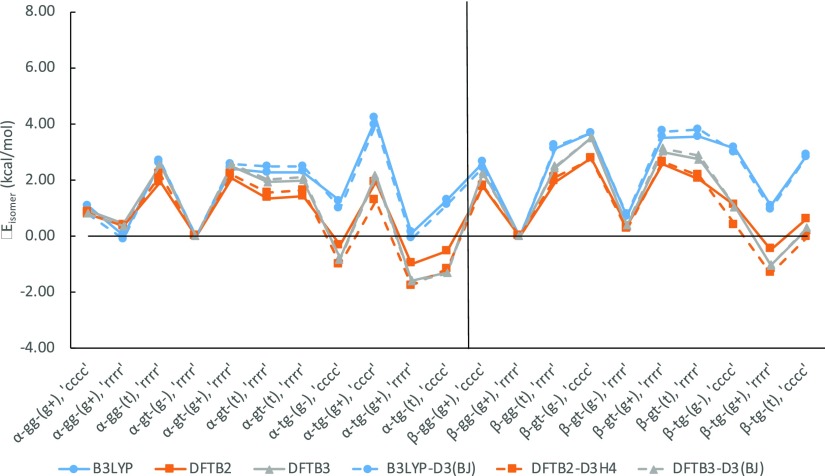
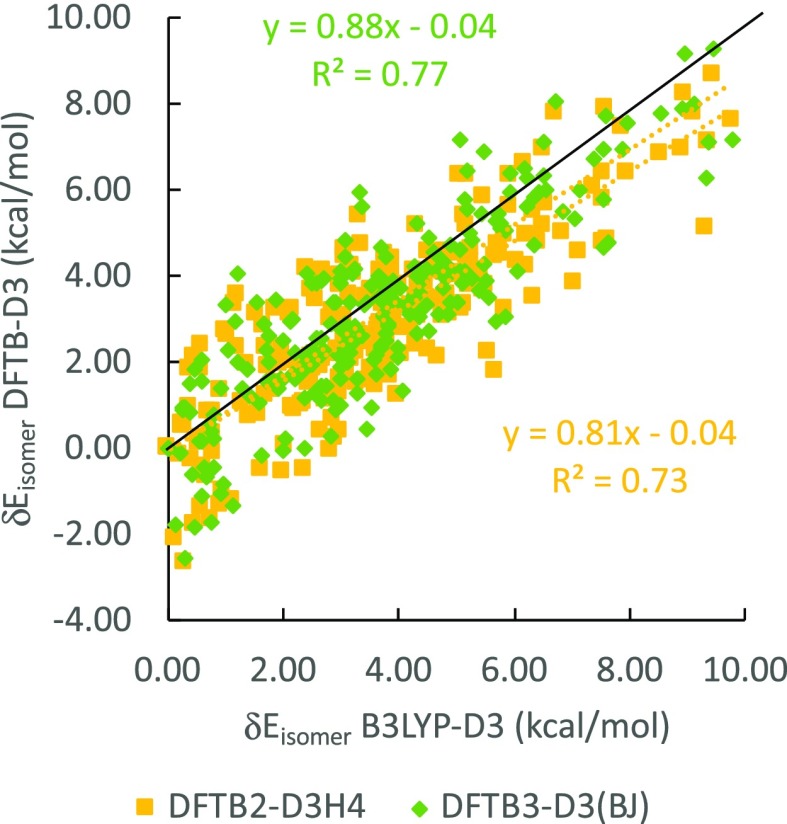
Similarly, when using empirical dispersion correction to DFTB, these contributions are also seen to have a relatively minor effect on both semiempirical methods as shown in Figures 17 and 18 when compared to the single-point analysis of Figure 7a of B3LYP energies.
Figure 17.
Comparison of δEisomer between DFT-D3 and DFTB-D3 from B3LYP/6-311++G(d,p) geometries.
Figure 18.
Comparison of δEisomer between DFT-D3 and DFTB-D3 from B3LYP/6-311++G(d,p) geometries.
A deeper analysis, however, does show dispersion corrections have a more significant impact in the max deviations of α-conformation as shown in Table 5. Compared to β-conformers, which can only form axial–equatorial and equatorial–equatorial hydrogen bonds, α-conformations can form the relatively shorter and stronger axial–axial hydrogen bonds. As mentioned previously with B3LYP-D3(BJ), although dispersion plays a relatively minor contribution to energy, it likely affects axial–axial hydrogen bonds the most. With a better description of dispersion contributions, the underestimated hydrogen bonding interaction from DFTB can be compensated by dispersion corrections as shown in Figure S8, where we derived torsional and hydrogen bond contributions for DFTB2-D3H4 and DFTB3-D3(BJ) from our cyclohexanol and cyclohexanediol model systems. Of the three interactions, dispersion corrections have affected axial–axial hydrogen bond interactions the most.
Table 5. Comparison of MAD, RMSD, MSD, and MAX of δEisomer (kcal/mol) of DFTB2 and DFTB3 with Respect to B3LYP vs DFTB2-D3H4, DFTB3-D3(BJ), with Respect to B3LYP-D3.
| method |
||||
|---|---|---|---|---|
| DFTB2 | DFTB3 | DFTB2-D3H4 | DFTB3-D3(BJ) | |
| MAD | ||||
| α-conformations | 0.84 | 0.74 | 0.83 | 0.75 |
| β-conformations | 1.20 | 1.11 | 1.34 | 1.11 |
| overall | 1.02 | 0.92 | 1.09 | 0.93 |
| RMSD | ||||
| α-conformations | 1.15 | 1.10 | 1.05 | 0.99 |
| β-conformations | 1.54 | 1.36 | 1.60 | 1.38 |
| overall | 1.35 | 1.23 | 1.36 | 1.20 |
| MSD | ||||
| α-conformations | –0.69 | –0.27 | –0.32 | 0.21 |
| β-conformations | –1.08 | –0.69 | –1.01 | –0.70 |
| overall | –0.88 | –0.48 | –0.62 | –0.46 |
| MAX | ||||
| α-conformations | 4.53 | 5.09 | 2.79 | 2.95 |
| β-conformations | 4.24 | 3.07 | 4.22 | 3.05 |
3.6.3. Optimized Geometries
In analyzing the optimized geometries including dispersion corrections, the effect of B3LYP-D3(BJ) on geometries was similarly benign as those on energy. B3LYP-D3(BJ) optimized structures were found to maintain most B3LYP configurations in Figure S1 (including hydrogen) with an MAD value of 0.02 Å in terms of RMSD of atomic positions. For DFTB, the largest effects comes in the form of corrected geometries from DFTB to B3LYP-like structures when compared to the 170 optimized configurations of Figure S2, in particular, DFTB2-D3H4.
When comparing an initial subset of 16 optimized epimers from Figure 3 and a set of 21 anomers, α- and β-glucose from Table S2, we found that geometries from B3LYP-D3(BJ) and DFTB3-D3(BJ) were nearly identical to their original B3LYP and DFTB3 structures (see Tables 6 and S5, and Figure S9).
Table 6. RMSD of Atomic Position Values (Å) for B3LYP, DFTB2, and DFTB3 Optimized Geometries vs Geometries Optimized with B3LYP-D3(BJ), DFTB2-D3H4, and DFTB3-D3(BJ).
| method |
|||
|---|---|---|---|
| B3LYP | DFTB2 | DFTB3 | |
| Epimers—All Atoms | |||
| MAD | 0.02 | 0.04 | 0.01 |
| RMSD | 0.02 | 0.04 | 0.01 |
| MAX | 0.02 | 0.07 | 0.02 |
| Anomers—All Atoms | |||
| MAD | 0.01 | 0.06 | 0.01 |
| RMSD | 0.01 | 0.07 | 0.01 |
| MAX | 0.02 | 0.19 | 0.02 |
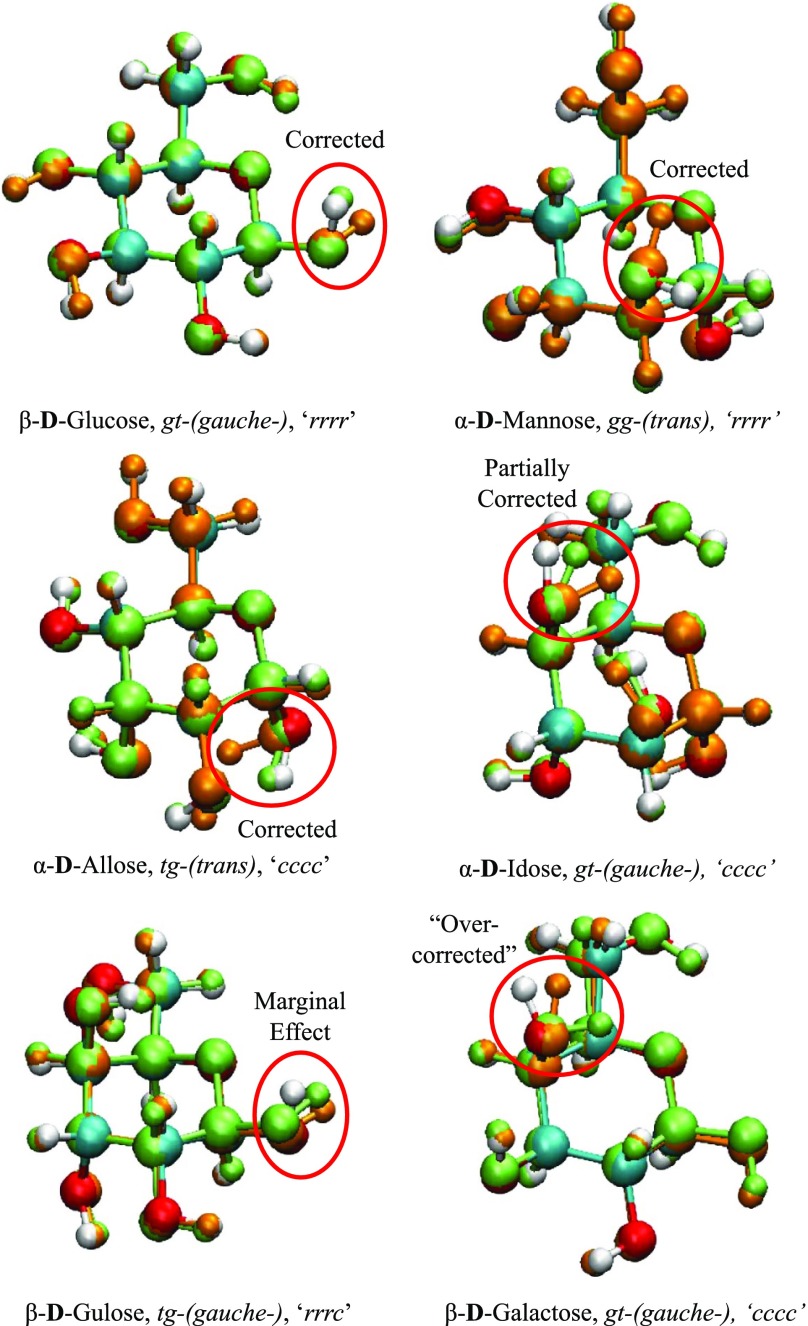
A closer analysis of DFTB2-D3H4 geometries (from the initial 37 optimized to the 170 structures of Table S2), allowed us to discovered inconsistencies found from DFTB2-D3H4 geometries when compared to standard DFTB2. As portrayed in Figure 19, DFTB2-D3H4 could retain certain B3LYP structures by preventing the changes found in Figure 13a–c from occurring. It was these geometric corrections that allowed DFTB2-D3H4 to have more geometries with RMSD of atomic position values below 0.10 Å than DFTB2, DFTB3, and DFTB3-D3(BJ) as shown in Figure S10. However, Figure 19 also illustrates that not all structures were positively affected by D3H4 corrections, thus preventing the overall RMSD of atomic position values found in Table S5 from going any lower. Surprisingly, despite their lower RMSD values, the hydrogen bond distances with D3H4 were shortened by ∼0.05 Å for axial–equatorial and equatorial–equatorial hydrogen bonds and away from B3LYP hydrogen bond distances (see Figure S11).
Figure 19.
Effects D3H4 corrections have on DFTB optimized geometries; B3LYP (red, cyan, and white), DFTB2 (orange), and DFTB2-D3H4 (lime) structures.
4. Summary and Conclusions
Isomerism in carbohydrates is an inherently complex topic, and the number of associated minimum energy structures represents a combinatorial explosion problem requiring fast computational methods. In this contribution, we benchmarked the performance of the computationally efficient second- and third-order DFTB methods, namely DFTB2 and DFTB3, respectively, for the eight hexose monosaccharide epimer molecular structures and isomer energies in gas phase and solution against the B3LYP/6-311++G(d,p) level of theory, because we established that it can essentially mimic the isomer energetics within ∼1 kcal/mol accuracy of the high-level ab initio G3B3 model chemistry. We used 255 and 226 optimized B3LYP low-energy gas phase and solvated isomer geometries from a previous study24 and re-optimized those structures using the DFTB2/mio and DFTB3/3ob methods, employing the PCM method for the implicit water solvation. About 234 gas phase and 221 solvated structures retained their C and O conformations in all three methods, with the missing isomers having different orientations of the primary alcohol group, namely gg, gt, and tg conformations. The resulting molecular geometry parameters are in excellent agreement with B3LYP, deviating less than 0.1 Å in the RMSD of C and O atom positions and the corresponding maximum deviations reaching only up to 0.33 Å for a negligible fraction of the isomers. When hydrogen atoms are considered in the geometry comparison, only 170 gas phase and 152 solvated structures retained their conformations in all three methods, indicating a considerable number of OH rotations during the geometry optimization.
We found that the DFTB2 and DFTB3 lowest epimer isomer energies at B3LYP optimized geometries are remarkably similar to one another but deviate by as much as 4 kcal/mol from the B3LYP isomer energies, with a tendency toward underestimating the isomer energies when choosing β-talose as global potential energy minimum. As a result, α-altrose and α-idose are predicted as competing global minimum energy structures for both DFTB2 and DFTB3 methods. For comparison, PBE deviates from B3LYP isomer energetics only by up to about 2 kcal/mol, and retains β-talose as global minimum. On the other hand, when considering relative isomer energies within a single epimer using B3LYP geometries, DFTB RMSD deviations from B3LYP/6-311++G(d,p) energies are not much larger than 1 kcal/mol at the B3LYP geometries, geometries and maximum energy deviations (MAX) reach 4.6 kcal/mol, with α conformations being slightly better described by the DFTB methods than the β conformations. The linear regression slopes for the DFTB/B3LYP isomer energy correlation range between 0.87 (DFTB3, gas phase) and 0.68 (DFTB2-PCM), indicating a general tendency by DFTB methods to underestimate the range of isomer energies, especially in solution. Associated R2 values are situated around 0.75 in the gas phase and 0.5 with PCM. The linear regression slopes improve upon DFTB optimizations, but the R2 values are still not much improved with 0.70 in the gas phase and 0.54 in water.
Contrasting the excellent agreement of B3LYP and DFTB geometry parameters for C and O atoms with the relatively poor correlation of isomer energetics hints at altered hydrogen bonding patterns and OH rotations in the DFTB geometries. Potential energy curves for a single OH group around the C–O bond indicated that DFTB methods tend to severely underestimate the rotational barriers against B3LYP and even PBE, DFTB3 even more so than DFTB2. This is particularly true for axial OH group rotations. A model system allowing the decomposition of torsional barriers from hydrogen bond contribution indicates that deficiencies in the torsional barriers are compensated by the formation of new hydrogen bond interactions in the DFTB geometries, causing the seemingly erratic isomer energy behavior of the DFTB methods. Investigation of hydrogen bond distances between axial–axial, axial–equatorial, and equatorial–equatorial OH groups in optimized DFTB structures reflect this systematic deficiency.
Even though hydrogen bonds are dominated by electrostatic and polarization interactions, we also considered the D3(BJ) and D3H4 empirical dispersion corrections, which gave mixed results for DFTB. In the geometries analyzed, corrections to some carbohydrate geometries and isomer energies can be beneficial with D3H4, while D3(BJ) only have a marginal effect. However, the effects D3H4 has on hydrogen bonding are negligible when considering all DFTB2-D3H4 optimized geometries in vacuum.
In conclusion, DFTB methods are capable of predicting heavy element positions in sugar molecules in excellent agreement with B3LYP/6-311++G(d,p) geometries at a small fraction of computational cost, but in their present formulation fail to reproduce hydrogen bond patterns which are accessible experimentally in neutron diffraction experiments, and therefore show substantial deviations in isomer energetics, irrespective of the use of dispersion corrections. Recognizing that the cooperativity in hydrogen bonds in large carbohydrate systems plays a central role in their overall characteristics and properties,74 future improvements of DFTB such as the inclusion of multipolar density expansion68 are necessary for high-fidelity DFTB studies (relative to DFT) of sugar conformations in large oligo- and poly-saccharide molecules.
Acknowledgments
K.H.L. was in part supported by a Master Course fellowship from MEXT, Japan, and by an Energy Science and Engineering Fellowship by the Bredesen Center for Interdisciplinary Research and Graduate Education at the University of Tennessee, Knoxville. Fruitful discussions with Quan Van Vuong are acknowledged. U.S. acknowledges support by the Mund-Lagowski Department of Chemistry and Biochemistry and Bradley University. S.I. acknowledges support by the Laboratory Directed Research and Development (LDRD) Program of Oak Ridge National Laboratory. ORNL is managed by UT-Battelle, LLC, for DOE under contract DE-AC05-00OR22725. This research used resources of the National Energy Research Scientific Computing Center, which is supported by the U.S. DOE Office of Science under Contract DE-AC02-05CH11231.
Supporting Information Available
The Supporting Information is available free of charge on the ACS Publications website at DOI: 10.1021/acsomega.8b02213.
Ball and stick representation of eight different glucose epimers, the number of structures studied, ab initio and first principle energies calculations results and comparison of 16 glucose epimers using 6-311++G(d,p), the Cartesian coordinates and energies of optimized glucose epimers from Figure S2 using B3LYP/6-311++G(d,p), ball and stick representation of the cyclohexanol and cyclohexanediol model system, energy and geometry between B3LYP, DFTB2, and DFTB3 versus B3LYP-D3(BJ), DFTB2-D3H4, and DFTB3-D3(BJ), torsional potential plots from DFTB-D3 and B3LYP-D3, Cartesian coordinates and energies of optimized glucose epimers from Figure S2 using B3LYP/6-311++G(d,p), and the distribution of hydrogen bond distances with and without dispersion or implicit solvation (PDF)
The authors declare no competing financial interest.
Supplementary Material
References
- Reeves R. E. The Shape of Pyranoside Rings. J. Am. Chem. Soc. 1950, 72, 1499–1506. 10.1021/ja01160a021. [DOI] [Google Scholar]
- Hudson C. S. Emil Fischer’s discovery of the configuration of glucose. A semicentennial retrospect. J. Chem. Educ. 1941, 18, 353. 10.1021/ed018p353. [DOI] [Google Scholar]
- Cocinero E. J.; Lesarri A.; Écija P.; Basterretxea F. J.; Grabow J.-U.; Fernández J. A.; Castaño F. Ribose Found in the Gas Phase. Angew. Chem., Int. Ed. 2012, 51, 3119–3124. 10.1002/anie.201107973. [DOI] [PubMed] [Google Scholar]
- Peña I.; Cocinero E. J.; Cabezas C.; Lesarri A.; Mata S.; Écija P.; Daly A. M.; Cimas Á.; Bermúdez C.; Basterretxea F. J.; Blanco S.; Fernández J. A.; López J. C.; Castaño F.; Alonso J. L. Six Pyranoside Forms of Free 2-Deoxy-D-Ribose. Angew. Chem., Int. Ed. 2013, 52, 11840–11845. 10.1002/anie.201305589. [DOI] [PubMed] [Google Scholar]
- Cocinero E. J.; Lesarri A.; Écija P.; Cimas Á.; Davis B. G.; Basterretxea F. J.; Fernández J. A.; Castaño F. Free Fructose Is Conformationally Locked. J. Am. Chem. Soc. 2013, 135, 2845–2852. 10.1021/ja312393m. [DOI] [PubMed] [Google Scholar]
- Kouwijzer M. L. C. E.; van Eijck B. P.; Kooijman H.; Kroon J. An extension of theGROMOSforce field for carbohydrates, resulting in improvement of the crystal structure determination of α-D-galactose. Acta Crystallogr., Sect. B: Struct. Sci. 1995, 51, 209–220. 10.1107/s0108768194011262. [DOI] [Google Scholar]
- Galema S. A.; Howard E.; Engberts J. B. F. N.; Grigera J. R. The effect of stereochemistry upon carbohydrate hydration. A molecular dynamics simulation of β-d-galactopyranose and (α,β)-d-talopyranose. Carbohydr. Res. 1994, 265, 215–225. 10.1016/0008-6215(94)00241-x. [DOI] [Google Scholar]
- Kräutler V.; Müller M.; Hünenberger P. H. Conformation, dynamics, solvation and relative stabilities of selected β-hexopyranoses in water: a molecular dynamics study with the gromos 45A4 force field. Carbohydr. Res. 2007, 342, 2097–2124. 10.1016/j.carres.2007.05.011. [DOI] [PubMed] [Google Scholar]
- Rahal-Sekkal M.; Sekkal N.; Kleb D. C.; Bleckmann P. Structures and Energies of D-Galactose and Galabiose Conformers as Calculated by Ab Initio and Semiempirical Methods. J. Comput. Chem. 2003, 24, 806–818. 10.1002/jcc.10223. [DOI] [PubMed] [Google Scholar]
- Islam S. M.; Roy P.-N. Performance of the SCC-DFTB Model for Description of Five-Membered Ring Carbohydrate Conformations: Comparison to Force Fields, High-Level Electronic Structure Methods, and Experiment. J. Chem. Theory Comput. 2012, 8, 2412–2423. 10.1021/ct200789w. [DOI] [PubMed] [Google Scholar]
- Barnett C. B.; Naidoo K. J. Ring Puckering: A Metric for Evaluating the Accuracy of AM1, PM3, PM3CARB-1, and SCC-DFTB Carbohydrate QM/MM Simulations. J. Phys. Chem. B 2010, 114, 17142–17154. 10.1021/jp107620h. [DOI] [PubMed] [Google Scholar]
- Csonka G. I. Proper Basis Set for Quantum Mechanical Studies of Potential Energy Surfaces of Carbohydrates. J. Mol. Struct.: THEOCHEM 2002, 584, 1–4. 10.1016/s0166-1280(02)00096-9. [DOI] [Google Scholar]
- Tvaroška I.; Taravel F. R.; Utille J. P.; Carver J. P. Quantum Mechanical and NMR Spectroscopy Studies on the Conformations of the Hydroxymethyl and Methoxymethyl Groups in Aldohexosides. Carbohydr. Res. 2002, 337, 353–367. 10.1016/s0008-6215(01)00315-9. [DOI] [PubMed] [Google Scholar]
- Lii J.-H.; Chen K.-H.; Allinger N. L. Alcohols, Ethers, Carbohydrates, and Related Compounds. IV. Carbohydrates. J. Comput. Chem. 2003, 24, 1504–1513. 10.1002/jcc.10271. [DOI] [PubMed] [Google Scholar]
- Corchado J. C.; Sánchez M. L.; Aguilar M. A. Theoretical Study of the Relative Stability of Rotational Conformers of α and β-d-Glucopyranose in Gas Phase and Aqueous Solution. J. Am. Chem. Soc. 2004, 126, 7311–7319. 10.1021/ja0398767. [DOI] [PubMed] [Google Scholar]
- Deshmukh M. M.; Gadre S. R.; Cocinero E. J. Stability of Conformationally Locked Free Fructose: Theoretical and Computational Insights. New J. Chem. 2015, 39, 9006–9018. 10.1039/c5nj02106e. [DOI] [Google Scholar]
- Becke A. D. A new mixing of Hartree-Fock and local density-functional theories. J. Chem. Phys. 1993, 98, 1372–1377. 10.1063/1.464304. [DOI] [Google Scholar]
- Momany F. A.; Appell M.; Strati G.; Willett J. L. B3LYP/6-311++G** study of monohydrates of α- and β-d-glucopyranose: hydrogen bonding, stress energies, and effect of hydration on internal coordinates. Carbohydr. Res. 2004, 339, 553–567. 10.1016/j.carres.2003.10.013. [DOI] [PubMed] [Google Scholar]
- Appell M.; Willett J. L.; Momany F. A. DFT study of α- and β-d-mannopyranose at the B3LYP/6-311++G** level. Carbohydr. Res. 2005, 340, 459–468. 10.1016/j.carres.2004.12.010. [DOI] [PubMed] [Google Scholar]
- Momany F. A.; Appell M.; Willett J. L.; Schnupf U.; Bosma W. B. DFT study of α- and β-d-galactopyranose at the B3LYP/6-311++G** level of theory. Carbohydr. Res. 2006, 341, 525–537. 10.1016/j.carres.2005.12.006. [DOI] [PubMed] [Google Scholar]
- Schnupf U.; Willett J. L.; Bosma W. B.; Momany F. A. DFT study of α- and β- d -allopyranose at the B3LYP/6-311++G ** level of theory. Carbohydr. Res. 2007, 342, 196–216. 10.1016/j.carres.2006.12.006. [DOI] [PubMed] [Google Scholar]
- Contreras C. S.; Polfer N. C.; Oomens J.; Steill J. D.; Bendiak B.; Eyler J. R. On the Path to Glycan Conformer Identification: Gas-Phase Study of the Anomers of Methyl Glycosides of N-Acetyl-d-Glucosamine and N-Acetyl-d-Galactosamine. Int. J. Mass Spectrom. 2012, 330–332, 285–294. 10.1016/j.ijms.2012.09.010. [DOI] [Google Scholar]
- Klamt A.; Schüürmann G. COSMO: A New Approach to Dielectric Screening in Solvents with Explicit Expressions for the Screening Energy and Its Gradient. J. Chem. Soc., Perkin Trans. 2 1993, 799–805. 10.1039/p29930000799. [DOI] [Google Scholar]
- Schnupf U.; Willett J. L.; Momany F. DFTMD Studies of Glucose and Epimers: Anomeric Ratios, Rotamer Populations, and Hydration Energies. Carbohydr. Res. 2010, 345, 503–511. 10.1016/j.carres.2009.12.001. [DOI] [PubMed] [Google Scholar]
- Schnupf U.; Momany F. A. DFT Energy Optimization of a Large Carbohydrate: Cyclomaltohexaicosaose (CA-26). J. Phys. Chem. B 2012, 116, 6618–6627. 10.1021/jp208927v. [DOI] [PubMed] [Google Scholar]
- Elstner M.; Seifert G. Density Functional Tight Binding. Philos. Trans. R. Soc., A 2014, 372, 20120483. 10.1098/rsta.2012.0483. [DOI] [PubMed] [Google Scholar]
- Irle S.; Zheng G.; Wang Z.; Morokuma K. The C60Formation Puzzle “Solved”: QM/MD Simulations Reveal the Shrinking Hot Giant Road of the Dynamic Fullerene Self-Assembly Mechanism. J. Phys. Chem. B 2006, 110, 14531–14545. 10.1021/jp061173z. [DOI] [PubMed] [Google Scholar]
- Goyal P.; Qian H.-J.; Irle S.; Lu X.; Roston D.; Mori T.; Elstner M.; Cui Q. Molecular Simulation of Water and Hydration Effects in Different Environments: Challenges and Developments for DFTB Based Models. J. Phys. Chem. B 2014, 118, 11007–11027. 10.1021/jp503372v. [DOI] [PMC free article] [PubMed] [Google Scholar]
- Dewar M. J. S.; Zoebisch E. G.; Healy E. F.; Stewart J. J. P. Development and Use of Quantum Mechanical Molecular Models. 76. AM1: A New General Purpose Quantum Mechanical Molecular Model. J. Am. Chem. Soc. 1985, 107, 3902–3909. 10.1021/ja00299a024. [DOI] [Google Scholar]
- Stewart J. J. P. Comparison of the Accuracy of Semiempirical and Some DFT Methods for Predicting Heats of Formation. J. Mol. Model. 2004, 10, 6–12. 10.1007/s00894-003-0157-6. [DOI] [PubMed] [Google Scholar]
- Stewart J. J. P. Optimization of parameters for semiempirical methods IV: extension of MNDO, AM1, and PM3 to more main group elements. J. Mol. Model. 2004, 10, 155–164. 10.1007/s00894-004-0183-z. [DOI] [PubMed] [Google Scholar]
- Sattelle B. M.; Almond A. Less Is More When Simulating Unsulfated Glycosaminoglycan 3D-Structure: Comparison of GLYCAM06/TIP3P, PM3-CARB1/TIP3P, and SCC-DFTB-D/TIP3P Predictions with Experiment. J. Comput. Chem. 2010, 31, 2932–2947. 10.1002/jcc.21589. [DOI] [PubMed] [Google Scholar]
- Barnett C. B.; Wilkinson K. A.; Naidoo K. J. Pyranose Ring Transition State Is Derived from Cellobiohydrolase I Induced Conformational Stability and Glycosidic Bond Polarization. J. Am. Chem. Soc. 2010, 132, 12800–12803. 10.1021/ja103766w. [DOI] [PubMed] [Google Scholar]
- Elstner M. The SCC-DFTB Method and Its Application to Biological Systems. Theor. Chem. Acc. 2006, 116, 316–325. 10.1007/s00214-005-0066-0. [DOI] [Google Scholar]
- Huang M.; Giese T. J.; Lee T.-S.; York D. M. Improvement of DNA and RNA Sugar Pucker Profiles from Semiempirical Quantum Methods. J. Chem. Theory Comput. 2014, 10, 1538–1545. 10.1021/ct401013s. [DOI] [PMC free article] [PubMed] [Google Scholar]
- Nishimoto Y.; Fedorov D. G.; Irle S. Density-Functional Tight-Binding Combined with the Fragment Molecular Orbital Method. J. Chem. Theory Comput. 2014, 10, 4801–4812. 10.1021/ct500489d. [DOI] [PubMed] [Google Scholar]
- Nishimoto Y.; Nakata H.; Fedorov D. G.; Irle S. Large-Scale Quantum-Mechanical Molecular Dynamics Simulations Using Density-Functional Tight-Binding Combined with the Fragment Molecular Orbital Method. J. Phys. Chem. Lett. 2015, 6, 5034–5039. 10.1021/acs.jpclett.5b02490. [DOI] [PubMed] [Google Scholar]
- Nishimoto Y.; Fedorov D. G. The Fragment Molecular Orbital Method Combined with Density-Functional Tight-Binding and the Polarizable Continuum Model. Phys. Chem. Chem. Phys. 2016, 18, 22047–22061. 10.1039/c6cp02186g. [DOI] [PubMed] [Google Scholar]
- Sakti A. W.; Nishimura Y.; Nakai H. Divide-and-Conquer-Type Density-Functional Tight-Binding Simulations of Hydroxide Ion Diffusion in Bulk Water. J. Phys. Chem. B 2017, 121, 1362–1371. 10.1021/acs.jpcb.6b10659. [DOI] [PubMed] [Google Scholar]
- Nishizawa H.; Nishimura Y.; Kobayashi M.; Irle S.; Nakai H. Three Pillars for Achieving Quantum Mechanical Molecular Dynamics Simulations of Huge Systems: Divide-and-Conquer, Density-Functional Tight-Binding, and Massively Parallel Computation. J. Comput. Chem. 2016, 37, 1983–1992. 10.1002/jcc.24419. [DOI] [PubMed] [Google Scholar]
- Elstner M.; Porezag D.; Jungnickel G.; Elsner J.; Haugk M.; Frauenheim T.; Suhai S.; Seifert G. Self-Consistent-Charge Density-Functional Tight-Binding Method for Simulations of Complex Materials Properties. Phys. Rev. B: Condens. Matter Mater. Phys. 1998, 58, 7260–7268. 10.1103/physrevb.58.7260. [DOI] [Google Scholar]
- Gaus M.; Cui Q.; Elstner M. DFTB3: Extension of the Self-Consistent-Charge Density-Functional Tight-Binding Method (SCC-DFTB). J. Chem. Theory Comput. 2011, 7, 931–948. 10.1021/ct100684s. [DOI] [PMC free article] [PubMed] [Google Scholar]
- Humphrey W.; Dalke A.; Schulten K. VMD: Visual Molecular Dynamics. J. Mol. Graph. 1996, 14, 33–38. 10.1016/0263-7855(96)00018-5. [DOI] [PubMed] [Google Scholar]
- Schmidt M. W.; Baldridge K. K.; Boatz J. A.; Elbert S. T.; Gordon M. S.; Jensen J. H.; Koseki S.; Matsunaga N.; Nguyen K. A.; Su S.; Windus T. L.; Dupuis M.; Montgomery J. A. General Atomic and Molecular Electronic Structure System. J. Comput. Chem. 1993, 14, 1347–1363. 10.1002/jcc.540141112. [DOI] [Google Scholar]
- Frisch M. J.; Trucks G. W.; Schlegel H. B.; Scuseria G. E.; Robb M. A.; Cheeseman J. R.; Scalmani G.; Barone V.; Mennucci B.; Petersson G. A.; Nakatsuji H.; Caricato M.; Li X.; Hratchian H. P.; Izmaylov A. F.; Bloino J.; Zheng G.; Sonnenberg J. L.; Hada M.; Ehara M.; Toyota K.; Fukuda R.; Hasegawa J.; Ishida M.; Nakajima T.; Honda Y.; Kitao O.; Nakai H.; Vreven T.; Montgomery J. A.; Peralta J. E.; Ogliaro F.; Bearpark M.; Heyd J. J.; Brothers E.; Kudin K. N.; Staroverov V. N.; Kobayashi R.; Normand J.; Raghavachari K.; Rendell A.; Burant J. C.; Iyengar S. S.; Tomasi J.; Cossi M.; Rega N.; Millam J. M.; Klene M.; Knox J. E.; Cross J. B.; Bakken V.; Adamo C.; Jaramillo J.; Gomperts R.; Stratmann R. E.; Yazyev O.; Austin A. J.; Cammi R.; Pomelli C.; Ochterski J. W.; Martin R. L.; Morokuma K.; Zakrzewski V. G.; Voth G. A.; Salvador P.; Dannenberg J. J.; Dapprich S.; Daniels A. D.; Farkas Ö.; Foresman J. B.; Ortiz J. V.; Cioslowski J.; Fox D. J.. Gaussian 09, Revision D.01; Gaussian, Inc.: Wallingford CT, 2009.
- Yang Y.; Yu H.; York D.; Elstner M.; Cui Q. Description of Phosphate Hydrolysis Reactions with the Self-Consistent-Charge Density-Functional-Tight-Binding (SCC-DFTB) Theory. 1. Parameterization. J. Chem. Theory Comput. 2008, 4, 2067–2084. 10.1021/ct800330d. [DOI] [PMC free article] [PubMed] [Google Scholar]
- Gaus M.; Goez A.; Elstner M. Parametrization and Benchmark of DFTB3 for Organic Molecules. J. Chem. Theory Comput. 2013, 9, 338–354. 10.1021/ct300849w. [DOI] [PubMed] [Google Scholar]
- Takano Y.; Houk K. N. Benchmarking the Conductor-like Polarizable Continuum Model (CPCM) for Aqueous Solvation Free Energies of Neutral and Ionic Organic Molecules. J. Chem. Theory Comput. 2005, 1, 70–77. 10.1021/ct049977a. [DOI] [PubMed] [Google Scholar]
- Klamt A.; Moya C.; Palomar J. A Comprehensive Comparison of the IEFPCM and SS(V)PE Continuum Solvation Methods with the COSMO Approach. J. Chem. Theory Comput. 2015, 11, 4220–4225. 10.1021/acs.jctc.5b00601. [DOI] [PubMed] [Google Scholar]
- Angyal S. J. The Composition and Conformation of Sugars in Solution. Angew. Chem., Int. Ed. Engl. 1969, 8, 157–166. 10.1002/anie.196901571. [DOI] [Google Scholar]
- Arifin; Yokogawa D.; Schnupf U.; Irle S. Statistical Mechanics-Based Theoretical Investigation of Solvation Effects on Glucose Anomer Preferences. J. Phys. Chem. B 2018, 122, 290–296. 10.1021/acs.jpcb.7b10270. [DOI] [PubMed] [Google Scholar]
- Baboul A. G.; Curtiss L. A.; Redfern P. C.; Raghavachari K. Gaussian-3 Theory Using Density Functional Geometries and Zero-Point Energies. J. Chem. Phys. 1999, 110, 7650–7657. 10.1063/1.478676. [DOI] [Google Scholar]
- Curtiss L. A.; Raghavachari K.; Redfern P. C.; Rassolov V.; Pople J. A. Gaussian-3 (G3) Theory for Molecules Containing First and Second-Row Atoms. J. Chem. Phys. 1998, 109, 7764–7776. 10.1063/1.477422. [DOI] [Google Scholar]
- Řezáč J.; Hobza P. Advanced Corrections of Hydrogen Bonding and Dispersion for Semiempirical Quantum Mechanical Methods. J. Chem. Theory Comput. 2012, 8, 141–151. 10.1021/ct200751e. [DOI] [PubMed] [Google Scholar]
- Kubillus M.; Kubař T.; Gaus M.; Řezáč J.; Elstner M. Parameterization of the DFTB3 Method for Br, Ca, Cl, F, I, K, and Na in Organic and Biological Systems. J. Chem. Theory Comput. 2015, 11, 332–342. 10.1021/ct5009137. [DOI] [PubMed] [Google Scholar]
- Grimme S.; Antony J.; Ehrlich S.; Krieg H. A Consistent and Accurate Ab Initio Parametrization of Density Functional Dispersion Correction (DFT-D) for the 94 Elements H-Pu. J. Chem. Phys. 2010, 132, 154104. 10.1063/1.3382344. [DOI] [PubMed] [Google Scholar]
- Voegele A. F.; Tautermann C. S.; Loerting T.; Liedl K. R. Toward Elimination of Discrepancies between Theory and Experiment: The Gas-Phase Reaction of N2O5 with H2O. Phys. Chem. Chem. Phys. 2003, 5, 487–495. 10.1039/b208936j. [DOI] [Google Scholar]
- Xiu-Juan Q.; Yong F.; Lei L.; Qing-Xiang G. Assessment of Performance of G3B3 and CBS-QB3 Methods in Calculation of Bond Dissociation Energies. Chin. J. Chem. 2005, 23, 194–199. 10.1002/cjoc.200590194. [DOI] [Google Scholar]
- Curtiss L. A.; Redfern P. C.; Raghavachari K. Assessment of Gaussian-3 and Density-Functional Theories on the G3/05 Test Set of Experimental Energies. J. Chem. Phys. 2005, 123, 124107. 10.1063/1.2039080. [DOI] [PubMed] [Google Scholar]
- Curtiss L. A.; Raghavachari K.; Redfern P. C.; Pople J. A. Assessment of Gaussian-3 and Density Functional Theories for a Larger Experimental Test Set. J. Chem. Phys. 2000, 112, 7374–7383. 10.1063/1.481336. [DOI] [PubMed] [Google Scholar]
- Range K.; Riccardi D.; Cui Q.; Elstner M.; York D. M. Benchmark Calculations of Proton Affinities and Gas-Phase Basicities of Molecules Important in the Study of Biological Phosphoryl Transfer. Phys. Chem. Chem. Phys. 2005, 7, 3070. 10.1039/b504941e. [DOI] [PubMed] [Google Scholar]
- Lan Y.; Zou L.; Cao Y.; Houk K. N. Computational Methods to Calculate Accurate Activation and Reaction Energies of 1,3-Dipolar Cycloadditions of 24 1,3-Dipoles. J. Phys. Chem. A 2011, 115, 13906–13920. 10.1021/jp207563h. [DOI] [PubMed] [Google Scholar]
- Gordon M. S.; Jensen J. H. Understanding the Hydrogen Bond Using Quantum Chemistry. Acc. Chem. Res. 1996, 29, 536–543. 10.1021/ar9600594. [DOI] [Google Scholar]
- Maupin C. M.; Aradi B.; Voth G. A. The Self-Consistent Charge Density Functional Tight Binding Method Applied to Liquid Water and the Hydrated Excess Proton: Benchmark Simulations. J. Phys. Chem. B 2010, 114, 6922–6931. 10.1021/jp1010555. [DOI] [PubMed] [Google Scholar]
- Domínguez A.; Niehaus T. A.; Frauenheim T. Accurate Hydrogen Bond Energies within the Density Functional Tight Binding Method. J. Phys. Chem. A 2015, 119, 3535–3544. 10.1021/acs.jpca.5b01732. [DOI] [PubMed] [Google Scholar]
- Gaus M.; Cui Q.; Elstner M. Density Functional Tight Binding: Application to Organic and Biological Molecules. Wiley Interdiscip. Rev.: Comput. Mol. Sci. 2014, 4, 49–61. 10.1002/wcms.1156. [DOI] [Google Scholar]
- Perdew J. P.; Burke K.; Ernzerhof M. Generalized Gradient Approximation Made Simple. Phys. Rev. Lett. 1996, 77, 3865–3868. 10.1103/physrevlett.77.3865. [DOI] [PubMed] [Google Scholar]
- Bodrog Z.; Aradi B. Possible Improvements to the Self-Consistent-Charges Density-Functional Tight-Binding Method within the Second Order. Phys. Status Solidi B 2012, 249, 259–269. 10.1002/pssb.201100524. [DOI] [Google Scholar]
- Grimme S.; Hansen A.; Brandenburg J. G.; Bannwarth C. Dispersion-Corrected Mean-Field Electronic Structure Methods. Chem. Rev. 2016, 116, 5105–5154. 10.1021/acs.chemrev.5b00533. [DOI] [PubMed] [Google Scholar]
- Grimme S.; Ehrlich S.; Goerigk L. Effect of the Damping Function in Dispersion Corrected Density Functional Theory. J. Comput. Chem. 2011, 32, 1456–1465. 10.1002/jcc.21759. [DOI] [PubMed] [Google Scholar]
- Kozmon S.; Matuška R.; Spiwok V.; Koča J. Dispersion interactions of carbohydrates with condensate aromatic moieties: Theoretical study on the CH-π interaction additive properties. Phys. Chem. Chem. Phys. 2011, 13, 14215. 10.1039/c1cp21071h. [DOI] [PubMed] [Google Scholar]
- King M. D.; Buchanan W. D.; Korter T. M. Application of London-Type Dispersion Corrections to the Solid-State Density Functional Theory Simulation of the Terahertz Spectra of Crystalline Pharmaceuticals. Phys. Chem. Chem. Phys. 2011, 13, 4250. 10.1039/c0cp01595d. [DOI] [PubMed] [Google Scholar]
- Řezáč J. Cuby: An Integrative Framework for Computational Chemistry. J. Comput. Chem. 2016, 37, 1230–1237. 10.1002/jcc.24312. [DOI] [PubMed] [Google Scholar]
- Deshmukh M. M.; Bartolotti L. J.; Gadre S. R. Intramolecular Hydrogen Bonding and Cooperative Interactions in Carbohydrates via the Molecular Tailoring Approach. J. Phys. Chem. A 2008, 112, 312–321. 10.1021/jp076316b. [DOI] [PubMed] [Google Scholar]
Associated Data
This section collects any data citations, data availability statements, or supplementary materials included in this article.


