Abstract
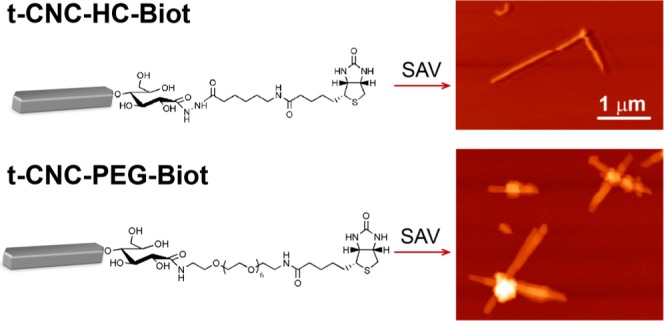
In this work, we take advantage of the parallel organization of cellulose chains in cellulose I yielding an inherent chemical asymmetry of cellulose nanocrystals, i.e., reducing vs nonreducing end, to selectively modify only one end of these rigid rodlike crystals to be used as a linking point for the formation of supramolecular structures. We have prepared biotin-functionalized tunicate cellulose nanocrystals at the reducing end capable of forming new complex supramolecular hierarchies by the addition of the protein streptavidin. Biotin–streptavidin coupling was chosen because streptavidin has a multivalency of four and the biotin–streptavidin bond is known to be highly selective and stable. Hence, streptavidin molecules would link up to four cellulose nanocrystals through their biotin-modified reducing end. Two biotin derivatives were studied, consisting of an anchoring group, i.e., amine or hydrazine; the biotin moiety; and the linker between them. Results show that the length of the linker significantly affects the bond between the biotinylated cellulose nanocrystals and streptavidin, and a certain chain length is necessary for the supramolecular assembly of several cellulose nanocrystals by streptavidin.
Introduction
Nanocelluloses have emerged as unique nanomaterials obtained from the most abundant natural polymer available in Nature.1,2 Cellulose is present in a wide variety of living species, such as animals, plants, and bacteria.3 It can be considered a structural polymer that supports life and has demonstrated intrinsic performance properties derived from the arrangement of the cellulose macromolecules into the supramolecular crystalline structures during cell wall formation.4 Cellulose is a linear polymer composed of β-(1–4)-linked d-glucose units arranged in a parallel highly crystalline cellulose I structure. The presence of three hydroxyl groups and C–H bonds in each glucose unit leads to the formation of intra- and intermolecular strong hydrogen bonds and van der Waals interactions that promote parallel stacking of multiple cellulose chains forming elementary fibrils that further aggregate into larger microfibrils.3,5 Cellulose fibers are composed of highly crystalline domains and amorphous regions; the latter can be hydrolyzed by acid to isolate rodlike cellulose nanocrystals (CNC).6 The CNC can be viewed as rigid crystallites of high aspect ratio (defined as the length-to-width, L/w) whose dimensions are around 5–20 nm in width (w) and 50–2000 nm in length (L), depending on their biological origin. Hence, cotton CNC are 5–10 nm in width and no more than 500 nm in length, bacterial cellulose are crystallites of 10–20 nm in width and 500–1000 nm in length, and nanocrystals from tunicate present width of around 5–30 nm and length of several microns.7−9
As nanocelluloses, cellulose nanocrystals have shown unique properties such as strengthening effect and good mechanical and barrier properties to be exploited as reinforcing agents in nanocomposites, paper making, packaging, coating additives, rheological modifiers, membranes, or gas barriers.7,8,10 Furthermore, they act as emulsion stabilizers in a wide variety of applications including paintings, cosmetics, and food industry, among others.11 Other interesting properties of cellulose nanocrystals include transparency, low thermal expansion, and optical properties.6,7
A particular feature of the structure of nanocelluloses is the inherent directionality of cellulose chains, i.e., nonreducing end (C4–OH) vs reducing end (C1=O). The different reactivity of hemiacetals compared to hydroxyl groups makes them an interesting experimental platform for the selective introduction of the desired functionalities at the reducing end of the nanocelluloses, creating nano-objects with chemically differentiated ends. At present, very few studies have focused on site-specific modification of nanoparticles.12−15 Hence, Lokanathan et al. selectively introduced thiol groups at the reducing ends of cellulose nanocrystals, which allowed the controlled coupling to silver nanoparticles or the chemisorption onto gold surfaces by the reducing end.13,14 Also, Yang et al. have employed click chemistry as a strategy for the end-to-end assembly of cellulose nanocrystals to form nanofibers.16 Indeed, polymer chains have been introduced at cellulose reducing ends by both “grafting to” and “grafting from” methods.12 In a recent publication, Zoppe et al. succeeded in polymerizing different monomers tethered at the reducing ends of cellulose nanocrystals by atom transfer radical polymerization.15 Therefore, asymmetric functionalization seems to be an efficient strategy for precise manipulation of the way rigid rodlike cellulose crystals assemble with each other and with other components.
In this work, we report the selective introduction of biotin functionality at the reducing end of CNC by the carbodiimide-mediated reaction. The method involves oxidation of carbonyl groups and their subsequent nucleophilic attack by amine-containing biotin derivatives. Biotin is a small molecule (244.31 Da) that has a strong affinity for the tetravalent protein streptavidin (SAV). The biotin–streptavidin association is highly specific and stable and the strongest known noncovalent interaction between protein and ligand (Ka ≈ 1015 L mol–1).17 Streptavidin is a ≈56 kDa homotetramer with subunits arrayed in D2 symmetry that can act as a multivalent linker capable of complexing up to four biotin molecules. The aim of this work is therefore the precise association of biotin-functionalized tunicate cellulose nanocrystals (t-CNC) by adding streptavidin. Confirmation of the topochemical nature of biotinylation to produce asymmetric nanoparticles that assemble by streptavidin was assessed by quartz crystal microbalance with dissipation (QCM-D), dynamic light scattering (DLS), and atomic force microscopy (AFM).
Results and Discussion
t-CNC Characterization
Among the available cellulose nanocrystals, we focused on tunicate cellulose nanocrystals (t-CNC) because of their high aspect ratio (approximately 50–100) and rather homogeneous length distribution compared to cotton or wood cellulose nanocrystals.6 The t-CNCs were obtained from Styela clava through a treatment consisting of cooking, bleaching, and acid hydrolysis (see Experimental Section). Because they are negatively charged due to the presence of sulfate groups introduced during acid hydrolysis, the obtained t-CNCs formed stable colloidal suspensions in water. The stability of the t-CNC colloidal dispersions was confirmed by the value of ζ-potential (−12.4 ± 2.4 mV), comparable to the values reported in literature for tunicate nanocrystals prepared by acid hydrolysis,18 which indicated the repulsion between adjacent, similarly negatively charged nanocrystals in water suspension.19 The average Z-size obtained by dynamic light scattering (DLS) was 200.5 ± 8.1 nm. The surface charge density, calculated by conductometric titration (Figure S1), was 0.022 ± 0.001 mmol g–1, according to the values previously reported for cellulose nanocrystals.18
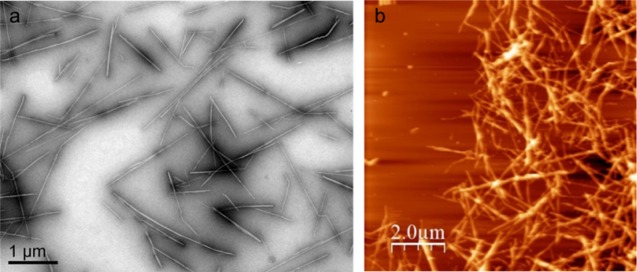
The morphology and structural features of the t-CNCs were evaluated by transmission electron microscopy (TEM) and atomic force microscopy (AFM) (Figure 1). The t-CNCs appeared as long rodlike nanocrystals and were well individualized; there was no evidence of large-scale aggregation, as previously described.9,18 The accurate measurement of the t-CNC dimensions by AFM was difficult because nanocrystals formed a network onto the mica substrate and both ends were not clearly identified. A detailed analysis of the TEM images revealed an average length of 1360 ± 630 nm and an average width of 10.6 ± 3.1 nm, which resulted in an aspect ratio, defined as the length-to-width (L/w) of 130, according to the previously described dimensions for tunicate cellulose nanocrystals.6,9
Figure 1.
Morphology images of tunicate nanocrystals (t-CNC): transmission electron microscopy (TEM) (a) and atomic force microscopy (AFM) (b).
Introduction of Biotin Functionality at the Reducing Ends of t-CNC
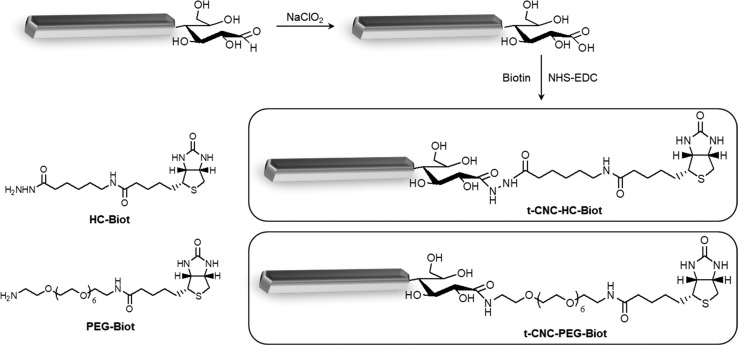
The reaction of introduction of the biotin moiety at the reducing ends of t-CNCs and the structures of the two biotin derivatives studied are shown in Scheme 1. At first, the reducing ends were oxidized to carboxylic acids and then, the biotin functionality was introduced by a covalent amide bond after NHS–EDC activation. Two different biotin-functionalized molecules were investigated for the introduction of the biotin moiety at the t-CNC reducing ends (Scheme 1): (+)-biotinamidohexanoic acid hydrazide (HC-Biot), which consists of the biotin functionality amide-linked to a hydrazide by a 6-carbon aliphatic chain; and biotin-dPEG7-NH2 (PEG-Biot), in which the biotin is amide-linked to an amine by a poly(ethylene glycol) (PEG) chain of seven repeating units. The elemental composition of the reaction products after oxidation and biotin introduction is compiled in Table 1. Elemental analysis was preferably used because chemical modification of the reducing ends represented a very low amount of new chemical groups in the structure that cannot be detected by spectroscopy techniques (see discussion below) compared to the polymer adsorption or modification of hydroxyl groups along the nanocrystal surface.20 As unmodified t-CNCs were devoid of nitrogen, elemental analysis allowed the detection of the biotin and amide groups. Similar strategies have been recently used successfully for the characterization of low-density modification of cellulose nanofibrils by poly(ethylene glycol) (PEG) moieties through NHS–EDC coupling,21 or the polymerization of N-isopropylacrylamide, [2-(methacryloyloxy)ethyl]trimethylammonium chloride, or sodium 4-vinylbenzenesulfonate at the reducing ends of cellulose nanocrystals.15
Scheme 1. Schematic Illustration of the Synthetic Protocol Used to Introduce the Biotin Functionality at the Reducing End of Tunicate Nanocrystals (Represented as Gray Rectangles), Involving a First Step of Oxidation of Carbonyl Groups and a Second Step of the Acid–Amine Coupling by N-Hydroxysuccinimide (NHS)–N-(3-Dimethylaminopropyl)-N-ethylcarbodiimide Hydrochloride (EDC) Chemistry.
The structures of the two biotin derivatives: (+)-biotinamidohexanoic acid hydrazide (HC-Biot) and biotin-dPEG7-NH2 (PEG-Biot) (left bottom). Dimensions of t-CNC and biotin derivatives are not scaled.
Table 1. Elemental Compositions and Elemental C/N Ratios for Unmodified (t-CNC), Oxidized (t-CNC–COOH), and Biotin-Functionalized (t-CNC–HC-Biot and t-CNC–PEG-Biot, Respectively) Tunicate Nanocrystalsa.
| N (%) | C (%) | S (%) | C/N | |
|---|---|---|---|---|
| t-CNC | 0.005 ± 0.001 | 43.7 ± 0.080 | 0.499 ± 0.036 | 8820 ± 926 |
| t-CNC–COOH | 0.002 ± 0.001 | 42.6 ± 0.014 | 0.545 ± 0.006 | 29836 ± 8643 |
| t-CNC–HC-Biot | 0.017 ± 0.010 | 43.2 ± 0.356 | 0.419 ± 0.070 | 3380 ± 2636 |
| t-CNC–PEG-Biot | 0.008 ± 0.004 | 43.4 ± 0.265 | 0.418 ± 0.091 | 6000 ± 2116 |
Determinations were made in triplicate and results are expressed as mean ± standard deviation.
Both biotin-functionalized t-CNCs showed higher nitrogen contents compared to the starting t-CNCs or oxidized t-CNCs. In fact, the very low nitrogen content of t-CNC and t-CNC–COOH was insignificant taking into account the detection limits of the instrument. Even if the nitrogen content was not statistically different between the samples (analysis of variance, Tukey post-test, P 0.05), results suggested a higher content of nitrogen in the case of biotin-functionalized nanocrystals. According to the carbon–nitrogen ratio, for t-CNC–HC-Biot, there was a molecule of biotin for each 2800 glucose molecules, and for t-CNC–PEG-Biot, the ratio is one biotin per 4000 glucoses, which suggested that several biotin molecules could be introduced at the t-CNC reducing end. Concerning the sulfur content, the introduction of a sulfur atom present in the biotin structure was not detected by elemental analysis because the variation was under the detection limit. The preparation of t-CNCs involves the hydrolysis of tunicate fibers by sulfuric acid, which confers negatively charged half ester sulfate groups to the t-CNC surface. According to Table 1, the sulfur content did not change significantly upon oxidation or amide coupling, which indicated that the sulfate groups are not removed during reactions.
Figure S2 shows the Fourier-transform infrared (FTIR) spectra of the oxidized t-CNC and both biotin-functionalized t-CNC in comparison to unmodified t-CNC. The FTIR spectrum of unmodified t-CNCs (bottom trace) revealed typical cellulose structural characteristics.18,22 After oxidation, the spectrum did not show the C=O stretching band from acid (COOH) at 1730 cm–1.23 Similarly, the presence of the C=O stretching from amide I bonding at 1645 cm–1 or the C–N stretching and N–H deformation from amide II at 1545 cm–124 were not detected in both biotin-functionalized t-CNCs. The absence of these bands is unsurprising according to the elemental analysis data that showed a very small number of COOH or amide bonds introduced at the t-CNC reducing end. Previous studies have revealed that a higher number of functional groups (such as in the modification of hydroxyl groups along the nanocrystals surface, or in the case of the introduction of polymers instead of single molecules) are necessary for the detection of such groups by FTIR.20 In the case of biotin-functionalized t-CNCs, a small signal from the amide bonds would be overlapped with the band at 1635 cm–1 corresponding to the symmetric deformation vibration of the adsorbed water molecules.25
From the FTIR spectra, the crystalline order of cellulose chains within the nanocrystal can be estimated by the calculation of the lateral order and the total crystalline indexes. The lateral order index (LOI) expresses the degree of order and therefore gives information of crystalline modifications.26 It is defined as the ratio of the band at 1430 cm–1 to the band at 895 cm–1. The band at 1430 cm–1 is attributed to the CH2 symmetric bending or scissoring motion at C(6), and it is known to be very sensitive to changes in conformation. On the other hand, the band at 895 cm–1, ascribed to C(1) vibrations, is not affected by changes in crystallinity.27 The total crystalline index (TCI)28 is the ratio of the absorption peaks at 1372 cm–1 (−CH bending) to the peak at 2900 cm–1, ascribed to the C(6) vibration of hydroxymethyl group from the crystalline form of cellulose Iβ. Table S1 shows the values of LOI and TCI for unmodified, oxidized, and biotin-functionalized t-CNC. There was no significant difference between LOI values (3.33–3.82) and TCI values (0.91–0.99) of modified and unmodified t-CNCs, which suggested that the crystalline structure of t-CNCs was not significantly modified by the functionalization at the reducing ends.
Assembly of Biotin-Functionalized t-CNCs by Streptavidin (SAV)
The binding affinity between biotin and streptavidin was used as a strategy for assembling several t-CNCs by their reducing ends. Streptavidin (SAV) has four binding sites per molecule and the streptavidin–biotin complex is one of the strongest bindings that only dissociates in harsh conditions, such as high temperature or formamide treatments.29 The binding energy derives from different contributions of noncovalent interactions between biotin and streptavidin. There are three binding features critical to the strength of the streptavidin–biotin interaction: (i) hydrophobic van der Waals interaction forces arising from tryptophan contacts to biotin, (ii) a large number of specific hydrogen bonds, and (iii) a flexible surface loop of streptavidin moving to a close conformation when biotin is bound to its site inside the β-barrel of the streptavidin molecule.30,31 Biotin is therefore confined in the active site of streptavidin by hydrogen bonds and van der Waals interactions among nonpolar groups. The binding of biotin-functionalized t-CNCs was investigated by quartz crystal microbalance with dissipation (QCM-D). The objective of this set of experiments was to demonstrate the selective binding of biotin-functionalized t-CNCs to SAV surfaces, similar to the chemisorption of thiol-functionalized cellulose nanocrystals to gold surfaces described by Lokanathan et al.,13 so that t-CNCs functionalized at reducing ends would adsorb by one end and repel each other by electrostatic interaction between sulfate groups.
Tunicate nanocrystals (unmodified or biotin-functionalized) did not deposit onto uncoated QCM-D gold substrates because the sulfate groups prevented the adsorption onto negatively charged gold surfaces. Therefore, no change in frequency or dissipation was observed (Figure S3). Once discarded the unspecific adsorption on gold, streptavidin was deposited onto gold substrates and the changes in frequency and dissipation were monitored upon time. When streptavidin was deposited from water solutions at pH 5–6, unspecific adsorption of both unmodified and biotin-modified t-CNCs was observed (Figure S4). The pI of streptavidin is around 5–6;32 therefore, the protein was close to its isoelectric point, and both unmodified and biotin-functionalized t-CNCs could be adsorbed by electrostatic interactions between their charged sulfate groups and the SAV layer. To prevent the unspecific t-CNC adsorption, streptavidin was deposited at pH 7 so that the SAV layer will be negatively charged. Figure 2 shows the changes in frequency and dissipation of SAV-coated surfaces at pH 7 upon the injection of unmodified and biotin-functionalized t-CNCs.
Figure 2.
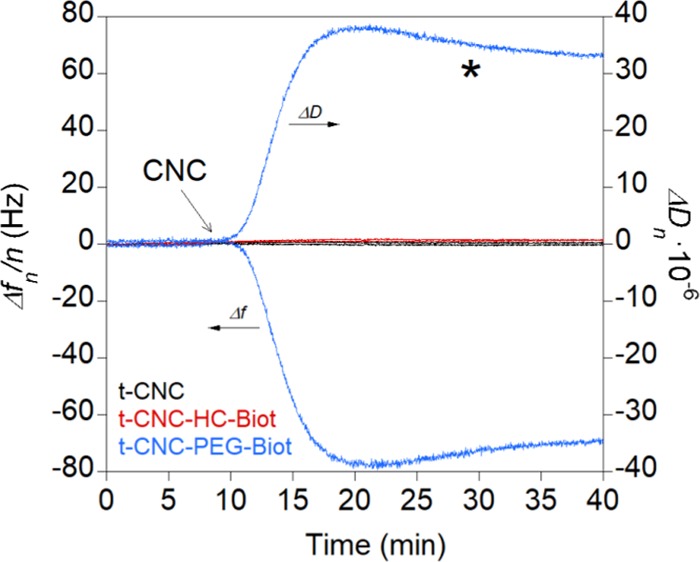
Frequency (Δfn/n) and dissipation (ΔDn) changes in the overtone n = 3 during adsorption of unmodified t-CNCs and biotin-functionalized t-CNCs (t-CNC–HC-Biot and t-CNC–PEG-Biot, respectively) at 0.5 g L–1 onto SAV surfaces in buffered solutions (10 mM phosphate) at pH 7. The arrow indicates the injection of t-CNC, t-CNC–HC-Biot, or t-CNC–PEG-Biot and asterisk indicates the rinse step with phosphate buffer.
In the case of unmodified t-CNCs (black line), the frequency and dissipation did not change, which indicated that the t-CNCs were not adsorbed onto the SAV layer. This fact was not surprising because at pH 7, SAV is negatively charged; therefore, the sulfate groups will prevent the adsorption of t-CNCs. When t-CNC–HC-Biot were injected (red line), no change was detected in frequency, suggesting that there was no adsorption onto the SAV layer. In contrast, in the case of t-CNC–PEG-Biot (blue line), a great change in frequency and dissipation was observed, indicating their adsorption onto the SAV layer. The irreversibility of the binding was assessed by rinsing with phosphate buffer, which did not induce significant frequency or dissipation changes. Upon repeating the binding experiment, the changes in frequency at the end of the adsorption varied among the experiments from −7 to −230 Hz and dissipation values varied from 4 × 10⁻⁶ to 108 × 10–6 (five different experiments), and in all cases, the rinsing step did not modify either frequency or dissipation response (Table S2, first line). These variations could be ascribed to different amounts of t-CNC–PEG-Biot bound to the SAV layer. Unspecific adsorption of tunicate nanocrystals was discarded based on the results of unmodified t-CNCs; therefore, the differences in the t-CNC–PEG-Biot frequency values from one experiment to the other may arise from the different orientations of t-CNC–PEG-Biot in a solution so that only those nanocrystals in which the biotin functionality was close to the SAV surface would be capable of binding the SAV layer.
To get more insight into the selective binding to SAV-coated surfaces by the reducing ends of biotin-functionalized t-CNCs, the adsorption of unmodified t-CNCs onto positive polymer layers was monitored by QCM-D. For this purpose, we deposited a layer of poly(allylamine hydrochloride) (PAH) on gold substrates by spin-coating (see Supporting Information for more details). Figure S5 shows the changes in frequency and dissipation upon the adsorption of unmodified t-CNC onto the PAH layers (green line) compared to the binding of biotin-functionalized t-CNC onto the SAV layers. The changes in frequency and dissipation were greater for the adsorption of unmodified t-CNC onto the PAH-coated substrates compared to the binding of t-CNC–PEG-Biot to the SAV layers. In the case of the PAH layer, unmodified t-CNC will adsorb in a flat orientation by electrostatic interactions of sulfate groups along the whole surface, whereas t-CNC–PEG-Biot would adsorb in a rather perpendicular orientation with reducing ends anchored to the SAV surface by the specific SAV–biotin binding. The different viscoelastic behavior of the layers was investigated by the change in dissipation as a function of frequency (ΔDn – Δfn/n) (Figure 3).
Figure 3.
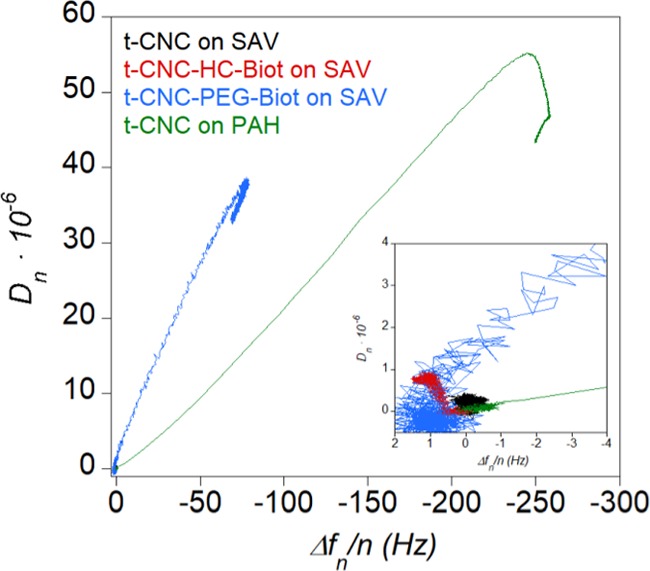
Change in dissipation as a function of the change in frequency (ΔDn – Δfn/n) of the overtone n = 3 corresponding to unmodified t-CNC and biotin-functionalized t-CNC (t-CNC–HC-Biot and t-CNC–PEG-Biot, respectively) at 0.5 g L–1 adsorbed onto SAV-coated surfaces at pH 7. For the purpose of comparison, the ΔDn – Δfn/n plot for the adsorption of unmodified t-CNC at 0.5 g L–1 onto PAH-coated surfaces has been depicted (green line). The inset shows the low frequency and dissipation values in more detail.
In the case of the adsorption of t-CNC–HC-Biot on SAV, dissipation did not change considerably with frequency and slightly fell off until reaching zero. This behavior could confirm the absence of adsorption of t-CNC–HC-Biot onto the SAV layer. For the adsorption of t-CNC–PEG-Biot on SAV, ΔDn increased linearly with increasing frequency, similar to the adsorption of unmodified t-CNC onto PAH, which suggested that nanocrystals did not undergo significant orientation changes in the course of the adsorption process.33 It should be noted that the change in dissipation for the adsorption of t-CNC–PEG-Biot on SAV is 3 times larger than that for the adsorption of t-CNC on PAH (Table S2). The slope of the ΔDn – Δfn/n plot reveals at any point of the curve how much dissipation is induced by frequency unit, allowing a comparison of the viscoelasticity characteristics of the films.34,35 Hence, the higher slope found for the t-CNC–PEG-Biot–SAV system may indicate that the t-CNC formed a thicker, hydrated, and viscoelastic layer on SAV, compared to the thinner and more rigid and flatly adsorbed t-CNC onto PAH. This behavior had been previously described for the chemisorption of thiol-functionalized cellulose nanocrystals adsorbed onto gold surfaces compared to unmodified cellulose nanocrystals and has been ascribed to the different CNC orientations on the surface.13
The assembly of several t-CNC by SAV was then evaluated by the change in the Z-size distribution determined by dynamic light scattering (DLS). The DLS measures the diffusion coefficient of the particles in dispersion, which is then converted into a hydrodynamic diameter by the Stokes–Einstein equation. Therefore, the Z-size obtained by DLS is the diameter of a spherical volume encapsulating a rotating, nonmoving rodlike nanocrystal and not its actual dimensions. In fact, depending on the relaxation mode used for the size calculation, the length of tunicate nanocrystals may vary from 230–270 to 1160 nm from the DLS measurements.36 The hydrodynamic diameter values were thus used qualitatively and comparatively. The corresponding nanoparticle size distributions are plotted in Figure 4. The Z-average diameter values and the polydispersity indexes are shown in Table S3.
Figure 4.
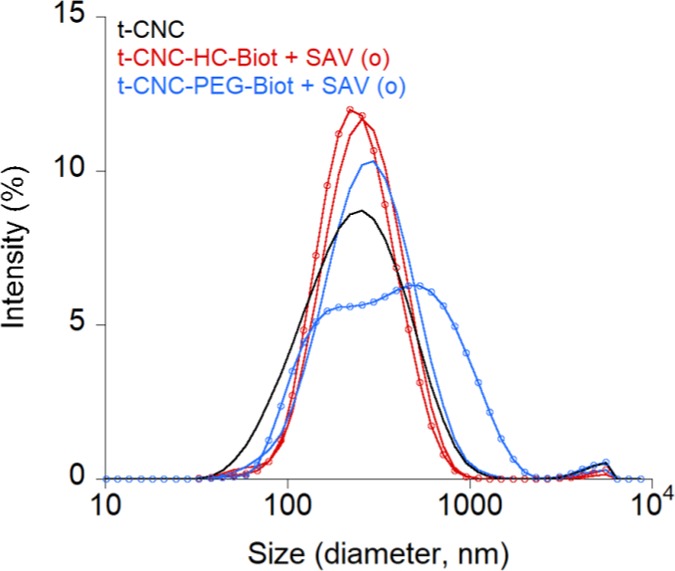
Size distribution (intensity) curves of t-CNC at 0.2 g L–1 aqueous dispersions of unmodified t-CNC (black line) and both biotin-functionalized t-CNC (t-CNC–HC-Biot, red lines, and t-CNC–PEG-Biot, blue lines, respectively). The size distribution plots after streptavidin addition are indicated by the lines + circles.
For both HC-biotin and PEG-biotin-functionalized t-CNC, a monomodal size distribution centered around 220 and 230 nm, respectively, was observed, showing the absence of aggregates. Compared to the Z-average diameter of unmodified t-CNC (200 ± 8 nm), there is a slight increase in the hydrodynamic volumes observed for biotin-functionalized t-CNC (226 ± 8 and 244 ± 10 nm, for t-CNC–HC-Biot and t-CNC–PEG-Biot, respectively), which could be associated with the variability in the DLS measurement.
In the case of t-CNC–HC-Biot, the addition of SAV did not produce a remarkable effect on size distribution (red line + circles), and the Z-average diameter was not significantly modified. In contrast, the size distribution became bimodal for t-CNC–PEG-Biot containing SAV (blue line + circles), indicating the presence of at least two populations showing different hydrodynamic volume. Even if the calculated Z-average diameter was not significantly modified, the size distribution presented two maxima at 200 and 460 nm, indicating that t-CNC–PEG-Biot formed complexes by the addition of SAV. Therefore, the peak at 200 nm corresponded to isolate t-CNC–PEG-Biot and the peak at 460 nm could be ascribed to complexes of several t-CNC–PEG-Biot linked by SAV, which demonstrates the specific association.
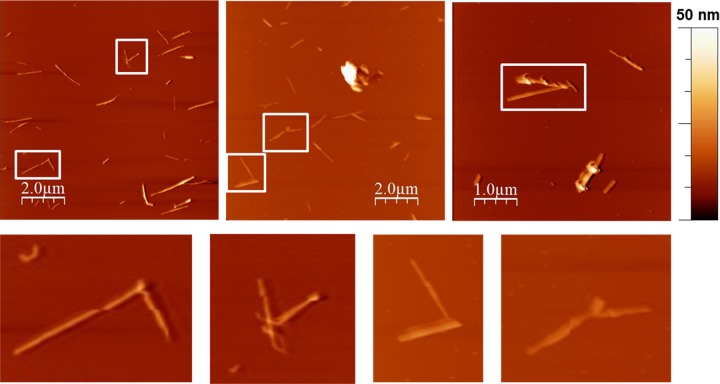
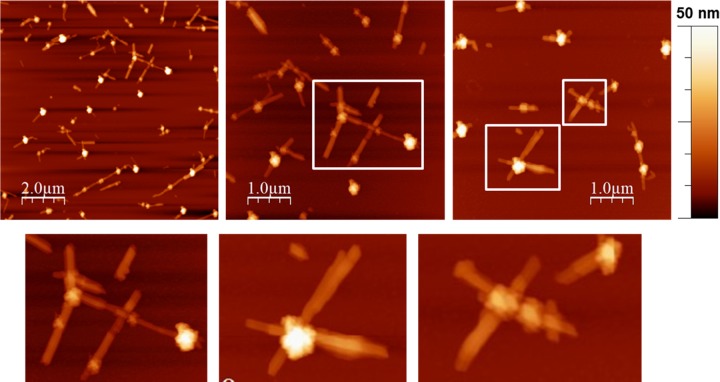
To directly visualize the assembly of biotin-functionalized t-CNC, the complexes containing SAV were investigated by AFM. Figures 5 and 6 show the topographical images of t-CNC–HC-Biot and t-CNC–PEG-Biot, respectively, assembled by SAV and deposited onto mica substrates.
Figure 5.
Representative AFM topographical images of t-CNC–HC-Biot after the addition of streptavidin deposited onto mica surfaces at 0.1 g L–1. Bottom images show details of the complexes formed by two tunicate cellulose nanocrystals and streptavidin (white squared in top images).
Figure 6.
Representative AFM topographical images of t-CNC–PEG-Biot after the addition of streptavidin, deposited onto mica surfaces at 0.1 g L–1. Bottom images show details of the complexes formed by four tunicate cellulose nanocrystals and streptavidin (white squared in top images).
In the case of t-CNC–HC-Biot, the images showed several isolated nanocrystals and certain t-CNC–HC-Biot end-to-end assembled by two. In contrast, the images from t-CNC–PEG-Biot showed a higher degree of association between nanocrystals. In this case, it was possible to detect star-like assemblies consisting of four nanocrystals connected end-to-end by SAV. The AFM images from t-CNC–PEG-Biot also showed that, in some cases, streptavidin was coupled to the surface of the nanocrystals instead of the reducing end. This fact could be due to the presence of shorter cellulose chains on the nanocrystal, resulting from some kind of damage during reactions. The strikingly different behaviors between t-CNC–HC-Biot and t-CNC–PEG-Biot were consistent with the differences observed on QCM-D and DLS experiments. The self-assembly of the t-CNC–HC-Biot seems to be more difficult than the t-CNC–PEG-Biot association. Hence, t-CNC–HC-Biot were scarcely associated by SAV forming assemblies composed of two nanocrystals, which justified the unnoticeable effect on the size distribution in DLS and the lack of adsorption in QCM-D. In contrast, up to four t-CNC–PEG-Biot were assembled by the SAV complexation, which was detected as a bimodal size distribution. This self-assembly behavior was also highly consistent with the strong adsorption pattern detected by QCM-D. These results revealed the role of the spacer linking the biotin moiety and the anchoring group (hydrazine or amine, for t-CNC–HC-Biot and t-CNC–PEG-Biot, respectively). SAV is a tetravalent protein composed of two dimers, within which the monomers are in intimate contact.37 For biotin itself, even if streptavidin changes in conformation and biotin binding closes off sites,38 there is no negative cooperativity in the binding, and up to four biotin molecules can bind to the protein. However, Fairhead et al.39 have demonstrated that large biotinylated ligands, such as DNA, show a strong negative binding cooperativity if the binding sites in the SAV structure are arranged in cis conformation and not in trans orientation. t-CNC can be considered as very large biotinylated ligands that would inhibit binding by steric hindrance. In this study, we have chosen two different spacers for facilitating the biotin–streptavidin assembly. In the case of t-CNC–HC-Biot, the 6-carbon aliphatic chain seemed to be short enough to prevent the complexation of two nanocrystals to the same side of streptavidin. The AFM images showed the binding of two nanocrystals, which would suggest that t-CNC–HC-Biot already linked to SAV produced negative cooperativity at the same dimer, whereas the binding to the trans dimer was possible. In contrast, for t-CNC–PEG-Biot, as the spacer increased in length, in our study, the PEG chain of seven repeating units, steric hindrance seemed to be reduced, and therefore, t-CNC–PEG-Biot could occupy the four binding sites of SAV to form star-like assemblies.
This article proposes a smart route for controlled supramolecular association of cellulose nanocrystals. A straightforward modification at the reducing end, the introduction of a biotin moiety, has demonstrated to act as an anchoring point for the assembly by a multivalent protein. Cellulose nanocrystals demonstrate their potential use as scaffolds for the fabrication of nanomaterials with novel supramolecular architectures.
Conclusions
In this work, we have modified tunicate cellulose nanocrystals by the introduction of biotin functionality at their reducing ends. The objective was the specific and controlled supramolecular assembly of several nanocrystals by the addition of streptavidin, a protein that can bind up to four biotin molecules. Results demonstrated that biotin-functionalized tunicate nanocrystals can be assembled by streptavidin. The couple biotin–streptavidin has proved to be a suitable one for assembling several nanoparticles by noncovalent interactions. The length of the linker between the biotin moiety and the nanocrystal significantly impacts the assembly, probably by steric hindrance. Therefore, a certain length of the linker is necessary for the supramolecular assembly of several cellulose nanocrystals by streptavidin. This work opens the road for further functional supramolecular assemblies of nanocrystals with controlled geometry to be used in different applications such as responsive materials, porosity-controlled membranes, or the release of target molecules.
Experimental Section
Materials
Streptavidin from Streptomyces avidinii (SAV), (+)-biotinamidohexanoic acid hydrazide (HC-Biot), biotin-dPEG7-NH2 (PEG-Biot), N-(3-dimethylaminopropyl)-N-ethylcarbodiimide hydrochloride (EDC), N-hydroxysuccinimide (NHS), sodium chlorite (NaClO2), and potassium chloride (KCl) were purchased from Sigma-Aldrich (France) and used without further purification. Spectra/Por dialysis membrane, molecular weight cutoff of 12–14 kD, was purchased from Spectrum Laboratories Inc. Water was purified by Millipore Milli-Q purification system (18.2 MΩ).
Cellulose Nanocrystals Preparation
Tunicates (S. clava) were collected from Quimiac beach (France). After removal of interior organs, the tunicates were cut into small fragments and dispersed in distilled water/ice in a waring blender. Tunicate cellulose pulp was then boiled in 1% NaOH for 10 h and washed thoroughly in distilled water. This step was repeated twice. The pulp was further purified by a 0.3% NaClO2 treatment at pH 4.9 for 2 h at 70 °C and washed thoroughly in distilled water, similar to previously described procedures.40,41 Tunicate nanocrystals (t-CNC) were obtained by acid hydrolysis. To a cooled suspension of tunicate cellulose pulp in deionized water, sulfuric acid was slowly added under vigorous mechanical stirring to reach a final concentration of 65%. The dispersion was heated to 40 °C and kept at that temperature for 90 min under continued stirring. The dispersion was cooled to 0 °C, filtered over a small-pore fritted glass filter (0.5 μm), and washed with deionized water until neutrality was reached. Dialysis (molar mass cut off 12–14 000 Da) was performed for 15 days. Finally, nanocrystals were redispersed in Milli-Q water at 7 g L–1.
Introduction of Biotin Functionalization at the Reducing End of t-CNC
t-CNCs were functionalized at the reducing ends in aqueous media following the procedure previously described with minor modifications.14 The aldehyde groups on the reducing ends of t-CNC (200 mg) were oxidized to carboxyl groups by the addition of 5 mmol of NaClO2, and the pH was adjusted to 3.5 using acetic acid, followed by stirring for 20 h at room temperature. The reaction mixture was subsequently dialyzed against Milli-Q water to remove excess reactants and side products.
An 8 g L–1 suspension of t-CNC–COOH (10 mL, pH 7) was degassed by bubbling nitrogen for 20 min and 16 μmol of NHS was added, followed by 80 μmol of EDC, and the pH was adjusted to 6.5 by the addition of several droplets of HCl 0.1 M. Appropriate amounts of KCl were added such that the final suspension was 1 M in KCl. Then, 4 μmol of (+)-biotinamidohexanoic acid hydrazide or biotin-dPEG7-NH2 was added and the pH of the reaction mixture was adjusted to 9.2 with KOH. The reaction was sonicated (7 W at 20 kHz for 60 s, probe diameter 3.2 mm, QSonica Sonicator) and incubated under stirring at room temperature overnight. Biotin-functionalized t-CNCs were purified by centrifugation (9500 g, 30 min, 20 °C) and then dialyzed (molar mass cutoff 12–14 000 Da) against Milli-Q water for 15 days.
Coupling by Streptavidin
Biotin-functionalized t-CNCs were incubated with streptavidin solutions at 40 °C in a tube rotator for 2 h. The excess of streptavidin was removed by centrifugation at 9500 g for 30 min at 20 °C. Precipitated t-CNCs were dispersed in Milli-Q water.
Elemental Analysis
Unmodified, oxidized, and biotin-functionalized t-CNCs were freeze-dried and the resulting powder (9 mg) was placed in tin capsules for analysis. The total C, N, and S contents of t-CNCs were determined by a C/N/S analyzer (Vario Micro cube, Elementar) coupled to a gas chromatographic system and a thermal conductivity detector. Nitrogen content was determined by the Dumas’ method combustion.42
ζ-Potential and Dynamic Light Scattering (DLS)
ζ-Potential and DLS experiments were performed with a Malvern NanoZS instrument. All the measurements were made at a temperature of 20 °C with a detection angle of 12.8 and 173° for ζ-potential and DLS, respectively. The t-CNC solutions were diluted to 0.2 g L–1 without the addition of salt and filtered by 5 μm. The pH of the t-CNC solutions was 5 in all the cases. The hydrodynamic diameter was obtained from the analysis of the correlation function using Malvern DTS software.
Conductometry
The quantity of charges on the t-CNC surface charge was measured by conductometric titration with a 0.001 M NaOH solution by a TIM900 titration manager and a CDM230 conductimeter equipped with a CDC749 conductivity cell.
Quartz Crystal Microbalance with Dissipation (QCM-D)
The QCM-D measurements were performed with a Q-Sense E4 instrument (AB, Sweden) using a piezoelectric AT-cut quartz crystal coated with gold electrodes on each side (QSX301, Q-Sense). All the measurements were carried out at 20 °C using the QCM flow cell modules. Gold electrodes were modified by adsorbing 100 μL of streptavidin at 0.5 g L–1 for 30 min. Frequency (Δfn/n) and (ΔDn) dissipation changes were simultaneously registered at 5 MHz fundamental resonance frequency and its several overtones as a function of time. Any material adsorbed on the crystal surface induces a decrease in the resonance frequency (Δf). Dissipation signals (ΔD) were recorded simultaneously to frequency shifts and they provide a measure of the frictional losses due to the viscoelastic properties of the adsorbed layer. The overtone n = 3 was used for comparing the adsorption of unmodified and modified t-CNCs. The results are expressed as the mean of at least five experiments.
Atomic Force Microscopy (AFM)
To analyze the assembly of biotin-functionalized t-CNC upon the addition of streptavidin, t-CNC suspensions were diluted 10-fold and then deposited on mica substrates. Images were collected by an Innova AFM (Bruker) in tapping mode under ambient air conditions (temperature and relative humidity) using a monolithic silicon tip (TESPA, Bruker; spring constant k = 42 N m–1; frequency f0 = 320 kHz). Image processing was performed with the WSxM 5.0 software.
Transmission Electron Microscopy (TEM)
The t-CNC suspensions in water were deposited on freshly glow-discharged carbon-coated electron microscope grids (200 mesh, Delta Microscopies, France) and the excess water was removed by blotting. The sample was then immediately negatively stained with phosphotungstic acid solution (1%, w/v) for 2 min and dried after blotting at room temperature just before observation. The grids were observed with a Jeol JEM 1230 TEM at 80 kV. The length of the nanocrystals was determined by the analysis of TEM images (15 images) using ImageJ software.
Acknowledgments
The authors gratefully acknowledge the French National Research Agency (Project Cellmach, ANR-17-CE07-0010-01) and the Region Pays de la Loire (Project Nanomach, Etoiles Montantes 2017-10691) for financial support. We greatly thank Dr Hervé Bizot for the preparation of tunicate nanocrystals and fruitful discussions. The authors acknowledge the BIBS platform of INRA Angers-Nantes for access to infrared spectroscopy (Sylvie Durand), elemental analysis (Véronique Solé and Brigitte Laillet), atomic force microscopy, and transmission electron microscopy (Emilie Perrin).
Supporting Information Available
The Supporting Information is available free of charge on the ACS Publications website at DOI: 10.1021/acsomega.8b02559.
Experimental section including materials and methods for FTIR experiments and preparation of poly(allylamine hydrochloride) layers onto gold substrates; conductometric titration curve for t-CNC; FTIR spectra and analysis; adsorption of t-CNCs on gold surfaces and SAV layers at pH 5–6; adsorption of unmodified t-CNCs on PAH; values of frequency and dissipation for the adsorption of t-CNC–PEG-Biot on streptavidin and unmodified t-CNCs on PAH; and values of Z-average diameter and polydispersity of t-CNC–HC-Biot and t-CNC–PEG-Biot before and after the addition of streptavidin (PDF)
Author Contributions
The manuscript was written through contributions of all the authors. All the authors have given approval to the final version of the manuscript.
French National Research Agency (Project Cellmach, ANR-17-CE07-0010-01) and Region Pays de la Loire (Project Nanomach, Etoiles Montantes 2017-10691).
The authors declare no competing financial interest.
Supplementary Material
References
- Klemm D.; Kramer F.; Moritz S.; Lindström T.; Ankerfors M.; Gray D.; Dorris A. Nanocelluloses: A New Family of Nature-Based Materials. Angew. Chem., Int. Ed. 2011, 50, 5438–5466. 10.1002/anie.201001273. [DOI] [PubMed] [Google Scholar]
- Dufresne A. Nanocellulose: a new ageless bionanomaterial. Mater. Today 2013, 16, 220–227. 10.1016/j.mattod.2013.06.004. [DOI] [Google Scholar]
- Moon R. J.; Martini A.; Nairn J.; Simonsen J.; Youngblood J. Cellulose nanomaterials review: structure, properties and nanocomposites. Chem. Soc. Rev. 2011, 40, 3941–3994. 10.1039/c0cs00108b. [DOI] [PubMed] [Google Scholar]
- Cosgrove D. J. Growth of the plant cell wall. Nat. Rev. Mol. Cell Biol. 2005, 6, 850–861. 10.1038/nrm1746. [DOI] [PubMed] [Google Scholar]
- Eichhorn S. J. Cellulose nanowhiskers: promising materials for advanced applications. Soft Matter 2011, 7, 303–315. 10.1039/C0SM00142B. [DOI] [Google Scholar]
- Habibi Y.; Lucia L. A.; Rojas O. J. Cellulose Nanocrystals: Chemistry, Self-Assembly, and Applications. Chem. Rev. 2010, 110, 3479–3500. 10.1021/cr900339w. [DOI] [PubMed] [Google Scholar]
- Lin N.; Huang J.; Dufresne A. Preparation, properties and applications of polysaccharide nanocrystals in advanced functional nanomaterials: a review. Nanoscale 2012, 4, 3274–3294. 10.1039/c2nr30260h. [DOI] [PubMed] [Google Scholar]
- Moreau C.; Villares A.; Capron I.; Cathala B. Tuning supramolecular interactions of cellulose nanocrystals to design innovative functional materials. Ind. Crops Prod. 2016, 93, 96–107. 10.1016/j.indcrop.2016.02.028. [DOI] [Google Scholar]
- Sacui I. A.; Nieuwendaal R. C.; Burnett D. J.; Stranick S. J.; Jorfi M.; Weder C.; Foster E. J.; Olsson R. T.; Gilman J. W. Comparison of the Properties of Cellulose Nanocrystals and Cellulose Nanofibrils Isolated from Bacteria, Tunicate, and Wood Processed Using Acid, Enzymatic, Mechanical, and Oxidative Methods. ACS Appl. Mater. Interfaces 2014, 6, 6127–6138. 10.1021/am500359f. [DOI] [PubMed] [Google Scholar]
- Abitbol T.; Rivkin A.; Cao Y. F.; Nevo Y.; Abraham E.; Ben-Shalom T.; Lapidot S.; Shoseyov O. Nanocellulose, a tiny fiber with huge applications. Curr. Opin. Biotechnol. 2016, 39, 76–88. 10.1016/j.copbio.2016.01.002. [DOI] [PubMed] [Google Scholar]
- Capron I.; Rojas O. J.; Bordes R. Behavior of nanocelluloses at interfaces. Curr. Opin. Colloid Interface Sci. 2017, 29, 83–95. 10.1016/j.cocis.2017.04.001. [DOI] [Google Scholar]
- Sipahi-Sağlam E.; Gelbrich M.; Gruber E. Topochemically modified cellulose. Cellulose 2003, 10, 237–250. 10.1023/A:1025151701985. [DOI] [Google Scholar]
- Lokanathan A. R.; Nykanen A.; Seitsonen J.; Johansson L.-S.; Campbell J.; Rojas O. J.; Ikkala O.; Laine J. Cilia-Mimetic Hairy Surfaces Based on End-Immobilized Nanocellulose Colloidal Rods. Biomacromolecules 2013, 14, 2807–2813. 10.1021/bm400633r. [DOI] [PubMed] [Google Scholar]
- Lokanathan A. R.; Lundahl M.; Rojas O. J.; Laine J. Asymmetric cellulose nanocrystals: thiolation of reducing end groups via NHS-EDC coupling. Cellulose 2014, 21, 4209–4218. 10.1007/s10570-014-0426-9. [DOI] [Google Scholar]
- Zoppe J. O.; Dupire A. V. M.; Lachat T. G. G.; Lemal P.; Rodriguez-Lorenzo L.; Petri-Fink A.; Weder C.; Klok H.-A. Cellulose Nanocrystals with Tethered Polymer Chains: Chemically Patchy versus Uniform Decoration. ACS Macro Lett. 2017, 6, 892–897. 10.1021/acsmacrolett.7b00383. [DOI] [PubMed] [Google Scholar]
- Yang H.; van de Ven T. G. M. A Bottom-up Route to a Chemically End-to-End Assembly of Nanocellulose Fibers. Biomacromolecules 2016, 17, 2240–2247. 10.1021/acs.biomac.6b00480. [DOI] [PubMed] [Google Scholar]
- Diamandis E. P.; Christopoulos T. K. The biotin (strept)avidin system - Principles and applications in Biotechnology. Clin. Chem. 1991, 37, 625–636. [PubMed] [Google Scholar]
- Zhao Y.; Zhang Y. J.; Lindstrom M. E.; Li J. B. Tunicate cellulose nanocrystals: Preparation, neat films and nanocomposite films with glucomannans. Carbohydr. Polym. 2015, 117, 286–296. 10.1016/j.carbpol.2014.09.020. [DOI] [PubMed] [Google Scholar]
- Lin N.; Dufresne A. Surface chemistry, morphological analysis and properties of cellulose nanocrystals with gradiented sulfation degrees. Nanoscale 2014, 6, 5384–5393. 10.1039/C3NR06761K. [DOI] [PubMed] [Google Scholar]
- Foster E. J.; Moon R. J.; Agarwal U. P.; Bortner M. J.; Bras J.; Camarero-Espinosa S.; Chan K. J.; Clift M. J. D.; Cranston E. D.; Eichhorn S. J.; Fox D. M.; Hamad W. Y.; Heux L.; Jean B.; Korey M.; Nieh W.; Ong K. J.; Reid M. S.; Renneckar S.; Roberts R.; Shatkin J. A.; Simonsen J.; Stinson-Bagby K.; Wanasekara N.; Youngblood J. Current characterization methods for cellulose nanomaterials. Chem. Soc. Rev. 2018, 47, 2609–2679. 10.1039/C6CS00895J. [DOI] [PubMed] [Google Scholar]
- Kaldéus T.; Nordenstrom M.; Carlmark A.; Wagberg L.; Malmstrom E. Insights into the EDC-mediated PEGylation of cellulose nanofibrils and their colloidal stability. Carbohydr. Polym. 2018, 181, 871–878. 10.1016/j.carbpol.2017.11.065. [DOI] [PubMed] [Google Scholar]
- Zhao Y.; Li J. Excellent chemical and material cellulose from tunicates: diversity in cellulose production yield and chemical and morphological structures from different tunicate species. Cellulose 2014, 21, 3427–3441. 10.1007/s10570-014-0348-6. [DOI] [Google Scholar]
- Perez D. D. S.; Montanari S.; Vignon M. R. TEMPO-mediated oxidation of cellulose III. Biomacromolecules 2003, 4, 1417–1425. 10.1021/bm034144s. [DOI] [PubMed] [Google Scholar]
- Benkaddour A.; Journoux-Lapp C.; Jradi K.; Robert S.; Daneault C. Study of the hydrophobization of TEMPO-oxidized cellulose gel through two routes: amidation and esterification process. J. Mater. Sci. 2014, 49, 2832–2843. 10.1007/s10853-013-7989-y. [DOI] [Google Scholar]
- Schwanninger M.; Rodrigues J. C.; Pereira H.; Hinterstoisser B. Effects of short-time vibratory ball milling on the shape of FT-IR spectra of wood and cellulose. Vib. Spectrosc. 2004, 36, 23–40. 10.1016/j.vibspec.2004.02.003. [DOI] [Google Scholar]
- Hurtubise F. G.; Krassig H. Classification of fine structural characteristics in cellulose by infrared spectroscopy - Use of potassium bromide pellet technique. Anal. Chem. 1960, 32, 177–181. 10.1021/ac60158a010. [DOI] [Google Scholar]
- Lourdin D.; Peixinho J.; Breard J.; Cathala B.; Leroy E.; Duchemin B. Concentration driven cocrystallisation and percolation in all-cellulose nanocomposites. Cellulose 2016, 23, 529–543. 10.1007/s10570-015-0805-x. [DOI] [Google Scholar]
- Nelson M. L.; O’Connor R. T. Relation of certain infrared bands to cellulose crystallinity and crystal lattice types. Part II. a new infrared ratio for estimation of cyrstallinity in celluloses I and II. J. Appl. Polym. Sci. 1964, 8, 1325–1341. 10.1002/app.1964.070080323. [DOI] [Google Scholar]
- Holmberg A.; Blomstergren A.; Nord O.; Lukacs M.; Lundeberg J.; Uhlen M. The biotin-streptavidin interaction can be reversibly broken using water at elevated temperatures. Electrophoresis 2005, 26, 501–510. 10.1002/elps.200410070. [DOI] [PubMed] [Google Scholar]
- Hyre D. E.; Le Trong I.; Merritt E. A.; Eccleston J. F.; Green N. M.; Stenkamp R. E.; Stayton P. S. Cooperative hydrogen bond interactions in the streptavidin-biotin system. Protein Sci. 2006, 15, 459–467. 10.1110/ps.051970306. [DOI] [PMC free article] [PubMed] [Google Scholar]
- Liu F. J.; Zhang J. Z. H.; Mei Y. The origin of the cooperativity in the streptavidin-biotin system: A computational investigation through molecular dynamics simulations. Sci. Rep. 2016, 6, 27190 10.1038/srep27190. [DOI] [PMC free article] [PubMed] [Google Scholar]
- Stamm C.; Lukosz W. Integrated optical-difference interferometer as biochemical sensor. Sens. Actuators, B 1994, 18, 183–187. 10.1016/0925-4005(94)87081-0. [DOI] [Google Scholar]
- Amirkhani M.; Volden S.; Zhu K.; Glomm W. R.; Nystroem B. Adsorption of cellulose derivatives on flat gold surfaces and on spherical gold particles. J. Colloid Interface Sci. 2008, 328, 20–28. 10.1016/j.jcis.2008.09.013. [DOI] [PubMed] [Google Scholar]
- Rodahl M.; Hook F.; Fredriksson C.; Keller C. A.; Krozer A.; Brzezinski P.; Voinova M.; Kasemo B. Simultaneous frequency and dissipation factor QCM measurements of biomolecular adsorption and cell adhesion. Faraday Discuss. 1997, 107, 229–246. 10.1039/a703137h. [DOI] [PubMed] [Google Scholar]
- Ahola S.; Salmi J.; Johansson L. S.; Laine J.; Oesterberg M. Model films from native cellulose nanofibrils. Preparation, swelling, and surface interactions. Biomacromolecules 2008, 9, 1273–1282. 10.1021/bm701317k. [DOI] [PubMed] [Google Scholar]
- Lima M. M. D. S.; Wong J. T.; Paillet M.; Borsali R.; Pecora R. Translational and rotational dynamics of rodlike cellulose whiskers. Langmuir 2003, 19, 24–29. 10.1021/la020475z. [DOI] [Google Scholar]
- Funabashi H.; Ubukata M.; Ebihara T.; Aizawa M.; Mie M.; Kobatake E. Assessment of small ligand-protein interactions by electrophoretic mobility shift assay using DNA-modified ligand as a sensing probe. Biotechnol. Lett. 2007, 29, 785–789. 10.1007/s10529-006-9301-6. [DOI] [PubMed] [Google Scholar]
- Jones M. L.; Kurzban G. P. Noncooperativy of biotin binding to tetrameric streptavidin. Biochemistry 1995, 34, 11750–11756. 10.1021/bi00037a012. [DOI] [PubMed] [Google Scholar]
- Fairhead M.; Krndija D.; Lowe E. D.; Howarth M. Plug-and-Play Pairing via Defined Divalent Streptavidins. J. Mol. Biol. 2014, 426, 199–214. 10.1016/j.jmb.2013.09.016. [DOI] [PMC free article] [PubMed] [Google Scholar]
- Favier V.; Chanzy H.; Cavaille J. Y. Polymer nanocomposites reinforced by cellulose whiskers. Macromolecules 1995, 28, 6365–6367. 10.1021/ma00122a053. [DOI] [Google Scholar]
- Sugiyama J.; Persson J.; Chanzy H. Combined infrared and electron diffraction study of the polymorphism of native celluloses. Macromolecules 1991, 24, 2461–2466. 10.1021/ma00009a050. [DOI] [Google Scholar]
- Shea F.; Watts C. E. Dumas method for organic nitrogen. Ind. Eng. Chem., Anal. Ed. 1939, 11, 333–334. 10.1021/ac50134a013. [DOI] [Google Scholar]
Associated Data
This section collects any data citations, data availability statements, or supplementary materials included in this article.


