Abstract
Aggregation-induced emission has provided fluorescence enhancement strategies for metal nanoclusters. However, the morphology of the aggregated nanoclusters tended to be irregular due to the random aggregated route, which would result in the formation of an unstable product. Herein, copper nanoclusters were directly synthesized by using l-cysteine as both the reducing and protection ligand. Initially, the structure of the product was irregular. Furthermore, Ce3+ was introduced to re-arrange the aggregates through a crosslinking avenue. It was interesting to find that well-ordered three-dimensional nanomaterials with mesoporous sphere structures were obtained after re-aggregation. On the basis of the stability test at a relatively high temperature and the light-emitting diode fabrication investigation, it revealed that the regulated product demonstrated more promising stability and color purity for practical applications than the random aggregated product with irregular structures.
Introduction
Noble metal nanoclusters (NCs) have attracted great attention for optical applications due to the lower toxic effect compared to organic dyes or quantum dots.1−3 Among the NCs, copper nanoclusters (CuNCs) are the most cost-effective.4 However, their optical applications are limited, since most products tend to describe weak brightness and poor stability.5,6 Aggregation-induced emission (AIE) has been proved to improve the fluorescence behavior of the NCs efficiently.7 The dispersed NCs were aggregated as normal size materials by means of electrostatic interactions, noncovalent interactions, solvophobic interactions, or van der Waals interactions.8−11 Normally, irregular structures and unstable properties were demonstrated for aggregated products.12 The fluorescence brightness of such products was still required to be improved, since the irregular aggregates could be easily collapsed, not to mention that the structures were probably not repeatable to synthesize.
Recently, it was fortunate that the construction of aggregated NCs as regular structures was performed by following several types of assembling protocols. For instance, Zn2+ could not only effectively induce dispersed gold nanoclusters (AuNCs) as aggregates, but also mediate these aggregates to ordered one-dimensional (1D) nanomaterials, which significantly sensitized the fluorescence of AuNCs in the dispersed form.13 Another strategy facilitated the dipolar attraction between CuNCs to induce the aggregates as two-dimensional (2D) nanowires by the van der Waals attraction with the 1-dodecanethiol protection ligands.14 Then, the CuNCs were rearranged within the nanowires to produce 2D nanoribbons. By the employment of similar protocols, the same group also successfully induced silver nanoclusters (AgNCs) and Au(I)-doped CuNCs as ordered 2D nanomaterials.15,16 In addition, the addition of ethanol led to the aggregation of CuNCs as 2D nanosheets, attributed to the formation of metal defect-rich surface.17 These ordered nanomaterials demonstrated more excellent application activity in the field of catalysis and illumination than both the NCs in dispersed and random aggregated form, which indicated that the shape and structure played an important role in practical application. Significant progress has been achieved for the fabrication of aggregated NCs as regular 1D and 2D nanomaterials with appropriate morphology. It should be noticed that three-dimensional (3D) nanomaterials also demonstrated excellent performance for applications.18 For instance, the 3D nanoflowers prepared by enzyme and copper(II) phosphate described enhanced catalytic activity, stability, and durability.19 More excellent surface enhanced Raman spectroscopy performance was achieved for hybrid nanostructured materials that contained branched gold nanoparticles and radial SiO2 shells.20 However, few works reported the effective strategy for assembling NCs as ordered nanomaterials with controllable 3D morphology.21 This may be attributed to the unfavorable fuse of nanosized clusters after their seamless connection.
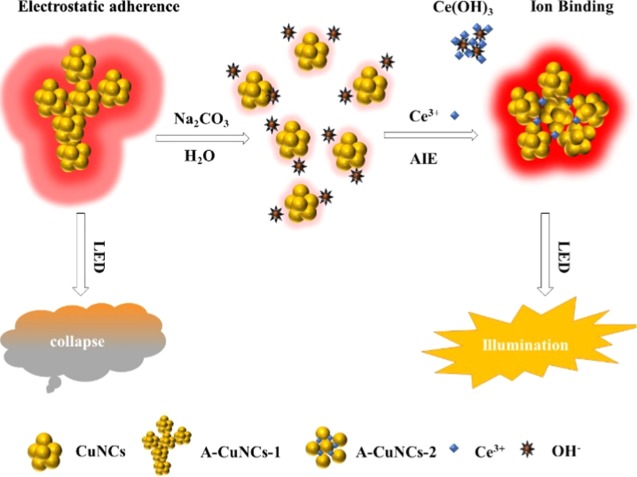
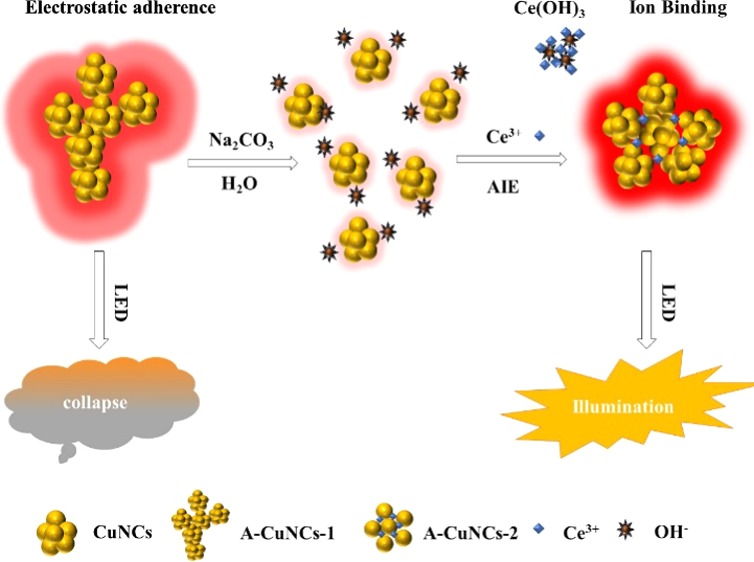
The fluorescence brightness could be significantly enhanced by AIE due to the inhibition of the intramolecular vibrations and rotations in NCs.22,23 Notwithstanding, when the aggregates were so compact that much bigger size particles were fused, the fluorescence would also be quenched to a certain extent. Consequently, exploring a protocol for aggregating NCs as appropriate structures is of great importance. Herein, we found a method for assembling CuNCs into well-ordered mesoporous spheres by the binding ability of metal ions with l-cysteine-protected nanomaterials.24 The structures of the aggregates could be adjusted to a controllable form by tuning the amounts of Ce3+. The mechanism is described in Scheme 1. Initially, the aggregates of l-cysteine-protected CuNCs were obtained with irregular structures (A-CuNCs-1), which could be stable in weak acid medium like glutathione (GSH)-protected CuNCs.25 Next, Na2CO3 was introduced to tune the solvent of the sample as weak base medium so that the aggregates would be dispersed by the hydrolyzed OH–. Furthermore, the addition of Ce3+ immediately neutralized the medium due to the formation of Ce(OH)3. After that, the weak-emissive CuNCs in dispersed form were obtained. Furthermore, they could be rearranged and assembled as the new aggregates (A-CuNCs-2) by means of the crosslinking connection between l-cysteine and the additional Ce3+. To identify the performance, light-emitting diodes (LEDs) were fabricated by the powders of aggregated CuNCs based on A-CuNCs-1 and A-CuNCs-2. It revealed that the as obtained mesoporous spheres (A-CuNCs-2) demonstrated much more promising performance than the irregular aggregates (A-CuNCs-1) as applied for illumination materials.
Scheme 1. Schematic Illustration of the Self-Assembly of l-Cysteine-Protected CuNCs as Mesoporous Spheres for the Fabrication of LED Devices with and without the Assistance of Ce3+.
Results and Discussions
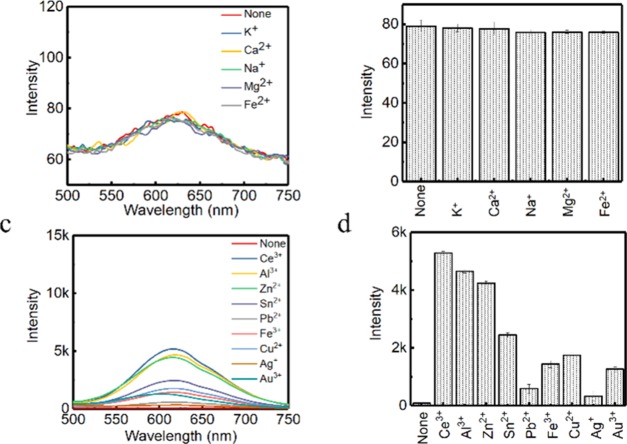
It has been found that l-cysteine could be used as both the reducing and protection ligand for the synthesis of CuNCs.12 Meanwhile, the as aggregated products (A-CuNCs-1) were highly fluorescent due to the AIE effect. However, the morphology was pretty irregular because the discrete CuNCs randomly interacted with each other through a quite fast route, which would bring concern about the stability of the product. Since different metal ions had different aggregating effects, it was worth wondering whether they were capable of transforming the irregular aggregates into regular nanomaterials here.26,27 A-CuNCs-1 were stable in acid media at room temperature, but they would be completely decomposed after the introduction of strong alkaline such as NaOH. This was similar to the acid-stable and base-soluble behaviors of GSH and dipicolinic acid protected CuNCs.28,29 Although NaOH could be used to dissolve A-CuNCs-1, the increase of NaOH in the colloid also significantly enhanced the pH value after the titration jump point, where the NCs would be completely broken down.12 Herein, a relatively weak alkaline Na2CO3 was used to disperse the aggregates gently so that the generation of OH– was released by a hydrolysis route. Then, it would be difficult for CuNCs to be dramatically decomposed. After that, various types of metal ions including K+, Ca2+, Na+, Mg2+, Fe2+, Ce3+, Al3+, Zn2+, Sn2+, Pb2+, Fe3+, Cu2+, Ag+, and Au3+ were introduced to induce the rearrangement of the aggregates based on the corresponding binding effect. Firstly, the fluorescence emission spectra were used to monitor the change in the product, see Figure 1. The picture for the fluorescence response is described in Figure S1. It could be observed from Figure 1a,b that the fluorescence of the dispersed CuNCs in the absence of metal ions was quite weak. Additionally, no significant change was observed in the presence of K+, Ca2+, Na+, Mg2+, and Fe2+, which indicated that these metal ions could hardly induce re-aggregation of CuNCs. Correspondingly, almost no fluorescence change of the colloid was found in the picture, because all these fluorescence signals were too weak to be monitored with the current excitation at 365 nm under a UV lamp, see Figure S1b. However, the fluorescence of the discrete CuNCs could be sensitized with a relatively low concentration (100 μM) of Pb2+, Ce3+, and Al3+. Meanwhile, according to Figure S1d, all other metal ions including Ce3+, Al3+, Zn2+, Sn2+, Pb2+, Fe3+, Cu2+, and Au3+ were capable of enhancing the fluorescence of the dispersed CuNCs at high concentrations except for Ag+. It could also be observed from Figure 1c,d that Pb2+, Fe3+, Cu2+, Ag+, and Au3+ slightly enhanced the fluorescence, while Ce3+, Al3+, Zn2+, Sn2+, and Cu2+ significantly enhanced the fluorescence at high concentrations. According to these phenomena, it could be concluded that the enhancement effect was influenced by the species and concentration of metal ions. The details of the enhancement behavior on the dispersed CuNCs were demonstrated by the fluorescence emission spectra as the titration of each metal ion as shown in Figures S2–S10.
Figure 1.
(a) Fluorescence emission spectra for the aggregated CuNCs induced by various metal ions (K+, Ca2+, Na+, Mg2+, and Fe2+) and (b) the corresponding fluorescence intensity at 615 nm. (c) Fluorescence emission spectra for the aggregated CuNCs induced by various metal ions (none, Ce3+, Al3+, Zn2+, Sn2+, Pb2+, Fe3+, Cu2+, Ag+, and Au3+) and (d) the corresponding fluorescence intensity at 615 nm. Note: the maximum enhancement for the fluorescence emission spectra of each metal ion is described here.
It could be seen from Figure 1b that K+, Ca2+, Na+, and Mg2+ had little enhancement effect for the dispersed CuNCs. Apparently, there was something in common that insoluble hydroxides were not formed easily with extremely low concentration of these metal ions. Thus, it was difficult for them to significantly change the pH values of the colloid by neutralizing OH–. On the other hand, it could be seen that all these metal ions with trace values that enabled the formation of insoluble hydroxides could enhance the fluorescence. This indicated that the binding constant (Ksp) between −OH and these metal ions for the formation of the insoluble metal hydroxides would probably be important for the AIE effect. To confirm whether there is some relationship between Ksp and the fluorescence enhancement, the Ksp values of all the investigated metal ions are listed in Table 1. The corresponding fluorescence enhancement factor of each metal ion was analyzed based on the maximum emission intensity change at 615 nm as shown in Figures S2–S10. It could be observed that no significant enhancement was found when Ksp > 1.0 × 10⁻¹⁵. When Ksp < 7.1 × 10⁻¹⁸, all the metal ions significantly enhanced the fluorescence of aggregated CuNCs, except for Cu2+, Fe3+, and Au3+. This partly confirmed our assumption that the metal ions with an extremely low Ksp were capable of enhancing the fluorescence effectively. On the other hand, it revealed that there was some unexpected tendency of AIE in the case of the heavy metal ions and noble metal ions. Then, other factors should be considered besides Ksp. It was reported that Fe3+ and Pb2+ had a quenching effect for most NCs.30,31 Herein, for these heavy metal ions, both the enhancement and quenching effects would influence the fluorescence behavior. Taken together, the enhancement would rely on the competitions between the quenching and the AIE effect. This was the reason that Pb2+ preferentially sensitized fluorescence for dispersed CuNCs at low concentrations, but it did not show advantages over other metal ions at high concentrations when quenching behavior played a more important role. Meanwhile, for the noble metal ions such as Au3+, Ag+, and Cu2+, the AIE effect was not the only factor that would influence the fluorescence behavior. We found that l-cysteine could be used as a protection ligand for the formation of AuNCs and AgNCs with relatively weak fluorescence compared to l-cysteine-protected CuNCs. The fluorescence behavior of l-cysteine-protected AuNCs and AgNCs is described in Figure S11. It could be seen that the maximum fluorescence emission would not be obtained until ca. 415 nm was used as the excitation wavelength for AgNCs, which was far from 365 nm. Therefore, it made it difficult to show the illumination under a UV lamp (Figure S1d) for Ag+-induced aggregates. The noble metal ions such as Cu2+, Ag+, and Au3+ would not only participate in the sensitization of fluorescence for dispersed CuNCs based on AIE, but would also participate in the formation of new NCs. As a result, both negative and positive effects would be demonstrated for the fluorescence enhancement. In summary, all the final enhancement factor would depend on the competition between the two effects.
Table 1. Ksp for Hydroxide and the Maximum Enhancement Factor for the Dispersed CuNCs upon the Addition of Different Metal Ions.
| metal ions | Ksp for hydroxide | enhancement factor | quenching properties |
|---|---|---|---|
| Au3+ | 5.5 × 10–46 | 16.37 | noble metal |
| Fe3+ | 3.2 × 10–38 | 18.75 | oxidizability |
| Al3+ | 1.9 × 10⁻³³ | 60.61 | |
| Sn2+ | 6.3 × 10⁻²⁷ | 32.03 | heavy metal |
| Cu2+ | 5.0 × 10⁻²⁰ | 23.19 | heavy metal |
| Ce3+ | 2.0 × 10⁻²⁰ | 67.59 | |
| Zn2+ | 7.1 × 10⁻¹⁸ | 57.98 | |
| Pb2+ | 1.2 × 10⁻¹⁵ | 7.64 | heavy metal |
| Fe2+ | 1.0 × 10⁻¹⁵ | 0.995 | reducibility |
| Mg2+ | 1.8 × 10⁻¹¹ | 0.982 | |
| Ag+ | 1.6 × 10⁻⁸ | 4.55 | noble metal |
| Ca2+ | 5.5 × 10⁻⁶ | 0.976 | |
| K+ | soluble | 0.997 | |
| Na+ | soluble | 0.983 |
Except for the negative influence of heavy and noble metal ions, the enhancement factor did not increase with the decrease in Ksp, although all the metal ions with low Ksp were capable of enhancing the fluorescence due to the neutralization of OH–. After that, the AIE could be reinforced either by crosslinking or by the −OH-metal core binding effect.27,32,33 However, more complicated factors that contributed to the fluorescence behavior should be considered. Figure 1 indicates that Ce3+ demonstrated the most significant enhancing ability to the fluorescence of CuNCs in comparison with other ions. For investigation of the priority, the morphologies of the metal ion-induced aggregates were investigated by scanning electron microscope (SEM) and are described in Figure 2. It could be seen that the different metal ions would induce the formation of aggregates with different structures. The sphere shapes were described by the aggregated product induced by Ce3+, a low concentration of Cu2+ (100 μM), Zn2+, and Sn2+, and a high concentration of Cu2+ and Al3+, see Figure 2c,d,j,k,m,p. All these products tended to demonstrate regular shapes. However, it could be seen from Figure 2c that the product for Ce3+-induced aggregates were not only regular but also mesoporous. These types of aggregates would exhibit large surface area as well as stability. The detailed comparison for the morphology in higher magnification is described in Figure S12 and for the spheres in Figure 2d,c,m. It could be clearly reveled that the fluorescence of these aggregates for Cu2+-induced products in Figures S12A1–A3 and B1–B3 would probably be inhibited since the large area of the surface could not be exposed effectively due to the extremely tight structure. On the other hand, the morphology for Ce3+-induced aggregates in Figure S12C1–C3 was mesoporous, which tended to describe more promising properties.
Figure 2.
Influence of metal ions on the morphology of aggregated CuNCs: (a) Fe3+; (b) Fe2+; (c) Ce3+; (d) Cu2+ (100 μM); (e) K+; (f) Ca2+; (g) Mg2+; (h) Na+; (i) none; (j) Zn2+; (k) Sn2+; (l) Pb2+; (m) Cu2+ (for most significant fluorescence enhancement); (n) Ag+, (o) Au3+; (p) Al3+. Note: (a–m) all other products were demonstrated with the highest fluorescence enhancement induced by the metal ions.
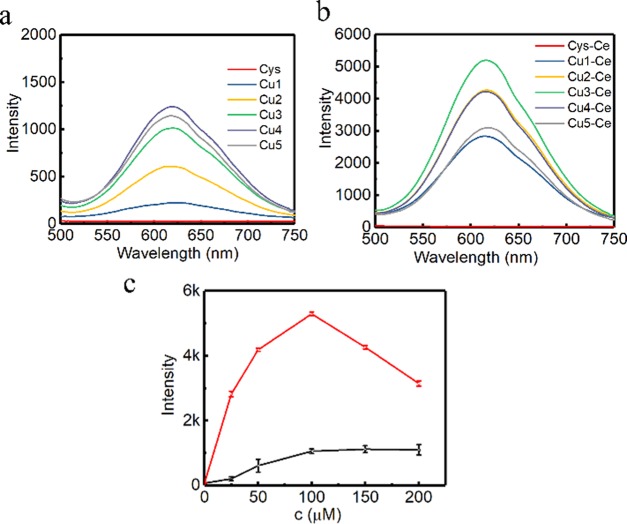
To more deeply understand how Ce3+ influences the structure of the aggregated product, various amounts of Ce3+ have been employed to induce the rearrangement of the aggregates. Firstly, the fluorescence behavior was investigated using copper precursors with different amounts and is described in Figure 3. It could be seen from Figure 3 that a significant fluorescence enhancement trend as the function of the amounts of Ce3+ was demonstrated. The fluorescence quantum yields for CuNCs with the brightest fluorescence before and after Ce3+ rearrangement was measured to be 3.4 and 8.3% using acridine yellow (47% in ethanol) as a reference. Additionally, the relationship between the AIE effect and the amounts of Na2CO3 was analyzed, see Figure S13. It could be observed that more amounts of Ce3+ would be required for the sensitization of fluorescence enhancement when more amounts of Na2CO3 was employed. When Na2CO3 was less than 120 μL, the original A-CuNCs-1 was not completely dispersed. Then, the AIE effect could not be optimized due to the presence of irregular aggregates. However, when more than 120 μL of Na2CO3 was employed, the medium for the colloid would be tuned as a weak base state, which could not allow further aggregation without additional assistance. Thus, the initially added Ce3+ had to be neutralizing with the hydrolysis OH– from Na2CO3 so as to change the pH to a neutral value. After that, the dispersed CuNCs would be re-aggregated through the combination of additional Ce3+. Notwithstanding, the formation of too much non-fluorescent Ce(OH)3 would probably inhibit the fluorescence for the re-aggregated A-CuNCs-2 when high concentrations of OH– were present. Then, both insufficient and residual Na2CO3 were not favored for realizing the optimum enhancement. It could be seen from Figure S13b that the AIE efficiency reached the optimum value by using 120 μL of Na2CO3, which just completely dispersed the aggregates of A-CuNCs-1. In this case, almost no Ce3+ was required to neutralize OH–. Thus, it would completely participate in the crosslinking formation of the new aggregates. Besides, it was proposed that the coordination between Ce3+ and l-cysteine on the surface of CuNCs led to the aggregation of CuNCs through a crosslinking route, since other nanomaterials could be crosslinked with the assistance of l-cysteine via hydrogen bonding or zwitterionic Interaction.34 Herein, the introduction of Ce3+ would accelerate binding via forming −CuNCs–COO–Ce3+–NH2–CuNCs–, the mechanism of which was similar to the literature.32,34,35 The detail crosslinking route is described in Figure S14. It could be expected that the formation of aggregates based on the coordination bonds would more significantly limit the vibration and rotation of CuNCs than the random aggregates.
Figure 3.
(a) Fluorescence spectra of the aggregated CuNCs synthesized in the presence of various amounts of Cu2+ (0.1 M) (Cys, 0 μL; Cu1, 25 μL; Cu2, 50 μL; Cu3, 100 μL; Cu4, 150 μL; Cu5, 200 μL). (b) The corresponding aggregated CuNCs regulated by Ce3+ with the most significant enhancement (c) and the fluorescence intensity comparison for CuNCs induced by the absence and presence of Ce3+.
Self-assembly of CuNCs driven by different amounts of Ce3+ was explored by the SEM technique and is demonstrated in Figure 4. The directly aggregated CuNCs are described in Figure 4a. No regular shapes were displayed in the absence of Ce3+. Meanwhile, based on our experiments, these aggregates for l-cysteine-protected CuNCs had not always exhibited the same shape. It was not surprising that the aggregates for l-cysteine-protected CuNCs in previous paper was also irregular, but it was not the same as that described in Figure 4a, either.12 Notwithstanding, after the introduction of Ce3+, aggregated CuNCs tended to display more regular mesoporous spherical morphology, see Figure 4b–e. The corresponding size distribution and dynamic light scattering (DLS) characterization are described in Figures S15 and S16. Both the SEM and DLS characterization demonstrated that the sample could be controlled with the well size distribution, when 100 μM of Ce3+ was employed (Figure 4e). On the basis of the enlargement of the morphology (Figure 4e1), it could be clearly demonstrated that the mesoporous spheres were constructed with multilevel structures containing the assembled nanosheets. This type of morphology would be promising for applications as illumination materials according to previous paper.15 To compare the modified aggregates with regular morphology and the aggregates with random structures, more characterization was investigated as follows.
Figure 4.
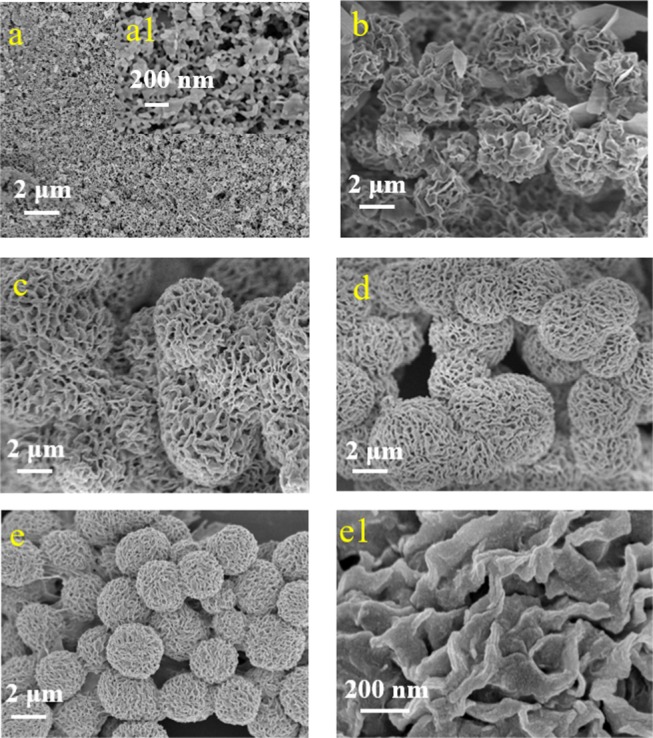
Influence of the amounts of Ce3+ (0.01 M) on the morphology of aggregated CuNCs: (a) 0 μM; (a1) inset, enlargement of (a); (b) 10 μM; (c) 25 μM; (d) 50 μM; (e) 100 μM; (e1) enlargement of (e).
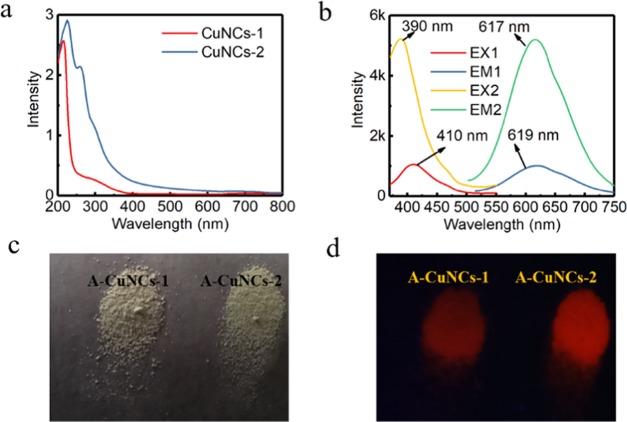
Firstly, the optical behaviors were studied and are described in Figure 5. It could be seen that the absorbance spectrum of A-CuNCs-1 did not show obvious absorption peak at ca. 560 nm that could indicate the formation of big particles. This followed the phenomena of previous work that the ultra-small size CuNCs could not support the surface plasmon resonance effect.36 From Figure 5a, it could also be seen that the absorbance for A-CuNCs-2 from 400 to 600 nm was more significant than that for A-CuNCs-1.
Figure 5.
UV–vis absorbance (a) and the fluorescence spectra (b) of the aggregated A-CuNCs-1 and re-aggregated A-CuNCs-2: EX1 and EM1 indicated the excitation and emission spectra for A-CuNCs-1, while EX2 and EM2 indicated the excitation and emission spectra for A-CuNCs-2. (c) Photographs of the powders for A-CuNCs-1 and A-CuNCs-2 under room light (a) and UV illumination (d).
On the basis of these phenomena, it is worth wondering whether the enhancement of the fluorescence was caused by the enhanced yield of CuNCs. Then, inductively coupled plasma mass spectrometry (ICP-MS) was employed to analyze the concentration of total Cu as well as Ce in the product. The results are described in Table 2. Similar to the typical synthesis of A-CuNCs-1, 100 μL of 0.1 M Cu (NO3)2 was used as the precursor for the fabrication of A-CuNCs-2. Then, various concentration of Ce3+ was employed to induce AIE. After the digestion of the samples by HNO3 acid, the concentration of Cu2+ and Ce3+ were investigated for indicating the yield for the generation of CuNCs. The amounts of CuNCs would be in a linear relationship with the concentration of Cu2+ in the product. It could be seen that the yield of CuNCs did not increase by Ce3+-induced aggregation for samples 2–9 compared to the original synthesis method for sample 1, since the concentration of Cu2+ did not increase. However, both the concentrations of Cu2+ and Ce3+ in the products tended to be higher as a function of the adding Ce3+ after dispersing the aggregates with Na2CO3. When 179.07 ppm of Ce3+ was applied, almost 100% recovery ratio was found in the product, which indicated that Ce3+ would be present in the rearranged product after crosslinking aggregation. The presence of Ce3+ could also be observed from the SEM-energy-dispersive system (EDS) characterization in Figure S17. This further confirmed that Ce3+ contributed to the crosslinking aggregation process and would be doped in the product. However, the fluorescence enhancement for the Ce3+-induced aggregates had nothing to do with the yield for CuNCs. Meanwhile, EDS-MAPPING was employed for the analysis of the element distribution for A-CuNCs-1 and A-CuNCs-2, respectively, see Figures S18 and S19. It was found that the distribution of Cu was similar to S for both samples, indicating that the covered protection ligand of l-cysteine played a pivotal role in stabilizing the aggregates of CuNCs. Furthermore, by comparing the HAADF image for different elements in Figure S19, relatively diluted distribution was found for Ce. It could be concluded that the presence of Ce3+ was just responsible for the connection of the dispersed CuNCs as aggregates rather than doping with the CuNCs.
Table 2. Yield of Cu2+ and Ce3+ in the Aggregated CuNCsa.
| sample | adding Cu2+ (ppm) | detecting Cu2+ (ppm) | adding Ce3+ (ppm) | detecting Ce3+ (ppm) |
|---|---|---|---|---|
| 1 | 286.04 | 288.42 | 0.00 | |
| 2 | 286.04 | 17.95 | 6.31 | 4.21 |
| 3 | 286.04 | 58.54 | 18.93 | 13.89 |
| 4 | 286.04 | 131.71 | 44.18 | 32.53 |
| 5 | 286.04 | 179.07 | 63.11 | 63.17 |
| 6 | 286.04 | 251.29 | 126.22 | 92.40 |
| 7 | 286.04 | 218.37 | 252.43 | 83.60 |
| 8 | 286.04 | 237.68 | 504.86 | 105.04 |
| 9 | 286.04 | 231.66 | 631.08 | 110.32 |
1 indicated A-CuNCs-1; 2–9 indicated A-CuNCs-2 induced by different amounts of Ce3+.
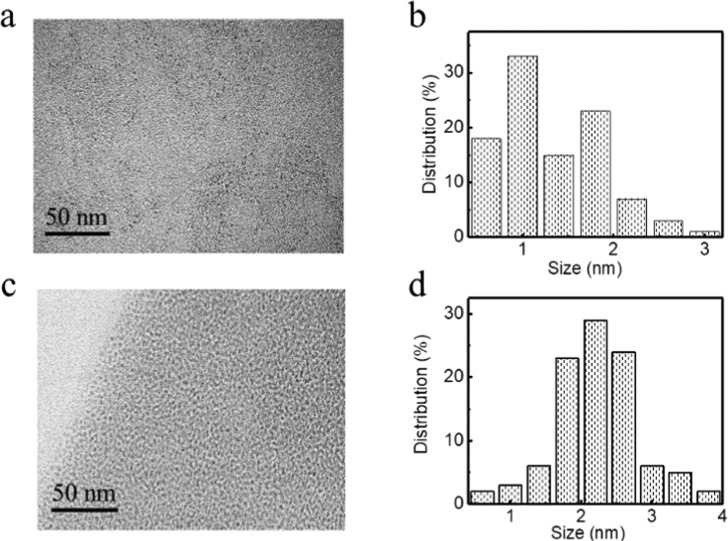
Since SEM could not reveal more detail structure for the interior nanosheets, high-resolution transmission electron microscopy (HR-TEM) was studied, see Figure 6. The micrograph showed that A-CuNCs-1 were constructed by the NCs with a size smaller than 3 nm on average (Figure 6a,b). On the other hand, the obtained images revealed that A-CuNCs-2 were well-dispersed and their average diameters were about 2.5 nm, see Figure 6c,d. On the basis of the HR-TEM investigation, it could be confirmed that both the aggregated CuNCs were built with the ultra-small size NCs as the blocks though the structures were quite different. In addition, the fluorescence lifetime is shown in Figure S20. The fluorescence decay curve of the samples could be fitted with a bi-exponential decay function with two components, which is described as follows.
The results are demonstrated in Table S1. It could be seen that the lifetime increased from 3.7 to 9.7 μs. A much longer lifetime was obtained for the Ce3+-regulated CuNCs. This suggested that the regulated AIE product of A-CuNCs-2 suppressed the static quenching effects of the NCs more significantly than A-CuNCs-1.37 Herein, the more regulated aggregation leads to a stronger inter- and intra-NC interactions. Then, the molecular vibrational, rotational, and torsional movements of CuNCs would be further restricted, which reduced the probability of the nonradiative path. Then, the radiative decay could be activated. As a result, both the fluorescence lifetime and intensity were enhanced.38
Figure 6.
TEM (a) and the corresponding size distribution diagram (b) of A-CuNCs-1. TEM (c) and the corresponding size distribution diagram (d) of A-CuNCs-2.
Fourier-transform infrared (FTIR) spectroscopy was performed to figure out how l-cysteine was protected on the surface of CuNCs (see Figure S21). The peak at ca. 2500 cm–1 did not exist, which indicated the absence of the −SH stretching vibration mode of the l-cysteine molecule in the FTIR spectrum of CuNCs.39 It could be concluded that l-cysteine had been connected with the Cu core through Cu–S bonding for both aggregates. Matrix assisted laser desorption/ionization-time of flight mass spectrometry (MALDI-TOF-MS) was used to analyze the component of aggregated CuNCs (see Figure S22). There was a broad band for A-CuNCs-1 at various regions indicating the existence of different cluster species. Figure S22a shows that the existence of Cu4, Cu5, Cu7, and Cu8 with the combination of different number of protection ligands (L, l-cysteine). On the other hand, Cu4, Cu5, Cu6, and Cu7 fragment ions are more concentrated in Figure S22b, which suggested that the species of NCs in A-CuNCs-2 distributed more evenly.
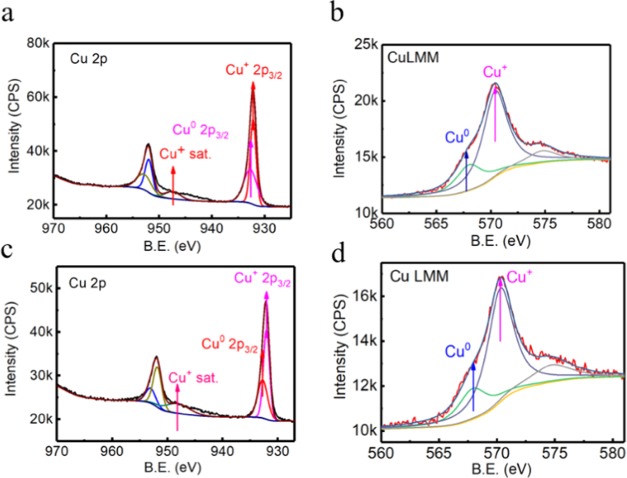
Figure 7 demonstrates the oxidation states of Cu in the aggregates by X-ray photoelectron spectroscopy (XPS). Two binding energy peaks at 932.4 and 952.1 eV were observed, which were attributed to the Cu 2p spectrum of Cu 2p3/2 and Cu 2p1/2 signals, respectively. The absence of large shake up satellite peaks from 938 to 946 eV revealed the absence of Cu2+ species in the product. It was normally difficult to distinguish Cu0 from Cu+ because the difference between the binding energy was only 0.1 eV.38 However, the emergence of a slight shake up at 947.6 eV clearly indicated the presence of Cu+. Additionally, the broad peak for Cu 2p3/2 at 952.1 eV indicated that Cu0 species should be coexisting with Cu+. On the other hand, the peaks for Cu LMM were deconvoluted into two peaks of Cu+ and Cu0 species by using the XPSPEAK41 software. Due to the presence of a shoulder peak at 574.7 eV, an extra Gaussian–Lorentzian band at 574.7 eV was used to eliminate the effect of other orbital electrons.40 The strong peak at 525.4 eV and a small peak at 568.0 eV in Cu LMM Auger spectrum confirmed that both Cu0 and Cu+ were present in A-CuNCs-1 as well. On the other hand, the XPS investigation was studied after the introduction of Ce3+ for A-CuNCs-2. The Cu 2p spectrum exhibited two binding energy peaks at 932.1 and 952.1 eV, which could be assigned to the Cu 2p3/2 and Cu 2p1/2 signals originated from Cu0 species. Meanwhile, the emergence of a slight shake up at 947.6 eV was also observed indicating the presence of Cu+. A relatively stronger peak at 570.3 eV and a weaker peak at 568.0 eV in the Cu LMM Auger spectrum indicated that there is a larger proportion of Cu0 than Cu+. The XPS results for both aggregates were consistent with previous l-cysteine protected CuNCs.12 No significant valence change was found for Cu in the regulated aggregated A-CuNCs-2 compared to A-CuNCs-1. Meanwhile, no significant valence state change was found for Ce3+ after re-aggregation (see Figure S23). Therefore, it could be concluded that the charge transfer played an insignificant role for the fluorescence enhancement here.
Figure 7.
(a) XPS of the Cu 2p spectrum and (b) the peak-fitted Cu LMM Auger spectrum for A-CuNC-1. (c) The XPS of the Cu 2p spectrum and (d) the peak-fitted Cu LMM Auger spectrum for A-CuNC-2.
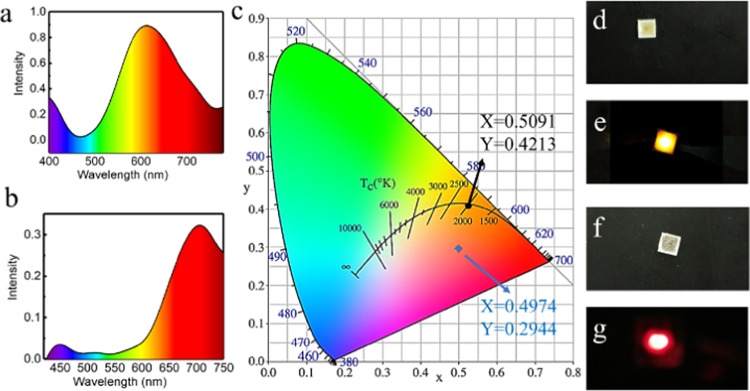
According to previous work, the aggregated CuNCs protected by l-cysteine were stable at room temperature.12 However, the fluorescence of the product might suffer from a significant change for applications due to the unstable properties at more aggressive conditions. To quickly compare the stability in other conditions, a water bath heating protocol was employed for the investigation of the fluorescence change for A-CuNCs-1 and A-CuNCs-2 in neutral water solution, see Figure S24. It could be seen that the fluorescence of A-CuNCs-1 was completely disappeared within 10 h at 80 °C. On the other hand, the fluorescence of A-CuNCs-2 tended to be stable later after though the fluorescence also decreased initially. This indicated that A-CuNCs-1 would demonstrate little application potential in some cases because the fluorescence would no longer exist or dramatically change. For understanding the case in more practical application, A-CuNCs-1 and A-CuNCs-2 were prepared as powders by freeze-drying for LED fabrication. The configuration of the LED device, the optical spectra, and the CIE diagram are shown in Figure 8. It could be seen from Figure 8a that the LED device described a peak centered at 612 nm as fabricated by A-CuNCs-2. An orange-emitting LED device with CIE 1931 chromaticity coordinate, color rendering index, and color purity of (0.5091, 0.4213), 71.0, 81.3% were obtained respectively. Compared to the fluorescence emission spectra for the colloid of A-CuNCs-2 as shown in Figure 5b (green line), no significant red shift for the emission was demonstrated after fabrication of the product as devices. Additionally, the CIE almost lied on the Planckian locus, which indicated that the illumination from the as fabricated device was extremely close to natural light.
Figure 8.
(a) Emission spectrum of LED employing the powder of (a) A-CuNCs-1 and (b) A-CuNCs-2. (b) CIE chromaticity coordinate of the device for A-CuNCs-1 (blue arrow) and A-CuNCs-2 (black arrow). A photograph of the (d) inworking and (e) working emitting device for A-CuNCs-1; a photograph of the corresponding (f) inworking and (g) working emitting device for A-CuNCs-2.
On the other hand, the LED device described a much different spectra compared to Figure 5b (blue line) for A-CuNCs-1 after fabrication. Actually, the emission could hardly be detected precisely after fabrication due to the extremely weak brightness. In addition, the emission peak suffered a significant red shift from 615 to ca. 700 nm. A mixed-color-emitting LED with CIE 1931 chromaticity coordinate, color rendering index, and color purity of (0.4974, 0.2944), 51.6, and 48.6% were obtained, respectively. It should be noticed that the color purity was so poor that it would be quite difficult to simulate natural light. The results revealed that the powder for A-CuNCs-1 could not survive the heating preparation step well for fabrication as a LED with satisfied efficiency. This was in accordance with Figure S24 that A-CuNCs-2 tended to keep its fluorescence in relatively aggressive conditions, but the fluorescence of A-CuNCs-1 completely disappeared at 80 °C water bath. However, further effort should still be contributed to modify the stability of CuNCs.
Conclusions
A facile method was established for the fabrication of aggregated l-cysteine-protected copper nanoclusters as 3D nanomaterials with a mesoporous sphere structure. It was found that the aggregates of l-cysteine-protected copper nanoclusters with irregular structures could be dispersed with appropriate amounts of Na2CO3. Furthermore, self-assembly of nanomaterials with 3D morphology could be obtained with stronger fluorescence and stability by the affinity of Ce3+. It was expected that this strategy could be extended to regulate the morphology of other nanoclusters with a protection ligand that has the crosslinking ability, which would be a promising new path for improving aggregates with regulated structures. Finally, these powders of aggregated CuNCs with irregular and regular morphology were employed as color converters in LED devices. It was confirmed that the rearranged aggregates demonstrated more excellent illumination performance than the irregular structured product.
Methods
Materials
Copper sulfate (CuSO4), sodium carbonate (Na2CO3), l-cysteine, and various types of metal salts were purchased from Sigma-Aldrich. Other reagents and solvents were all of analytical grade and obtained from Aladdin reagent company. Deionized water was used for all of the experiments. All glassware were cleaned with aqua regia and rinsed with water prior to use.
Instrumentation
Fluorescence emission and excitation spectra were recorded using a fluorescence spectrophotometer (F97, Shanghai Lingguang). UV–visible absorption spectra were recorded with a UV-7504 UV–vis spectrophotometer (Shanghai Xinmao). Scanning electron microscopy (SEM) were performed using Hitachi SU8020. The morphology of the samples was examined by transmission electron microscopy (TEM) with a FEI Tecnai G2 F20 microscope. X-ray photoelectron spectroscopy (XPS) analysis was carried out using Thermo Escalab 250Xi under Al Kα radiation. FTIR spectra were investigated using a Nicolet iS5 FTIR Spectrometer. The fluorescence lifetime was conducted on a FL920 time-correlated single-photon-counting fluorescence lifetime spectrometer (Edinburgh Analytical Instruments, Edinburgh, U.K.). The concentrations of Cu2+ and Ce2+ were determined by ICP-MS (Thermo Fisher). The CIE color coordinates, CRI, and color purity of LEDs were measured in an integrating sphere with a spectroradiometer (Haas-2000, Everfine, China).
Preparation of A-CuNCs-1
100 μL of 0.1 M CuSO4·5H2O solution was injected in 2 mL of 0.1 M l-cysteine at room temperature. After that, the mixture was shaken by a vortex mixer for 10 min.
Preparation of A-CuNCs-2
For a typical synthesis process, 100 μL of 0.1 M of CuSO4.5H2O was dissolved in 2 mL of 0.1 M l-cysteine at room temperature with the assistance of shaking by a vortex mixture for 10 min. Then, an appropriate amount of Na2CO3 (0.1 M) was titrated to disperse the aggregates in water solvent until the colloid was just dispersed as a soluble colloid. After that, Ce3+ with different amounts was added to produce new aggregates.
Determination of Copper and Cerium
2 mL of the mixture for aggregated CuNCs in water solvent was washed and precipitated by centrifugation at 4000 rpm. After that, the precipitates were collected and washed three times using the same protocol. Finally, the samples were dispersed in 1 mL of countertraded HNO3. After complete digestion, the solution was diluted appropriately to meet the range for ICP-MS determination.
Fabrication of LEDs
A GaN LED chip with the emission centered at 395 nm were selected. 0.1 g of the powder for the aggregated CuNCs were mixed with 0.1 g of thermal-curable silicone resin. The mixtures were dried under 50 °C for 1 h and mixed with 0.2 g of the hardener OE-6551B. The mixtures were placed into a vacuum chamber to remove bubbles. After drying for 2 more hours, the LED devices were fabricated.
Acknowledgments
We are grateful for the financial support from the National Natural Science Foundation of China (Grant nos. 81702105 and 81671742) and Natural Science Foundation of Liaoning Province (Grant no. 201602288).
Supporting Information Available
The Supporting Information is available free of charge on the ACS Publications website at DOI: 10.1021/acsomega.8b02204.
Characterization data of the detail influence of metal ions by fluorescence emission spectra, SEM, optical photo; graphical illustration of the assembling process; size distribution of the aggregates indicated by diagram and DLS; characterization of irregular and regular CuNCs by Lifetime, FTIR, MALDI-TOF-MS; XPS for Ce 3d of the regular sample; stability test of the CuNCs indicated by fluorescence emission spectra and the fluorescent photos of the CuNCs influenced by different concentrations of metal ions (PDF)
Author Contributions
All authors have given approval to the final version of the manuscript. D.L. and G.W. contributed equally to this work.
This work is supported by the National Natural Science Foundation of China (Grant nos. 81702105 and 81671742) and Liaoning (Grant no. 201602288).
The authors declare no competing financial interest.
Supplementary Material
References
- Li D.; Chen Z.; Mei X. Fluorescence enhancement for noble metal nanoclusters. Adv. Colloid Interface Sci. 2017, 250, 25–39. 10.1016/j.cis.2017.11.001. [DOI] [PubMed] [Google Scholar]
- Chao Y. C.; Cheng K. P.; Lin C. Y.; Chang Y. L.; Ko Y. Y.; Hou T. Y.; Huang C. Y.; Chang W. H.; Lin C. J. Non-Toxic Gold Nanoclusters for Solution-Processed White Light-Emitting Diodes. Sci. Rep. 2018, 8, 8860 10.1038/s41598-018-27201-x. [DOI] [PMC free article] [PubMed] [Google Scholar]
- Abbas M. A.; Kamat P. V.; Bang J. H. Thiolated Gold Nanoclusters for Light Energy Conversion. ACS Energy Lett. 2018, 3, 840–854. 10.1021/acsenergylett.8b00070. [DOI] [Google Scholar]
- Deng H. H.; Li K. L.; Zhuang Q. Q.; Peng H. P.; Zhuang Q. Q.; Liu A. L.; Xia X. H.; Chen W. An ammonia-based etchant for attaining copper nanoclusters with green fluorescence emission. Nanoscale 2018, 10, 6467–6473. 10.1039/C7NR09449C. [DOI] [PubMed] [Google Scholar]
- Liu X.; Astruc D. Atomically precise copper nanoclusters and their applications. Coord. Chem. Rev. 2018, 359, 112–126. 10.1016/j.ccr.2018.01.001. [DOI] [Google Scholar]
- Li D.; Zhao Y.; Chen Z.; Mei X.; Qiu X. Enhancement of fluorescence brightness and stability of copper nanoclusters using Zn2+ for ratio-metric sensing of S2–. Mater. Sci. Eng., C 2017, 78, 653–657. 10.1016/j.msec.2017.04.147. [DOI] [PubMed] [Google Scholar]
- Jin R.; Zeng C.; Zhou M.; Chen Y. Atomically Precise Colloidal Metal Nanoclusters and Nanoparticles: Fundamentals and Opportunities. Chem. Rev. 2016, 116, 10346–10413. 10.1021/acs.chemrev.5b00703. [DOI] [PubMed] [Google Scholar]
- Shen J.; Wang Z.; Sun D.; Liu G.; Yuan S.; Kurmoo M.; Xin X. Self-assembly of water-soluble silver nanoclusters: superstructure formation and morphological evolution. Nanoscale 2017, 9, 19191–19200. 10.1039/C7NR06359H. [DOI] [PubMed] [Google Scholar]
- Pan S.; Liu W.; Tang J.; Yang Y.; Feng H.; Qian Z.; Zhou J. Hydrophobicity-guided self-assembled particles of silver nanoclusters with aggregation-induced emission and their use in sensing and bioimaging. J. Mater. Chem. B 2018, 6, 3927–3933. 10.1039/C8TB00463C. [DOI] [PubMed] [Google Scholar]
- Yang T.; Dai S.; Yang S.; Chen L.; Liu P.; Dong K.; Zhou J.; Chen Y.; Pan H.; Zhang S.; Chen J.; Zhang K.; Wu P.; Xu J. Interfacial Clustering-Triggered Fluorescence-Phosphorescence Dual Solvoluminescence of Metal Nanoclusters. J. Phys. Chem. Lett. 2017, 8, 3980–3985. 10.1021/acs.jpclett.7b01736. [DOI] [PubMed] [Google Scholar]
- Kong L.; Chu X.; Wang C.; Zhou H.; Wu Y.; Liu W. d-Penicillamine-coated Cu/Ag alloy nanocluster superstructures: aggregation-induced emission and tunable photoluminescence from red to orange. Nanoscale 2018, 10, 1631–1640. 10.1039/C7NR08434J. [DOI] [PubMed] [Google Scholar]
- Su X.; Liu J. pH-Guided Self-Assembly of Copper Nanoclusters with Aggregation-Induced Emission. ACS Appl. Mater. Interfaces 2017, 9, 3902–3910. 10.1021/acsami.6b13914. [DOI] [PubMed] [Google Scholar]
- Kuppan B.; Maitra U. Instant room temperature synthesis of self-assembled emission-tunable gold nanoclusters: million-fold emission enhancement and fluorimetric detection of Zn2+. Nanoscale 2017, 9, 15494–15504. 10.1039/C7NR05659A. [DOI] [PubMed] [Google Scholar]
- Wu Z.; Li Y.; Liu J.; Lu Z.; Zhang H.; Yang B. Colloidal self-assembly of catalytic copper nanoclusters into ultrathin ribbons. Angew Chem., Int. Ed. 2014, 53, 12196–12200. 10.1002/anie.201407390. [DOI] [PubMed] [Google Scholar]
- Wu Z.; Liu J.; Li Y.; Cheng Z.; Li T.; Zhang H.; Lu Z.; Yang B. Self-Assembly of Nanoclusters into Mono-, Few-, and Multilayered Sheets via Dipole-Induced Asymmetric van der Waals Attraction. ACS Nano 2015, 9, 6315–6323. 10.1021/acsnano.5b01823. [DOI] [PubMed] [Google Scholar]
- Liu J.; Wu Z.; Tian Y.; Li Y.; Ai L.; Li T.; Zou H.; Liu Y.; Zhang X.; Zhang H.; Yang B. Engineering the Self-Assembly Induced Emission of Cu Nanoclusters by Au(I) Doping. ACS Appl. Mater. Interfaces 2017, 9, 24899–24907. 10.1021/acsami.7b06371. [DOI] [PubMed] [Google Scholar]
- Wu Z.; Liu H.; Li T.; Liu J.; Yin J.; Mohammed O. F.; Bakr O. M.; Liu Y.; Yang B.; Zhang H. Contribution of Metal Defects in the Assembly Induced Emission of Cu Nanoclusters. J. Am. Chem. Soc. 2017, 139, 4318–4321. 10.1021/jacs.7b00773. [DOI] [PubMed] [Google Scholar]
- Tang C.; Zhong L.; Zhang B.; Wang H. F.; Zhang Q. 3D Mesoporous van der Waals Heterostructures for Trifunctional Energy Electrocatalysis. Adv. Mater. 2018, 30, 1705110 10.1002/adma.201705110. [DOI] [PubMed] [Google Scholar]
- Zeng J.; Xia Y. Hybrid nanomaterials. Not just a pretty flower. Nat. Nanotechnol. 2012, 7, 415–6. 10.1038/nnano.2012.105. [DOI] [PubMed] [Google Scholar]
- Sanz-Ortiz M. N.; Sentosun K.; Bals S.; Liz-Marza L. M. Templated Growth of Surface Enhanced Raman Scattering-Active Branched Gold Nanoparticles within Radial Mesoporous Silica Shells. ACS Nano 2015, 9, 10489–10497. 10.1021/acsnano.5b04744. [DOI] [PMC free article] [PubMed] [Google Scholar]
- Ai L.; Li Y.; Wu Z.; Liu J.; Gao Y.; Liu Y.; Lu Z.; Zhang H.; Yang B. Photoinduced Conversion of Cu Nanoclusters Self-Assembly Architectures from Ribbons to Spheres. J. Phys. Chem. C 2016, 120, 24427–24436. 10.1021/acs.jpcc.6b06600. [DOI] [Google Scholar]
- Dutta A.; Goswami U.; Chattopadhyay A. Probing Cancer Cells through Intracellular Aggregation-Induced Emission Kinetic Rate of Copper Nanoclusters. ACS Appl. Mater. Interfaces 2018, 10, 19459–19472. 10.1021/acsami.8b05160. [DOI] [PubMed] [Google Scholar]
- Goswami N.; Yao Q.; Luo Z.; Li J.; Chen T.; Xie J. Luminescent Metal Nanoclusters with Aggregation-Induced Emission. J. Phys. Chem. Lett. 2016, 7, 962–975. 10.1021/acs.jpclett.5b02765. [DOI] [PubMed] [Google Scholar]
- Wang G. L.; Jiao H. J.; Zhu X. Y.; Dong Y. M.; Li Z. J. Novel switchable sensor for phosphate based on the distance-dependant fluorescence coupling of cysteine-capped cadmium sulfide quantum dots and silver nanoparticles. Analyst 2013, 138, 2000–2006. 10.1039/c3an36878e. [DOI] [PubMed] [Google Scholar]
- Huang Y.; Feng H.; Liu W.; Zhang S.; Tang C.; Chen J.; Qian Z. Cation-driven luminescent self-assembled dots of copper nanoclusters with aggregation-induced emission for β-galactosidase activity monitoring. J. Mater. Chem. B 2017, 5, 5120–5127. 10.1039/C7TB00901A. [DOI] [PubMed] [Google Scholar]
- Li D.; Chen Z.; Yang T.; Wang H.; Lu N.; Mei X. Green synthesis of highly fluorescent AuNCs with red emission and their special sensing behavior for Al3+. RSC Adv. 2016, 6, 19182–19189. 10.1039/C6RA00912C. [DOI] [Google Scholar]
- Li D.; Chen Z.; Wan Z.; Yang T.; Wang H.; Mei X. One-pot development of water soluble copper nanoclusters with red emission and aggregation induced fluorescence enhancement. RSC Adv. 2016, 6, 34090–34095. 10.1039/C6RA01499B. [DOI] [Google Scholar]
- Han B.; Hu X.; Yu M.; Peng T.; Li Y.; He G. One-pot synthesis of enhanced fluorescent copper nanoclusters encapsulated in metal-organic frameworks. RSC Adv. 2018, 8, 22748–22754. 10.1039/C8RA03632B. [DOI] [PMC free article] [PubMed] [Google Scholar]
- Huang Y.; Feng H.; Liu W.; Zhou Y.; Tang C.; Ao H.; Zhao M.; Chen G.; Chen J.; Qian Z. Luminescent Aggregated Copper Nanoclusters Nanoswitch Controlled by Hydrophobic Interaction for Real-Time Monitoring of Acid Phosphatase Activity. Anal. Chem. 2016, 88, 11575–11583. 10.1021/acs.analchem.6b02957. [DOI] [PubMed] [Google Scholar]
- Goswami N.; Giri A.; Bootharaju M. S.; Xavier P. L.; Pradeep T.; Pal S. K. Copper quantum clusters in protein matrix: potential sensor of Pb2+ ion. Anal. Chem. 2011, 83, 9676–9680. 10.1021/ac202610e. [DOI] [PubMed] [Google Scholar]
- Huang H.; Li H.; Feng J.-J.; Feng H.; Wang A.-J.; Qian Z. One-pot green synthesis of highly fluorescent glutathione-stabilized copper nanoclusters for Fe3+ sensing. Sens. Actuators, B 2017, 241, 292–297. 10.1016/j.snb.2016.10.086. [DOI] [Google Scholar]
- Huang H.-Y.; Cai K.-B.; Chen P.-W.; Lin C.-A. J.; Chang S.-H.; Yuan C.-T. Engineering Ligand–Metal Charge Transfer States in Cross-Linked Gold Nanoclusters for Greener Luminescent Solar Concentrators with Solid-State Quantum Yields Exceeding 50% and Low Reabsorption Losses. J. Phys. Chem. C 2018, 122, 20019–20026. 10.1021/acs.jpcc.8b06212. [DOI] [Google Scholar]
- Guan G.; Zhang S. Y.; Cai Y.; Liu S.; Bharathi M. S.; Low M.; Yu Y.; Xie J.; Zheng Y.; Zhang Y. W.; Han M. Y. Convenient purification of gold clusters by co-precipitation for improved sensing of hydrogen peroxide, mercury ions and pesticides. Chem. Commun. 2014, 50, 5703–5705. 10.1039/c4cc02008a. [DOI] [PubMed] [Google Scholar]
- Acres R. G.; Feyer V.; Tsud N.; Carlino E.; Prince K. C. Mechanisms of Aggregation of Cysteine Functionalized Gold Nanoparticles. J. Phys. Chem. C 2014, 118, 10481–10487. 10.1021/jp502401w. [DOI] [Google Scholar]
- Chen X.; Cheng X.; Gooding J. J. Multifunctional modified silver nanoparticles as ion and pH sensors in aqueous solution. Analyst 2012, 137, 2338–2343. 10.1039/c2an35147a. [DOI] [PubMed] [Google Scholar]
- Aparna R. S.; Anjali Devi J. S.; Sachidanandan P.; George S. Polyethylene imine capped copper nanoclusters- fluorescent and colorimetric onsite sensor for the trace level detection of TNT. Sens. Actuators, B. 2018, 254, 811–819. 10.1016/j.snb.2017.07.097. [DOI] [Google Scholar]
- Yahia-Ammar A.; Sierra D.; Merola F.; Hildebrandt N.; Le Guevel X. Self-Assembled Gold Nanoclusters for Bright Fluorescence Imaging and Enhanced Drug Delivery. ACS Nano 2016, 10, 2591–2599. 10.1021/acsnano.5b07596. [DOI] [PubMed] [Google Scholar]
- Wang Z.; Chen B.; Susha A. S.; Wang W.; Reckmeier C. J.; Chen R.; Zhong H.; Rogach A. L. All-Copper Nanocluster Based Down-Conversion White Light-Emitting Devices. Adv. Sci. 2016, 3, 1600182 10.1002/advs.201600182. [DOI] [PMC free article] [PubMed] [Google Scholar]
- Parker S. F. Assignment of the vibrational spectrum of l-cysteine. Chem. Phys. 2013, 424, 75–79. 10.1016/j.chemphys.2013.04.020. [DOI] [Google Scholar]
- Wang A.; Zhang M.; Yin H.; Liu S.; Liu M.; Hu T. Direct reaction between silicon and methanol over Cu-based catalysts: investigation of active species and regeneration of CuCl catalyst. RSC Adv. 2018, 8, 19317–19325. 10.1039/C8RA03125H. [DOI] [PMC free article] [PubMed] [Google Scholar]
Associated Data
This section collects any data citations, data availability statements, or supplementary materials included in this article.


