Abstract
Exposure of a protein to cosolutes, like denaturants, changes its folding equilibrium. To determine the ensemble of protein conformations at equilibrium, in the presence of weakly interacting cosolutes, we present a two-stage analysis of solution X-ray scattering data. In the first stage, Guinier analysis and Kratky plot revealed information about the compactness and flexibility of the protein. In the second stage, elastic network contact model and coarse-grained normal mode analysis were used to generate an ensemble of conformations. The scattering curves of the conformations were computed and fitted to the measured scattering curves to get insights into the dominating folding states at equilibrium. Urea and guanidine hydrochloride (GuHCl) behaved as preferentially included weakly interacting cosolutes and induced denaturation of hen egg-white lysozyme, which served as our test case. The computed models adequately fit the data and gave ensembles of conformations that were consistent with our measurements. The analysis suggests that in the presence of urea, lysozyme retained its compactness and assumed molten globule characteristics, whereas in the presence of GuHCl lysozyme adopted random coiled conformations. Interestingly, no equilibrium intermediate states were observed in both urea and GuHCl.
1. Introduction
Protein folding has been studied for over half a century and is still considered an unresolved problem.1,2 Unclear aspects of this problem include the stability of proteins in the presence of denaturing cosolutes. Environmental conditions determine if a protein remains in its stable and compact folded state or explores the energy landscape with a more structurally diverse ensemble of unfolded and partly unfolded states.2
The folded or native state of a globular protein is defined as the small ensemble of compact conformations in which the protein is stable and performs its action. The folded state is in dynamic equilibrium with unfolded states, comprising of a large ensemble of iso-energetic, disordered, and extended conformations, which have higher entropy, but are energetically unfavored. Exposure to extreme conditions, including low or high temperatures, high pressure, or the presence of cosolutes, might perturb the compact protein structure, cause denaturation, and shift the equilibrium toward unfolded states.3
At equilibrium, the balance between the folded and unfolded states is set by the protein energy landscape. The free-energy landscape is typically modeled as a funnel shape, where the folded state is located at the bottom of the funnel, at the global free energy minimum conformation, whereas unfolded states, having higher free energies, are located at the top of the funnel.4 According to this theory, protein folds by taking thermodynamically driven steps that are mostly incrementally downhill toward the free energy minimum. As the folded state is only 5–10 kcal/mol more stable than the unfolded state, even a small disruption of intermolecular interactions may shift the folding equilibrium.4,5
The ensemble of conformations of intrinsically disordered proteins or dynamic biomolecules with disordered segments were determined by combining solution X-ray scattering experiments with several computational methods. Ensemble optimization method, basis-set supported small-angle X-ray scattering (SAXS) reconstruction, or molecular dynamics (MD) simulations with minimal ensemble search approach are examples of methods that were used.6−15
In this paper, we studied the effect of the weakly interacting denaturant cosolutes, urea, and GuHCl, on the structure of hen egg-white lysozyme, using modern synchrotron X-ray scattering and advanced analysis tools. The dominating folding states at equilibrium, under various concentrations of denaturants, were structurally examined.
Lysozyme is a monomeric, globular, and antimicrobial enzyme protein, abundant in tears, saliva, and human milk.16 Lysozyme has 129 amino acid residues and its molecular weight is 14 300 Da. The compact globule structure is stabilized by four disulfide bonds and two domains: an α-domain that contains several α-helices and a β-domain comprised largely of β-stands.17 Lysozyme serves as a model protein for investigating protein stability, folding,18 denaturation,19−21 and aggregation.22 Lysozyme was selected owing to its stability and that it has no significantly populated equilibrium intermediate states in urea- and GuHCl-induced unfolding, making it a good example of a protein that fits the two-state unfolding mechanism of protein under several denaturing conditions.18,19,23,24 This feature is attributed to the tight packing at the interface between the two domains, allowing them to operate as a single cooperative unit.20
Urea and GuHCl are widely-known as protein denaturants that shift the dynamic equilibrium in favor of unfolded states above a critical concentration. It is believed that the contribution of urea and GuHCl to protein denaturation is enthalpic (in other words, involves specific cosolute/protein hydrophobic, van der Waals, or polar interactions) and is associated with weakening of the hydrophobic effect.3 By doing so, the denaturants solvate nonpolar surfaces, induce swelling of the amino acid chain, and stabilize hydrophobically confined liquid phase against dewetting.25 Despite the vast amount of research done on urea and GuHCl, the mechanism governing their activity has remained elusive,3 owing to the weak interactions that are involved in the process and because molar concentrations are required to destabilize proteins.26 It is unclear, for example, whether the interactions of the cosolute are directly with the protein or indirectly through modification of the solvent properties.
2. Materials and Methods
2.1. Chemicals
Lyophilized powder of hen egg-white lysozyme (purity ≥ 90%), urea (≥99.0%), guanidine hydrochloride (≥99%), sucrose (≥99.5%), and glycine (≥99%) were purchased from Sigma-Aldrich. For the buffer preparation (50 mM sodium acetate, pH 4.5), we used sodium acetate trihydrate (≥99.0%) and glacial acetic acid (≥99.85%) that were purchased from Sigma-Aldrich. All chemicals were used without further purification.
The following analysis is suitable for nonaggregating proteins. Because lysozyme aggregates from 4 M GuHCl,22 we chose to work with lower concentrations of GuHCl.
2.2. Solution SAXS
Measurements of 2.5 mg/mL lysozyme were performed in P12 beamline of the EMBL located at the PETRA III storage ring (DESY, Hamburg).27 Measurements of 5 and 50 mg/mL lysozyme were performed in SWING beamline at Soleil Synchrotron (GIF-sur-YVETTE).28 Measurements were performed at 20 °C. Two-dimensional scattering patterns were azimuthally integrated29 and gave the 1D scattering intensity, I (cm–1), as a function of the magnitude of the scattering vector, q (nm–1). Under similar solution conditions, the scattering curves, normalized by sample concentration, of low and high concentration of lysozyme overlapped from q > 1 nm–1 (Figure S1). At the high concentrations of lysozyme, the signal-to-noise ratio was high; however, at the low q-range (q < 1 nm–1) the interaction between the protein contributed to structure factor, which was not observed at the low concentration. We therefore merged the curves and used the curve of 2.5 mg/mL lysozyme for q ≤ 1 nm–1 and the curves of 50 mg/mL lysozyme for q > 1 nm–1.
2.3. Elastic Network Contact Model
We generated different conformations of lysozyme using elastic network contact model (ENCoM),30 a coarse-grained normal mode analysis method for exploring protein conformational space.30 The protein data bank (PDB) ID used as the initial structure for conformational sampling was 1LYZ, a structure that was obtained by X-ray diffraction at 2 Å resolution.17 We generated an ensemble that contained three sets of conformations with different ranges of root-mean-square-deviation of atomic positions (rmsd) values, with respect to the crystal structure. The ranges were 0–2, 3–10, and 8–17 Å, corresponding to folded, partially folded, and unfolded conformations, respectively. The number of conformations was the maximum ENCoM can generate, using its default parameters 257 folded, 340 partially folded, and 340 unfolded conformations. We used the default parameters (the number of modes was 3, the start mode was 7, and the rmsd distortion per conformation was 0.5 Å) and adjusted the maximum rmsd distortion as needed.
2.4. Computing the Scattering Curves of Atomic Models
The scattering intensity depends on the contrast between the electron density of the solute atomic model and the solvent. Following the addition of chemical denaturants in molar concentrations, we had to correct the bulk electron density of the solvent (see Table S1). We computed the expected scattering curve from each atomic model, using CRYSOL.31 The maximum order of harmonics was 50, and the order of Fibonacci grid was 18. A 3 Å thick hydration layer with an electron density contrast of 30 e–/nm3 with respect to the bulk was added to each atomic structure. K-means clustering algorithm was applied and the scattering curve of the centroid of each cluster was calculated by wide angle X-ray scattering in solvent (WAXSiS), an automated web server, which runs a short explicit-solvent MD simulation using YASARA.32,33 WAXSiS produces a more accurate model of the solvation shell (compared with CRYSOL31) surrounding the protein. In WAXSiS, the default envelop distance (7 Å) and normal convergence were used.
2.5. Cluster Analysis
Clustering was performed by K-means clustering method over the log(I) versus q plots of the scattering curves calculated by CRYSOL. The logarithmic intensity scale allowed us to cluster according to the entire q-range. Otherwise, the large differences in intensity along the entire q-range would cause the clustering process to be according to the low q-range only. For each cluster, the model with the logarithmic scattering curve with the lowest squared Euclidean distance to the centroid was chosen to be the representative model for that cluster. Clustering was performed for each set of scattering curves with the same solvent electron density, using 1000 repetitions.
2.6. Fitting
Fitting of log(I) versus q plots was performed using least-squares minimization of the sum of residual blocks of the scattering curves and the models calculated by WAXSiS, at each q
where Icalc(q) = B + A∑i=1NxiIi(q).
x⃗ is the weight vector, I(q) is the measured scattering curve, Ii(q) is the scattering curve of the i-th centroid conformation, and xi is the molar fraction of the i-th conformation. B is a background constant and A is a scale factor that was added to improve the fit. The maximum number of iterations was set to 1010, the tolerance step size was set to 10–10, and the function tolerance was set to 10–10. FMINCON algorithm was used to solve the nonlinear optimization problem.34
To estimate the error in the probability distribution, Icalc(q) was fitted to 50% of the data points, which were randomly selected. The errors did not change when 80% of the data points were taken into account. For each sample, the fit was repeated 5 times and the error was estimated from the standard deviations of the resulting distributions. The reported distribution is based on fitting to the entire data.
Figure S2 shows that when only 30% of data points were randomly selected, the resulting population of the native state, in some of the fits, contained a higher fraction of unfolded conformations than physically expected. Hence, more than 30% of the data points (217 points) were required to obtain reproducible physically meaningful results, based on which error in the probability distribution could be estimated. The required number of data points is an order of magnitude higher compared with the number of Shannon channels in the data. Figure S3 shows that analysis of the same native state scattering data by randomly selecting a single point from each Shannon channel and repeating the process a hundred times35 resulted in a relatively high fraction (more than 20%) of broadly distributed unfolded conformations. This value is significantly higher than physically expected; hence, this analysis approach was not adopted.
The alternative analysis approaches presented in Figures S2 and S3 led to broad distributions. The analysis with all the scattering data point imposed more constraints and hence could be biased toward narrow distributions.
Changing the cost function from log(I(q)) to I(q) was tested and found to be adequate only at the low q-range owing to the high intensity in that part of the scattering curves. Fitting using least squares that are weighted by the measurement error of I versus q plots was also tested and found to be adequate only at the high q-range, owing to the low error values in that part of the curves.
2.7. VADAR
Structural information about the atomic models was gained using volume, area, dihedral angle reporter (VADAR), a web server for quantitative protein structure evaluation from their coordinates.36,37 Accessible surface area (ASA) was calculated using Shrake & Rupley algorithm.38
2.8. Graphics
Protein structures cartoons were generated using PyMol.39
3. Results and Discussion
Initially, low-resolution Guinier analysis and Kratky plots were used to investigate the compactness and flexibility of the protein (Figure S4). Guinier analysis reveals the radius of gyration of a protein from SAXS measurements. The radius of gyration, Rg, is a strong indicator of the level of structure compactness. Rg is defined as the root-mean square of the distances of all electrons from the center of mass. Rg can be obtained from SAXS measurements, using the Guinier approximation, which states that for q·Rg ≤ 1.3, the scattering curve of a spherical particle (a folded protein in our case) can be approximated by a Gaussian curve. A plot of ln[I(q)] versus q2 reveals the value of Rg from the slope
| 1 |
In the case of unfolded proteins, the q-range
at which the Guinier approximation is valid is more limited than the
range of folded proteins. The reason is that the extension of the
protein’s conformation makes the higher order terms in the
expansion, from which the Guinier approximation is derived, significant.
On the basis of observations of Borgia et al., we chose to restrict
the q-range to  , which
was found to be consistent with
results from other computational and experimental techniques.40Figure S5 shows that
if
  , is used, when no cosolutes
are added,
the fitted gyration radius was 1.41 ± 0.10 nm.
Because the value of qmax is determined by the Rg itself, the process of determining the Rg from the Guinier plot was done iteratively until a constant value was achieved. The minimum q-value for Guinier plots was determined according to the quality of data at the very low-q region.
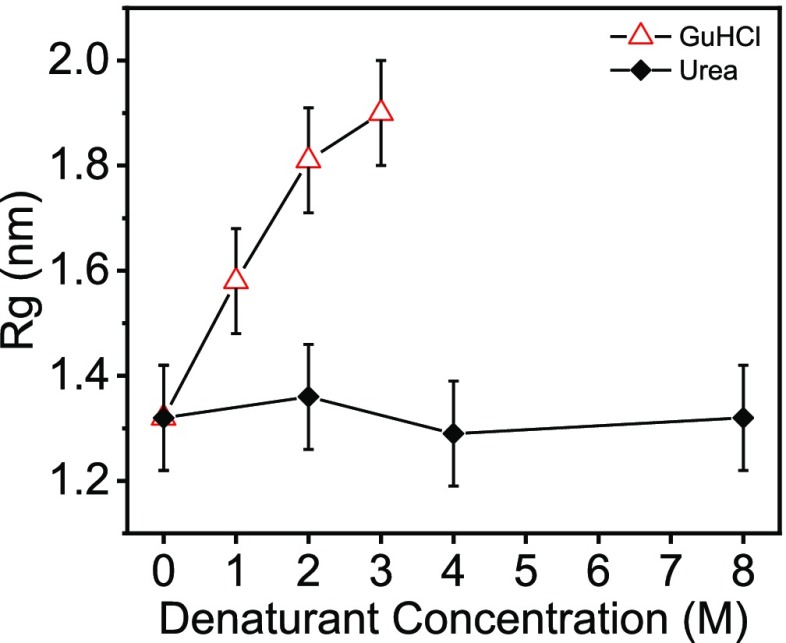
Figure 1 shows the effect of added denaturants on Rg. The Rg of lysozyme increased with the concentration of GuHCl, indicating a gradual swelling of the protein. In contrast, with urea, there was nearly no change in the Rg values, even in 8 M urea solution. The Guinier plots are presented in Figures S4–S6.
Figure 1.
Radius of gyration, Rg, of lysozyme as a function of denaturant concentration. Rg values were obtained from Guinier analysis (Figures S4 and S6).
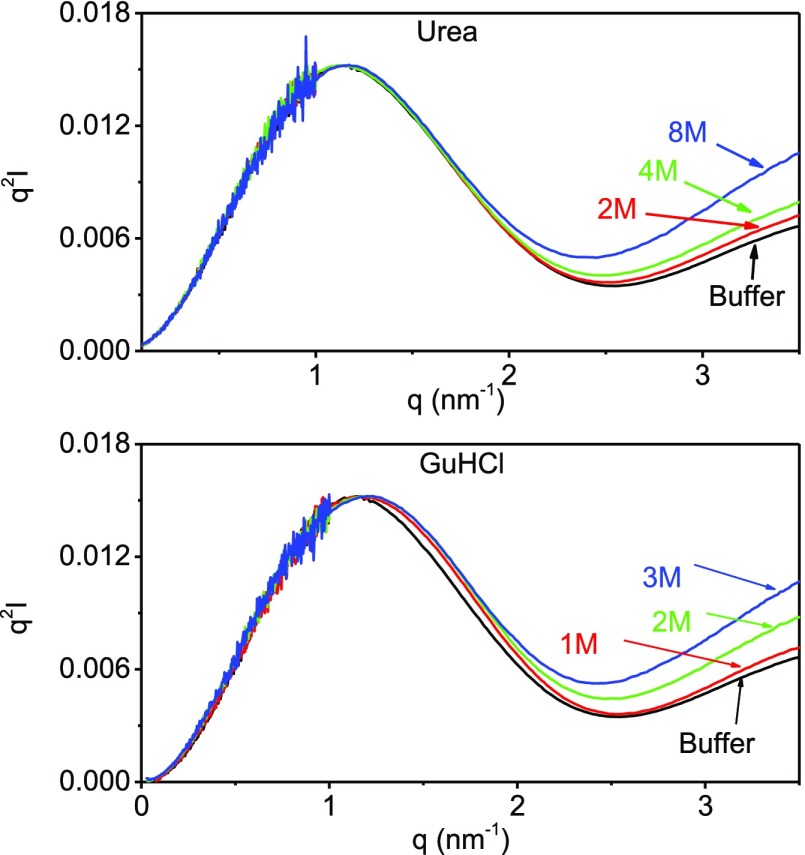
We then used Kratky plot, which is a plot of I(q)·q2 versus q, to gain insights into the globularity and flexibility of the measured protein.27 The plot of a well-folded globular protein is expected to show a Gaussian-like shape with a well-defined maximum at small q and a horizontal asymptotic behavior at high q. In the case of a protein with random coil structure, the plot is far from the Gaussian-like shape, exhibiting a plateau over a specific range of q, which is followed by a monotonic increase. The folded states of most proteins lie between these two extremes, exhibiting some deviations from Gaussian characteristics, depending on the flexibility of the protein. In addition, the position of the “bell-shape” peak is generally indicative of intermolecular interactions. A shift in the peak position toward the low q-range might suggest enhancement of the intramolecular interactions.
Figure 2 depicts the normalized Kratky plots of lysozyme samples at different urea and GuHCl concentrations. Although Kratky plots of globular proteins decay to zero at high q, all the plots in Figure 2 diverged, signifying that the lysozyme was flexible, even in the buffer solution. This flexibility can be attributed to the dynamics associated with the two domains of the protein that is highly important for the enzymatic function of lysozyme.
Figure 2.
Normalized Krakty plots of lysozyme in different urea and GuHCl concentrations as indicated in the figure. The plots were normalized to have the same peak intensity.
In all the urea solutions, lysozyme retained its Gaussian-like shape at the low q-range and exhibited a well-defined maximum that did not shift significantly with urea concentration. At the high q-range, however, the deviation from the Gaussian-like shape increased with urea concentration. GuHCl had a similar effect at the high q-range, but the maximum of the Gaussian-like shape shifted toward higher q values with increasing GuHCl concentrations.
Overall, the Kratky and Guiner analyses suggested that increasing GuHCl concentration shifted the equilibrium from compact to extended folding confirmations. The analyses suggest that urea did cause conformational changes, but lysozyme retained its compactness.
The influence of both denaturants was studied using bioactivity measurements, microcalorimetry, and Raman spectroscopy.41 The results showed that the bioactivity of lysozyme in 8 M urea solutions decreased by up to 15%. The effect was attributed to changes in the tertiary structure without noticeable effects on the secondary structure, suggesting that in the presence of urea, lysozyme assumes molten globule characteristics. In the presence of GuHCl, however, the loss of bioactivity was 40% and both the tertiary and secondary structures changed, leading to a random coil conformation. A study about the dynamic surface properties of lysozyme solutions in the presence of urea and GuHCl supported these claims.21
In the second stage, a model-based analysis of the solution X-ray scattering measurements was performed. We fitted the calculated scattering curves of the conformational ensemble to the measured curve to get insights into the influence of the denaturants on the folding equilibrium.
Previous studies18,19,23 indicated that there are no equilibrium intermediate states in urea- and GuHCl-induced denaturation of hen egg-white lysozyme, for the ranges of denaturant concentrations and pH values used in our study. At pH of 2.9, however, intermediate states were reported.42 Hence, to perform model-based analysis of the solution X-ray scattering data, we created an ensemble of conformations comprising two sets with rmsd values (computed with respect to the crystal structure) ranging between 0 and 2 Å and between 8 and 17 Å, corresponding to folded and unfolded conformations, respectively (see Materials and Methods).
The scattering curves of the conformations were computed by CRYSOL and then clustered by K-means algorithm.43 The centroid of each curve was computed by WAXSiS, which uses MD simulations to account for the hydration layer. To determine the optimal number of clusters, which gives a good fit to the scattering data, the R2 values of the fitting of the WAXSiS calculated scattering curves to the native buffer solution were compared for different numbers of clusters (Figure S7). The comparison indicates that even at 30 clusters the fitting is adequate. We chose to work with 50 clusters because there was no significant improvement in the R2 value of the fit with a larger number of clusters.
We added to the ensemble another set of conformations with rmsd that ranged between 2 and 10 Å, which corresponds to folding intermediates. The entire conformational ensemble, with rmsd range of 0–17 Å, was clustered again to 50 clusters. Figure S8 presents the fitting of calculated scattering curves of conformational ensemble to the measured 8 M urea and 3 M GuHCl. In both denaturants, models with rmsd between 2 and 12 Å were not selected. These results are consistent with a two-state unfolding mechanism, leading to an equilibrium between folded (rmsd of 0–2 Å) and unfolded (rmsd above 12 Å) states, with a negligible fraction of intermediates. Figure S9 shows that when the ensemble of computed conformations contained only the unfolded states, the quality of the fit in the native state at the high q-range (q > 3 nm–1) was rather poor, compared with that in Figure 3. The quality of the fit improved with increasing the concentration of cosolutes, which promoted denaturation.
Figure 3.
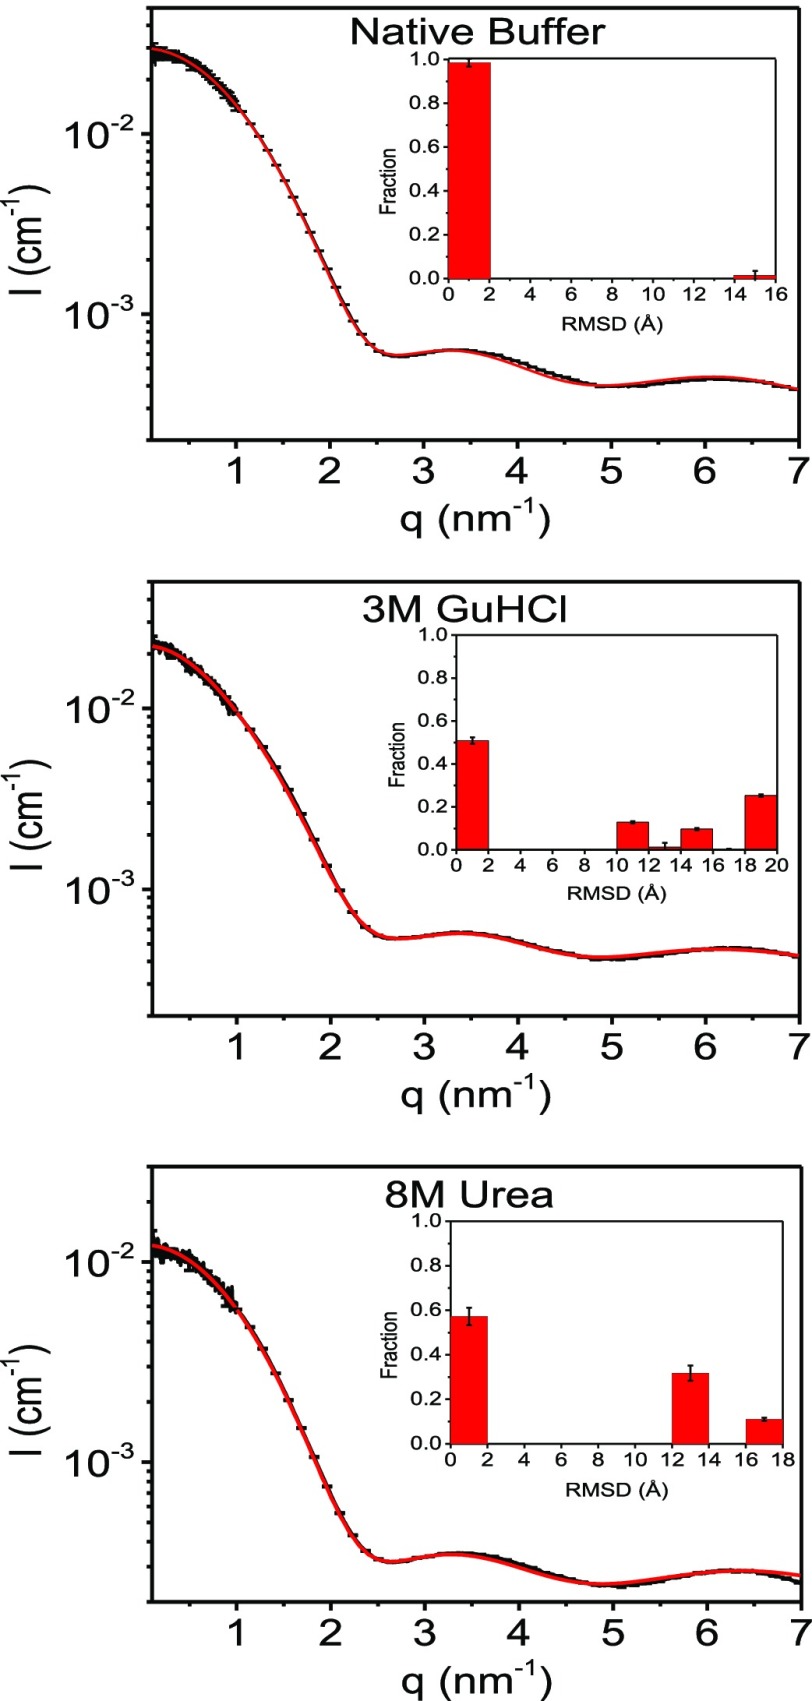
Background subtracted scattering intensity curve of lysozyme in 50 mM sodium acetate buffer (pH = 4.5), and in the same buffer with 3 M GuHCl, or 8 M urea (black curves), as indicated. The red curves are the best-fitted models, based on the computed ensemble of lysozyme conformations (see text). The insets show the fraction of conformations as a function of their rmsd values (with respect to the crystal structure).
The scattering curves of each lysozyme conformation in the ensemble were computed. Similar curves were clustered. The centroid curves computed by WAXSiS were then fitted to the experimental scattering curves of 2.5 mg/mL lysozyme in 50 mM sodium acetate (pH = 4.5). Figure 3 shows the data and the result of the best fit to the data. The fits to the rest of the samples are shown in Figure S10. Ribbon diagram of the selected (centroid) models are presented in Figures S11–S17. In all the samples, the scattering curve of the weighted ensemble adequately fitted the entire q-range. The R2 values for all the samples were 0.994 or higher.
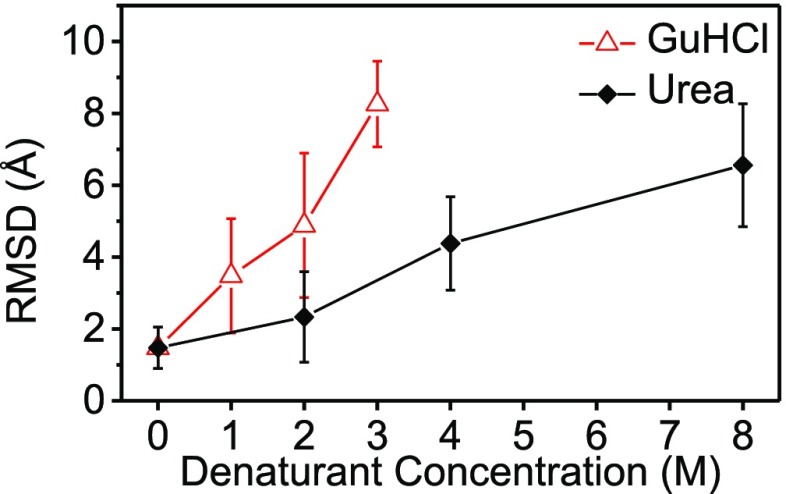
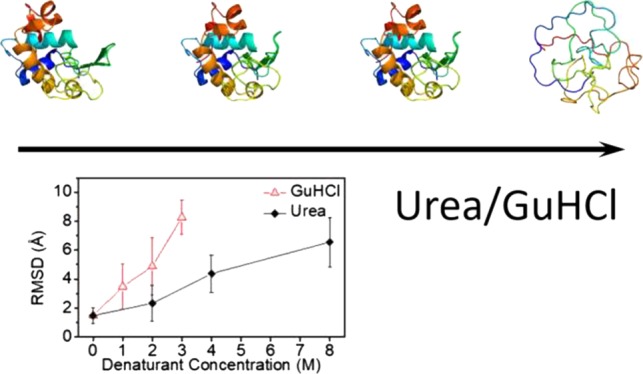
The fraction of folded conformations decreased as the denaturant concentration increased (insets of Figures 3 and S10). This result indicates a gradual shift in the folding equilibrium toward the unfolded state. These findings are supported by the weighted average rmsd values, from the crystal structure of lysozyme, as a function of denaturant concentration (Figure 4). The rmsd gradually grew with the denaturant concentration, with a steeper slope for GuHCl solutions compared with urea solutions, indicating that GuHCl is a stronger denaturant. Figure 1, however, shows that, within the error, the value of Rg did not change with urea concentration, suggesting that the average protein level of compactness remained unchanged but the conformations significantly deviated from the native tertiary structure.
Figure 4.
Weighted average root-mean-square deviation (rmsd), with respect to the crystal structure of lysozyme (PDB ID 1LYZ), of the models that were selected to fit the data in Figures 3 and S10, as a function of denaturant concentration.
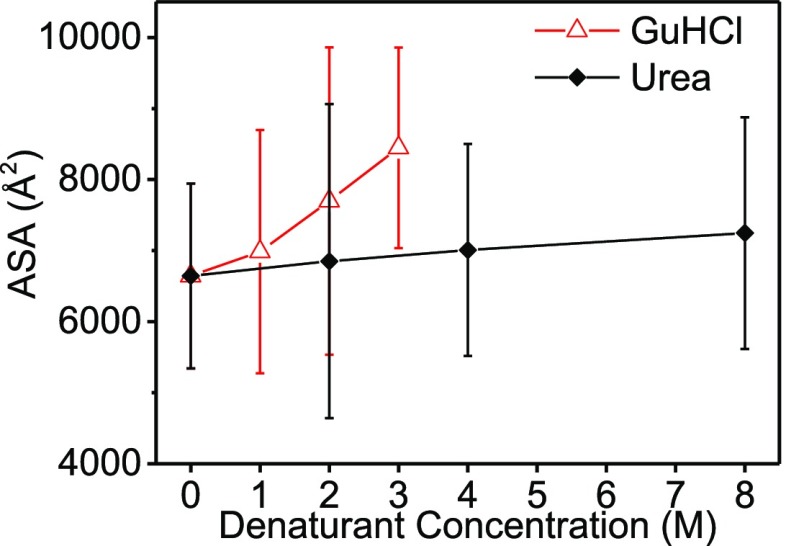
Gradual growth as a function of concentration was also observed in the ASA of lysozyme, as a function of denaturant concentration (Figure 5). Although the change in ASA is within the range of error for both denaturants, the ASA gradient of urea is significantly lower than that of GuHCl. The ASA of a protein can reveal much about its compactness and its conformational changes. The ASA is a geometric measure of the exposure of the protein to the surrounding environment; hence, the interfacial free energy depends on its value.44 Few studies have regarded the relation between the two as strictly linear.45,46 Urea caused relatively minor changes to the solvent accessible area of lysozyme compared to GuHCl. These results support the claim that lysozyme retained its globular structure in the presence of urea but adopted random coil conformations in the presence of GuHCl.
Figure 5.
Weighted average ASA, of the models that were selected to fit the data in Figures 3 and S10, as function of denaturant concentration.
The thermodynamics of denaturant-induced conformational changes is often described by the Wyman linkage (or Gibbs adsorption isotherm).47−50 Consider a system comprised of an extended interface, in our case, an unfolded protein, surrounded by solvent containing a denaturant. Because there is a favorable interaction between the denaturant and the interface (in other words, the denaturant is preferentially included), the interfacial free energy is lowered compared with the interfacial free energy in the pure solvent.51 Thus, the interface is stabilized. Our result suggest the gradual growth of ASA with concentration and the gradual decrease, although minor in urea samples, in the weighted average of the number of residues that are 95% buried, with concentration (Figure S18). These data indicate that urea and GuHCl preferentially interact with lysozyme and stabilize the unfolded state by virtue of their preferential inclusion. MD simulations by England et al. support this claim by showing the impact of denaturants on dewetting of hydrophobic plates immersed in water and urea or GuHCl solutions.25 Both denaturants stabilized the liquid phase against dewetting, and thereby weakened the attraction between hydrophobic surfaces. Taken together, urea and GuHCl stabilized the unfolded state by favoring expanded polypeptide conformations.
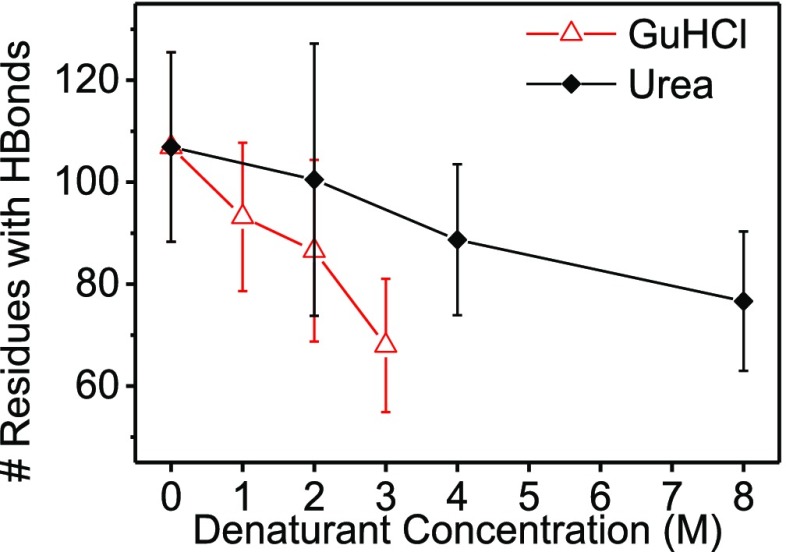
Finally, the weighted average number of residues forming hydrogen bonds within the protein (main-chain and side-chain) decreased with denaturant concentration (Figure 6). GuHCl had a stronger effect compared with urea. These phenomena can be attributed to the loss of the secondary structure owing to denaturation, with urea causing minor changes in the secondary structure compared with GuHCl.
Figure 6.
Weighted average number of residues with hydrogen bonds within lysozyme (main-chain and side-chain) of the models that were selected to fit the data in Figures 3 and S10, as a function of denaturant concentrations.
4. Conclusions
In this study, we used solution X-ray scattering to investigate the folding equilibrium of egg-white lysozyme in the presence of the denaturating cosolutes urea and GuHCl. Our analysis provided insights into the dominating folding states at equilibrium in solution. The change upon denaturation was quantitatively estimated by several parameters like the weighted average of ASA and the rmsd from the crystal structure of the lysozyme.
Our results supported the hypothesis that urea caused lysozyme to gradually assume a structure with molten globule characteristics, while GuHCl caused lysozyme to assume a random coil structure. Equilibrium intermediate states were hardly detected.
In the case of urea, the errors of the weighted average of the structural parameters according to the fit were larger than the change in their values. However, the change as a function of urea concentration was still noticeable. Our data were fairly sensitive to major changes in the secondary structure. Higher q-range, better signal-to-noise ratio, and advanced molecular simulations of protein-denaturant interactions might make the presented analysis applicable to a broader set of structures.
Acknowledgments
We thank Daniel Harries for helpful discussions. SWING beamline at Soleil Synchrotron (J. Perez and his team) and P12 beamline in DESY Synchrotron at Hamburg (D. Svergun and his team) are acknowledged as the data presented in the paper were acquired there. This project was supported by the Israel Ministry of Economy, Israel Science Foundation (656/16), the US-Israel Binational Science Foundation (2016311), and by the Israel Ministry of Science. We thank the Safra, Wolfson, and Rudin Foundations for supporting our laboratory.
Glossary
Abbreviations
- ASA
accessible surface area
- ENCoM
elastic network contact model
- GuHCl
guanidine hydrochloride
- rmsd
root-mean-square-deviation of atomic positions
- SAXS
small-angle X-ray scattering
- WAXSiS
wide angle X-ray scattering in solvent
Supporting Information Available
The Supporting Information is available free of charge on the ACS Publications website at DOI: 10.1021/acsomega.8b01289.
Additional figures and a table are provided in the Supporting Information (PDF)
Author Contributions
The manuscript was written through contributions of all authors. All authors have given approval to the final version of the manuscript.
The authors declare no competing financial interest.
Supplementary Material
References
- Dill K. A.; MacCallum J. L. The protein-folding problem, 50 years on. Science 2012, 338, 1042–1046. 10.1126/science.1219021. [DOI] [PubMed] [Google Scholar]
- Dill K. A.; Shortle D. Denatured states of proteins. Annu. Rev. Biochem. 1991, 60, 795–825. 10.1146/annurev.bi.60.070191.004051. [DOI] [PubMed] [Google Scholar]
- England J. L.; Haran G. Role of solvation effects in protein denaturation: from thermodynamics to single molecules and back. Annu. Rev. Phys. Chem. 2011, 62, 257–277. 10.1146/annurev-physchem-032210-103531. [DOI] [PMC free article] [PubMed] [Google Scholar]
- Dill K. A.; Ozkan S. B.; Shell M. S.; Weikl T. R. The protein folding problem. Annu. Rev. Biophys. 2008, 37, 289–316. 10.1146/annurev.biophys.37.092707.153558. [DOI] [PMC free article] [PubMed] [Google Scholar]
- Yang J. S.; Chen W. W.; Skolnick J.; Shakhnovich E. I. All-atom ab initio folding of a diverse set of proteins. Structure 2007, 15, 53–63. 10.1016/j.str.2006.11.010. [DOI] [PubMed] [Google Scholar]
- Yong C. W.; Glab J.; Strange R. W.; Smith W.; Hasnain S. S.; Grossmann J. G. Assessment of long-term molecular dynamics calculations with experimental information on protein shape from X-ray scattering – SOD1 as a case study. Chem. Phys. Lett. 2009, 481, 112–117. 10.1016/j.cplett.2009.09.042. [DOI] [Google Scholar]
- De Biasio A.; de Opakua A. I.; Cordeiro T. N.; Villate M.; Merino N.; Sibille N.; Lelli M.; Diercks T.; Bernadó P.; Blanco F. J. p15PAF is an intrinsically disordered protein with nonrandom structural preferences at sites of interaction with other proteins. Biophys. J. 2014, 106, 865–874. 10.1016/j.bpj.2013.12.046. [DOI] [PMC free article] [PubMed] [Google Scholar]
- Wells M.; Tidow H.; Rutherford T. J.; Markwick P.; Jensen M. R.; Mylonas E.; Svergun D. I.; Blackledge M.; Fersht A. R. Structure of tumor suppressor p53 and its intrinsically disordered N-terminal transactivation domain. Proc. Natl. Acad. Sci. U.S.A. 2008, 105, 5762–5767. 10.1073/pnas.0801353105. [DOI] [PMC free article] [PubMed] [Google Scholar]
- Bernado P.; Blanchard L.; Timmins P.; Marion D.; Ruigrok R. W. H.; Blackledge M. A structural model for unfolded proteins from residual dipolar couplings and small-angle x-ray scattering. Proc. Natl. Acad. Sci. U.S.A. 2005, 102, 17002–17007. 10.1073/pnas.0506202102. [DOI] [PMC free article] [PubMed] [Google Scholar]
- Rambo R. P.; Tainer J. A. Characterizing flexible and intrinsically unstructured biological macromolecules by SAS using the Porod-Debye law. Biopolymers 2011, 95, 559–571. 10.1002/bip.21638. [DOI] [PMC free article] [PubMed] [Google Scholar]
- Pelikan M.; Hura G.; Hammel M. Structure and flexibility within proteins as identified through small angle X-ray scattering. Gen. Physiol. Biophys. 2009, 28, 174–189. 10.4149/gpb_2009_02_174. [DOI] [PMC free article] [PubMed] [Google Scholar]
- Bernadó P.; Mylonas E.; Petoukhov M. V.; Blackledge M.; Svergun D. I. Structural Characterization of Flexible Proteins Using Small-Angle X-ray Scattering. J. Am. Chem. Soc. 2007, 129, 5656–5664. 10.1021/ja069124n. [DOI] [PubMed] [Google Scholar]
- Różycki B.; Kim Y. C.; Hummer G. SAXS ensemble refinement of ESCRT-III CHMP3 conformational transitions. Structure 2011, 19, 109–116. 10.1016/j.str.2010.10.006. [DOI] [PMC free article] [PubMed] [Google Scholar]
- Bernadó P.; Svergun D. I. Structural analysis of intrinsically disordered proteins by small-angle X-ray scattering. Mol. BioSyst. 2012, 8, 151–167. 10.1039/c1mb05275f. [DOI] [PubMed] [Google Scholar]
- Yang S.; Blachowicz L.; Makowski L.; Roux B. Multidomain assembled states of Hck tyrosine kinase in solution. Proc. Natl. Acad. Sci. U.S.A. 2010, 107, 15757–15762. 10.1073/pnas.1004569107. [DOI] [PMC free article] [PubMed] [Google Scholar]
- Yoshimura K.; Toibana A.; Nakahama K. Human lysozyme: sequencing of a cDNA, and expression and secretion by Saccharomyces cerevisiae. Biochem. Biophys. Res. Commun. 1988, 150, 794–801. 10.1016/0006-291x(88)90461-5. [DOI] [PubMed] [Google Scholar]
- Diamond R. Real-space refinement of the structure of hen egg-white lysozyme. J. Mol. Biol. 1974, 82, 371–391. 10.1016/0022-2836(74)90598-1. [DOI] [PubMed] [Google Scholar]
- Ibarra-Molero B.; Sanchez-Ruiz J. M. Are there equilibrium intermediate states in the urea-induced unfolding of hen egg-white lysozyme?. Biochemistry 1997, 36, 9616–9624. 10.1021/bi9703305. [DOI] [PubMed] [Google Scholar]
- Makhatadze G. I.; Privalov P. L. Protein interactions with urea and guanidinium chloride. A calorimetric study. J. Mol. Biol. 1992, 226, 491–505. 10.1016/0022-2836(92)90963-k. [DOI] [PubMed] [Google Scholar]
- Griko Y. V.; Freire E.; Privalov G.; Van Dael H.; Privalov P. L. The unfolding thermodynamics of c-type lysozymes: a calorimetric study of the heat denaturation of equine lysozyme. J. Mol. Biol. 1995, 252, 447–459. 10.1006/jmbi.1995.0510. [DOI] [PubMed] [Google Scholar]
- Tihonov M. M.; Milyaeva O. Y.; Noskov B. A. Dynamic surface properties of lysozyme solutions. Impact of urea and guanidine hydrochloride. Colloids Surf., B 2015, 129, 114–120. 10.1016/j.colsurfb.2015.03.034. [DOI] [PubMed] [Google Scholar]
- Emadi S.; Behzadi M. A comparative study on the aggregating effects of guanidine thiocyanate, guanidine hydrochloride and urea on lysozyme aggregation. Biochem. Biophys. Res. Commun. 2014, 450, 1339–1344. 10.1016/j.bbrc.2014.06.133. [DOI] [PubMed] [Google Scholar]
- Ibarra-Molero B.; Sanchez-Ruiz J. M. A model-independent, nonlinear extrapolation procedure for the characterization of protein folding energetics from solvent-denaturation data. Biochemistry 1996, 35, 14689–14702. 10.1021/bi961836a. [DOI] [PubMed] [Google Scholar]
- Khechinashvili N. N.; Privalov P. L.; Tiktopulo E. I. Calorimetric investigation of lysozyme thermal denaturation. FEBS Lett. 1973, 30, 57–60. 10.1016/0014-5793(73)80618-0. [DOI] [PubMed] [Google Scholar]
- England J. L.; Pande V. S.; Haran G. Chemical denaturants inhibit the onset of dewetting. J. Am. Chem. Soc. 2008, 130, 11854–11855. 10.1021/ja803972g. [DOI] [PMC free article] [PubMed] [Google Scholar]
- Timasheff S. N. Control of protein stability and reactions by weakly interacting cosolvents: the simplicity of the complicated. Adv. Protein Chem. 1998, 51, 355–432. 10.1016/s0065-3233(08)60656-7. [DOI] [PubMed] [Google Scholar]
- Blanchet C. E.; Spilotros A.; Schwemmer F.; Graewert M. A.; Kikhney A.; Jeffries C. M.; Franke D.; Mark D.; Zengerle R.; Cipriani F.; Fiedler S.; Roessle M.; Svergun D. I. Versatile sample environments and automation for biological solution X-ray scattering experiments at the P12 beamline (PETRA III, DESY). J. Appl. Crystallogr. 2015, 48, 431–443. 10.1107/s160057671500254x. [DOI] [PMC free article] [PubMed] [Google Scholar]
- David G.; Pérez J. Combined sampler robot and high-performance liquid chromatography: a fully automated system for biological small-angle X-ray scattering experiments at the Synchrotron SOLEIL SWING beamline. J. Appl. Crystallogr. 2009, 42, 892–900. 10.1107/s0021889809029288. [DOI] [Google Scholar]
- Hammersley A. P.; Svensson S. O.; Hanfland M.; Fitch A. N.; Hausermann D. Two-dimensional detector software: From real detector to idealised image or two-theta scan. High Pressure Res. 1996, 14, 235–248. 10.1080/08957959608201408. [DOI] [Google Scholar]
- Frappier V.; Chartier M.; Najmanovich R. J. ENCoM server: exploring protein conformational space and the effect of mutations on protein function and stability. Nucleic Acids Res. 2015, 43, W395–W400. 10.1093/nar/gkv343. [DOI] [PMC free article] [PubMed] [Google Scholar]
- Svergun D.; Barberato C.; Koch M. H. J. CRYSOL–a program to evaluate X-ray solution scattering of biological macromolecules from atomic coordinates. J. Appl. Crystallogr. 1995, 28, 768–773. 10.1107/s0021889895007047. [DOI] [Google Scholar]
- Chen P.-c.; Hub J. S. Validating solution ensembles from molecular dynamics simulation by wide-angle X-ray scattering data. Biophys. J. 2014, 107, 435–447. 10.1016/j.bpj.2014.06.006. [DOI] [PMC free article] [PubMed] [Google Scholar]
- Knight C. J.; Hub J. S. WAXSiS: a web server for the calculation of SAXS/WAXS curves based on explicit-solvent molecular dynamics. Nucleic Acids Res. 2015, 43, W225–W230. 10.1093/nar/gkv309. [DOI] [PMC free article] [PubMed] [Google Scholar]
- Byrd R. H.; Gilbert J. C.; Nocedal J. A trust region method based on interior point techniques for nonlinear programming. Math. Program. 2000, 89, 149–185. 10.1007/pl00011391. [DOI] [Google Scholar]
- Rambo R. P.; Tainer J. A. Accurate assessment of mass, models and resolution by small-angle scattering. Nature 2013, 496, 477–481. 10.1038/nature12070. [DOI] [PMC free article] [PubMed] [Google Scholar]
- Willard L.; Ranjan A.; Zhang H.; Monzavi H.; Boyko R. F.; Sykes B. D.; Wishart D. S. VADAR: a web server for quantitative evaluation of protein structure quality. Nucleic Acids Res. 2003, 31, 3316–3319. 10.1093/nar/gkg565. [DOI] [PMC free article] [PubMed] [Google Scholar]
- Szekely O.; Steiner A.; Szekely P.; Amit E.; Asor R.; Tamburu C.; Raviv U. The structure of ions and zwitterionic lipids regulates the charge of dipolar membranes. Langmuir 2011, 27, 7419–7438. 10.1021/la200264s. [DOI] [PubMed] [Google Scholar]
- Shrake A.; Rupley J. A. Environment and exposure to solvent of protein atoms. Lysozyme and insulin. J. Mol. Biol. 1973, 79, 351–371. 10.1016/0022-2836(73)90011-9. [DOI] [PubMed] [Google Scholar]
- DeLano W. L.The PyMOL molecular graphics system. http://pymol.org (accessed October 10, 2018).
- Borgia A.; Zheng W.; Buholzer K.; Borgia M. B.; Schüler A.; Hofmann H.; Soranno A.; Nettels D.; Gast K.; Grishaev A.; Best R. B.; Schuler B. Consistent view of polypeptide chain expansion in chemical denaturants from multiple experimental methods. J. Am. Chem. Soc. 2016, 138, 11714–11726. 10.1021/jacs.6b05917. [DOI] [PMC free article] [PubMed] [Google Scholar]
- Hédoux A.; Krenzlin S.; Paccou L.; Guinet Y.; Flament M.-P.; Siepmann J. Influence of urea and guanidine hydrochloride on lysozyme stability and thermal denaturation; a correlation between activity, protein dynamics and conformational changes. Phys. Chem. Chem. Phys. 2010, 12, 13189–13196. 10.1039/c0cp00602e. [DOI] [PubMed] [Google Scholar]
- Chen L.; Hodgson K. O.; Doniach S. A lysozyme folding intermediate revealed by solution X-ray scattering. J. Mol. Biol. 1996, 261, 658–671. 10.1006/jmbi.1996.0491. [DOI] [PubMed] [Google Scholar]
- Lloyd S. Least squares quantization in PCM. IEEE Trans. Inf. Theory 1982, 28, 129–137. 10.1109/tit.1982.1056489. [DOI] [Google Scholar]
- Durham E.; Dorr B.; Woetzel N.; Staritzbichler R.; Meiler J. Solvent accessible surface area approximations for rapid and accurate protein structure prediction. J. Mol. Model. 2009, 15, 1093–1108. 10.1007/s00894-009-0454-9. [DOI] [PMC free article] [PubMed] [Google Scholar]
- Ooi T.; Oobatake M.; Nemethy G.; Scheraga H. A. Accessible surface areas as a measure of the thermodynamic parameters of hydration of peptides. Proc. Natl. Acad. Sci. U.S.A. 1987, 84, 3086–3090. 10.1073/pnas.84.10.3086. [DOI] [PMC free article] [PubMed] [Google Scholar]
- Gordon D. B.; Marshall S. A.; Mayot S. L. Energy functions for protein design. Curr. Opin. Struct. Biol. 1999, 9, 509–513. 10.1016/s0959-440x(99)80072-4. [DOI] [PubMed] [Google Scholar]
- Harries D.; Rösgen J. A practical guide on how osmolytes modulate macromolecular properties. Methods Cell Biol. 2008, 84, 679–735. 10.1016/s0091-679x(07)84022-2. [DOI] [PubMed] [Google Scholar]
- Wyman J.; Gill S. J.. Binding and Linkage: Functional Chemistry of Biological Macromolecules; University Science Books, 1990. [Google Scholar]
- Timasheff S. N. Protein-solvent preferential interactions, protein hydration, and the modulation of biochemical reactions by solvent components. Proc. Natl. Acad. Sci. U.S.A. 2002, 99, 9721–9726. 10.1073/pnas.122225399. [DOI] [PMC free article] [PubMed] [Google Scholar]
- Sapir L.; Harries D. Macromolecular compaction by mixed solutions: Bridging versus depletion attraction. Curr. Opin. Colloid Interface Sci. 2016, 22, 80–87. 10.1016/j.cocis.2016.02.010. [DOI] [Google Scholar]
- Sukenik S.; Sapir L.; Harries D. Balance of enthalpy and entropy in depletion forces. Curr. Opin. Colloid Interface Sci. 2013, 18, 495–501. 10.1016/j.cocis.2013.10.002. [DOI] [Google Scholar]
Associated Data
This section collects any data citations, data availability statements, or supplementary materials included in this article.


