Abstract
Vertically formed and well-defined SnO2 nanosheets are easy to fabricate, involving only a single process that is performed under moderate conditions. In this study, two different sizes of a SnO2 nanosheet were concurrently formed on a Pt interdigitated electrode chip, with interconnections between the two. As the SnO2 nanosheets were grown over time, the interconnections became stronger. The ability of the fabricated SnO2 nanosheets to sense H2 gas was evaluated in terms of the variation in their resistance. The resistance of a SnO2 nanosheet decreased with the introduction of H2 gas and returned to its initial level after the H2 gas was replaced with air. Also, the response–recovery behaviors were improved as a result of the growth of the SnO2 nanosheets owing to the presence of many reaction sites and strong interconnections, which may provide multipassages for the electron transfer channel, leading to the acceleration of the reaction between the H2 gas and SnO2 nanosheets.
1. Introduction
Because of the characteristic properties of nanomaterials, they are widely used in advanced industrial science and technology. These properties are not found in the bulk state and instead depend on the materials’ morphologies and nanostructures. Therefore, attention has been focused on methods of controlling the size and morphology of nanomaterials. Among these methods, those using an aqueous solution to synthesize nanomaterials, enabling the precise control of their size and morphology, have been the subject of much discussion,1−6 since these processes offer many advantages such as low energy consumption, room-temperature synthesis, and low production and equipment costs.7 Using these processes, nanomaterials with a range of nanostructures and morphologies can be fabricated.
Recently, a process was developed for synthesizing SnO2 with a nanosheet structure under moderate conditions without any additives.8 Although several reports addressing the synthesis of SnO2 nanosheets have been published, the presented processes all required a high synthesis temperature (over 100 °C), the use of additives, or a heat-treatment process.9−12 Also, the SnO2 nanosheets were generally obtained in a powder form with an overlapping or flowertype morphology. On the other hand, SnO2 nanosheets produced by a single process can be directly synthesized on targets and exhibit a well-dispersed structure. Thus, SnO2 nanosheets with a high surface-to-volume ratio can be obtained easily. Such novel SnO2 nanosheets are expected to exhibit a higher level of performance in many fields.
Especially, in the area of sensors, nanosheets have attracted attention in that they offer a candidate ideal structure,7 because such well-defined nanosheets have a high surface-to-volume ratio as well as specific exposed crystal facets. The tuning of these properties can improve the gas-sensing properties of sensors.
In a previous study,13 a SnO2 nanosheet synthesized using a single process was adopted for a gas sensor based on SnO2 nanoparticles and noble metals for detecting 1-nonanal gas, which is a constituent of the breath of lung-cancer patients. The sensor incorporating the SnO2 nanosheet proved to be much more sensitive than that without the SnO2 nanosheet.
In this study, to further examine the application of SnO2 nanosheets to gas sensors, we prepared a gas sensor consisting only of a SnO2 nanosheet. The target gas was H2, which was selected given its importance to fuel cells, which are currently the center of considerable research as part of efforts to satisfy the global demand for energy.14 That is, the relationship between the size of a SnO2 nanosheet and the sensor sensitivity was investigated for H2 gas.
2. Results and Discussion
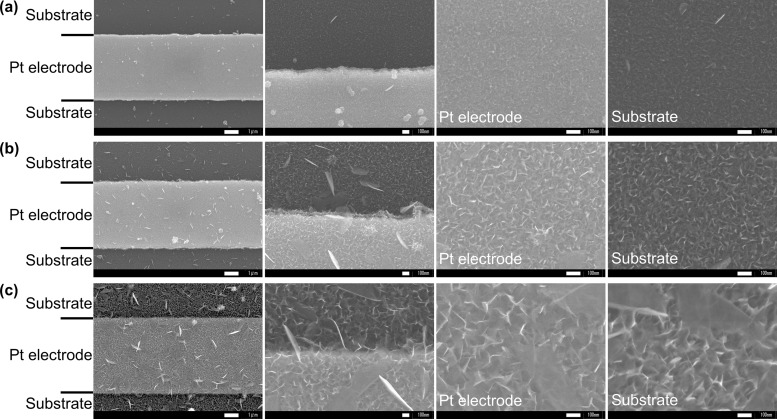
Figure 1 shows field emission scanning electron microscopy (FE-SEM) images of the synthesized SnO2 nanosheets on the Pt interdigitated electrodes. Regardless of the condition, the ultrathin SnO2 nanosheets formed vertically on the Pt interdigitated electrode chip. These were not agglomerated and not arranged in parallel, i.e., the SnO2 nanosheets were well dispersed on the Pt interdigitated electrode and interconnected with one another in such a manner that the edge of one nanosheet touched the surface of another. The SnO2 nanosheets were of two different plane sizes; one was small and tightly formed, while the other was larger but sparsely formed. The plane size of both SnO2 nanosheets increased with the synthesis time. For S-0.5, tightly formed (ca. 20 nm) SnO2 nanosheets and sparsely formed (ca. 100 nm) nanosheets were observed (Figure 1a). For S-2, the plane sizes of the two SnO2 nanosheets increased to ca. 70 and ca. 500 nm (Figure 1b). Moreover, the interconnections between the small SnO2 nanosheets could be clearly observed. For S-6, tightly formed (ca. 100 nm) SnO2 nanosheets and sparsely formed (ca. 1 μm) SnO2 nanosheets were observed (Figure 1c). Also, strong interconnections between the SnO2 nanosheets were observed. These interconnections may act as multipassages for the electron transfer channel,9 which can accelerate the reaction of the SnO2 nanosheets with the gas species.
Figure 1.
FE-SEM images of the (a) S-0.5, (b) S-2, and (c) S-6 SnO2 nanosheet gas sensors.
For S-6, the cross section was investigated after cutting with a roll glass cutter. The results are shown in Figure 2. The SnO2 nanosheets crystallize directly on the Pt electrode without any clearances. These results were identical to those reported previously.7 The SnO2 nanosheets were formed in a single layer, meaning that the thickness of the SnO2 film was equal to the plane size of the SnO2 nanosheets. Even though the SnO2 nanosheets formed without any clearances, from a gas molecular point of view, the structure is porous enough to enable diffusion. That is, gas species can diffuse deep into the material. This porous structure provides many reaction sites and, as such, enhances the response to H2 gas of the sensors.15
Figure 2.
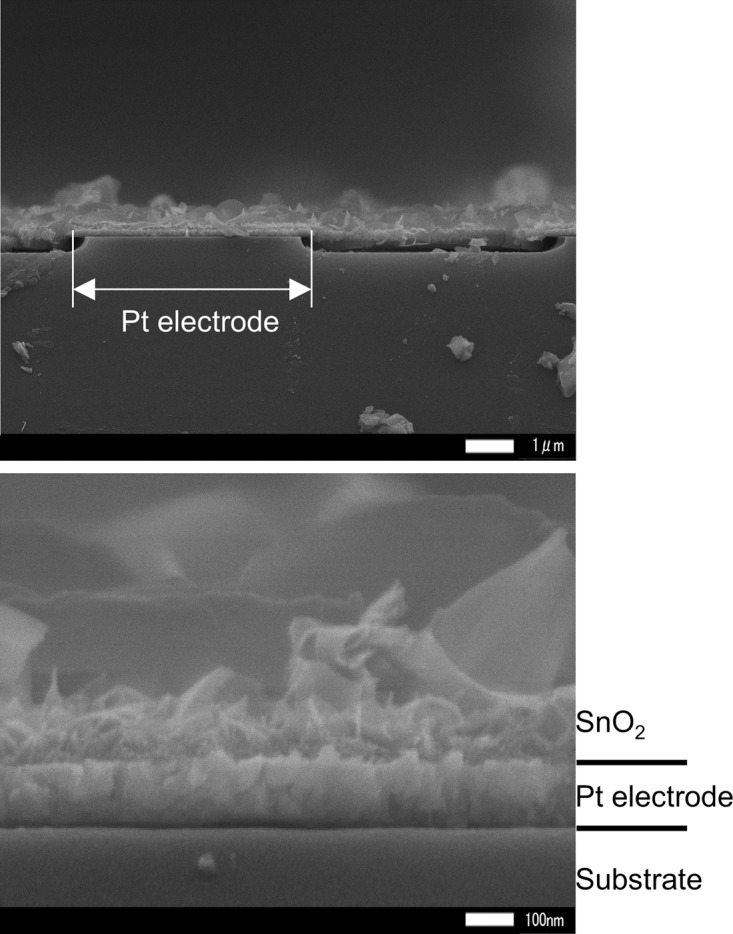
Cross-sectional FE-SEM images of the S-6 SnO2 nanosheet gas sensor.
Figure 3 shows the X-ray diffraction (XRD) patterns of the S-0.5, S-2, and S-6. For all samples, the pecks of the XRD patterns were indexed to a tetragonal cassiterite structure of SnO2 (JCPDS No. 41-1445). The crystallite sizes of the SnO2 nanosheet were calculated using the angular positions of the (110), (101), and (211) peaks at 2θ = 26.8, 33.8, and 51.7°, respectively. After 6 h, the crystallite sizes perpendicular to the (110), (101), and (211) planes were calculated to be 4.2, 4.0, and 4.9 nm, respectively. The crystallite size perpendicular to the (101) plane was much smaller than that of the others, suggesting slow growth of the crystallite size perpendicular to the (101) plane.16 This result means that the main growth direction of the SnO2 nanosheet was parallel to the (101) plane. Thus, the mainly exposed crystal face of the SnO2 nanosheet is assigned to the (101) plane.
Figure 3.
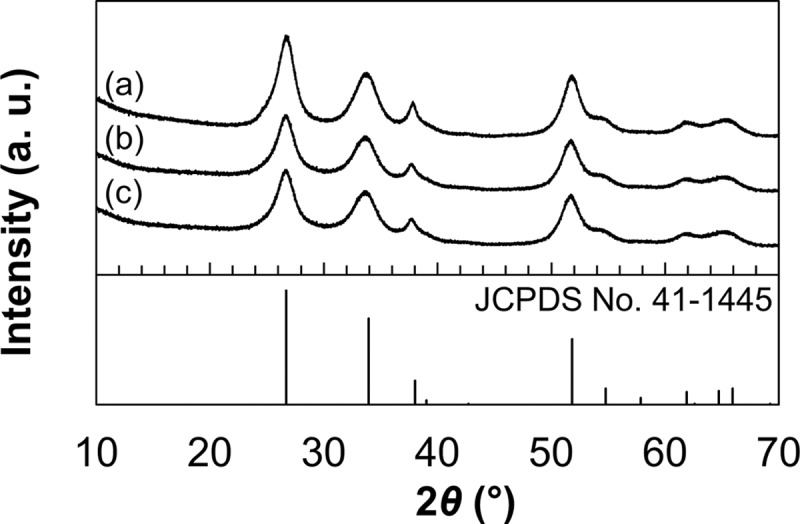
XRD patterns of the (a) S-6, (b) S-2, and (c) S-0.5.
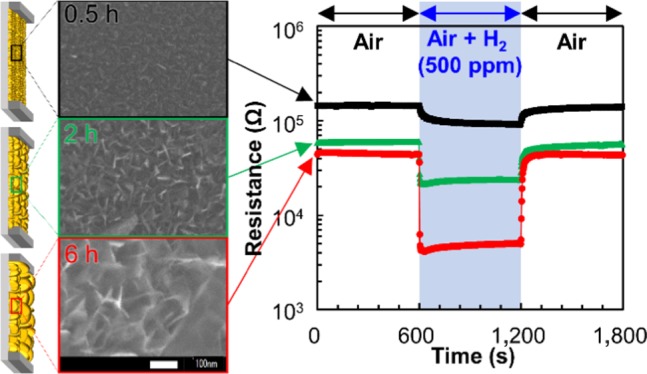
Figure 4 shows the variation in the resistance of SnO2 nanosheet gas sensors for 500 ppm H2 gas. The SnO2 gas sensors exhibited a degree of sensitivity that was typical of an n-type semiconductor gas sensor. When the sensors were exposed to H2 gas, their resistances decreased. When the H2 gas was replaced with air, the resistance returned to its initial level. This variation in the resistance was observed for all of the sensors. This suggests that the SnO2 nanosheets were well formed on the Pt interdigitated electrode chips without any clearance gaps, regardless of the conditions. The response to H2 gas, response time, and recovery time of the sensors are summarized in Table 1. The sensing properties of S-P are also tabulated. The sensing properties of S-0.5, S-2, and S-6 were superior to those of S-P. For S-0.5, S-2, and S-6, the response to H2 gas increased with the synthesis time. The response and recovery times also changed with the synthesis time, which decreased as the synthesis time increased. The SnO2 nanosheet gas sensor synthesized for 18 h exhibited considerably unfavorable sensing properties because of the significantly low resistance under both air and H2 gas. Among the fabricated gas sensors, S-6 exhibited the highest response to H2 gas as well as rapid response and recovery properties.
Figure 4.
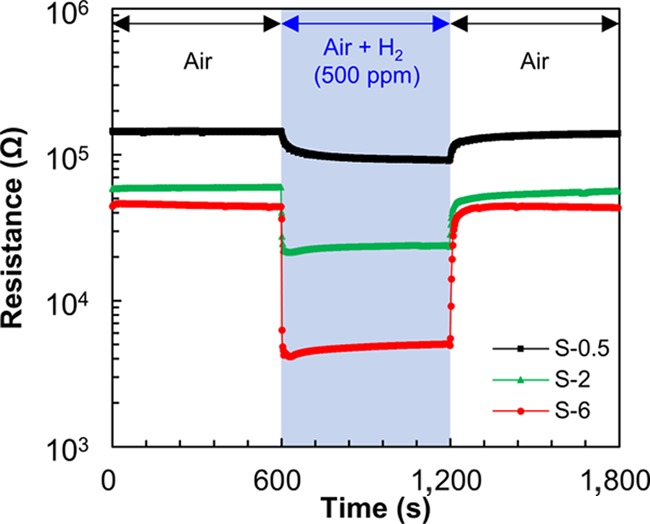
Resistance variation of the SnO2 nanosheet gas sensors for 500 ppm H2 gas.
Table 1. Response Rates, Response Times, and Recovery Times of the S-0.5, S-2, S-6, and S-P Gas Sensors for 500 ppm H2 Gas.
| sample | response rate (Rg/Ra) | response time (s) | recovery time (s) |
|---|---|---|---|
| S-P | 1.3 | 166 | 158 |
| S-0.5 | 1.5 | 76 | 112 |
| S-2 | 2.4 | 8 | 72 |
| S-6 | 9.3 | 4 | 42 |
The reaction scheme of a possible mechanism on the SnO2 surface is presented below14,17
When the SnO2 sensor is exposed to air at the reaction temperature, oxygen is adsorbed onto the SnO2 surface such that electrons are trapped. This corresponds to the initial state of a SnO2 gas sensor. After the H2 gas is introduced, the H2 molecules react with adsorbed oxygen species (Oads–), thus liberating H2O molecules and trapped electrons. The electrons return to the conduction band of the SnO2. As a result, the resistance of the SnO2 decreases. After the H2 gas is replaced with air, the surface is restored by oxygen adsorption, such that the resistance returns to its initial level. As indicated by the reaction mechanism, the variation in the resistance is dependent on the amount of adsorbed oxygen species and the reaction with the H2 molecules, i.e., to realize a large variation in the resistance, the sensor should have many reaction sites and these should be able to adsorb both oxygen and H2 molecules. Among the fabricated sensors, S-6 has the largest SnO2 nanosheets and therefore can absorb much larger amounts of oxygen than either S-2 or S-0.5. Hence, the best sensor response to H2 gas was obtained with S-6. Moreover, the response and recovery properties of the sensors were enhanced by increasing the synthesis time. Since the recovery of SnO2 gas sensors is relatively inferior,18 the enhancement of the response and recovery times is particularly important. In the case of the fabricated sensors, the SnO2 nanosheets were interconnected as can be seen in the FE-SEM images (Figure 1). Also, the interconnections became stronger as the plane size of the SnO2 nanosheets increased. These interconnections may act as multipassages for the electron transfer channel,9 accelerating the reaction with the gas species on the SnO2 nanosheets, leading to an enhancement in the response and recovery properties.
Figure 5 shows the response of S-6 for various H2 gas concentrations. The response varies with the H2 gas concentration, with the response to H2 gas being essentially the same for a particular concentration of H2 gas, demonstrating that the sensor exhibited a reversible response. The responses to H2 gas concentrations of 5000, 500, 50, and 5 ppm were calculated to be ca. 31.8, 12.8, 3.2, and 1.6 as the H2 concentration increased, and 26.2, 9.3, 2.9, and 1.3 as the concentration decreased, respectively. According to a previous report,19 the sensor response to H2 gas should be proportional to a square root of hydrogen concentration. For this sensor, the response exhibited linear increase with increasing square root of the partial pressure of H2 gas, indicating the applicability of the prepared sensor structure for the real field application.
Figure 5.
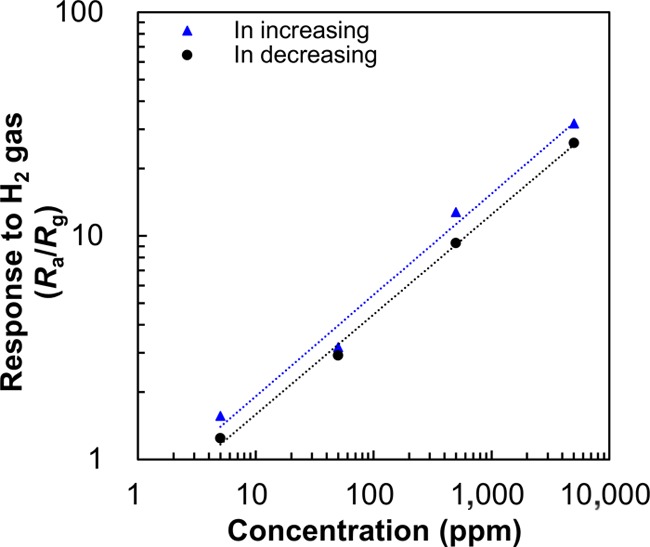
Response of the S-6 SnO2 nanosheet gas sensor at various H2 concentrations.
3. Conclusions
SnO2 nanosheet gas sensors were successfully fabricated using a single process. Two different plane sizes of SnO2 nanosheets were formed concurrently, growing vertically on a Pt interdigitated electrode chip without any clearances. The plane sizes of both SnO2 nanosheets increased with the synthesis time. After being synthesized for 6 h, the SnO2 nanosheets had grown to ca. 100 and ca. 1 μm. The SnO2 nanosheets were well dispersed and interconnected.
The resistance of the SnO2 nanosheets decreased with the introduction of H2 gas but then returned to the initial level after the H2 was replaced with air. The response to H2 gas and response–recovery time changed with the synthesis time. The properties improved as the synthesis time increased. This is thought to be a result of the large SnO2 nanosheets having many reaction sites and strong interconnections, which may act as multipassages for the electron transfer channel. Therefore, the reaction with the H2 gas was accelerated on the SnO2 nanosheets. Furthermore, the resistance of a SnO2 nanosheet gas sensor was found to be dependent on the gas concentration and exhibited a reversible response.
4. Methods
A SnO2 nanosheet was directly synthesized on a Pt interdigitated electrode chip (G-IDEPT5, Drop Sens) using SnF2 (Wako Pure Chemical Industries, Ltd., 90.0% pure). The surface of the Pt interdigitated electrode chip was cleaned by light irradiation using a vacuum ultraviolet light (PL16-10 low-pressure mercury lamp, air flow, 100 V, 200 W, SEN Lights Co.) for 0.3 h to ensure the effective nucleation and growth of the SnO2 nanosheet on the surface.20 Then, the cleaned Pt interdigitated electrode chip was placed in a polypropylene vessel. Next, SnF2 (0.8706 g) was dissolved in distilled water at 90 °C (200 cm3) in a poly(tetrafluoroethylene) bottle, and the resulting solution was added to the vessel. Subsequently, the vessel was held at 90 °C in a drying oven (DKN402, Yamato Scientific Co., Ltd.) for 0.5, 2, and 6 h to fabricate the SnO2 nanosheet sensors. The fabricated sensors were rinsed under running water and then dried using an air blower. The precipitates synthesized via the same process for 0.5, 2, and 6 h were collected for crystal growth analysis. To facilitate appropriate comparisons, SnO2 nanopowder (Sigma-Aldrich, ≤100 nm size) was dissolved in ethanol and the solution was deposited on the cleaned chip. Herein, the SnO2 nanosheet sensors synthesized for 0.5, 2, and 6 h are denoted S-0.5, S-2, and S-6, respectively, and the SnO2 nanopowder sensor is denoted S-P.
The surface morphologies and cross sections of the SnO2 nanosheet sensors were observed using a field emission scanning electron microscope (FE-SEM; JSM-6335FM, JEOL Ltd.). X-ray powder diffraction (XRD; SmartLab, Rigaku) patterns of the precipitates were obtained using Cu Kα radiation (40 kV, 30 mA) in the 2θ ranges of 10–70°. The crystallite size was calculated using the Scherrer equation.21 The gas-sensing performances were assessed using a digital multimeter/switch system (Model 2700, Keithley Instruments Inc.). The fabricated sensors were placed in a quartz chamber, which was set in the center of a furnace, after which the temperature was increased to the operating temperature, that is, 300 °C. To stabilize the sensors, pretreatment was carried out at the operating temperature for 3 h under a flow of compressed air. Each concentration of the H2 target gas was prepared by mixing pure gas (GL Science Inc.) with compressed air. The total gas flow rate into the chamber was maintained at 100 cm3 min–1. The electrical resistance between the electrodes was measured under compressed air and the target gas. The sensor signal sensitivity, 90% response time, and 90% recovery time, which are the times required to reach 90% of the total change in the resistance, were investigated. The sensor signal response to H2 gas (R) relative to the target gas was defined as Ra/Rg, where Ra and Rg are the electrical resistances under air and the target gas, respectively.
Acknowledgments
This work was supported by the Japan Science and Technology Agency (JST) A-STEP program (Grant No. AS282I006e).
The authors declare no competing financial interest.
References
- Hu X.; Masuda Y.; Ohji T.; Kato K. Dissolution–Recrystallization Induced Hierarchical Structure in ZnO: Bunched Roselike and Core–Shell-like Particles. Cryst. Growth Des. 2010, 10, 626–631. 10.1021/cg901030e. [DOI] [Google Scholar]
- Chu D.; Masuda Y.; Ohji T.; Kato K. Formation and Photocatalytic Application of ZnO Nanotubes Using Aqueous Solution. Langmuir 2010, 26, 2811–2815. 10.1021/la902866a. [DOI] [PubMed] [Google Scholar]
- Hu X.; Masuda Y.; Ohji T.; Kato K. Polyethylenimine-Guided Self-Twin Zinc Oxide Nanoarray Assemblies. Cryst. Growth Des. 2009, 9, 3598–3602. 10.1021/cg900331m. [DOI] [Google Scholar]
- Chu D.; Zeng Y.-P.; Jiang D.; Masuda Y. In2O3–SnO2 nano-toasts and nanorods: Precipitation preparation, formation mechanism, and gas sensitive properties. Sens. Actuators, B 2009, 137, 630–636. 10.1016/j.snb.2008.12.063. [DOI] [Google Scholar]
- Xiang J.; Masuda Y.; Koumoto K. Fabrication of Super-Site-Selective TiO2 Micropattern on a Flexible Polymer Substrate Using a Barrier-Effect Self-Assembly Process. Adv. Mater. 2004, 16, 1461–1464. 10.1002/adma.200400017. [DOI] [Google Scholar]
- Shirahata N.; Masuda Y.; Yonezawa T.; Koumoto K. Control over Film Thickness of SnO2 Ultrathin Film Selectively Deposited on a Patterned Self-Assembled Monolayer. Langmuir 2002, 18, 10379–10385. 10.1021/la026158+. [DOI] [Google Scholar]
- Masuda Y.; Kato K. Superhydrophilic SnO2 nanosheet-assembled film. Thin Solid Films 2013, 544, 567–570. 10.1016/j.tsf.2012.12.067. [DOI] [Google Scholar]
- Masuda Y.; Kato K. Aqueous synthesis of nanosheet assembled tin oxide particles and their N2 adsorption characteristics. J. Cryst. Growth 2009, 311, 593–596. 10.1016/j.jcrysgro.2008.09.066. [DOI] [Google Scholar]
- Wang B.; Wang Y.; Lei Y.; Xie S.; Wu N.; Gou Y.; Han C.; Shi Q.; Fang D. Vertical SnO2 nanosheet@SiC nanofibers with hierarchical architecture for high-performance gas sensors. J. Mater. Chem. C 2016, 4, 295–304. 10.1039/C5TC02792F. [DOI] [Google Scholar]
- Liu Y.; Jiao Y.; Zhang Z.; Qu F.; Umar A.; Wu X. Hierarchical SnO2 Nanostructures Made of Intermingled Ultrathin Nanosheets for Environmental Remediation, Smart Gas Sensor, and Supercapacitor Applications. ACS Appl. Mater. Interfaces 2014, 6, 2174–2184. 10.1021/am405301v. [DOI] [PubMed] [Google Scholar]
- Sun P.; Cao Y.; Liu J.; Sun Y.; Ma J.; Lu G. Dispersive SnO2 nanosheets: Hydrothermal synthesis and gas-sensing properties. Sens. Actuators, B 2011, 156, 779–783. 10.1016/j.snb.2011.02.038. [DOI] [Google Scholar]
- Moon C. S.; Kim H.-R.; Auchterlonie G.; Drennan J.; Lee J.-H. Highly sensitive and fast responding CO sensor using SnO2 nanosheets. Sens. Actuators, B 2008, 131, 556–564. 10.1016/j.snb.2007.12.040. [DOI] [Google Scholar]
- Masuda Y.; Itoh T.; Shin W.; Kato K. SnO2 Nanosheet/Nanoparticle Detector for the Sensing of 1-Nonanal Gas Produced by Lung Cancer. Sci. Rep. 2015, 5, 10122 10.1038/srep10122. [DOI] [PMC free article] [PubMed] [Google Scholar]
- Shahabuddin M.; Umar A.; Tomar M.; Gupta V. Custom designed metal anchored SnO2 sensor for H2 detection. Int. J. Hydrogen Energy 2017, 42, 4597–4609. 10.1016/j.ijhydene.2016.12.054. [DOI] [Google Scholar]
- Van Toan N.; Viet Chien N.; Van Duy N.; Si Hong H.; Nguyen H.; Duc Hoa N.; Van Hieu N. Fabrication of highly sensitive and selective H2 gas sensor based on SnO2 thin film sensitized with microsized Pd islands. J. Hazard. Mater. 2016, 301, 433–442. 10.1016/j.jhazmat.2015.09.013. [DOI] [PubMed] [Google Scholar]
- Masuda Y. Crystal growth of tin oxide nano-sheets in aqueous solutions and time variation of N2 adsorption characteristics. Prog. Cryst. Growth Charact. Mater. 2012, 58, 106–120. 10.1016/j.pcrysgrow.2012.02.003. [DOI] [Google Scholar]
- Lee Y. C.; Huang H.; Tan O. K.; Tse M. S. Semiconductor gas sensor based on Pd-doped SnO2 nanorod thin films. Sens. Actuators, B 2008, 132, 239–242. 10.1016/j.snb.2008.01.028. [DOI] [Google Scholar]
- Li L.-L.; Zhang W.-M.; Yuan Q.; Li Z.-X.; Fang C.-J.; Sun L.-D.; Wan L.-J.; Yan C.-H. Room Temperature Ionic Liquids Assisted Green Synthesis of Nanocrystalline Porous SnO2 and Their Gas Sensor Behaviors. Cryst. Growth Des. 2008, 8, 4165–4172. 10.1021/cg800686w. [DOI] [Google Scholar]
- Yamazoe N.; Shimanoe K. New perspectives of gas sensor technology. Sens. Actuators, B 2009, 138, 100–107. 10.1016/j.snb.2009.01.023. [DOI] [Google Scholar]
- Masuda Y.; Ohji T.; Kato K. Site-Selective Chemical Reaction on Flexible Polymer Films for Tin Oxide Nanosheet Patterning. Eur. J. Inorg. Chem. 2011, 2011, 2819–2825. 10.1002/ejic.201100073. [DOI] [Google Scholar]
- Choi P. G.; Ohno T.; Masui T.; Imanaka N. Catalytic liquid-phase oxidation of acetaldehyde to acetic acid over a Pt/CeO2–ZrO2–SnO2/γ-alumina catalyst. J. Environ. Sci. 2015, 36, 63–66. 10.1016/j.jes.2015.04.017. [DOI] [PubMed] [Google Scholar]


