

Abstract
Elevated blood pressure (BP), a leading cause of global morbidity and mortality, is influenced by both genetic and lifestyle factors. Cigarette smoking is one such lifestyle factor. Across five ancestries, we performed a genome-wide gene–smoking interaction study of mean arterial pressure (MAP) and pulse pressure (PP) in 129 913 individuals in stage 1 and follow-up analysis in 480 178 additional individuals in stage 2. We report here 136 loci significantly associated with MAP and/or PP. Of these, 61 were previously published through main-effect analysis of BP traits, 37 were recently reported by us for systolic BP and/or diastolic BP through gene–smoking interaction analysis and 38 were newly identified (P < 5 × 10⁻⁸, false discovery rate < 0.05). We also identified nine new signals near known loci. Of the 136 loci, 8 showed significant interaction with smoking status. They include CSMD1 previously reported for insulin resistance and BP in the spontaneously hypertensive rats. Many of the 38 new loci show biologic plausibility for a role in BP regulation. SLC26A7 encodes a chloride/bicarbonate exchanger expressed in the renal outer medullary collecting duct. AVPR1A is widely expressed, including in vascular smooth muscle cells, kidney, myocardium and brain. FHAD1 is a long non-coding RNA overexpressed in heart failure. TMEM51 was associated with contractile function in cardiomyocytes. CASP9 plays a central role in cardiomyocyte apoptosis. Identified only in African ancestry were 30 novel loci. Our findings highlight the value of multi-ancestry investigations, particularly in studies of interaction with lifestyle factors, where genomic and lifestyle differences may contribute to novel findings.
Introduction
Elevated blood pressure (BP), a leading cause of morbidity and mortality worldwide, is known to be influenced by both genetic and lifestyle factors. To date genome-wide association studies (GWAS) have identified over 1000 loci associated with BP and hypertension (1–10). The effects of genetic variants on BP may manifest differently depending on lifestyle exposures. Therefore, incorporating gene–environment (G×E) interactions may identify additional loci (11,12). We established the Gene–Lifestyle Interactions Working Group within the Cohorts for Heart and Aging Research in Genomic Epidemiology (CHARGE) Consortium in order to assess the impact of interactions with multiple lifestyle factors on the genetics of cardiovascular traits (13). Among many lifestyle factors, cigarette smoking influences BP in both acute (14) and chronic (15) fashion, motivating genetic association studies of gene-by-smoking interactions.
Recently we reported findings from a genome-wide association meta-analysis incorporating gene–smoking interactions for systolic BP (SBP) and diastolic BP (DBP) (16). In addition to SBP and DBP, BP can also be characterized as having both steady and pulsatile components, each determined by different physiologic properties of the heart and vasculature and differently related to cardiovascular outcomes. Mean arterial pressure (MAP) reflects the steady component of BP, which is predominantly determined by cardiac output and systemic vascular resistance and regulated by small artery and arteriole tone (17). MAP has been found to be more ‘informative’ than SBP and DBP in predicting mortality from cardiovascular disease including stroke and ischemic heart disease (18,19). Pulse pressure (PP) represents the pulsatile component of BP and is largely determined by cardiac stroke volume and large artery stiffness (17,20). PP has been found to be predictive of coronary heart disease risk and, in some cases, superior to both SBP and DBP, in particular for older adults (21,22). Thus, while SBP is prioritized as the primary treatment target for hypertension (23), MAP and PP continue to be relevant BP traits for investigation. Understanding their biological underpinnings may lead to discovery of new BP pathways.
In this study, we performed a genome-wide association meta-analysis of MAP and PP incorporating gene–smoking interactions (Fig. 1). The aim is to evaluate whether any of the previously identified BP loci are modified by smoking, whether interactions can be identified using a genome-wide approach and whether additional novel BP loci can be identified by accounting for potential single nucleotide polymorphism (SNP)–smoking interactions. Here, we report our findings through two degrees of freedom (DF) test that jointly evaluates genetic main and interaction effects (24) based on 610 091 individuals across five ancestries.
Figure 1.
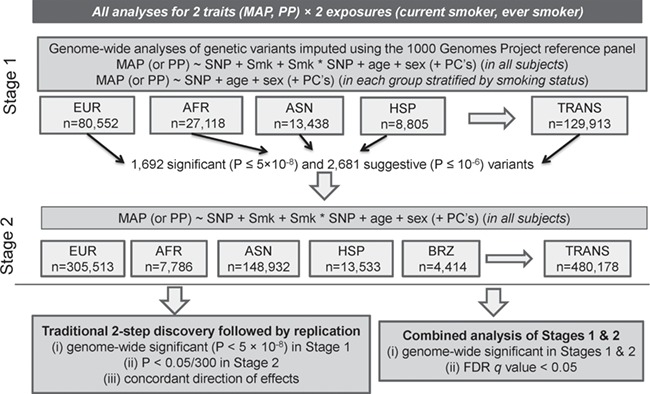
Study design. Summary of data included in this study. Smk: smoking status (considering either current smoking or ever smoking status separately); PC: principal component; EUR: European; AFR: African; ASN: Asian; HIS: Hispanic; BRZ: Brazilian; TRANS; trans-ancestry (i.e. combining all ancestry groups through meta-analysis).
Results
Overview
Across five ancestries, we performed a genome-wide gene–smoking interaction study of MAP and PP in 129 913 individuals in stage 1 and follow-up analysis in 480 178 additional individuals in stage 2: summary information is in Table 1 (Supplementary Materials, Tables S1–S6). Through genome-wide search in stage 1, we identified 1692 significant (P ≤ 5 × 10⁻⁸) and 2681 suggestive (P ≤ 10−6) variants associated with MAP and/or PP. Of these 4373 variants, 2982 variants were replicated in stage 2 with P < 0.05/4373 (to an aggregate replication rate of 68.2%). Of the 1692 significant variants in stage 1, a total of 1449 were replicated in stage 2 with P < 0.05/1692 to a replication rate of 85.6%. Among the genome-wide significant variants in stage 1, which resided in 112 loci (defined by physical distance ± 1 Mb), 53 loci were formally replicated in stage 2 using Bonferroni-adjusted significance levels (P < 0.05/112). Most of the remaining 59 loci were identified in African or Hispanic ancestries in stage 1, which quite plausibly failed to replicate in stage 2 due to these smaller sample sizes and hence lack of power. For 10 loci, no additional data were available in stage 2, and therefore, it was not possible to check for replication. All of these formally replicated loci had been identified previously: 44 through main effects GWAS (1–8) and 9 through gene–smoking interaction analysis we reported recently for SBP and DBP (16). For these nine formally replicated loci, estimates of the genetic main effects were all consistent between stages 1 and 2; estimates of SNP-smoking interaction effects were not statistically significant (Supplementary Material, Table S7).
Table 1.
Basic characteristics of cohorts in stages 1 and 2 in each ancestry
| Current smoker | Former smoker | Never smoker | Male | HTN | HT meds | Age | MAP | PP | |||||||
|---|---|---|---|---|---|---|---|---|---|---|---|---|---|---|---|
| N | % | N | % | N | % | % | % | % | Mean | SD | Mean | SD | Mean | SD | |
| Stage 1 | |||||||||||||||
| EUR | 14 607 | 18.1 | 28 409 | 35.3 | 37 535 | 46.6 | 32.6 | 38.2 | 25.4 | 54.63 | 8 | 94.63 | 12.9 | 52.02 | 13.3 |
| AFR | 5545 | 21.5 | 7185 | 27.8 | 13 121 | 50.8 | 26.5 | 55.9 | 39.5 | 54.49 | 9.1 | 99.96 | 14.9 | 54.67 | 16.4 |
| ASN | 2465 | 18.3 | 1677 | 12.5 | 9296 | 69.2 | 51.2 | 46.9 | 27 | 55.42 | 9.7 | 98.70 | 13.4 | 57.86 | 15.8 |
| HIS | 1068 | 12.1 | 2160 | 24.5 | 5577 | 63.3 | 24.9 | 43.5 | 13.3 | 55.5 | 11 | 94.80 | 13.9 | 53.55 | 16.4 |
| Stage 1 total | 23 685 | 18.4 | 39 431 | 30.7 | 65 529 | 50.9 | 32.8 | 43.1 | 27.7 | 54.74 | 8.6 | 96.17 | 13.4 | 53.28 | 14.4 |
| Stage 2 | |||||||||||||||
| EUR | 48 198 | 17 | 89 597 | 31.6 | 145 914 | 51.4 | 47.8 | 44.8 | 25 | 55.91 | 8.6 | 102.17 | 13.5 | 55.29 | 13.9 |
| AFR | 1971 | 29.8 | 1579 | 23.8 | 3075 | 46.4 | 40.9 | 54.3 | 42.8 | 53.66 | 10.2 | 101.21 | 14.7 | 53.68 | 14.8 |
| ASN | 29 485 | 19.8 | 40 850 | 27.4 | 78 597 | 52.8 | 54.9 | 50.3 | 33.1 | 60.76 | 12.3 | 98.31 | 13.9 | 54.91 | 14.0 |
| HIS | 2739 | 20.3 | 2559 | 18.9 | 8231 | 60.8 | 41 | 26.9 | 16.3 | 45.86 | 13.8 | 91.36 | 13.7 | 48.99 | 13.3 |
| BRZ | 998 | 22.6 | 514 | 11.6 | 2902 | 65.8 | 48 | 15.5 | 6.3 | 27.78 | 3.2 | 89.75 | 12.3 | 45.23 | 9.8 |
| Stage 2 total | 83 391 | 18.2 | 135 099 | 29.6 | 238 719 | 52.2 | 49.7 | 45.9 | 27.4 | 56.84 | 9.9 | 100.54 | 13.7 | 54.88 | 13.9 |
| TOTAL | 107 076 | 18.3 | 174 530 | 29.8 | 304 248 | 51.9 | 46.1 | 45.3 | 27.4 | 56.4 | 9.6 | 99.61 | 13.6 | 54.54 | 14.0 |
The cell entries for the covariates and BP traits correspond to sample-size-weighted averages across all cohorts in each category. EUR: European; AFR: African; ASN: Asian; HIS: Hispanic; BRZ: Brazilian; ALL: trans-ancestry (i.e. combining all ancestry groups through meta-analysis); HTN: hypertension; MAP: mean arterial pressure; PP: pulse pressure.
We performed meta-analysis combining stages 1 and 2 (Manhattan plots, Supplementary Material, Fig. S1; quantile–quantile, QQ, plots, Supplementary Material, Fig. S2). Through this combined analysis with 610 091 individuals, we identified 136 loci that were associated with MAP and/or PP at genome-wide significance (P ≤ 5 × 10⁻⁸). Of these, 61 loci were previously published through main effects GWAS for any BP trait (1–8), 37 loci (presented in Supplementary Material, Table S7) were recently reported by us for SBP and/or DBP through gene–smoking interaction analysis (16) and the remaining 38 loci are newly reported here (Table 2).
Table 2.
Thirty-eight new loci associated with MAP and/or PP that are at least 1 Mb away from any known BP locus
| Locus | rsID | Nearest gene | Position | EAF | Race | Trait/exposure | G effect | G StdErr | G×E effect | G×E StdErr | Interaction P | Joint P | FDR q value | N |
|---|---|---|---|---|---|---|---|---|---|---|---|---|---|---|
| 1 | rs115356163 | PADI2 | 1:17466024 | 0.02 | AFR | PP/CS | 0.22 | 0.87 | −7.70 | 1.53 | 0.04 | 5.17E-09* | 3.63E-05 | 12 712 |
| 2 | rs147515295 | EYA3; SESN2 | 1:28389841 | 0.98 | HIS | MAP/ES | 2.94 | 1.04 | 2.80 | 1.52 | 0.10 | 3.47E-08 | 0.018721 | 7287 |
| 3 | rs11587661 | COG2 | 1:230671208 | 0.02 | AFR | PP/CS | 0.44 | 0.86 | −7.63 | 1.51 | 1.31E-06 | 4.95E-08 | 0.010168 | 13 888 |
| 4 | rs138318054 | KIAA1804 | 1:233578559 | 0.02 | AFR | PP/CS | −0.37 | 0.93 | −7.58 | 1.66 | 1.40E-05 | 4.84E-08 | 0.010095 | 10 787 |
| 5 | rs79113694 | GALNT14 | 2:31253799 | 0.03 | AFR | PP/ES | −0.60 | 0.58 | −2.91 | 0.83 | 1.98E-04 | 7.65E-09 | 5.96E-05 | 25 557 |
| 6 | rs183927068 | MAP2 | 2:210288479 | 0.98 | AFR | MAP/CS | −0.60 | 1.09 | 11.29 | 2.02 | 8.36E-08 | 2.05E-09* | 0.001619 | 7925 |
| 7 | rs75875736 | STAC | 3:36341106 | 0.02 | AFR | PP/ES | −3.49 | 0.58 | 3.15 | 0.94 | 1.23E-03 | 1.41E-08 | 0.000108 | 21 985 |
| 8 | rs116199364 | CLSTN2 | 3:139951198 | 0.02 | AFR | PP/CS | 1.94 | 0.92 | −10.54 | 1.88 | 2.23E-08 | 1.04E-07 | 0.000675 | 10 787 |
| 9 | rs114619985 | BOD1L | 4:13599930 | 0.02 | AFR | PP/ES | −2.74 | 0.78 | −1.86 | 1.13 | 0.04 | 2.71E-10* | 2.61E-06 | 18 015 |
| 10 | rs201223145 | PRDM5 | 4:121706475 | 0.97 | AFR | PP/CS | 2.67 | 0.68 | 2.91 | 1.39 | 0.12 | 5.91E-09* | 0.001905 | 15 574 |
| 11 | rs147998309 | PCDH10 | 4:133596832 | 0.99 | AFR | PP/CS | 1.61 | 1.18 | 12.94 | 2.64 | 1.78E-06 | 2.41E-09* | 1.74E-05 | 7925 |
| 12 | rs146622638 | GPM6A | 4:176524533 | 0.97 | AFR | PP/ES | 2.76 | 0.65 | 0.16 | 0.98 | 0.95 | 4.55E-08 | 0.000334 | 21 332 |
| 13 | rs72723039 | IRX2 | 5:2664169 | 0.98 | AFR | PP/CS | −1.69 | 1.10 | 10.76 | 1.88 | 2.39E-08 | 6.55E-09 | 0.002064 | 7925 |
| 14 | rs79205226 | CDKAL1 | 6:21103825 | 0.02 | AFR | PP/CS | 1.46 | 0.68 | −7.94 | 1.30 | 1.60E-09 | 3.38E-09* | 2.41E-05 | 15 574 |
| 15 | rs200495667 | ALDH8A1 | 6:135152480 | 0.08 | ASN | PP/CS | −2.48 | 0.41 | 2.63 | 0.92 | 3.11E-03 | 1.50E-08 | 0.000378 | 10 110 |
| 16 | rs190090939 | ACTR3B | 7:152802243 | 0.01 | AFR | PP/CS | −0.01 | 1.12 | −11.94 | 2.24 | 1.86E-07 | 5.41E-09* | 3.79E-05 | 7925 |
| 17 | rs140994551 | CSMD1 | 8:4449086 | 0.01 | AFR | PP/CS | 0.43 | 1.07 | −11.39 | 1.89 | 4.34E-09 | 2.07E-11* | 1.93E-07 | 7925 |
| 18 | rs7817784 | TNKS | 8:9682553 | 0.57 | EUR | MAP/CS | −0.23 | 0.03 | 0.05 | 0.08 | 0.89 | 6.93E-13* | 2.59E-09 | 364 584 |
| 19 | rs12156238 | FAM167A | 8:11285135 | 0.19 | EUR | MAP/ES | −0.30 | 0.06 | 0.10 | 0.08 | 0.29 | 1.03E-08 | 1.69E-05 | 349 729 |
| 20 | MERGED_DEL _2_50178 | PKIA | 8:79178179 | 0.01 | EUR | MAP/CS | 1.60 | 1.34 | −9.18 | 1.86 | 6.30E-07 | 1.25E-08 | 3.56E-05 | 9465 |
| 21 | rs11991823 | LRRC69; SLC26A7 | 8:92188440 | 0.37 | Trans | PP/ES | −0.23 | 0.03 | 0.06 | 0.05 | 0.43 | 1.29E-15* | 8.89E-11 | 552 719 |
| 22 | rs7823377 | TRHR | 8:110073120 | 0.63 | Trans | PP/CS | −0.15 | 0.03 | 0.05 | 0.06 | 0.41 | 3.90E-08 | 0.000260 | 583 554 |
| 23 | rs76209156 | KDM4C | 9:7423109 | 0.99 | AFR | PP/CS | 0.03 | 1.19 | 10.43 | 2.14 | 1.96E-06 | 2.94E-08 | 0.000197 | 7925 |
| 24 | rs77548020 | FLJ41200; NFIB | 9:13480744 | 0.98 | AFR | PP/CS | 0.75 | 0.83 | 7.27 | 1.59 | 1.56E-04 | 1.91E-08 | 0.00013 | 10 787 |
| 25 | rs75872665 | LOC100128811 | 10:25388468 | 0.99 | AFR | PP/CS | 0.08 | 1.09 | 8.94 | 1.88 | 3.41E-04 | 2.80E-08 | 0.000188 | 10 787 |
| 26 | rs76497600 | BUB3 | 10:125119610 | 0.03 | AFR | PP/ES | −0.79 | 0.61 | −2.65 | 0.85 | 0.01 | 2.29E-08 | 0.000173 | 21 336 |
| 27 | rs148454833 | OR52A4 | 11:5114798 | 0.98 | AFR | PP/CS | 0.34 | 0.76 | 7.09 | 1.47 | 8.39E-06 | 2.16E-08 | 0.000147 | 13 888 |
| 28 | rs186331780 | FAM19A2 | 12:61710810 | 0.02 | AFR | PP/CS | −2.43 | 0.89 | −4.88 | 1.66 | 0.02 | 3.15E-08 | 0.007099 | 10 787 |
| 29 | rs146924684 | AVPR1A | 12:63437286 | 0.99 | AFR | MAP/ES | 4.88 | 0.83 | −3.20 | 1.22 | 0.18 | 5.29E-09* | 2.62E-05 | 18 015 |
| 30 | rs117206641 | FBRSL1 | 12:133086888 | 0.11 | Trans | MAP/CS | 0.32 | 0.05 | 0.03 | 0.13 | 0.70 | 1.14E-10* | 5.71E-07 | 393 100 |
| 31 | rs73212161 | TDRD3 | 13:61261485 | 0.99 | AFR | PP/ES | −1.39 | 1.40 | 7.80 | 1.77 | 1.50E-05 | 1.68E-08 | 0.006503 | 13 888 |
| 32 | rs78265647 | IGF1R | 15:99247941 | 0.98 | AFR | PP/CS | −1.71 | 0.72 | 7.64 | 1.28 | 2.02E-09* | 8.86E-09 | 6.09E-05 | 15 847 |
| 33 | rs145181522 | TOX3 | 16:52490106 | 0.02 | AFR | PP/CS | −0.65 | 0.95 | −8.04 | 1.58 | 3.67E-05 | 3.66E-11* | 3.32E-07 | 10 787 |
| 34 | rs114511313 | NUDT7 | 16:77706251 | 0.98 | AFR | PP/CS | 1.67 | 0.73 | 4.06 | 1.28 | 0.13 | 1.63E-08 | 0.000111 | 15 574 |
| 35 | rs75129914 | RIT2 | 18:40267945 | 0.97 | AFR | PP/ES | 0.32 | 0.61 | 3.42 | 0.85 | 3.81E-04 | 2.13E-09* | 1.80E-05 | 21 794 |
| 36 | rs115134409 | MALT1; NEDD4L | 18:56324467 | 0.02 | AFR | PP/CS | −0.31 | 0.77 | −6.46 | 1.29 | 3.26E-03 | 3.64E-10* | 2.92E-06 | 12 890 |
| 37 | rs78375085 | TNFRSF11A | 18:60032891 | 0.98 | AFR | PP/ES | 4.55 | 0.77 | −5.57 | 1.21 | 4.71E-06 | 1.64E-08 | 0.000124 | 17 616 |
| 38 | rs191056303 | PXMP4 | 20:32306802 | 0.98 | AFR | PP/CS | 0.15 | 0.74 | 7.41 | 1.47 | 5.99E-07 | 1.77E-08 | 0.000121 | 13 888 |
A new BP locus was defined as a significantly associated variant that is at least 1 Mb away from any previously identified BP locus. Each locus is genome-wide significant (P < 5 × 10⁻⁸) in the combined analyses of stages 1 and 2 and had FDR q value < 0.05.
Positions are based on human genome build 37. EAF: effect allele frequency; G effect: the estimate of the genetic main effect ( ; G×E effect: the estimate of genetic–smoking interaction effect
  ; Interaction P: P-value for testing the G×E interaction effect with one DF; Joint P: P-value for jointly testing G main and G×E interaction effects with two DF; EUR: European ancestry. Trans: trans-ancestry (i.e. combining all ancestry groups through meta-analysis); MAP: mean arterial pressure; PP: pulse pressure; CS: current-smoking; ES: ever-smoking.
*Findings with an asterisk indicate statistical significance using a stricter P-value threshold, after Bonferroni correction for two smoking traits, two tests, and two BP traits (5 × 10⁻⁸/8 = 6.25 × 10⁻⁹).
Among the 136 loci associated with MAP and/or PP, 38 loci are completely new and at least 1 Mb away from any of known BP loci. A total of 16 novel loci passed a more stringent threshold (P < 6.25 × 10⁻⁹, adjusted for two smoking exposures, two tests and two BP traits). We also identified nine additional new signals within the known BP loci but not in linkage disequilibrium (LD), r2 < 0.1, with known BP loci (Table 3). Among the nine identified signals, four signals were identified in trans-ancestry, and the remaining five were ancestry-specific (two European, two African and one Hispanic signals). The LocusZoom plots for these completely novel 38 loci and 9 signals are shown in Supplementary Material, Figure S3. As shown in Venn diagram (Fig. 2), among 38 new loci and 9 signals, 38 were newly PP associated and 12 were newly MAP associated (with 3 common between PP and MAP). These were not associated with SBP or DBP. False discovery rate (FDR) q-values provided additional evidence for these newly identified loci (FDR < 0.01 for 43 of the 47 and FDR < 0.05 for all 47 loci or signals).
Table 3.
Nine new signals associated with MAP and/or PP that are near known BP loci (but not in LD, r2 < 0.1)
| Locus | rsID | Nearest gene | Position | EAF | Race | Trait/exposure | G effect | G StdErr | G×E effect | G×E StdErr | Interaction P | Joint P | FDR q value |
|---|---|---|---|---|---|---|---|---|---|---|---|---|---|
| 1 | rs140881076 | KAZN | 1:15364113 | 0.01 | AFR | PP/CS | 0.45 | 1.13 | −11.95 | 1.85 | 2.30E-03 | 3.29E-14* | 4.16E-10 |
| 2 | rs2071405 | AGT | 1:230850658 | 0.13 | Trans | MAP/CS | 0.28 | 0.04 | −0.18 | 0.09 | 0.20 | 3.02E-12* | 1.62E-08 |
| 3 | rs143802076 | C3orf38 | 3:88646080 | 0.01 | AFR | PP/CS | −0.50 | 0.90 | −8.54 | 1.68 | 8.97E-04 | 1.33E-09* | 9.81E-06 |
| 4 | rs1009382 | TNXB | 6:32026107 | 0.71 | EUR | PP/CS | 0.26 | 0.04 | −0.16 | 0.08 | 0.15 | 4.84E-13* | 3.30E-09 |
| 5 | rs7005363 | MSRA | 8:10283748 | 0.54 | EUR | MAP/ES | −0.34 | 0.04 | 0.15 | 0.06 | 0.02 | 3.13E-17* | 1.59E-13 |
| 6 | rs187148391 | TXN | 9:112998518 | 0.99 | HIS | MAP/ES | 0.09 | 0.69 | 4.48 | 1.03 | 1.01E-03 | 1.95E-08 | 0.013302 |
| 7 | rs10894198 | ADAMTS8 | 11:130285493 | 0.38 | Trans | PP/CS | 0.27 | 0.03 | −0.12 | 0.07 | 0.33 | 1.38E-19* | 3.19E-15 |
| 8 | rs1010064 | LOC100506393 PDE3A | 12:20000315 | 0.75 | Trans | MAP/ES | 0.24 | 0.04 | −0.12 | 0.06 | 0.03 | 5.91E-11* | 6.64E-10 |
| 9 | rs201028933 | LOC338758 | 12:90111249 | 0.79 | Trans | MAP/ES | 0.32 | 0.08 | 0.16 | 0.11 | 0.28 | 1.73E-11* | 9.75E-08 |
A new signal is defined as a significantly associated variant within 1 Mb of known BP loci but in weak LD r2 < 0.1 with the known BP loci. LD for the trans-ancestry signals was based on the entire 1000 Genomes cosmopolitan data, whereas LD for ancestry-specific signals was based on ancestry-specific population (e.g. LD for European signals were based on 1000 Genomes European data). Each locus is genome-wide significant (P < 5 × 10⁻⁸) in the combined analyses of stages 1 and 2 and had FDR q value < 0.05.
Positions are based on human genome build 37. EA: effect allele; EAF: effect allele frequency; G effect: the estimate of the genetic main effect ; G×E effect: the estimate of genetic–smoking interaction effect
 ; Interaction P: P-value for testing the G×E interaction effect with one DF; Joint P: P-value for jointly testing G main and G×E interaction effects with two DF; EUR: European ancestry. Trans: trans-ancestry (i.e. combining all ancestry groups through meta-analysis); MAP: mean arterial pressure; PP: pulse pressure; CS: current-smoking; ES: ever-smoking.
*Findings with an asterisk indicate statistical significance using a stricter P-value threshold, after Bonferroni correction for two smoking traits, two tests, and two BP traits (5 × 10⁻⁸/8 = 6.25 × 10⁻⁹).
Figure 2.
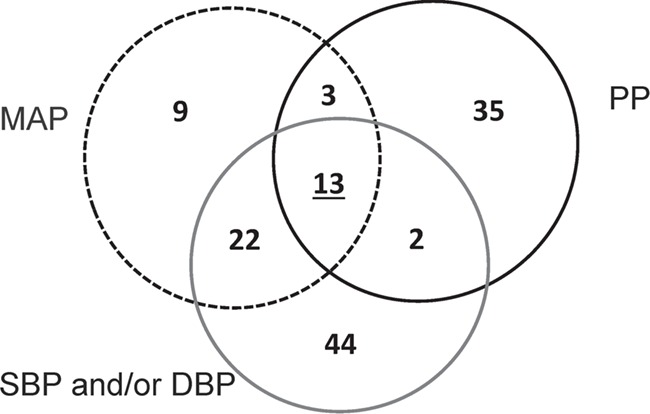
Venn diagram of loci/signals associated with the four BP traits. The diagram shows 133 loci and/or signals that were identified through gene–smoking interactions. In this paper, we newly identified 38 loci (Table 2) and 9 signals near known BP loci (Table 3) that are unique to MAP and/or PP (to a total of 49 new loci/signals). We had reported 81 loci associated with SBP/DBP (16), among which 37 showed association with MAP or PP. SBP: systolic blood pressure; DBP, diastolic blood pressure; MAP: mean arterial pressure; PP: pulse pressure.
Supplementary Material, Table S8 presents more detailed results for the lead variants representing the 136 loci and the 9 signals associated with MAP and PP: ancestry-specific and trans-ancestry meta-analysis results within each stage (1 and 2) and ancestry-specific and trans-ancestry meta-analysis results combining stages 1 and 2. Scatterplots comparing ancestry-specific genetic effects at these variants are presented in Supplementary Material, Figure S4. Genetic effects between European and Hispanic ancestries had the highest correlation (0.79), whereas those between African and Hispanic ancestries had the lowest correlation (0.29).
The role of interactions
Among the 136 loci and 9 new signals associated with MAP and/or PP, variants at 8 loci showed genome-wide significant interactions (1 DF interaction P < 5 × 10⁻⁸) with smoking status (Fig. 3). All eight loci were identified with current smoking status; these variants have larger effects in current smokers than in non-current smokers. Of the eight loci, six loci showed increasing effects on BP in current-smokers. Five interactions were newly identified (Table 2), and the other three were previously reported for SBP or DBP (Supplementary Material, Table S7). These variants showing interaction effects were identified only in individuals of African ancestry in stage 1. These variants were not present in stage 2 because of the limited sample size (ranges from 418 to 1993) of stage 2 African ancestry cohorts, and therefore, replication of these interactions was not possible.
Figure 3.
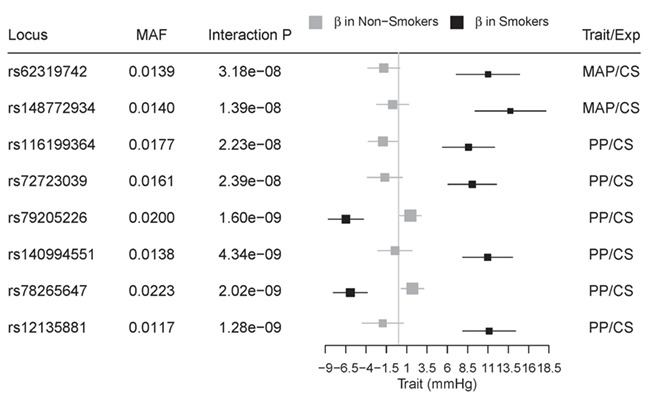
Smoking-specific genetic effect sizes in African ancestry for MAP or PP. Among the 138 loci significantly associated with MAP and/or PP, 8 loci show significant interactions with smoking exposure status in African ancestry. Smoking-specific effect estimates and 95% confidence intervals for variants associated with BP traits are shown as red and blue squares for current-smokers and non-current smokers, respectively. SNP effects between two strata are significantly different (one DF interaction P < 5 × 10⁻⁸). These results were based on African-specific results in stage 1. MAP: mean arterial pressure; PP: pulse pressure; CS: current-smoking.
BP variance explained
Within each of the smoking strata, we computed the variance of MAP and PP explained by genome-wide results (25) in European ancestry (Fig. 4). The independent set of variants, 38 for MAP and 12 for PP, with P ≤ 5 × 10⁻⁸ explained 1.9% of variance in MAP and 0.5% of variance in PP. The difference in explained variance between the smokers and non-smokers was not significant, suggesting that BP variance explained by interaction effects is very small. Similar inference was observed with the results from ever-smoking status (data not shown).
Figure 4.
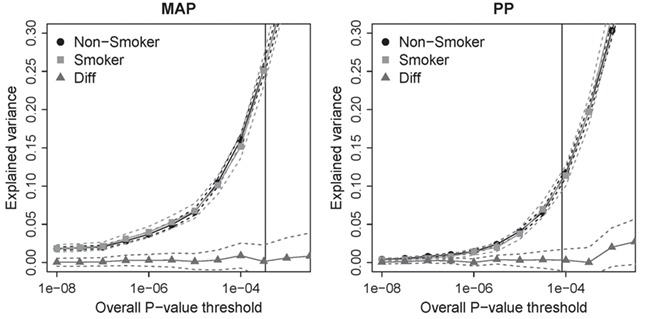
Smoking-specific estimates of variance explained in European ancestry. The variants with P ≤ 5 × 10⁻⁸ explained 1.9% of variance in MAP and 0.5% of variance in PP, whereas variants with P ≤ 10-4 explained 16% of variance in MAP and 11% of variance in PP. The vertical line corresponds to FDR = 0.1.
Functional inferences
To obtain functional annotations from HaploReg (26), we focused on the index variants representing the 84 loci (38 novel loci, 9 new signals near known loci and 37 recently reported) that showed association with MAP and/or PP. There was one missense variant, rs1009382. Of the remaining non-coding variants (37 intronic and 51 intergenic), 15 were in promoter histone marks, 47 in enhancer histone marks, 28 in DNase I marks and 8 altered the binding sites of regulatory proteins (Supplementary Material, Table S9). Using GERP (27), five variants were identified as being conserved among vertebrates, with three variants identified as such using SiPhy (28). For 27 variants, cis-expression quantitative trait loci (eQTL) evidence was available with varying degrees of association with expression probes. In particular, 10 of them were identified by GTEx (29) as cis-eQTLs across various tissues (Supplementary Material, Table S9). In addition, we obtained information on microarray-based gene and exon expression levels in whole blood from over 5000 individuals of the Framingham Heart Study (30) (Supplementary Material, Table S10). There were 109 variant-transcript pairs (representing 26 variants) with cis-eQTL evidence (at P < 8.9 × 10⁻⁵, FDR < 0.002). Among 26 variants (Supplementary Material, Table S10), the 3 variants had the most abundant evidence of cis-eQTL association: rs112947839, rs1009382 and rs7753826 associated with 21, 18, and 10 transcripts, respectively.
The analyses using data-driven expression prioritized integration for complex traits (DEPICT) prioritized genes (FDR < 5%) at 40 loci, including 16 genes that did not match the nearest gene of the identified lead variant (Supplementary Material, Table S11). Furthermore, the analyses highlighted 56 significantly (FDR < 5%) enriched gene sets. Many of these highlight cardiovascular mechanisms, such as ‘abnormal blood vessel morphology’, ‘thin myocardium’ or ‘abnormal heart development’ (Supplementary Material, Table S12). We also observed that genome-wide significant MAP and PP loci are enriched for genes expressed in the ileum (Supplementary Material, Table S13).
Associations of BP loci with cardiometabolic traits
We obtained association results of the 84 index variants associated with MAP or PP (representing 38 novel loci, 9 new signals near known loci and 37 recently reported loci) with multiple cardiometabolic traits: coronary artery disease (CAD), stroke, adiposity, diabetes and renal function (Supplementary Materials, Tables S14–S19). For 36 out of 47 scenarios (highlighted in red, Supplementary Material, Table S20), the observed number of variants with nominal evidence of association (P < 0.05) was higher than that expected by chance alone (PBinomial < 0.05/11, corrected for 11 traits used in the lookups). For example, we observed 7 and 11 such associations with CAD and myocardial infarction, respectively, where the expected count is 2.2 for both traits. Corroborating evidence of the multiple cardiometabolic traits were found for the 2 of the 38 new loci: (rs146622638, GPM6A; rs12156238, FAM167A) and the 5 of the 9 new signals near known BP loci (rs2071405, AGT; rs1009382, TNXB; rs7005363, MSRA; rs1010064, LOC100506393; rs201028933, LOC338758). These overlapping signals support that these traits may share a common pathophysiology.
Loci overlapping with previously reported SBP or DBP loci
Among the loci that were reported by us recently as significantly associated with SBP and/or DBP based on gene-by-smoking interaction analysis (16), 37 loci were also associated with MAP and/or PP (Supplementary Material, Table S7). Among them, nine loci were formally replicated in stage 2 and showed association with all four BP traits. Variants at these nine loci were all also genome-wide significant in the combined analysis of stages 1 and 2 in individuals of European ancestry. For variants at six of the nine loci, there was supporting evidence of association in individuals of non-European ancestry, which resulted in stronger statistical significance from trans-ancestry analysis. One such locus was rs351364 (in WNT2B), where only trans-ancestry analysis reached genome-wide significance in stage 1; the direction of the genetic effect was consistent across all ancestries (with 2DF P = 2.8 × 10⁻³¹; Supplementary Material, Table S7).
New signals near known BP loci
Nine new signals were identified near known BP loci (but not in LD, r2 < 0.1). One such signal was rs140881076 (chr1:15364113, 2DF P = 3.3 × 10⁻¹⁴, Fig. 5A) in association with PP in individuals of African ancestry. This signal is 434 kb away and in complete linkage equilibrium with CELA2A locus (rs3820068, chr1:15798197) that was recently identified in individuals of European ancestry (7,8). Several nearby genes have been implicated in cardiovascular traits. FHAD1 is a long non-coding RNA overexpressed in heart failure (31), TMEM51 has been associated with contractile function in cardiomyocytes (32) and CASP9 plays a central role in cardiomyocyte apoptosis (33). A candidate gene study identified a missense mutation in CASP9 as associated with ischemic stroke in Koreans (34). Differential methylation patterns in TMEM51 have also been described in peripheral blood leukocytes of smokers (35,36).
Figure 5.
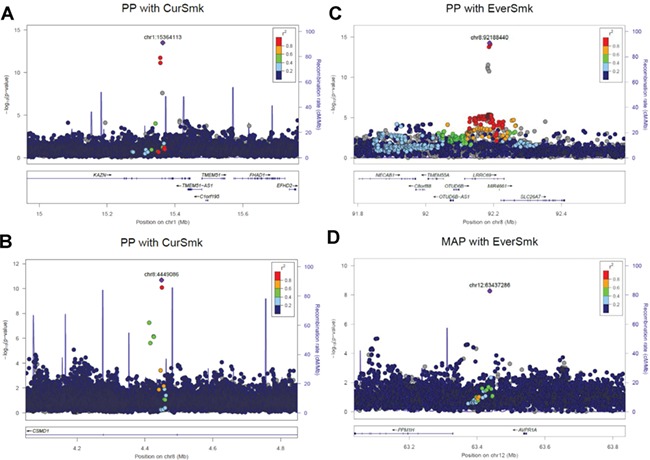
LocusZoom plots for four selected loci associated with MAP and/or PP. (A) rs140881076 (chr1:15364113) was identified in an analysis of individuals of African ancestry and is intronic to KAZN; neighboring genes have been implicated in cardiovascular traits. FHAD1 is a long non-coding RNA overexpressed in heart failure, TMEM51 has been associated with contractile function in cardiomyocytes and CASP9 plays a central role in cardiomyocyte apoptosis. (B) rs140994551 (chr8:4449086), intronic to CSMD1, shows interaction with current smoking in individuals of African ancestry. CSMD1 are shown to be associated with insulin resistance and BP in the spontaneously hypertensive rats. CSMD1 is also suggestively associated with studies of addiction and related disorders. (C) rs11991823 (chr8:92188440) was associated with PP in trans-ancestry analyses and in intronic to LRRC69. The nearby gene SLC26A7 encodes a chloride/bicarbonate exchanger expressed specifically in the renal outer medullary collecting duct. (D) rs146924684 (chr12:63437286) was associated with MAP in individuals of African ancestry. The nearby gene AVPR1A is widely expressed including in vascular smooth muscle cells, kidney, myocardium and brain. CurSmk: current smoking status; EverSmk: ever smoking status; MAP: mean arterial pressure; PP: pulse pressure. The plots were created using LocusZoom (http://locuszoom.sph.umich.edu/).
Through trans-ancestry analysis, we identified one locus (rs1010064) associated with both MAP and PP (2DF P = 5.9 × 10⁻¹¹). This is located approximately 500 kb upstream of, but not in LD with, PDE3A, a known BP gene with a role in regulating growth in vascular smooth muscle cells (4,37). Missense mutations in PDE3A have been linked with autosomal dominant syndrome characterized by treatment-resistant hypertension and brachydactyly (38,39). SNPs in this locus have also shown suggestive associations with aortic root diameter (40), resistant hypertension (41) and SBP in a SNP–alcohol consumption interaction analysis (42).
Biological relevance of newly identified BP loci
Several genes near the 38 novel loci show biologic plausibility for a role in BP regulation. One such gene is CSMD1 (rs140994551, chr8:4449086, associated with PP in individuals of African ancestry while considering interaction with current smoking status, 2DF P = 2.1 × 10⁻¹¹, Fig. 5B). In animal models, variants in CSMD1 were associated with both insulin resistance and BP in the spontaneously hypertensive rats (SHRs) (43). In humans, there was suggestive evidence of association with hypertension in two Korean cohorts (44), with peripheral artery disease in a Japanese population (45), with waist–hip ratio adjusted for BMI in men (46), with insulin resistance in African Americans (47) and with studies of addiction and related disorders (48). Another new locus is LRRC69 (rs11991823, chr8:92188440, associated with PP, identified through trans-ancestry analysis, 2DF P = 1.3 × 10⁻¹⁵, Fig. 5C). A copy number variant in this gene has been shown to be weakly associated (P = 0.04) with BP in a Korean population (49). The nearby gene SLC26A7 encodes a chloride/bicarbonate exchanger expressed specifically in the renal outer medullary collecting duct (50). Two PP loci include genes involved in the NFkB signaling pathway (TNFRSF11A and NFIB). This inflammatory pathway has been implicated in hypertension-induced renal dysfunction in murine models (51) and with endothelial dysfunction in overweight/obese and older humans (52). There was suggested evidence of association of variants in TNFRSF11A with BP traits in Chinese women (53).
A new locus near AVPR1A (rs146924684 chr12:63437286, associated with MAP, 2DF P = 5.3 × 10⁻⁹, Fig. 5D) also has strong biologic plausibility. Vasopressin is an antidiuretic hormone and a potent vasoconstrictor that exerts its effect through activation of a family of receptors, including the arginine vasopressin receptor subtype 1A (AVPR1A) that is widely expressed including in vascular smooth muscle cells, kidney, myocardium and brain (54). In glomerular macula densa cells, AVPR1A facilitates activation of the renin–angiotensin–aldosterone system and increases expression of the aquaporin 2 water channel (55). AVPR1A stimulation is also necessary for maintaining normal BP; in murine knockout models, basal BP is significantly decreased and the arterial baroreceptor reflex markedly impaired (56). Notably, there are data to support a role for vasopressin not only in the maintenance, but also in the development, of hypertension. Vasopressin receptor 1A blockade in young, still normotensive, SHR attenuates the later development of hypertension in adult SHR despite withdrawal of drug therapy (57).
We identified several loci with potential relevance to the structure and function of primary cilia, in addition to those we reported recently (16). Three PP-associated loci were near genes implicated with nephronophthisis, including those with mutations linked to Bardet–Biedl Syndrome (BBS7 and MYO3A) and with Joubert Syndrome (AHI1). Another PP-associated locus was near NEDD4L, which encodes the E3 ubiquitin ligase NEDD4–2 and has been shown to regulate a renal epithelial sodium channel (ENaC/SCNN1) that is critical for maintenance of sodium homeostasis (58). ENaC is the channel responsible for the monogenetic disorder of BP regulation, Liddle Syndrome. Loss of NEDD4–2 in the renal tubules results in increased activity of the ENaC channel, resulting in salt-sensitive hypertension (59). Candidate gene studies identified variants in NEDD4L as associated with sodium lithium countertransport (60), hypertension (61), treatment response to β-blockers and diuretics in hypertensive patients (61–63).
We identified two additional loci with potential relevance to the dopaminergic system, in addition to those we reported recently (16). Dopamine signaling plays a key role in both central and peripheral BP regulation (64–66). A regulatory subunit (PPP2R2A) of the dopamine receptor 2R (D2R) was associated with MAP. In murine renal proximal tubule cells, inhibition of this regulatory protein leads to increased expression of markers of renal inflammation and injury (67). A newly identified MAP-associated locus SESN2 is also related to the dopaminergic system; activation of the D2R has been shown to increase the expression of SESN2, which protects the kidney against renal oxidative stress (68). SESN2 also protects endothelial cell lines against angiotensin II-induced endothelial toxicity (69). Two additional loci include genes involved in dopamine signaling: ATP13A2 (70) and ARPP21 (71). Activation of dopamine centers of the brain has also been implicated in drug and nicotine abuse (72).
In addition, we found a PP-associated locus near SDHB, which encodes the mitochondrial protein succinate dehydrogenase. Variants in this gene have been identified in individuals with carotid body tumors and pheochromocytomas/paragangliomas, endocrine tumors that secrete dopamine and/or norepinephrine and can modulate BP regulation even when tumors are not clinically apparent (73,74). Variants near this locus have been marginally associated with DBP in pre-pubertal European children (75). Tyrosinase (with its related protein, TYRP1) catalyzes the first rate-limiting step in pathway in the formation of L-Dopa (76). Although variants in TYRP1 were suggestively associated with SBP by the International Consortium for Blood Pressure (77), we identified this locus as associated with PP at genome-wide significance.
Discussion
MAP measures the steady component, which is a function of the left ventricular contractility, heart rate, small-artery resistance and vascular elasticity averaged over time (17). PP measures the pulsatile component, which is a function of the left ventricular stroke volume, large-artery stiffness, early pulse wave reflectio, and heart rate (19). These BP traits not only differ in their physiologic properties but are also differently related to cardiovascular outcomes (17,19,78,79). Our genome-wide association meta-analysis incorporating gene–smoking interactions identified 136 loci significantly associated with MAP and/or PP: 61 were previously published through main-effect GWAS analysis (1–8), 37 were recently reported by us for SBP and/or DBP through gene–smoking interaction analysis (16) and 38 are newly reported here. Our analysis also identified nine new signals near known BP loci (but not in LD, r2 < 0.1).
Among the loci significantly associated with MAP and/or PP, eight loci showed significant interaction with smoking status from the one DF interaction tests. At these eight loci, the joint two DF P-values ranged from 1 × 10⁻⁷ to 5 × 10-11, indicating that loci were identified mostly because of their interaction with smoking status. We observed that the genetic effect at these loci is negligible in non-smokers but larger in smokers. As such, a drug that targets this locus with strong interactions may achieve a greater treatment effect among smokers than non-smokers; elevated BP may be treated in smokers using such a drug, whereas the same drug is unlikely to be effective in non-smokers. Alternatively, physicians may counsel patients on specific antihypertensive drugs that they may obtain greater treatment effect if they modify their exposure (e.g. smoking cessation). While precision medicine interventions are still emerging in cardiovascular care, a consideration of interaction effects lays an important foundation. In addition to drug targeting, a smoking interaction can also help us to identify novel biological mechanisms underlying BP traits.
One such locus showing significant interaction with smoking status is CSMD1. While variants of this gene were previously suggested for addiction and related disorders (48), we identified this locus at genome-wide significance (1DF P = 4.3 × 10⁻⁹, 2DF P = 2.1 × 10⁻¹¹). In our study, another locus near AHR showed weak evidence of interaction with smoking (1DF P = 1.6 × 10⁻⁴, 2DF P = 1.7 × 10⁻⁹ associated with MAP). Variants in AHR are shown to interact with variants in CYP1A1, a detoxifying enzyme, to explain BP differences between smokers and non-smokers (80). AHR encodes a ligand-activated transcription factor, and AHR knock-out mice have increased MAP and ventricular hypertrophy/fibrosis with increased plasma levels of angiotensin II (81). Given the evidence that environmental toxins, including tobacco smoke, activate AHR, it is pertinent to note that AHR, in turn, activates tyrosinase activity, the rate limiting step for L-dopa biosynthesis (76). Activation of the AHR protein represses T-cadherin expression, which functions as a negative growth regulator in vascular smooth muscle cells (82,83). T-cadherin (encoded by CDH13) has been previously identified as a BP susceptibility locus (84). Notably, while the endogenous ligand for AHR remains uncertain (85), exogenous ligands include polycyclic aromatic hydrocarbons that are found in tobacco smoke and other environmental pollutants (86).
We found that most of MAP-associated loci were previously associated with SBP and/or DBP. This is not surprising given that MAP is closely related physiologically to SBP and DBP. In contrast, analysis of PP yielded a greater number of novel significant loci that are unique to PP. Loci associated with PP may be identifying different physiologic processes than loci associated with MAP, SBP and DBP. For example, the steady component of BP can be effectively targeted by β-adrenergic receptor and calcium-channel blockers that both modulate arteriolar tone. Angiotensin converting enzyme inhibitors, which favor remodeling of vascular connective tissue, may impact PP to a greater extent (87). This is a clinically important concept since hypertension is often more effectively treated by combination drug therapy to target different physiologic pathways (23).
We identified 30 loci that were statistically significant only in the meta-analyses of African ancestry individuals (forest plots in Supplementary Material, Fig. S5). Due to many prior BP GWAS discoveries, mostly based on European or Asian ancestries, identifying new BP loci in European and Asian ancestries may be challenging. There are also more opportunities to identify lower frequency variants in African ancestry individuals because there are more of these variants in this genetically more diverse population (with correspondingly smaller LD blocks, allowing closer identification of multiple underlying causal variants). The observed effect sizes (in African ancestry, Fig. 3) may be larger than their true values due to winners’ curse (88). All identified loci were in low frequency [with minor allele frequency (MAF) ranging from 1.2% to 3.1%] but had good imputation quality scores ranging from 0.62 to 0.95 (presented in Supplementary Material, Fig. S5). In many of these loci, forest plots show consistent association across the contributing African cohorts. Out of 30, 23 loci were only present in African ancestry, and therefore, these associations could not be effectively evaluated in other ancestry groups as a result of their inter-ancestry differences in MAF. Because of the limited sample sizes available for African ancestry in stage 2, genome-wide significant loci in stage 1 African ancestry could not be formally replicated in stage 2; only the largest African cohort in stage 2 (Health and Retirement Study, N = 1993) provided association results for a subset of 23 loci (Supplementary Material, Fig. S5). For the remaining seven loci, we found evidence of association in African ancestry but not in meta-analyses in other ancestries, despite comparable or higher allele frequencies, such as those observed with rs11587661 (COG2) or rs72723039 (IRX2). We found similar smoking-specific effects on lipid traits that were unique to African ancestry (89). They may relate at least in part to inter-ancestry differences, including preference of menthol cigarettes. Therefore, African-specific loci should be treated cautiously since they require further validation.
This large-scale multi-ancestry study has some limitations. First, because most of the known BP loci were identified in European and Asian ancestries, considerable effort was made to recruit most of the available studies from the other ancestries into stage 1. Although we were able to identify several new loci in African ancestry, the relatively smaller stage 2 sample size of African ancestry (N = 7786) has limited our ability to replicate these new loci. Second, some of our new loci identified through the 2DF joint test may have been identified due to a main effect because of a larger sample size and more diverse ancestries, not necessarily from gene–smoking interaction. Unfortunately, we are unable to verify this because analysis of main effects alone, without regard to smoking status, was not performed. Third, conditional analysis (such as genome-wide complex trait analysis, GCTA) based on summary statistics was not performed because valid methods do not currently exist for G×E interactions. Therefore, we relied on a relatively more stringent LD threshold (r2 < 0.1) for identifying additional signals within the know BP loci. Fourth, if there is a G×E correlation, a potential confounding of G×E with interaction between covariate and smoking exposure may exist. This can inflate Type I error of the G×E interaction test (90).
In summary, this study identified 38 new loci and 9 new signals near known BP loci that are uniquely associated with MAP and/or PP (and not associated with SBP or DBP), demonstrating the promise of gene–lifestyle interactions for genetic and environmental dissection of BP traits. Of our 38 loci, 10 were within 1 Mb of those recently reported by both Evangelou et al. (9) and Giri et al. (10); 6 loci were African-specific. Additional seven loci (including four African-specific loci) were within 1 Mb of those reported by Evangelou et al. (9). Variants in several loci were identified in individuals of African ancestry, highlighting the importance of genetic studies in diverse populations. Many of these new loci (including CSMD1, TMEM51, SLC26A7, TNFRSF11A and AVPR1A) show biologic plausibility for a role in BP regulation. They include additional loci of potential relevance to the structure and function of primary cilia and the dopaminergic system. Understanding underlying mechanisms for the newly identified loci and biological insights into the genetics of BP traits will require further investigation. Out of 136 significant loci, 8 showed significant interaction with smoking status. Because some interactions may be driven by other lifestyle factors that are correlated with smoking, a follow-up study such as Tyrrell and her colleague (91) that jointly examines multiple lifestyle factors can shed light on further understanding of the nature of the smoking interaction effects on BP. Our findings highlight the value of multi-ancestry investigations, particularly in studies of interaction with lifestyle factors, where genomic and lifestyle differences may contribute to novel findings.
Materials and Methods
Participating studies
Analyses included men and women between 18 and 80 years of age from European (EUR), African (AFR), Asian (ASN), Hispanic (HIS) and Brazilian (BRZ) ancestries. A total of 48 cohorts consisting of 129 913 individuals (80 552 EUR; 27 118 AFR; 13 438 ASN; 8.805 HSP; Supplementary Material, Table S1) participated in stage 1 and performed genome-wide analyses. Studies that included data from multiple ancestries (cohorts) contributed multiple analyses, one for each ancestry/cohort. For example, multi-ethinc study of atherosclerosis has four cohorts. A total of 76 additional cohorts consisting of 480 178 individuals (305 513 EUR; 7826 AFR; 148 932 ASN; 13 533 HSP; 4414 BRZ; Supplementary Material, Table S2) participated in stage 2 and performed association analyses of 4373 variants that were identified in stage 1 as either genome-wide significant (P < 5 × 10⁻⁸) or suggestive (P < 10-6). ASN participants include both south Asian and east Asians. Stage 1 ASN includes 7873 East Asians and 5566 South Asians, whereas stage 2 ASN includes 136 961 East Asians and 12 481 South Asians. All participating studies are described in the Supplementary Material. Since discoveries of BP loci to date were largely from EUR populations, considerable effort was made for recruiting most of the available non-EUR cohorts into stage 1 (which limited the availability of non-EUR cohorts in stage 2). Each study obtained informed consent from participants and approval from the appropriate institutional review boards.
Phenotypes and lifestyle variables
Resting SBP and DBP were measured using standard clinical procedures that produce comparable measurements (specific methods per study were described more in Supplementary Material). Even with some difference in measurement across studies, the measures were standardized, through previous main effect BP GWAS studies, as much as possible for BP. For individuals on any anti-hypertensive (BP lowering) medications, 15 mmHg and 10 mmHg were added to their SBP and DBP values, respectively (1). PP was computed as SBP minus DBP (PP = SBP—DBP), and MAP was computed as the sum of DBP and one-third of PP (MAP = DBP + PP/3). To reduce the influence of possible outliers, each BP value was winsorized at six standard deviations (SD) away from the mean (i.e. values greater than six SD away from the mean were set at six SD).
Obtained through interview-based or self-reported questionnaire, varying levels of smoking information were available across studies, some with a simple binary variable and others with repeated data. We considered two of the most widely available smoking variables: ‘current smoking’ status (CurSmk) and ‘ever smoking’ status (EverSmk) (Table 1). Current smoking status was defined as 1 if the individual smoked regularly in past year (and as 0 for non-current smokers, which includes both never and former smokers). Ever smoking status was defined as 1 if the individual smoked at least 100 cigarettes during his/her lifetime (and as 0 for the never smokers). Smoking status was assessed at the time of the BP measurements. Covariates include age, sex, field center (for multi-center studies) and principal components (PCs) (to account for population stratification and admixture). No additional covariates were included. Individuals with missing data for BP, the smoking variable or any covariates were excluded from analysis. Study-specific summary statistics on phenotypes are presented in Supplementary Materials, Tables S3 and S4.
Genotype data
Genotyping was obtained using Illumina (San Diego, CA, USA) or Affymetrix (Santa Clara, CA, USA) genotyping arrays. Each study performed genotype imputation at SNPs, short insertions and deletions (indels), and larger deletions that were not genotyped directly but are available from the 1000 Genomes Project (92). For imputation, most studies used the 1000 Genomes Project Phase I Integrated Release Version 3 Haplotypes (2010–11 data freeze, 2012-03-14 haplotypes), which contain haplotypes of 1092 individuals of all ancestry backgrounds. Study-specific information on genotyping and imputation is presented in Supplementary Materials,Tables S5 and S6.
Cohort-specific analysis
We identified loci through the two DF test that jointly test the genetic main effect and the gene–smoking interaction jointly. This approach has previously enabled identification of new loci associated with insulin resistance, including how the effect of variants differs with levels of BMI (11). The method is described in detail for single studies in Kraft et al. (93) and for implementation in meta-analyses in Manning et al. (24).
Participating studies performed association analyses separately within each ancestry for MAP and PP incorporating CurSmk and EverSmk. All studies performed regression analysis using a model with both genetic main and G×E interaction effects (93): 
Y is the medication-adjusted BP value, Smk is the smoking variable (with 0/1 coding for the absence/presence of the smoking exposure), G is the dosage of the imputed genetic variant coded additively (from 0 to 2) and C is the vector of all other covariates, which include age, sex, field center (for multi-center studies) and PCs (to account for population stratification and admixture). No additional cohort-specific covariates were included. From this model, the studies provided the estimated genetic main and interaction effects and a robust estimate of the corresponding covariance matrix. In addition, studies in stage 1 performed regression analyses with the genetic main-effect model, in the exposed (Smk = 1) and unexposed strata (Smk = 0) separately, and provided estimates of the stratum-specific effects and robust estimates of their standard errors (SE).
Either sandwich (94) or ProbABEL (95) packages were used to obtain robust estimates of covariance matrices and robust SEs for samples of unrelated individuals. Family studies used the generalized estimating equations approach, treating each family as a cluster, or the linear mixed effect model approach with a random polygenic component (for which the covariance matrix depends on the kinship matrix). Robust estimates of covariance matrices and SEs were used to safeguard against mis-specification of the mean model and violation of the assumption of constant BP variance across smoking groups (heteroscedasticity) (96,97).
Quality control
Each study performed standard genotype quality control (QC) that includes excluding SNPs with call rate (<95% or higher) and Hardy–Weinberg equilibrium P < 10−6. In addition, we performed extensive QC using the R package EasyQC (98) for all cohort-specific results. For GWAS results in stage 1, each cohort applied a preliminary filter on their imputed data excluding variants with MAF < 1%. Variants with imputation quality measure of < 0.5 were subsequently excluded. We performed the ‘study-level’ QC, which included carefully checking the observed allele frequencies against the corresponding ancestry-specific 1000 Genomes Project data and harmonizing marker names to ensure consistencies across cohorts. In addition, in stage 1, we compared results from the joint and stratified models, as explained elsewhere (99). To identify cross-study issues, we then performed the ‘meta-level’ QC by checking result files across all cohorts for each analysis. This included visually comparing summary statistics (mean, median, inter-quartile range, etc.) on all effect estimates, SEs and P-values, and examining SE-N (i.e., inverse of the median standard error versus the square root of the sample size) plots and QQ plots to reveal issues with trait transformation (98) or other analytical problems. Encountered QC problems were communicated and resolved with the individual cohorts. More detailed information about QC is described elsewhere (13,16).
Meta-analyses
After selecting high-quality variants through extensive QC, ~18.8 million SNPs and small indels variants were included in the meta-analysis (the number of variants varied across the ancestry groups). To combine cohort-specific results within each ancestry, we first performed ancestry-specific meta-analyses; the results were then combined through meta-analysis to obtain evidence of ‘trans-ancestry’ association. Inverse-variance-weighted meta-analysis with METAL (100) was used for the one DF test of interaction effect (with H0: βGE = 0). For two DF test of both SNP main and interaction effects (with H0: βG = βGE = 0), the joint meta-analysis of Manning et al. (24) was used. In the stratified model, we performed meta-analysis using the approach of Randall et al. (101) for the one DF test and the approach of Aschard et al. (102) for the two DF test using the R package EasyStrata (103). Additional details about the meta-analytic approach are described elsewhere (99).
In stage 1, genomic control correction (104) was applied twice, first for cohort-specific GWAS results if their genomic control lambda value was greater than 1 and again after the meta-analysis. Variants that passed QC were excluded if they were represented in fewer than 5000 samples or fewer than three cohorts. Variants that were genome-wide significant (P < 5 × 10⁻⁸) or suggestive (P < 1 × 10⁻⁶) in stage 1 were pursued in stage 2. Heterogeneity P-values at the selected variants were >1 × 10⁻⁵, indicating limited heterogeneity (data not shown). In stage 2, genomic control correction was not applied to the replication statistics as association analysis was performed only at select variants. Meta-analysis combining results of stages 1 and 2 was also performed. In addition, genome-wide significant variants in stage 1 were tested for formal replication in stage 2 using Bonferroni-corrected significance threshold.
Genome-wide significant variants
We considered a variant with P < 5 × 10⁻⁸ (the standard threshold in the field) to be genome-wide significant. We also identified novel loci that pass a more stringent threshold (P < 6.25 × 10⁻⁹, P < 5 × 10⁻⁸ adjusted for two smoking exposures, two tests and two BP traits, where this correction is somewhat conservative given dependence between the various test statistics). Loci that pass the stricter P-value are indicated in main tables. FDR q-values were computed using the R function p.adjust using the step-up method by Benjamini and Hochberg (105). A new locus was identified if it was 1 Mb away from any previously identified BP locus. A new signal was identified if it is within 1 Mb of known BP loci but not in LD r2 < 0.1 with the known BP loci. Since valid methods do not exist for conditional analysis involving interactions across multi-ancestry studies, we relied on a relatively more stringent LD threshold (r2 < 0.1) for identifying additional signals. For LD reference, ancestry-specific 1000 Genomes Project data (106) were used for ancestry-specific results, and the entire cosmopolitan data set was used for trans-ancestry results.
BP variance explained
We computed BP variance explained by genome-wide results, based on stage 1 stratified results with current-smoking status in European ancestry (25). Within each of the smoking strata, we computed the variance of MAP and PP explained by subsets of variants selected using 15 significance thresholds ranging from 1 × 10⁻⁸ to 0.1
Functional inferences
We conducted DEPICT analyses (107) based on genome-wide significant (P < 5 × 10⁻⁸) variants from the combined analysis of stages 1 and 2. DEPICT performs three consecutive analyses: i) gene prioritization at the identified loci, ii) gene set enrichment analyses and iii) tissue- and cell-type-specific expression analyses. To obtain input for the analyses, DEPICT applied a combined distance and LD-based threshold (500 kb flanking regions and LD r2 > 0.1) between the identified variants and the 1000 Genomes reference data (106). A further clumping (LD r2 > 0.5 between the non-overlapping variants and known functional coding or cis-acting regulatory variants) was used to obtain a list of genes overlapping with the identified variants. The major histocompatibility complex region on chromosome 6 (25—35 Mb) was removed for further analyses.
For gene prioritization, DEPICT compared functional similarity of genes across identified loci using a gene score, which was adjusted for confounders like gene length. To obtain FDR, the scoring was repeated 50× based on 500 pre-compiled null GWAS. For gene-set enrichment analyses, DEPICT used 14 461 pre-compiled reconstituted gene sets; they include 737 Reactome pathways, 2473 phenotypic gene sets (derived from the Mouse Genetics Initiative), 184 Kyoto Encyclopedia of Genes and Genomes pathways, 5083 Gene Ontology terms and 5984 protein molecular pathways (derived from protein–protein interactions). For tissue- and cell-type enrichment analyses, DEPICT used expression data from the 209 MeSH annotations for 37 427 microarrays of the Affymetrix U133 Plus 2.0 Array platform.
Supplementary Material
Acknowledgements
We thank anonymous reviewers for critical reading and providing constructive and insightful comments, which substantially improved the article. This project, like several other projects, was carried out as part of the CHARGE Gene–Lifestyle Interactions Working Group.
Conflict of Interest statement. The authors declare no competing financial interests except for the following: B.M.P. serves on the Data and Safety Monitoring Board of a clinical trial funded by the manufacturer (Zoll LifeCor) and on the Steering Committee of the Yale Open Data Access Project funded by Johnson & Johnson; O.H.F. received grants from Metagenics (on women’s health and epigenetics) and from Nestle (on child health); L.J.B. is listed as an inventor on Issued U.S. Patent 8,080,371,‘Markers for Addiction’ covering the use of certain SNPs in determining the diagnosis, prognosis and treatment of addiction; P.S. has received research awards from Pfizer Inc; J.B.J. is a consultant for Mundipharma Co. (Cambridge, UK), Patent holder with Biocompatibles UK Ltd (Franham, Surrey, UK) (title: treatment of eye diseases using encapsulated cells encoding and secreting neuroprotective factor and/or anti-angiogenic factor; Patent number: 20120263794) and Patent application with University of Heidelberg (Heidelberg, Germany) (title: agents for use in the therapeutic or prophylactic treatment of myopia or hyperopia; Europäische Patentanmeldung 15000771.4); P.W.F. has been a paid consultant for Eli Lilly and Sanofi Aventis and has received research support from several pharmaceutical companies as part of a European Union Innovative Medicines Initiative project; M.A.N.'s participation is supported by a consulting contract between Data Tecnica International and the National Institute on Aging, National Institutes of Health, Bethesda, MD, USA; M.A.N. also consults for Illumina Inc, the Michael J. Fox Foundation and University of California Healthcare among others; and M.J. C. is chief scientist for Genomics England, a UK government company.
Funding
U.S. National Heart, Lung, and Blood Institute (NHLBI) (K25HL121091 to Y.J.S.); National Institutes of Health (R01HL118305).
References
- 1. Newton-Cheh C., Johnson T., Gateva V., Tobin M.D., Bochud M., Coin L., Najjar S.S., Zhao J.H., Heath S.C., Eyheramendy S. et al. (2009) Genome-wide association study identifies eight loci associated with blood pressure. Nat. Genet., 41, 666–676. [DOI] [PMC free article] [PubMed] [Google Scholar]
- 2. Levy D., Ehret G.B., Rice K., Verwoert G.C., Launer L.J., Dehghan A., Glazer N.L., Morrison A.C., Johnson A.D., Aspelund T. et al. (2009) Genome-wide association study of blood pressure and hypertension. Nat. Genet., 41, 677–687. [DOI] [PMC free article] [PubMed] [Google Scholar]
- 3. Ehret G.B., Munroe P.B., Rice K.M., Bochud M., Johnson A.D., Chasman D.I., Smith A.V., Tobin M.D., Verwoert G.C., Hwang S.J. et al. (2011) Genetic variants in novel pathways influence blood pressure and cardiovascular disease risk. Nature, 478, 103–109. [DOI] [PMC free article] [PubMed] [Google Scholar]
- 4. Ehret G.B., Ferreira T., Chasman D.I., Jackson A.U., Schmidt E.M., Johnson T., Thorleifsson G., Luan J., Donnelly L.A., Kanoni S. et al. (2016) The genetics of blood pressure regulation and its target organs from association studies in 342 415 individuals. Nat. Genet., 48, 1171–1184. [DOI] [PMC free article] [PubMed] [Google Scholar]
- 5. Liu C., Kraja A.T., Smith J.A., Brody J.A., Franceschini N., Bis J.C., Rice K., Morrison A.C., Lu Y., Weiss S. et al. (2016) Meta-analysis identifies common and rare variants influencing blood pressure and overlapping with metabolic trait loci. Nat. Genet., 48, 1162–1170. [DOI] [PMC free article] [PubMed] [Google Scholar]
- 6. Surendran P., Drenos F., Young R., Warren H., Cook J.P., Manning A.K., Grarup N., Sim X., Barnes D.R., Witkowska K. et al. (2016) Trans-ancestry meta-analyses identify rare and common variants associated with blood pressure and hypertension. Nat. Genet., 48, 1151–1161. [DOI] [PMC free article] [PubMed] [Google Scholar]
- 7. Hoffmann T.J., Ehret G.B., Nandakumar P., Ranatunga D., Schaefer C., Kwok P.Y., Iribarren C., Chakravarti A. and Risch N. (2016) Genome-wide association analyses using electronic health records identify new loci influencing blood pressure variation. Nat. Genet., 49, 54–64. [DOI] [PMC free article] [PubMed] [Google Scholar]
- 8. Warren H.R., Evangelou E., Cabrera C.P., Gao H., Ren M., Mifsud B., Ntalla I., Surendran P., Liu C., Cook J.P. et al. (2017) Genome-wide association analysis identifies novel blood pressure loci and offers biological insights into cardiovascular risk. Nat. Genet., 49, 403–415. [DOI] [PMC free article] [PubMed] [Google Scholar]
- 9. Evangelou E., Warren H.R., Mosen-Ansorena D., Mifsud B., Pazoki R., Gao H., Ntritsos G., Dimou N., Cabrera C.P., Karaman I. et al. (2018) Genetic analysis of over 1 million people identifies 535 new loci associated with blood pressure traits. Nat. Genet., 50, 1412–1425. [DOI] [PMC free article] [PubMed] [Google Scholar]
- 10. Giri A., Hellwege J.N., Keaton J.M., Park J., Qiu C., Warren H.R., Torstenson E.S., Kovesdy C.P., Sun Y.V., Wilson O.D. et al. (2019) Trans-ethnic association study of blood pressure determinants in over 750 000 individuals. Nat. Genet., 51, 51–62. [DOI] [PMC free article] [PubMed] [Google Scholar]
- 11. Manning A.K., Hivert M.F., Scott R.A., Grimsby J.L., Bouatia-Naji N., Chen H., Rybin D., Liu C.T., Bielak L.F., Prokopenko I. et al. (2012) A genome-wide approach accounting for body mass index identifies genetic variants influencing fasting glycemic traits and insulin resistance. Nat. Genet., 44, 659–669. [DOI] [PMC free article] [PubMed] [Google Scholar]
- 12. Kirk E.P. (2017) Genes, environment, and the heart: putting the pieces together. Circ. Cardiovasc. Genet., 10,–2. [DOI] [PubMed] [Google Scholar]
- 13. Rao D.C., Sung Y.J., Winkler T.W., Schwander K., Borecki I., Cupples L.A., Gauderman W.J., Rice K., Munroe P.B. and Psaty B. (2017) A multi-ancestry study of gene–lifestyle interactions for cardiovascular traits in 610 475 individuals from 124 cohorts: design and rationale. Circ. Cardiovasc. Genet., 10, e001649. [DOI] [PMC free article] [PubMed] [Google Scholar]
- 14. Mann S.J., James G.D., Wang R.S. and Pickering T.G. (1991) Elevation of ambulatory systolic blood pressure in hypertensive smokers. A case–control study. JAMA, 265, 2226–2228. [PubMed] [Google Scholar]
- 15. Primatesta P., Falaschetti E., Gupta S., Marmot M.G. and Poulter N.R. (2001) Association between smoking and blood pressure: evidence from the health survey for England. Hypertension, 37, 187–193. [DOI] [PubMed] [Google Scholar]
- 16. Sung Y.J., Winkler T.W., de Las Fuentes L., Bentley A.R., Brown M.R., Kraja A.T., Schwander K., Ntalla I., Guo X., Franceschini N. et al. (2018) A large-scale multi-ancestry genome-wide study accounting for smoking behavior identifies multiple significant loci for blood pressure. Am. J. Hum. Genet., 102, 375–400. [DOI] [PMC free article] [PubMed] [Google Scholar]
- 17. Franklin S.S., Gustin W.t., Wong N.D., Larson M.G., Weber M.A., Kannel W.B. and Levy D. (1997) Hemodynamic patterns of age-related changes in blood pressure. The Framingham heart study. Circulation, 96, 308–315. [DOI] [PubMed] [Google Scholar]
- 18. Lewington S., Clarke R., Qizilbash N., Peto R., Collins R. and Prospective Studies Collaboration (2002) Age-specific relevance of usual blood pressure to vascular mortality: a meta-analysis of individual data for one million adults in 61 prospective studies. Lancet, 360, 1903–1913. [DOI] [PubMed] [Google Scholar]
- 19. Sesso H.D., Stampfer M.J., Rosner B., Hennekens C.H., Gaziano J.M., Manson J.E. and Glynn R.J. (2000) Systolic and diastolic blood pressure, pulse pressure, and mean arterial pressure as predictors of cardiovascular disease risk in men. Hypertension, 36, 801–807. [DOI] [PubMed] [Google Scholar]
- 20. Dart A.M. and Kingwell B.A. (2001) Pulse pressure—a review of mechanisms and clinical relevance. J. Am. Coll. Cardiol., 37, 975–984. [DOI] [PubMed] [Google Scholar]
- 21. Franklin S.S., Khan S.A., Wong N.D., Larson M.G. and Levy D. (1999) Is pulse pressure useful in predicting risk for coronary heart disease? The Framingham heart study. Circulation, 100, 354–360. [DOI] [PubMed] [Google Scholar]
- 22. Millar J.A., Lever A.F. and Burke V. (1999) Pulse pressure as a risk factor for cardiovascular events in the MRC mild hypertension trial. J. Hypertens., 17, 1065–1072. [DOI] [PubMed] [Google Scholar]
- 23. Whelton P.K., Carey R.M., Aronow W.S., Casey D.E.,.J., Collins K.J., Dennison Himmelfarb C., DePalma S.M., Gidding S., Jamerson K.A., Jones D.W. et al. (2018) 2017 ACC/AHA/AAPA/ABC/ACPM/AGS/APhA/ASH/ASPC/NMA/PCNA guideline for the prevention, detection, evaluation, and management of high blood pressure in adults: a report of the American College of Cardiology/American Heart Association Task Force on Clinical Practice Guidelines. J. Am. Coll. Cardiol., 71, e127–e248. [DOI] [PubMed] [Google Scholar]
- 24. Manning A.K., LaValley M., Liu C.T., Rice K., An P., Liu Y., Miljkovic I., Rasmussen-Torvik L., Harris T.B., Province M.A. et al. (2011) Meta-analysis of gene–environment interaction: joint estimation of SNP and SNP × environment regression coefficients. Genet. Epidemiol., 35, 11–18. [DOI] [PMC free article] [PubMed] [Google Scholar]
- 25. Kutalik Z., Whittaker J., Waterworth D., Consortium G., Beckmann J.S. and Bergmann S. (2011) Novel method to estimate the phenotypic variation explained by genome-wide association studies reveals large fraction of the missing heritability. Genet. Epidemiol., 35, 341–349. [DOI] [PubMed] [Google Scholar]
- 26. Ward L.D. and Kellis M. (2012) HaploReg: a resource for exploring chromatin states, conservation, and regulatory motif alterations within sets of genetically linked variants. Nucleic Acids Res., 40, D930–D934. [DOI] [PMC free article] [PubMed] [Google Scholar]
- 27. Davydov E.V., Goode D.L., Sirota M., Cooper G.M., Sidow A. and Batzoglou S. (2010) Identifying a high fraction of the human genome to be under selective constraint using GERP++. PLoS Comput. Biol., 6, e1001025. [DOI] [PMC free article] [PubMed] [Google Scholar]
- 28. Garber M., Guttman M., Clamp M., Zody M.C., Friedman N. and Xie X. (2009) Identifying novel constrained elements by exploiting biased substitution patterns. Bioinformatics, 25, i54–i62. [DOI] [PMC free article] [PubMed] [Google Scholar]
- 29. Consortium G.T. (2015) Human genomics. The genotype-tissue expression (GTEx) pilot analysis: multitissue gene regulation in humans. Science, 348, 648–660. [DOI] [PMC free article] [PubMed] [Google Scholar]
- 30. Joehanes R., Zhang X., Huan T., Yao C., Ying S.X., Nguyen Q.T., Demirkale C.Y., Feolo M.L., Sharopova N.R., Sturcke A. et al. (2017) Integrated genome-wide analysis of expression quantitative trait loci aids interpretation of genomic association studies. Genome Biol., 18, 16. [DOI] [PMC free article] [PubMed] [Google Scholar]
- 31. di Salvo T.G., Yang K.C., Brittain E., Absi T., Maltais S. and Hemnes A. (2015) Right ventricular myocardial biomarkers in human heart failure. J. Card. Fail., 21, 398–411. [DOI] [PMC free article] [PubMed] [Google Scholar]
- 32. Cingolani O.H., Kirk J.A., Seo K., Koitabashi N., Lee D.I., Ramirez-Correa G., Bedja D., Barth A.S., Moens A.L. and Kass D.A. (2011) Thrombospondin-4 is required for stretch-mediated contractility augmentation in cardiac muscle. Circ. Res., 109, 1410–1414. [DOI] [PMC free article] [PubMed] [Google Scholar]
- 33. Han Y., Chen Y.S., Liu Z., Bodyak N., Rigor D., Bisping E., Pu W.T. and Kang P.M. (2006) Overexpression of HAX-1 protects cardiac myocytes from apoptosis through caspase-9 inhibition. Circ. Res., 99, 415–423. [DOI] [PubMed] [Google Scholar]
- 34. Lee B.Y., Chon J., Kim H.S., Lee J.H., Yun D.H., Yoo S.D., Kim D.H., Lee S.A., Han Y.J., Lee H. et al. (2017) Association between a polymorphism in CASP3 and CASP9 genes and ischemic stroke. Ann. Rehabil. Med., 41, 197–203. [DOI] [PMC free article] [PubMed] [Google Scholar]
- 35. Elliott H.R., Tillin T., McArdle W.L., Ho K., Duggirala A., Frayling T.M., Davey Smith G., Hughes A.D., Chaturvedi N. and Relton C.L. (2014) Differences in smoking associated DNA methylation patterns in South Asians and Europeans. Clin. Epigenetics, 6, 4. [DOI] [PMC free article] [PubMed] [Google Scholar]
- 36. Markunas C.A., Xu Z., Harlid S., Wade P.A., Lie R.T., Taylor J.A. and Wilcox A.J. (2014) Identification of DNA methylation changes in newborns related to maternal smoking during pregnancy. Environ. Health Perspect., 122, 1147–1153. [DOI] [PMC free article] [PubMed] [Google Scholar]
- 37. Begum N., Hockman S. and Manganiello V.C. (2011) Phosphodiesterase 3A (PDE3A) deletion suppresses proliferation of cultured murine vascular smooth muscle cells (VSMCs) via inhibition of mitogen-activated protein kinase (MAPK) signaling and alterations in critical cell cycle regulatory proteins. J. Biol. Chem., 286, 26238–26249. [DOI] [PMC free article] [PubMed] [Google Scholar]
- 38. Maass P.G., Aydin A., Luft F.C., Schachterle C., Weise A., Stricker S., Lindschau C., Vaegler M., Qadri F., Toka H.R. et al. (2015) PDE3A mutations cause autosomal dominant hypertension with brachydactyly. Nat. Genet., 47, 647–653. [DOI] [PubMed] [Google Scholar]
- 39. Toka O., Tank J., Schachterle C., Aydin A., Maass P.G., Elitok S., Bartels-Klein E., Hollfinger I., Lindschau C., Mai K. et al. (2015) Clinical effects of phosphodiesterase 3A mutations in inherited hypertension with brachydactyly. Hypertension, 66, 800–808. [DOI] [PubMed] [Google Scholar]
- 40. Vasan R.S., Glazer N.L., Felix J.F., Lieb W., Wild P.S., Felix S.B., Watzinger N., Larson M.G., Smith N.L., Dehghan A. et al. (2009) Genetic variants associated with cardiac structure and function: a meta-analysis and replication of genome-wide association data. JAMA, 302, 168–178. [DOI] [PMC free article] [PubMed] [Google Scholar]
- 41. Fontana V., McDonough C.W., Gong Y., El Rouby N.M., Sa A.C., Taylor K.D., Chen Y.D., Gums J.G., Chapman A.B., Turner S.T. et al. (2014) Large-scale gene-centric analysis identifies polymorphisms for resistant hypertension. J. Am. Heart Assoc., 3, e001398. [DOI] [PMC free article] [PubMed] [Google Scholar]
- 42. Simino J., Sung Y.J., Kume R., Schwander K. and Rao D.C. (2013) Gene–alcohol interactions identify several novel blood pressure loci including a promising locus near SLC16A9. Front. Genet., 4, 277. [DOI] [PMC free article] [PubMed] [Google Scholar]
- 43. Coan P.M., Hummel O., Garcia Diaz A., Barrier M., Alfazema N., Norsworthy P.J., Pravenec M., Petretto E., Hubner N. and Aitman T.J. (2017) Genetic, physiological and comparative genomic studies of hypertension and insulin resistance in the spontaneously hypertensive rat. Dis. Model. Mech., 10, 297–306. [DOI] [PMC free article] [PubMed] [Google Scholar]
- 44. Hong K.W., Go M.J., Jin H.S., Lim J.E., Lee J.Y., Han B.G., Hwang S.Y., Lee S.H., Park H.K., Cho Y.S. et al. (2010) Genetic variations in ATP2B1, CSK, ARSG and CSMD1 loci are related to blood pressure and/or hypertension in two Korean cohorts. J. Hum. Hypertens., 24, 367–372. [DOI] [PubMed] [Google Scholar]
- 45. Koriyama H., Nakagami H., Katsuya T., Sugimoto K., Yamashita H., Takami Y., Maeda S., Kubo M., Takahashi A., Nakamura Y. et al. (2010) Identification of evidence suggestive of an association with peripheral arterial disease at the OSBPL10 locus by genome-wide investigation in the Japanese population. J. Atheroscler. Thromb., 17, 1054–1062. [DOI] [PubMed] [Google Scholar]
- 46. Liu C.T., Monda K.L., Taylor K.C., Lange L., Demerath E.W., Palmas W., Wojczynski M.K., Ellis J.C., Vitolins M.Z., Liu S. et al. (2013) Genome-wide association of body fat distribution in African ancestry populations suggests new loci. PLoS Genet., 9, e1003681. [DOI] [PMC free article] [PubMed] [Google Scholar]
- 47. Irvin M.R., Wineinger N.E., Rice T.K., Pajewski N.M., Kabagambe E.K., Gu C.C., Pankow J., North K.E., Wilk J.B., Freedman B.I. et al. (2011) Genome-wide detection of allele specific copy number variation associated with insulin resistance in African Americans from the HyperGEN study. PLoS One, 6, e24052. [DOI] [PMC free article] [PubMed] [Google Scholar]
- 48. Uhl G.R., Drgon T., Johnson C., Li C.Y., Contoreggi C., Hess J., Naiman D. and Liu Q.R. (2008) Molecular genetics of addiction and related heritable phenotypes: genome-wide association approaches identify ‘connectivity constellation’ and drug target genes with pleiotropic effects. Ann. N. Y. Acad. Sci., 1141, 318–381. [DOI] [PMC free article] [PubMed] [Google Scholar]
- 49. Moon S.H., Kim Y.J., Kim Y.K., Kim D.J., Lee J.Y., Go M.J., Shin Y.A., Hong C.B. and Kim B.J. (2011) Genome-wide survey of copy number variants associated with blood pressure and body mass index in a Korean population. Genomics Informatics 9, 152–160. [Google Scholar]
- 50. Petrovic S., Barone S., Xu J., Conforti L., Ma L., Kujala M., Kere J. and Soleimani M. (2004) SLC26A7: a basolateral cl-/HCO3- exchanger specific to intercalated cells of the outer medullary collecting duct. Am. J. Physiol. Renal Physiol., 286, F161–F169. [DOI] [PubMed] [Google Scholar]
- 51. Henke N., Schmidt-Ullrich R., Dechend R., Park J.K., Qadri F., Wellner M., Obst M., Gross V., Dietz R., Luft F.C. et al. (2007) Vascular endothelial cell-specific NF-kappaB suppression attenuates hypertension-induced renal damage. Circ. Res., 101, 268–276. [DOI] [PubMed] [Google Scholar]
- 52. Pierce G.L., Lesniewski L.A., Lawson B.R., Beske S.D. and Seals D.R. (2009) Nuclear factor-{kappa}B activation contributes to vascular endothelial dysfunction via oxidative stress in overweight/obese middle-aged and older humans. Circulation, 119, 1284–1292. [DOI] [PMC free article] [PubMed] [Google Scholar]
- 53. Duan P., Wang Z.M., Liu J., Wang L.N., Yang Z. and Tu P. (2015) Association of gene polymorphisms in RANKL/RANK/OPG system with hypertension and blood pressure in Chinese women. J. Hum. Hypertens., 29, 749–753. [DOI] [PubMed] [Google Scholar]
- 54. Woods R.L. and Johnston C.I. (1983) Contribution of vasopressin to the maintenance of blood pressure during dehydration. Am. J. Physiol., 245, F615–F621. [DOI] [PubMed] [Google Scholar]
- 55. Aoyagi T., Izumi Y., Hiroyama M., Matsuzaki T., Yasuoka Y., Sanbe A., Miyazaki H., Fujiwara Y., Nakayama Y., Kohda Y. et al. (2008) Vasopressin regulates the renin-angiotensin-aldosterone system via V1a receptors in macula densa cells. Am. J. Physiol. Renal Physiol., 295, F100–F107. [DOI] [PubMed] [Google Scholar]
- 56. Koshimizu T.A., Nasa Y., Tanoue A., Oikawa R., Kawahara Y., Kiyono Y., Adachi T., Tanaka T., Kuwaki T., Mori T. et al. (2006) V1a vasopressin receptors maintain normal blood pressure by regulating circulating blood volume and baroreflex sensitivity. Proc. Natl. Acad. Sci. U. S. A., 103, 7807–7812. [DOI] [PMC free article] [PubMed] [Google Scholar]
- 57. Burrell L.M., Phillips P.A., Risvanis J., Aldred K.L., Hutchins A.M. and Johnston C.I. (1995) Attenuation of genetic hypertension after short-term vasopressin V1A receptor antagonism. Hypertension, 26, 828–834. [DOI] [PubMed] [Google Scholar]
- 58. Ronzaud C., Loffing-Cueni D., Hausel P., Debonneville A., Malsure S.R., Fowler-Jaeger N., Boase N.A., Perrier R., Maillard M., Yang B. et al. (2013) Renal tubular NEDD4-2 deficiency causes NCC-mediated salt-dependent hypertension. J. Clin. Invest., 123, 657–665. [DOI] [PMC free article] [PubMed] [Google Scholar]
- 59. Debonneville C., Flores S.Y., Kamynina E., Plant P.J., Tauxe C., Thomas M.A., Munster C., Chraibi A., Pratt J.H., Horisberger J.D. et al. (2001) Phosphorylation of Nedd4-2 by Sgk1 regulates epithelial Na(+) channel cell surface expression. EMBO J., 20, 7052–7059. [DOI] [PMC free article] [PubMed] [Google Scholar]
- 60. Zheng X., Morrison A.C., Feingold E., Turner S.T. and Ferrell R.E. (2011) Association between NEDD4L gene and sodium lithium countertransport. Am. J. Hypertens., 24, 145–148. [DOI] [PubMed] [Google Scholar]
- 61. Luo F., Wang Y., Wang X., Sun K., Zhou X. and Hui R. (2009) A functional variant of NEDD4L is associated with hypertension, antihypertensive response, and orthostatic hypotension. Hypertension, 54, 796–801. [DOI] [PubMed] [Google Scholar]
- 62. Svensson-Farbom P., Wahlstrand B., Almgren P., Dahlberg J., Fava C., Kjeldsen S., Hedner T. and Melander O. (2011) A functional variant of the NEDD4L gene is associated with beneficial treatment response with beta-blockers and diuretics in hypertensive patients. J. Hypertens., 29, 388–395. [DOI] [PubMed] [Google Scholar]
- 63. McDonough C.W., Burbage S.E., Duarte J.D., Gong Y., Langaee T.Y., Turner S.T., Gums J.G., Chapman A.B., Bailey K.R., Beitelshees A.L. et al. (2013) Association of variants in NEDD4L with blood pressure response and adverse cardiovascular outcomes in hypertensive patients treated with thiazide diuretics. J. Hypertens., 31, 698–704. [DOI] [PMC free article] [PubMed] [Google Scholar]
- 64. Goldberg L.I. (1972) Cardiovascular and renal actions of dopamine: potential clinical applications. Pharmacol. Rev., 24,–29. [PubMed] [Google Scholar]
- 65. Li X.X., Bek M., Asico L.D., Yang Z., Grandy D.K., Goldstein D.S., Rubinstein M., Eisner G.M. and Jose P.A. (2001) Adrenergic and endothelin B receptor-dependent hypertension in dopamine receptor type-2 knockout mice. Hypertension, 38, 303–308. [DOI] [PubMed] [Google Scholar]
- 66. Armando I., Wang X., Villar V.A., Jones J.E., Asico L.D., Escano C. and Jose P.A. (2007) Reactive oxygen species-dependent hypertension in dopamine D2 receptor-deficient mice. Hypertension, 49, 672–678. [DOI] [PubMed] [Google Scholar]
- 67. Zhang Y., Jiang X., Qin C., Cuevas S., Jose P.A. and Armando I. (2016) Dopamine D2 receptors’ effects on renal inflammation are mediated by regulation of PP2A function. Am. J. Physiol. Renal Physiol., 310, F128–F134. [DOI] [PMC free article] [PubMed] [Google Scholar]
- 68. Yang Y., Cuevas S., Yang S., Villar V.A., Escano C., Asico L., Yu P., Jiang X., Weinman E.J., Armando I. et al. (2014) Sestrin2 decreases renal oxidative stress, lowers blood pressure, and mediates dopamine D2 receptor-induced inhibition of reactive oxygen species production. Hypertension, 64, 825–832. [DOI] [PMC free article] [PubMed] [Google Scholar]
- 69. Yi L., Li F., Yong Y., Jianting D., Liting Z., Xuansheng H., Fei L. and Jiewen L. (2014) Upregulation of sestrin-2 expression protects against endothelial toxicity of angiotensin II. Cell Biol. Toxicol., 30, 147–156. [DOI] [PMC free article] [PubMed] [Google Scholar]
- 70. Paisan-Ruiz C., Guevara R., Federoff M., Hanagasi H., Sina F., Elahi E., Schneider S.A., Schwingenschuh P., Bajaj N., Emre M. et al. (2010) Early-onset L-dopa-responsive parkinsonism with pyramidal signs due to ATP13A2, PLA2G6, FBXO7 and spatacsin mutations. Mov. Disord., 25, 1791–1800. [DOI] [PMC free article] [PubMed] [Google Scholar]
- 71. Ouimet C.C., Hemmings H.C., Jr. and Greengard P. (1989) ARPP-21, a cyclic AMP-regulated phosphoprotein enriched in dopamine-innervated brain regions. II. Immunocytochemical localization in rat brain. J. Neurosci., 9, 865–875. [DOI] [PMC free article] [PubMed] [Google Scholar]
- 72. Pierce R.C. and Kumaresan V. (2006) The mesolimbic dopamine system: the final common pathway for the reinforcing effect of drugs of abuse? Neurosci. Biobehav. Rev., 30, 215–238. [DOI] [PubMed] [Google Scholar]
- 73. King K.S. and Pacak K. (2014) Familial pheochromocytomas and paragangliomas. Mol. Cell. Endocrinol., 386, 92–100. [DOI] [PMC free article] [PubMed] [Google Scholar]
- 74. Hes F.J., Weiss M.M., Woortman S.A., de Miranda N.F., van Bunderen P.A., Bonsing B.A., Stokkel M.P., Morreau H., Romijn J.A., Jansen J.C. et al. (2010) Low penetrance of a SDHB mutation in a large Dutch paraganglioma family. BMC Med. Genet., 11, 92. [DOI] [PMC free article] [PubMed] [Google Scholar]
- 75. Parmar P.G., Taal H.R., Timpson N.J., Thiering E., Lehtimaki T., Marinelli M., Lind P.A., Howe L.D., Verwoert G., Aalto V. et al. (2016) International genome-wide association study consortium identifies novel loci associated with blood pressure in children and adolescents. Circ. Cardiovasc. Genet., 9, 266–278. [DOI] [PMC free article] [PubMed] [Google Scholar]
- 76. Luecke S., Backlund M., Jux B., Esser C., Krutmann J. and Rannug A. (2010) The aryl hydrocarbon receptor (AHR), a novel regulator of human melanogenesis. Pigment Cell Melanoma Res., 23, 828–833. [DOI] [PubMed] [Google Scholar]
- 77. Wang L., Chu A., Buring J.E., Ridker P.M., Chasman D.I. and Sesso H.D. (2014) Common genetic variations in the vitamin D pathway in relation to blood pressure. Am. J. Hypertens., 27, 1387–1395. [DOI] [PMC free article] [PubMed] [Google Scholar]
- 78. Blacher J., Staessen J.A., Girerd X., Gasowski J., Thijs L., Liu L., Wang J.G., Fagard R.H. and Safar M.E. (2000) Pulse pressure not mean pressure determines cardiovascular risk in older hypertensive patients. Arch. Intern. Med., 160, 1085–1089. [DOI] [PubMed] [Google Scholar]
- 79. Gasowski J., Fagard R.H., Staessen J.A., Grodzicki T., Pocock S., Boutitie F., Gueyffier F., Boissel J.P. and Collaborators I.P. (2002) Pulsatile blood pressure component as predictor of mortality in hypertension: a meta-analysis of clinical trial control groups. J. Hypertens., 20, 145–151. [DOI] [PubMed] [Google Scholar]
- 80. Gambier N., Marteau J.B., Batt A.M., Marie B., Thompson A., Siest G., Foernzler D. and Visvikis-Siest S. (2006) Interaction between CYP1A1 T3801C and AHR G1661A polymorphisms according to smoking status on blood pressure in the Stanislas cohort. J. Hypertens., 24, 2199–2205. [DOI] [PubMed] [Google Scholar]
- 81. Lund A.K., Goens M.B., Nunez B.A. and Walker M.K. (2006) Characterizing the role of endothelin-1 in the progression of cardiac hypertrophy in aryl hydrocarbon receptor (AhR) null mice. Toxicol. Appl. Pharmacol., 212, 127–135. [DOI] [PubMed] [Google Scholar]
- 82. Niermann T., Schmutz S., Erne P. and Resink T. (2003) Aryl hydrocarbon receptor ligands repress T-cadherin expression in vascular smooth muscle cells. Biochem. Biophys. Res. Commun., 300, 943–949. [DOI] [PubMed] [Google Scholar]
- 83. Kuzmenko Y.S., Kern F., Bochkov V.N., Tkachuk V.A. and Resink T.J. (1998) Density- and proliferation status-dependent expression of T-cadherin, a novel lipoprotein-binding glycoprotein: a function in negative regulation of smooth muscle cell growth? FEBS Lett., 434, 183–187. [DOI] [PubMed] [Google Scholar]
- 84. Org E., Eyheramendy S., Juhanson P., Gieger C., Lichtner P., Klopp N., Veldre G., Doring A., Viigimaa M., Sober S. et al. (2009) Genome-wide scan identifies CDH13 as a novel susceptibility locus contributing to blood pressure determination in two European populations. Hum. Mol. Genet., 18, 2288–2296. [DOI] [PMC free article] [PubMed] [Google Scholar]
- 85. Nguyen L.P. and Bradfield C.A. (2008) The search for endogenous activators of the aryl hydrocarbon receptor. Chem. Res. Toxicol., 21, 102–116. [DOI] [PMC free article] [PubMed] [Google Scholar]
- 86. Martey C.A., Baglole C.J., Gasiewicz T.A., Sime P.J. and Phipps R.P. (2005) The aryl hydrocarbon receptor is a regulator of cigarette smoke induction of the cyclooxygenase and prostaglandin pathways in human lung fibroblasts. Am. J. Physiol. Lung Cell. Mol. Physiol., 289, L391–L399. [DOI] [PubMed] [Google Scholar]
- 87. Blacher J. and Safar M.E. (2005) Large-artery stiffness, hypertension and cardiovascular risk in older patients. Nat. Clin. Pract. Cardiovasc. Med., 2, 450–455. [DOI] [PubMed] [Google Scholar]
- 88. Zollner S. and Pritchard J.K. (2007) Overcoming the winner's curse: estimating penetrance parameters from case-control data. Am. J. Hum. Genet., 80, 605–615. [DOI] [PMC free article] [PubMed] [Google Scholar]
- 89. Bentley A.R., Sung Y.J., Brown M.R., Winkler T.W., Kraja A.T., Ntalla I., Schwander K., Chasman D.I., Lim E., Deng E. et al. (2019) Multi-ancestry genome-wide gene-smoking interaction study of 387,272 individuals identifies new loci associated with serum lipids.. Nature genetics, 51, 636–648. [DOI] [PMC free article] [PubMed] [Google Scholar]
- 90. Keller M.C. (2014) Gene × environment interaction studies have not properly controlled for potential confounders: the problem and the (simple) solution. Biol. Psychiatry, 75, 18–24. [DOI] [PMC free article] [PubMed] [Google Scholar]
- 91. Tyrrell J., Wood A.R., Ames R.M., Yaghootkar H., Beaumont R.N., Jones S.E., Tuke M.A., Ruth K.S., Freathy R.M., Davey Smith G. et al. (2017) Gene-obesogenic environment interactions in the UK biobank study. Int. J. Epidemiol., 46, 559–575. [DOI] [PMC free article] [PubMed] [Google Scholar]
- 92. 1000 Genomes Project Consortium, Abecasis G.R., Auton A., Brooks L.D., DePristo M.A., Durbin R.M., Handsaker R.E., Kang H.M., Marth G.T. and McVean G.A. (2012) An integrated map of genetic variation from 1092 human genomes. Nature, 491, 56–65. [DOI] [PMC free article] [PubMed] [Google Scholar]
- 93. Kraft P., Yen Y.C., Stram D.O., Morrison J. and Gauderman W.J. (2007) Exploiting gene–environment interaction to detect genetic associations. Hum. Hered., 63, 111–119. [DOI] [PubMed] [Google Scholar]
- 94. Zeileis A. (2006) Object-oriented computation of sandwich estimators. J. Stat. Softw., 16,–16. [Google Scholar]
- 95. Aulchenko Y.S., Struchalin M.V. and van Duijn C.M. (2010) ProbABEL package for genome-wide association analysis of imputed data. BMC Bioinformatics, 11, 134. [DOI] [PMC free article] [PubMed] [Google Scholar]
- 96. Tchetgen Tchetgen E.J. and Kraft P. (2011) On the robustness of tests of genetic associations incorporating gene–environment interaction when the environmental exposure is misspecified. Epidemiology, 22, 257–261. [DOI] [PMC free article] [PubMed] [Google Scholar]
- 97. Voorman A., Lumley T., McKnight B. and Rice K. (2011) Behavior of QQ-plots and genomic control in studies of gene–environment interaction. PLoS One, 6, e19416. [DOI] [PMC free article] [PubMed] [Google Scholar]
- 98. Winkler T.W., Day F.R., Croteau-Chonka D.C., Wood A.R., Locke A.E., Magi R., Ferreira T., Fall T., Graff M., Justice A.E. et al. (2014) Quality control and conduct of genome-wide association meta-analyses. Nat. Protoc., 9, 1192–1212. [DOI] [PMC free article] [PubMed] [Google Scholar]
- 99. Sung Y.J., Winkler T.W., Manning A.K., Aschard H., Gudnason V., Harris T.B., Smith A.V., Boerwinkle E., Brown M.R., Morrison A.C. et al. (2016) An empirical comparison of joint and stratified frameworks for studying G × E interactions: systolic blood pressure and smoking in the CHARGE gene–lifestyle interactions working group. Genet. Epidemiol., 40, 404–415. [DOI] [PMC free article] [PubMed] [Google Scholar]
- 100. Willer C.J., Li Y. and Abecasis G.R. (2010) METAL: fast and efficient meta-analysis of genomewide association scans. Bioinformatics, 26, 2190–2191. [DOI] [PMC free article] [PubMed] [Google Scholar]
- 101. Randall J.C., Winkler T.W., Kutalik Z., Berndt S.I., Jackson A.U., Monda K.L., Kilpelainen T.O., Esko T., Magi R., Li S. et al. (2013) Sex-stratified genome-wide association studies including 270 000 individuals show sexual dimorphism in genetic loci for anthropometric traits. PLoS Genet., 9, e1003500. [DOI] [PMC free article] [PubMed] [Google Scholar]
- 102. Aschard H., Hancock D.B., London S.J. and Kraft P. (2010) Genome-wide meta-analysis of joint tests for genetic and gene–environment interaction effects. Hum. Hered., 70, 292–300. [DOI] [PMC free article] [PubMed] [Google Scholar]
- 103. Winkler T.W., Kutalik Z., Gorski M., Lottaz C., Kronenberg F. and Heid I.M. (2015) EasyStrata: evaluation and visualization of stratified genome-wide association meta-analysis data. Bioinformatics, 31, 259–261. [DOI] [PMC free article] [PubMed] [Google Scholar]
- 104. Devlin B. and Roeder K. (1999) Genomic control for association studies. Biometrics, 55, 997–1004. [DOI] [PubMed] [Google Scholar]
- 105. Benjamini Y. and Hochberg Y. (1995) Controlling the false discovery rate—a practical and powerful approach to multiple testing. J. R. Stat. Soc. Series B Stat. Methodol., 57, 289–300. [Google Scholar]
- 106. Genomes Project C., Abecasis G.R., Altshuler D., Auton A., Brooks L.D., Durbin R.M., Gibbs R.A., Hurles M.E. and McVean G.A. (2010) A map of human genome variation from population-scale sequencing. Nature, 467, 1061–1073. [DOI] [PMC free article] [PubMed] [Google Scholar]
- 107. Pers T.H., Karjalainen J.M., Chan Y., Westra H.-J., Wood A.R., Yang J., Lui J.C., Vedantam S., Gustafsson S., Esko T. et al. (2015) Biological interpretation of genome-wide association studies using predicted gene functions. Nat. Commun., 6, 5890–5890. [DOI] [PMC free article] [PubMed] [Google Scholar]
Associated Data
This section collects any data citations, data availability statements, or supplementary materials included in this article.