

Abstract
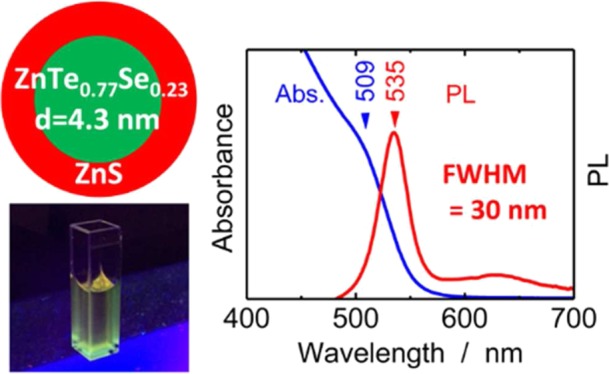
Colloidal CdSe quantum dot (QD) phosphors have attracted considerable attention as green and red phosphors for blue backlight downconversion in next-generation liquid-crystal displays because of their excellent emission features including tunable emission wavelength and narrow emission bands. Alternatives to CdSe, which do not contain toxic cadmium, are strongly desired to ensure safety and reduce the environmental load of consumer products. Herein, we synthesized colloidal Zn(Te,Se)/ZnS core/shell QDs and demonstrated narrow-band green photoluminescence (PL) emission. A full width at half-maximum of 30 nm was achieved for PL emission at 535 nm from Zn(Te0.77Se0.23)/ZnS core/shell QDs with a core QD diameter of 4.3 nm. This emission characteristic was as good as that of CdSe QDs.
1. Introduction
Colloidal semiconductor quantum dots (QDs) exhibit excellent luminescence properties, such as narrow emission bands arising from exciton recombination and controllable emission energy owing to quantum size effects.1 Because of these features, QDs are expected to have applications in various light-emitting devices, such as light-emitting diodes (LEDs)2,3 and electroluminescent devices.4,5 Although light-emitting devices based on QDs are still under development, QDs are currently being used as phosphors for blue LED backlight downconversion in commercial liquid-crystal displays (QD-LCDs).6−8 Because the QD phosphors enable the realization of a wide color range and excellent energy efficiency, they are suitable to the next-generation displays, responding to the switching from full-high-definition to ultrahigh-definition television broadcasts. In current QD-LCDs, colloidal CdSe QDs are used as green and red phosphors because of their narrow-band emission. The full width at half-maximum (fwhm) of their emission bands is typically less than 40 nm, and high quantum efficiencies (photoluminescence quantum yield, PLQY) are achievable (>85%).6,9,10 However, cadmium is a toxic element and its use is highly restricted to <100 ppm Cd in products sold in many countries, based on laws such as the RoHS directive in countries of the European Union.11 Cadmium-free QD phosphors, which exhibit green and red emission, are highly desirable for ensuring the safety of QD-LCD consumer products. InP QDs are a promising alternative to CdSe QDs; however, InP QDs have not yet managed to replace CdSe QDs because their PLQY and emission bandwidth remain unsuitable for practical applications.9 CuInS2-based QDs have also emerged as nontoxic alternatives.12−14 The II–VI-based chalcogenides are easier to synthesize than III–V pnictides because the source materials of group VI elements are more stable and easier to handle than those of group V elements and high PLQYs have been achieved.14 However, broadband emission (fwhm = 80–120 nm) of CuInS2-based QDs, arising from the electron–phonon interaction of the electron–hole pair recombination via defect levels, is a serious disadvantage for display applications.15,16
ZnTe, which exhibits the smallest band gap (2.25 eV) among cadmium-free and II–VI binary semiconductors, is not applicable as a green QD phosphor because its band gap is too large. A method to form ZnTe/ZnSe core/shell QDs was previously reported in order to realize green and red emissions from ZnTe-based QDs. Because ZnTe and ZnSe form type-II quantum well structure, the effective optical gap of the ZnTe/ZnSe core/shell QDs is smaller than that of both ZnTe core and ZnSe shell. As a result, ZnTe/ZnSe core/shell QDs exhibit visible emission ranging from red to blue dependent on the thickness of the ZnSe shell. Bang et al. reported visible emission ranging from blue to red of ZnTe/ZnSe core/shell QDs with 30–50 nm of fwhm and 2–6% of PLQY,17 and Fairclough et al. also reported on the ZnTe/ZnSe core/shell QDs that exhibit visible emission ranging from blue to green with ∼30 nm of fwhm and 12% of PLQY.18 Because the electron and hole in the type-II core/shell QDs are spatially separated, the photoluminescence (PL) lifetime of type-II core/shell QDs is longer than that of the conventional type-I core/shell QDs, in which both the electron and hole are confined in the core region.17,18 This feature of type-II core/shell QDs is favorable for the photovoltaic application because the electron–hole pair recombination can be avoidable but is generally not suitable to light emission device applications required for fast response and bright emission.
Recently, we have theoretically proposed another approach to realize green and red emissions of ZnTe-based QDs.19 In that approach, the optical gap of ZnTe QDs is tuned at the smaller energy range by alloying with ZnSe or ZnS. The energy band gap of an alloyed semiconductor is generally adjusted at approximately a mole fraction weighted mean of the energy band gaps of the constituent unalloyed materials; however, in Zn(Te,Se) and Zn(Te,S) alloys, the energy band gap of the alloys deviates downward considerably from the mole fraction weighted mean and exhibits a much smaller energy band gap than that of ZnTe. In particular, while the energy band gaps of ZnTe, ZnSe, and ZnS are, respectively, 2.25, 2.72, and 3.83 eV, the minimum energy band gaps of the Zn(Te,Se) and Zn(Te,S) alloys are reported to be 2.03 eV at Zn(Te0.63Se0.37)20 and 1.90 eV at Zn(Te0.68S0.32), respectively.21 While the colloidal Zn(Te,S) alloy QDs have not been reported so far, colloidal Zn(Te,Se) alloy QDs have been synthesized and their optical properties have been reported by some groups. However, green emission from Zn(Te,Se) alloy QDs has received less attention because the previous studies focused on a narrow composition range in Se-rich side in order to realize blue emission,22,23 although the smallest band gap in the Zn(Te,Se) alloys appears in Te-rich compositions.24−26 Very recently, our group experimentally demonstrated that Zn(Te1–xSex) QDs with diameters of 3.5–5 nm and x ≈ 0.35 are promising as green QD phosphors;27 however, green PL emission from Zn(Te,Se) alloy QDs has yet to be achieved.
Here, we report green PL emission from Zn(Te,Se)/ZnS core/shell QDs with a type-I quantum well structure.28 Fwhm was 30 nm for PL emission at 535 nm from Zn(Te0.77Se0.23)/ZnS core/shell QDs with a mean core QD diameter of 4.3 nm. This emission characteristic is as good as that of CdSe QDs. Our study demonstrates great potential for replacing CdSe-based green QD phosphors in QD-LCDs.
2. Results and Discussion
2.1. Synthesis of Zn(Te1–xSex)/ZnS Core/Shell QDs
Figure 1a,b shows powder X-ray diffraction (XRD) profiles of the Zn(Te1–xSex) QDs before and after ZnS shell formation. For the Zn(Te1–xSex) QDs before ZnS shell formation (blue lines), all the diffraction peaks observed were identified as those from the zinc blende structure, and no impurity phase formation was observed. The diffraction peaks were considerably broadened because of the small crystallite size. After ZnS shell formation (red lines), no ZnS phase was detected, indicating that ZnS did not precipitate separately during ZnS shell formation. The results of inductively coupled plasma atomic emission spectroscopy (ICP–AES) analyses of typical Zn(Te1–xSex) QDs before and after ZnS shell formation (Table 1) clearly indicate that a decent amount of sulfur was contained in the QDs after ZnS shell formation. In the optical absorption spectra of the Zn(Te0.77Se0.23) QDs before and after ZnS shell formation (Figure 2), the absorption shoulder corresponding to the optical gap of the QDs exhibited a slight red shift after the ZnS shell formation. This effect is commonly observed in core/shell QDs and suggests successful ZnS shell formation owing to the leakage of electron and hole wave functions from the QD core into the shell.10,29 These XRD, ICP–AES, and optical absorption results strongly suggest that ZnS was precipitated only on the surfaces of the Zn(Te1–xSex) QDs and that Zn(Te1–xSex)/ZnS core/shell QDs were successfully obtained. The thickness of the ZnS shell estimated based on ICP–AES was approximately 0.2 nm (Table 1).
Figure 1.
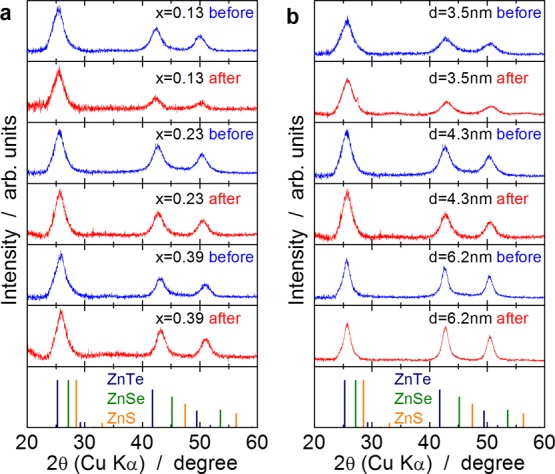
Powder XRD profiles of Zn(Te1–xSex) QDs before and after ZnS shell formation. (a) Zn(Te1–xSex) QDs with diameters of 4.3 ± 0.1 nm. (b) Zn(Te1–xSex) QDs with x = 0.23–0.26 having various diameters. Dark blue, green, and orange bars in the bottom panel, respectively, indicate diffraction peaks of bulk zinc blende-type ZnTe, ZnSe, and ZnS.
Table 1. Composition of Zn(Te,Se) QDs before and after ZnS Shell Formation Determined by ICP–AES and Thickness of ZnS Shell Estimated Assuming That Zn(Te,Se) QDs Are Spherical, Their Diameters Do Not Change before and after ZnS Shell Formation and ZnS Deposited on Zn(Te,Se) QDs Homogeneously.
Figure 2.
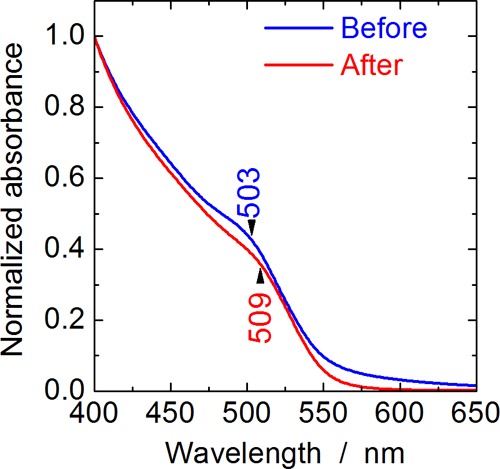
Optical absorption spectra of Zn(Te0.77Se0.23) QDs before and after ZnS shell formation.
Figure 3 shows the X-ray photoelectron spectroscopy (XPS) spectra of shallow core levels and Se 3p and S 2p regions of Zn(Te1–xSex) QDs before and after ZnS shell formation. In the shallow core-level spectra of Zn(Te0.73Se0.27) QDs with a diameter of 3.8 nm (Figure 3a), while the signals attributed to Zn, Te, and Se are clearly observed in the spectrum of the QDs before ZnS shell formation, the relative intensities of the signals attributed to Te and Se after ZnS shell formation are reduced as compared to the signal attributed to Zn. Because the XPS signals are surface-sensitive, this observation indicated that the concentrations of Te and Se surfaces were reduced after ZnS shell formation. In the spectra of Se 3p and S 2p regions (Figure 3b), while Se 3p signals that are split by the spin–orbit coupling were clearly seen in the spectrum before ZnS shell formation, only a S 2p signal appeared after ZnS shell formation, indicating that the surfaces of the QDs were covered by ZnS similar to the previous studies on the formation of a ZnS shell on ZnSe QDs.30,31 In the spectra of Zn(Te0.77Se0.23) QDs with a diameter of 6.6 nm (Figure 3c,d), there was a similar spectral change in the shallow core level and Se 3p and S 2p regions; therefore, we safely concluded that the ZnS shell was formed on Zn(Te1–xSex) QDs and that Zn(Te1–xSex)/ZnS core/shell QDs were successfully obtained.
Figure 3.
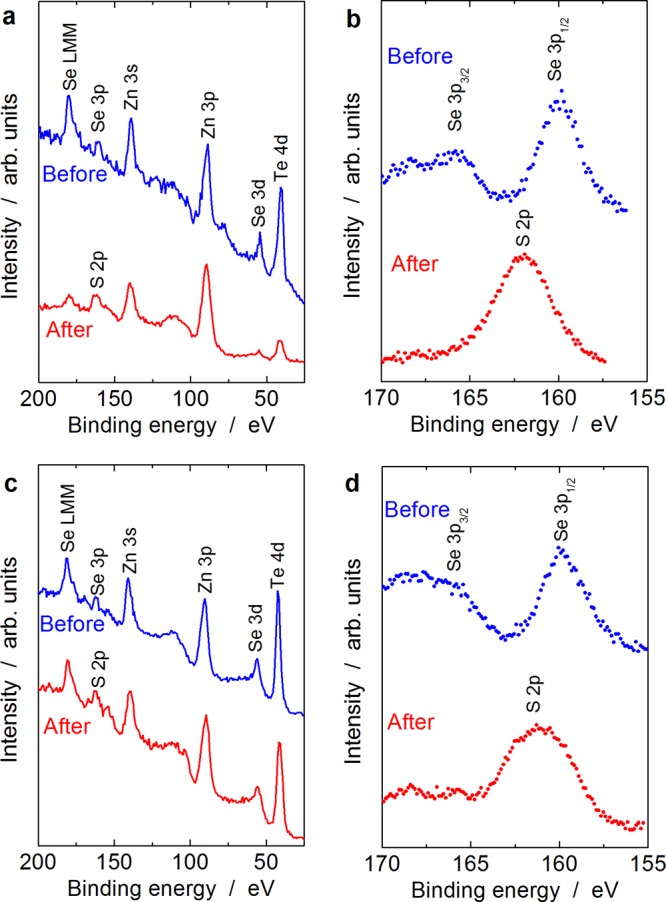
XPS spectra of shallow core levels and Se 3p and S 2p regions of (Te1–xSex) QDs before and after ZnS shell formation. (a,b) Zn(Te0.73Se0.27) with a diameter of 3.8 nm and (c,d) Zn(Te0.77Se0.23) with a diameter of 6.6 nm.
Figure 4 shows high-resolution transmission electron microscopy (HRTEM) images of the QDs before and after ZnS shell formation: Zn(Te0.77Se0.23) with a diameter of 3.5 nm (Figure 4a), Zn(Te0.77Se0.23) with a diameter of 4.3 nm (Figure 4b), and Zn(Te0.74Se0.26) with a diameter of 6.2 nm (Figure 4c). The small QDs were almost spherical (Figure 4a), but larger QDs exhibited slightly faceted surfaces (Figure 4c). The particle size distributions determined from those images indicated that the average diameter increased by 0.1–0.6 nm by the ZnS shell formation. Hence, the shell thickness was 0.05–0.3 nm that is consistent with that estimated from chemical analysis (Table 1).
Figure 4.
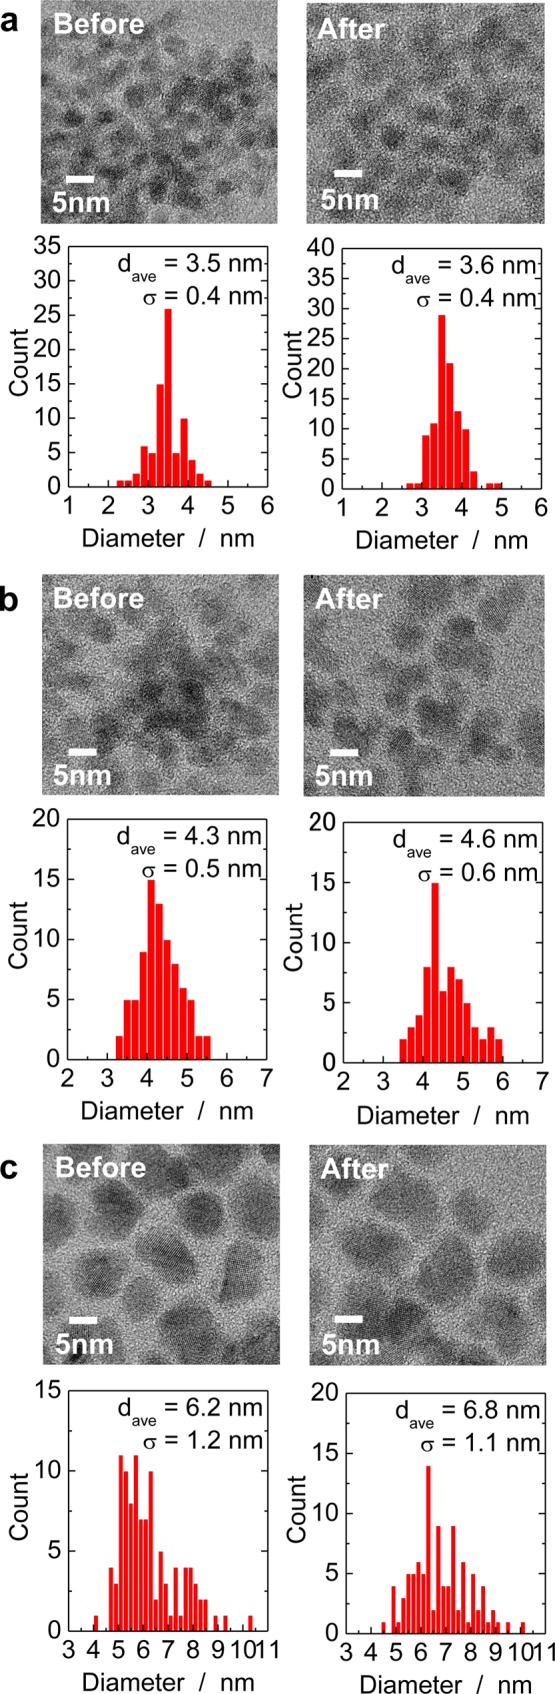
HRTEM images and particle size distributions of Zn(Te1–xSex) QDs before and after ZnS shell formation (dave and σ denote mean diameter and its standard deviation, respectively). (a) Zn(Te0.77Se0.23) with a diameter of 3.5 nm, (b) Zn(Te0.77Se0.23) with a diameter of 4.3 nm, and (c) Zn(Te0.74Se0.26) with a diameter of 6.2 nm.
2.2. Optical Properties of Zn(Te1–xSex)/ZnS Core/Shell QDs
Figure 5a shows optical absorption (blue lines) and PL spectra (red lines) of Zn(Te1–xSex)/ZnS core/shell QDs with x = 0.13, 0.23, and 0.39 and core diameters of 4.3 ± 0.1 nm. The absorption shoulder indicated by a black triangle corresponds to the first exciton peak, that is, the optical gap of the QDs. This peak shifted to longer wavelengths as the Se concentration in the core QDs x was increased. The optical gaps of the alloyed QDs covered wavelengths from 521 to 502 nm, which is slightly shorter than the green wavelength range recommended in BT.2020.32 By varying the size of the core Zn(Te0.77Se0.23) from 3.5 to 6.2 nm in Zn(Te0.77Se0.23)/ZnS QDs, the optical gap was controlled from the wavelengths of 493 to 540 nm (Figure 5c) owing to quantum size effects. Although weak and broad and defect-related PL emission at >600 nm appeared in some QDs, the Zn(Te1–xSex)/ZnS core/shell QDs exhibited narrow PL emission bands (red lines in Figure 5a,c) at wavelengths just longer than that of the absorption shoulder. A small Stokes shift of approximately 110 meV was observed for the QDs with core diameters of 4.3 ± 0.1 nm (Figure 5b) and 78–135 meV for Zn(Te0.77Se0.23)/ZnS QDs with core diameters of 3.5–6.2 nm (Figure 5d). Furthermore, the small fwhms of the PL emissions ranged from 30 to 37 nm (Table 2), which suggested that the emission arose from electron–hole pair recombination, not involving deep defect levels, that is, exciton recombination in Zn(Te,Se) core QDs. Although the PLQYs of the materials were less than 1% at present, it should be noted that the excellent narrow-band emission exhibited was as good as that of CdSe QDs.6,9,10 Hence, the green emission of the present QDs, as observed in Figure 5e, is promising for realizing a wide color range in QD-LCDs that are free from toxic cadmium.
Figure 5.
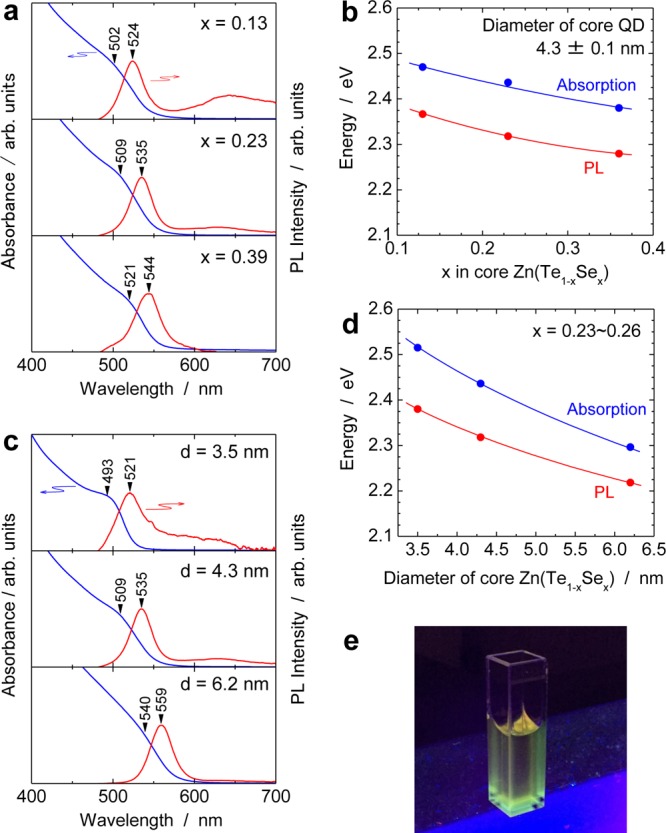
Optical absorption and PL spectra of Zn(Te1–xSex) QDs/ZnS core/shell QDs. (a,b) Composition dependence of optical absorption (blue lines) and PL (red lines) of Zn(Te1–xSex)/ZnS core/shell QDs. The mean diameter of core Zn(Te1–xSex) d is 4.3 ± 0.1 nm. (c,d) Size dependence of optical absorption and PL of Zn(Te1–xSex)/ZnS core/shell QDs with d = 3.5 (x = 0.23), 4.3 (x = 0.23), and 6.2 (x = 0.26) nm. Excitation wavelength for all PL spectra was 473 nm. (e) Digital photograph of PL of Zn(Te0.77Se0.23)/ZnS core/shell QDs under UV light illumination of 365 nm.
Table 2. Optical Properties of Colloidal Zn(Te1–xSex)/ZnS Core/Shell QDs.
| x | diameter of core Zn(Te1–xSex)/nm | optical gap/nm | PL emission peak/nm | PL fwhm/nm | Stokes shift/meV |
|---|---|---|---|---|---|
| 0.13 | 4.2 | 502 | 524 | 30 | 104 |
| 0.23 | 4.3 | 509 | 535 | 30 | 118 |
| 0.23 | 6.2 | 540 | 559 | 31 | 78 |
| 0.26 | 3.5 | 493 | 521 | 35 | 135 |
| 0.39 | 4.4 | 521 | 544 | 37 | 101 |
On the basis of the ICP–AES and HRTEM observation, the average ZnS shell thickness is approximately 0.2 nm, corresponding to almost 0.5 monolayers. According to a previous study on CdSe/ZnS core/shell QDs, 0.5 monolayers of a ZnS shell can reasonably passivate surface states and increase the PLQY up to several tens of percent.29 Because the Zn(Te,Se) QDs before ZnS shell formation, that is, the bare Zn(Te,Se) QDs, did not exhibit PL emission as previously reported,27 the ZnS shell likely passivated some surface states that behaved as nonradiative recombination centers; however, the PLQYs of the present core/shell QDs were less than 1%. The ZnS shell did not fully passivate the surface states of the core Zn(Te,Se) QDs for the following reasons: first, the ZnS shell did not completely and homogeneously cover the core Zn(Te,Se) surfaces because the shell thickness is too small. Owing to the large lattice mismatch between the Zn(Te1–xSex) core and the ZnS shell, in the range between 11% for x = 0.13 and 9% for x = 0.39, the ZnS shell formation on the Zn(Te1–xSex) surfaces likely developed through island growth. Considering the very thin average shell thickness of 0.2 nm, the island growth likely resulted in partial coverage of the core surfaces. Even when the ZnS shell covered the whole Zn(Te,Se) core surface, the grain boundaries of the ZnS shell crystals likely acted as nonradiative recombination centers. Second, partial oxidation of the core Zn(Te,Se) surfaces generated interfacial states between the Zn(Te,Se) and the oxidized regions, and the interfacial states behaved as nonradiative recombination centers. In the present shell formation, the core Zn(Te,Se) QDs were once extracted from solution and were then distributed in organic solvent again. Because ZnTe is easily oxidized,33 partial oxidation of the core Zn(Te,Se) surfaces likely occurred before ZnS shell formation. These situations are schematically illustrated in Figure 6. In addition to these two reasons, the band offset between Zn(Te,Se) and ZnS might be related with the small PLQY of the Zn(Te,Se)/ZnS core/shell QDs. According to the natural band offset between ZnTe and ZnS, ZnTe and ZnS form a type-I quantum well structure, and the confining potentials for the electron and hole are, respectively, 0.22 and 1.36 eV in the ZnTe/ZnS core/shell QDs.28 Because the energy band gap of bulk Zn(Te1–xSex) with x = 0.2–0.3 is approximately 0.15 eV smaller than that of ZnTe,20 the confining potentials for the electron and hole in the Zn(Te,Se)/ZnS core/shell QDs are expected to be slightly larger than those in the ZnTe/ZnS core/shell QDs. However, the confining potential for the electron in the Zn(Te,Se)/ZnS core/shell QDs, which is inferred to be 0.2–0.3 eV, is much smaller than that for CdSe/ZnS core/shell QDs, where the confining potential for the electron is 1.15 eV.28 Such a small confining potential for the electron in the Zn(Te,Se)/ZnS core/shell QDs should introduce that a significant portion of the electron wave function in the Zn(Te,Se) core region penetrates into the ZnS shell layer and reaches to the surface of the ZnS shell. In this situation, the surface states on the ZnS shell layer should behave as nonradiative recombination centers and reduce the PLQY of the Zn(Te,Se)/ZnS core/shell QDs. The much thicker ZnS shell is required in order to eliminate the effect of surface states of the ZnS shell.
Figure 6.
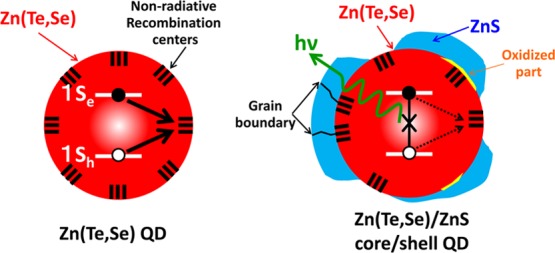
Schematic illustration of Zn(Te1–xSex) and Zn(Te1–xSex)/ZnS core/shell QDs and their electron–hole pair recombination paths.
Figure 7 shows time-resolved PL emission decay traces of the Zn(Te0.77Se0.23)/ZnS core/shell QDs for core QDs with a diameter of 4.3 nm. Triple exponential functions were required to fit the observed decays, and the fitting suggested components with lifetimes of 0.6, 3.9, and 20 ns (Table 3). The lifetimes for the three components are close to those previously reported for CdSe and CdSe/ZnS core/shell QDs and indicate that the PL emission is not attributable to defect levels. The origin of PL decay components in CdSe-based QDs is a topic of discussion; however, the short lifetime component (τ < 1 ns) is related to surface states.34 In the present Zn(Te0.77Se0.23)/ZnS core/shell QDs, the pre-exponential factor of the shortest lifetime component, A1 in Table 3, suggested that almost half of the radiative recombination was related to surface states. This result supports that the surface states of the core Zn(Te0.77Se0.23) QDs were not sufficiently passivated by the ZnS shell as described above.
Figure 7.
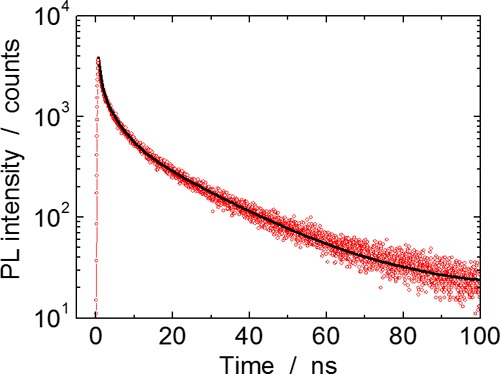
Time-resolved PL emission decay trace of Zn(Te0.77Se0.23)/ZnS core/shell QDs with a mean core diameter of 4.3 nm. Red open dots are the experimentally obtained data, and the black solid line indicates a triple exponential fit.
Table 3. Lifetime Decay Components of Zn(Te0.77Se0.23)/ZnS Core/Shell QDs with Core Diameters of 4.3 nm Obtained from Fitting with the Following Parameters.
| τ1/ns | A1 | τ2/ns | A2 | τ3/ns | A3 |
|---|---|---|---|---|---|
| 0.6 | 1840 | 3.9 | 1320 | 20 | 671 |
Improving the PLQY is a major challenge for enabling the practical application of the present QDs. In the case of InP/ZnS core/shell QDs, aliovalent elements, that is, group II Zn and group VI S, are deposited onto an InP core, consisting of group III and V elements. Hence, interfacial electronic defects are likely to form between the InP core and the ZnS shell, and the PLQY cannot be easily improved. Recently, the PLQY of green emission from InP QDs was improved up to 85% with the use of an InP/GaP/ZnS core/shell/shell structure,35 in which the density of interfacial defects at the core–shell interfaces must be reduced because InP and GaP are both III–V semiconductors. Unlike the InP/ZnS core/shell QDs, the Zn(Te1–xSex) and ZnS in our Zn(Te1–xSex)/ZnS core/shell QDs are both II–VI semiconductors; therefore, the Zn(Te1–xSex)/ZnS core/shell QDs are free from interfacial electronic defects, except for stress-induced dislocation caused by lattice mismatch. Therefore, the small PLQY of the present Zn(Te1–xSex)/ZnS core/shell QDs is concluded to arise from the very small thickness of the ZnS shell and/or partial oxidation of the Zn(Te1–xSex) core. Thus, the PLQY of our Zn(Te1–xSex)/ZnS core/shell QDs might be expected to be increased more easily by modifying the formation process for the ZnS shell on the Zn(Te1–xSex) alloy QDs.
3. Conclusions
In conclusion, a colloidal solution of Zn(Te,Se)/ZnS core/shell QDs was synthesized, and their optical properties were studied. Although the PLQYs of the core/shell QDs require further improvements, we observed narrow-band green emission, that is, a fwhm of 30 nm for PL emission at 535 nm from Zn(Te0.77Se0.23)/ZnS core/shell QDs. This feature is as good as that of CdSe QDs. The present study demonstrates the great potential for replacing CdSe-based green QD phosphors in QD-LCDs for blue backlight downconversion. Future work will focus on forming high-quality and thick ZnS shells without oxidation of the surfaces of core Zn(Te,Se) alloy QDs to improve the PLQY so that cadmium-free and environmentally benign QD-LCDs can be developed from Zn(Te,Se) alloy QDs and InP QDs as green and red phosphors, respectively.
4. Methods and Materials
4.1. Chemicals
Diethylzinc (Zn(C2H5)2 (ZnEt2), 52 wt % Zn basis, Aldrich), selenium powder (Se, 99.99%, Aldrich), tellurium powder (Te, 99.997%, Aldrich), 1-dodecanethiol (C12H14SH (DDT), >98%, Aldrich), tri-n-octylphosphine ((C8H17)3P (TOP), ≥96%, Wako Pure Chemical Industry), oleylamine (C18H35NH2 (OLA), >98%, Aldrich), oleic acid (C17H33COOH (OA), 99%, Aldrich), 1-octadecene (C18H36 (ODE), >90%, Tokyo Chemical Industry), n-hexane (C6H14, >96%, Wako Pure Chemical Industry), chloroform (CHCl3, 99.8%, Wako Pure Chemical Industry), acetone (CH3COCH3, 99.5%, Wako Pure Chemical Industry), toluene (C6H5CH3, 99.8%, Wako Pure Chemical Industry), and ethanol (C2H5OH, 96%, Imazu Chemical). All chemicals were used without further purification.
4.2. Synthesis of Zn(Te1–xSex)/ZnS Core/Shell QDs
A total of 34 μL of ZnEt2 and 73 μL of DDT were dissolved into 6 mL of ODE to prepare a ZnS source solution. Next, 18 mg of Zn(Te1–xSex) QD powder, which was prepared based on a previously reported method,27 was dispersed in a mixed solution of 2.00 mL of TOP, 6.00 mL of ODE, and 1 mL of OLA in a flask. Then, the solution was degassed under vacuum at 100 °C for 30 min. After the solution was heated up to 240 °C under argon flow, the ZnS source solution was added dropwise to the solution in a flask at a rate of 0.2 mL min–1. After the ZnS source solution was completely added, the solution in the flask was kept at 240 °C for 15 min; then, it was cooled to room temperature.
Powder samples were extracted from the product colloidal solution as follows: 0.5 mL of hexane and 6 mL of acetone were added to 2 mL of the product colloidal solution to aggregate the product QDs. Aggregated QDs were isolated by centrifugation and decantation. The resulting powder was redispersed in 0.5 mL of hexane, and the QDs were again aggregated by the addition of 6 mL of acetone. This was repeated several times, and the resulting wet precipitate was dried in a vacuum desiccator at room temperature.
4.3. Characterization
The crystalline phases of the obtained core and core/shell QDs and the lattice parameters of the core QDs were determined using powder XRD (Rigaku, RINT2500, Cu Kα radiation). The average size, dXRD, was evaluated from the fwhm of the 111, 220, and 311 diffractions of the zinc blende structure using the Scherrer equation36
| 1 |
where λ is the X-ray wavelength, β is the fwhm, θ is the diffraction angle, and 0.9 is the shape factor in bulk Zn(Te1–xSex) alloys with a zinc blende structure. Because the lattice parameters of alloys agree well with Vegard’s law,37 that is, a mole fraction weighted mean lattice parameter of the compounds, the chemical compositions, x, of the alloy QDs were determined from their lattice parameter at a composition x, a(x), from the following equation27
| 2 |
The chemical compositions of the alloy QDs were also determined by ICP–AES (SPS7800, SII Nanotechnology, Japan and Spectro ARCOS, AETEK Inc., U.S.). HRTEM images were collected using a JEM-2010 microscope (JEOL, Japan) at an accelerating voltage of 200 kV. Samples were prepared by depositing dilute QD solutions in toluene on carbon-coated copper grids (EM Japan, 200 mesh) and by drying under vacuum at room temperature. XPS spectra were recorded using a PHI5600 spectrometer (ULVAC-PHI Inc., Japan) with a hemispherical electron analyzer. Monochromated Al Kα radiation (hν = 1486.6 eV) was used as an excitation source. The QDs were distributed onto an indium plate and subjected to the XPS measurements. The binding energy was calibrated based on the assumption that the C 1s binding energy for the contaminant carbon is 284.6 eV.
For the optical measurements, the QDs dispersed in chloroform were loaded into a 10 mm pathlength SiO2 glass cuvette. The optical absorption spectra were recorded using a double beam spectrophotometer (U4100, Hitachi, Japan), and the PL spectra were acquired using a blue diode-pumped solid-state laser (Shanghai Sanctity Laser Technology Co., Ltd., P. R. China) with an excitation source of 473 nm, recorded using a USB2000 spectrometer (Ocean Optics, USA). The PLQYs of the core/shell QDs were evaluated using a PL spectrometer (FP6500, JASCO, Japan) with a xenon discharge lamp from the integrated PL intensity of the colloidal solution of core/shell QDs using Rhodamine B as a standard.
Time-resolved PL emission decay traces of the as-synthesized colloidal solution of core/shell QDs were recorded using a time-correlated single-photon counting system comprising a pulsed picosecond diode laser operating at a wavelength of 375 nm (PLP-10-038, Hamamatsu Photonics, Japan), a monochromator (Acton SP2150, Princeton Instruments, USA), a photosensor module equipped with a photomultiplier tube (H7422P-50, Hamamatsu Photonics, Japan), and a photon-counting board (SPC-130, Becker and Hickl, Germany).
Acknowledgments
This work was partly performed under the Cooperative Research Program of the “Network Joint Research Center for Materials and Devices (no. 20171069)” and “Dynamic Alliance for Open Innovation Bridging Human, Environment and Materials”.
Author Contributions
T.O. conceived the project. H.A. performed syntheses of QDs and optical absorption and PL experiments; S.T. performed the ICP–AES, XPS, and time-resolved PL emission decay traces; M.K. collected HRTEM images; and H.A. analyzed the data. T.O., H.A., S.T., and S.F. interpreted the nonradiative recombination centers. H.A. and T.O. led the project and manuscript preparation, with contributions from all authors. All authors discussed the results.
The authors declare no competing financial interest.
References
- Gaponenko S. V.Cambridge Studies in Modern Optics (Book 23), Optical Properties of Semiconductor Nanocrystals; Cambridge Univ. Press: Cambridge, 1998. [Google Scholar]
- Shirasaki Y.; Supran G. J.; Bawendi M. G.; Bulović V. Emergence of Colloidal Quantum-Dot Light-Emitting Technologies. Nat. Photonics 2013, 7, 13–23. 10.1038/nphoton.2012.328. [DOI] [Google Scholar]
- Mashford B. S.; Stevenson M.; Popovic Z.; Hamilton C.; Zhou Z.; Breen C.; Steckel J.; Bulović V.; Bawendi M.; Coe-Sullivan S.; Kazlas P. T. High-Efficiency Quantum-Dot Light-Emitting Devices with Enhanced Charge Injection. Nat. Photonics 2013, 7, 407–412. 10.1038/nphoton.2013.70. [DOI] [Google Scholar]
- Kobayashi S.; Tani Y.; Kawazoe H. Quantum Dot Activated All-Inorganic Electroluminescent Device Fabricated Using Solution-Synthesized CdSe/ZnS Nanocrystals. Jpn. J. Appl. Phys. 2007, 46, L966–L969. 10.1143/jjap.46.l392. [DOI] [Google Scholar]
- Cho S. H.; Sung J.; Hwang I.; Kim R. H.; Choi Y. S.; Jo S. S.; Lee T. W.; Park C. High Performance AC Electroluminescence from Colloidal Quantum Dot Hybrids. Adv. Mater. 2012, 24, 4540–4546. 10.1002/adma.201201524. [DOI] [PubMed] [Google Scholar]
- Coe-Sullivan S.; Liu W.; Allen P.; Steckel J. S. Quantum Dots for LED Downconversion in Display Applications. ECS J. Solid State Sci. Technol. 2013, 2, R3026–R3030. 10.1149/2.006304jss. [DOI] [Google Scholar]
- Xie B.; Hu R.; Luo X. Quantum Dots-Converted Light-Emitting Diodes Packaging for Lighting and Display: Status and Perspectives. J. Electron. Packag. 2016, 138, 20803. 10.1115/1.4033143. [DOI] [Google Scholar]
- Chen H.; He J.; Wu S.-T. Recent Advances on Quantum-Dot-Enhanced Liquid Crystal Displays. IEEE J. Sel. Top. Quantum Electron. 2017, 23, 1–11. 10.1109/jstqe.2017.2649466. [DOI] [Google Scholar]
- Anc M. J.; Pickett N. L.; Gresty N. C.; Harris J. A.; Mishra K. C. Progress in Non-Cd Quantum Dot Development for Lighting Applications. ECS J. Solid State Sci. Technol. 2013, 2, R3071–R3082. 10.1149/2.016302jss. [DOI] [Google Scholar]
- Yang P.; Ando M.; Taguchi T.; Murase N. Highly Luminescent CdSe/CdXZn1-XS Quantum Dots with Narrow Spectrum and Widely Tunable Wavelength. J. Phys. Chem. C 2011, 115, 14455–14460. 10.1021/jp201214k. [DOI] [Google Scholar]
- European Commission . Directive 2011/65/EU OF THE European Parliament and of the Council of 8 June 2011-ROHS, Off. J. Eur. Union, 2011; Vol. L174, pp 88–110. [Google Scholar]
- Nakamura H.; Kato W.; Uehara M.; Nose K.; Omata T.; Otsuka-Yao-Matsuo S.; Miyazaki M.; Maeda H. Tunable Photoluminescence Wavelength of Chalcopyrite CuInS2-Based Semiconductor Nanocrystals Synthesized in a Colloidal System. Chem. Mater. 2006, 18, 3330–3335. 10.1021/cm0518022. [DOI] [Google Scholar]
- Omata T.; Nose K.; Otsuka-Yao-Matsuo S. Size Dependent Optical Band Gap of Ternary I-III-VI2 Semiconductor Nanocrystals. J. Appl. Phys. 2009, 105, 73106. 10.1063/1.3103768. [DOI] [Google Scholar]
- Li L.; Pandey A.; Werder D. J.; Khanal B. P.; Pietryga J. M.; Klimov V. I. Efficient Synthesis of Highly Luminescent Copper Indium Sulfide-Based Core/shell Nanocrystals with Surprisingly Long-Lived Emission. J. Am. Chem. Soc. 2011, 133, 1176–1179. 10.1021/ja108261h. [DOI] [PubMed] [Google Scholar]
- Omata T.; Nose K.; Kurimoto K.; Kita M. Electronic Transition Responsible for Size-Dependent Photoluminescence of Colloidal CuInS2 Quantum Dots. J. Mater. Chem. C 2014, 2, 6867–6872. 10.1039/c4tc01144a. [DOI] [Google Scholar]
- Leach A. D. P.; Macdonald J. E. Optoelectronic Properties of CuInS2 Nanocrystals and Their Origin. J. Phys. Chem. Lett. 2016, 7, 572–583. 10.1021/acs.jpclett.5b02211. [DOI] [PubMed] [Google Scholar]
- Bang J.; Park J.; Lee J. H.; Won N.; Nam J.; Lim J.; Chang B. Y.; Lee H. J.; Chon B.; Shin J.; Park J. B.; Choi J. H.; Cho K.; Park S. M.; Joo T.; Kim S. ZnTe/ZnSe (Core/Shell) Type-II Quantum Dots: Their Optical and Photovoltaic Properties. Chem. Mater. 2010, 22, 233–240. 10.1021/cm9027995. [DOI] [Google Scholar]
- Fairclough S. M.; Tyrrell E. J.; Graham D. M.; Lunt P. J. B.; Hardman S. J. O.; Pietzsch A.; Hennies F.; Moghal J.; Flavell W. R.; Watt A. A. R.; Smith J. M. Growth and Characterization of Strained and Alloyed Type-II ZnTe/ZnSe Core–Shell Nanocrystals. J. Phys. Chem. C 2012, 116, 26898–26907. 10.1021/jp3087804. [DOI] [Google Scholar]
- Asano H.; Omata T. Design of Cadmium-Free Colloidal II–VI Semiconductor Quantum Dots Exhibiting RGB Emission. AIP Adv. 2017, 7, 45309. 10.1063/1.4982256. [DOI] [Google Scholar]
- Su C.-H.; Feth S.; Zhu S.; Lehoczky S. L.; Wang L. J. Optical characterization of bulk ZnSeTe solid solutions. J. Appl. Phys. 2000, 88, 5148–5152. 10.1063/1.1315330. [DOI] [Google Scholar]
- Yu Y.-M.; Nam S.; Rhee J.-K.; Byungsung O.; Lee K.-S.; Choi Y. D. Characterization and Growth of ZnSTe Epilayers by Hot-Wall Epitaxy. J. Cryst. Growth 2000, 210, 521–526. 10.1016/s0022-0248(99)00738-1. [DOI] [Google Scholar]
- Li C.; Nishikawa K.; Ando M.; Enomoto H.; Murase N. Synthesis of Cd-Free Water-Soluble ZnSe1-xTex Nanocrystals with High Luminescence in the Blue Region. J. Colloid Interface Sci. 2008, 321, 468–476. 10.1016/j.jcis.2008.02.009. [DOI] [PubMed] [Google Scholar]
- Lesnyak V.; Dubavik A.; Plotnikov A.; Gaponik N.; Eychmüller A. One-Step Aqueous Synthesis of Blue-Emitting Glutathione-Capped ZnSe1–xTex Alloyed Nanocrystals. Chem. Commun. 2010, 46, 886–888. 10.1039/b919986a. [DOI] [PubMed] [Google Scholar]
- Su C.-H.; Feth S.; Zhu S.; Lehoczky S. L.; Wang L. J. Optical Characterization of Bulk ZnSeTe Solid Solutions. J. Appl. Phys. 2000, 88, 5148–5152. 10.1063/1.1315330. [DOI] [Google Scholar]
- Kamata A.; Yoshida H.; Chichibu S.; Nakanishi H. Growth and Doping Characteristics of ZnSeTe Epilayers by MOCVD. J. Cryst. Growth 1997, 170, 518–522. 10.1016/s0022-0248(96)00575-1. [DOI] [Google Scholar]
- Brasil M. J. S. P.; Nahory R. E.; Turco-Sandroff F. S.; Gilchrist H. L.; Martin R. J. Evolution of the Band Gap and the Dominant Radiative Recombination Center versus the Composition for ZnSe1-xTex Alloys Grown by Molecular Beam Epitaxy. Appl. Phys. Lett. 1991, 58, 2509–2511. 10.1063/1.104859. [DOI] [Google Scholar]
- Asano H.; Arai K.; Kita M.; Omata T. Synthesis of Colloidal Zn(Te,Se) Alloy Quantum Dots. Mater. Res. Express 2017, 4, 106501. 10.1088/2053-1591/aa8b84. [DOI] [Google Scholar]
- Li Y.-H.; Walsh A.; Chen S.; Yin W.-J.; Yang J.-H.; Li J.; Da Silva J. L. F.; Gong X. G.; Wei S.-H. Revised Ab Initio Natural Band Offsets of All Group IV, II–VI, and III–V Semiconductors. Appl. Phys. Lett. 2009, 94, 212109. 10.1063/1.3143626. [DOI] [Google Scholar]
- Dabbousi B. O.; Rodriguez-Viejo J.; Mikulec F. V.; Heine J. R.; Mattoussi H.; Ober R.; Jensen K. F.; Bawendi M. G. (CdSe)ZnS Core–Shell Quantum Dots: Synthesis and Characterization of a Size Series of Highly Luminescent Nanocrystallites. J. Phys. Chem. B 1997, 101, 9463–9475. 10.1021/jp971091y. [DOI] [Google Scholar]
- Lad A. D.; Mahamuni S. Effect of ZnS Shell Formation on the Confined Energy Levels of ZnSe Quantum Dots. Phys. Rev. B: Condens. Matter Mater. Phys. 2008, 78, 125421. 10.1103/physrevb.78.125421. [DOI] [Google Scholar]
- Dong B.; Cao L.; Su G.; Liu W. Facile Synthesis of Highly Luminescent UV-Blue Emitting ZnSe/ZnS Core/shell Quantum Dots by a Two-Step Method. Chem. Commun. 2010, 46, 7331–7333. 10.1039/c0cc02042g. [DOI] [PubMed] [Google Scholar]
- https://www.itu.int/rec/R-REC-BT.2020-2-201510-I/en.
- Lu P.; Smith D. J. The Observation of in Situ and Ex Situ Oxidation Processes for ZnTe Surfaces by High-resolution Electron Microscopy. Phys. Status Solidi A 1988, 107, 681–691. 10.1002/pssa.2211070223. [DOI] [Google Scholar]
- Fitzmorris B. C.; Cooper J. K.; Edberg J.; Gul S.; Guo J.; Zhang J. Z. Synthesis and Structural, Optical, and Dynamic Properties of Core/shell/shell CdSe/ZnSe/ZnS Quantum Dots. J. Phys. Chem. C 2012, 116, 25065–25073. 10.1021/jp3092013. [DOI] [Google Scholar]
- Park J. P.; Lee J.-J.; Kim S.-W. Highly Luminescent InP/GaP/ZnS QDs Emitting in the Entire Color Range via a Heating up Process. Sci. Rep. 2016, 6, 30094. 10.1038/srep30094. [DOI] [PMC free article] [PubMed] [Google Scholar]
- Molaei M.; Hasheminejad H.; Karimipour M. Synthesizing and Investigating Photoluminescence Properties of CdTe and CdTe@CdS Core-Shell Quantum Dots (QDs): A New and Simple Microwave Activated Approach for Growth of CdS Shell around CdTe Core. Electron. Mater. Lett. 2015, 11, 7–12. 10.1007/s13391-014-4039-0. [DOI] [Google Scholar]
- Larach S.; Shrader R. E.; Stocker C. F. Anomalous Variation of Band Gap with Composition in Zinc Sulfo- and Seleno-Tellurides. Phys. Rev. 1957, 108, 587–589. 10.1103/physrev.108.587. [DOI] [Google Scholar]