Abstract
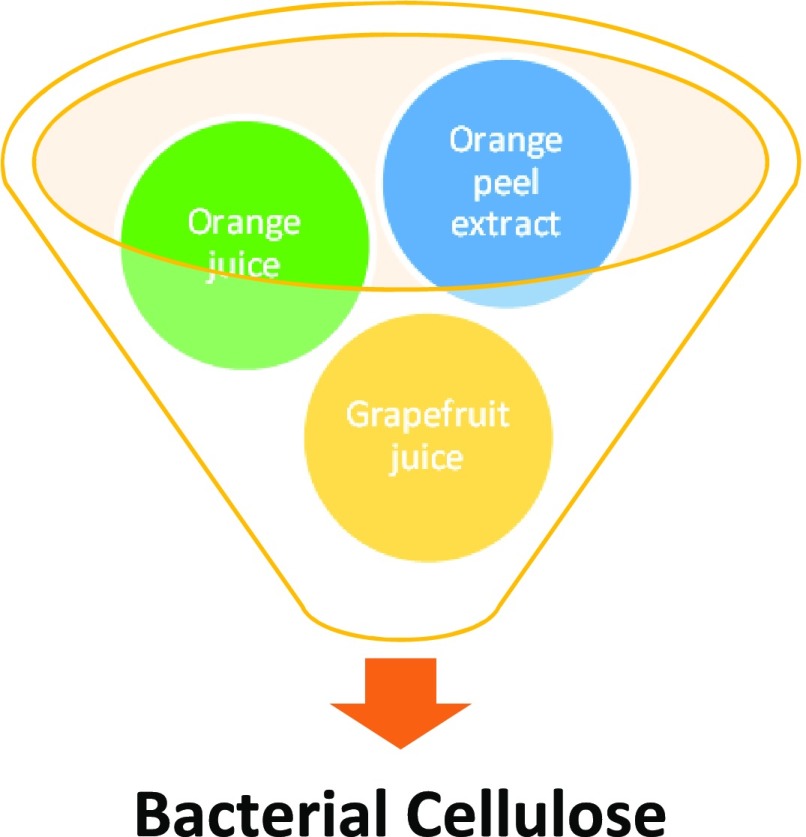
Citrus juices from whole oranges and grapefruits (discarded from open market) and aqueous extracts from citrus processing waste (mainly peels) were used for bacterial cellulose production by Komagataeibacter sucrofermentans DSM 15973. Grapefruit and orange juices yielded higher bacterial cellulose concentration (6.7 and 6.1 g/L, respectively) than lemon, grapefruit, and orange peels aqueous extracts (5.2, 5.0, and 2.9 g/L, respectively). Compared to the cellulosic fraction isolated from depectinated orange peel, bacterial cellulose produced from orange peel aqueous extract presented improved water-holding capacity (26.5 g water/g, 3-fold higher), degree of polymerization (up to 6-fold higher), and crystallinity index (35–86% depending on the method used). The presence of absorption bands at 3240 and 3270 cm–1 in the IR spectrum of bacterial cellulose indicated that the bacterial strain K. sucrofermentans synthesizes both Iα and Iβ cellulose types, whereas the signals in the 13C NMR spectrum demonstrated that Iα cellulose is the dominant type.
Introduction
Escalating negative environmental and societal concerns associated with utilizing traditional petrochemical processes for chemical, polymer, and material production have paved the way toward a bioeconomy era using renewable resources instead. Citrus wastes and residues represent an interesting renewable feedstock because of its wide availability and propensity to yield chemicals and materials. In 2016/2017, the worldwide citrus production, including oranges, grapefruits, and lemons, was 63.3 million tonnes, with oranges dominating market share at 80%.1 Citrus peels constitute almost one half of the total fruit mass and are generated as low-value byproduct streams from the corresponding processing industries. Furthermore, fruits are discarded by open markets, but information on the quantities generated is scarce. Adding value to citrus processing residues and, especially, whole fruits discarded from open markets requires the development of novel biorefinery models. For instance, orange peels are being used in the development of integrated biorefineries for the production of d-limonene, pectin, and mesoporous cellulose2,3 or fermentation products (due to its high carbohydrate content, potentially more than 80% of peel weight)4 such as bacterial cellulose (BC),5 biosurfactants,6 citric acid,7 and bioethanol.8
The utilization of agroindustrial waste and byproduct streams as feedstock is necessary to achieve sustainable production of bacterial cellulose. For instance, crude glycerol from biodiesel production processes and flour-rich confectionery industry waste streams have been used to produce bacterial cellulose (ca. 13 g/L) under static cultures.9 Kuo et al.10 used orange peel waste as substrate for bacterial cellulose production and showed outstanding performance, where yields were up to 6 times higher than conventional medium (Hestrin and Schramm).11 The wide availability, low price, renewability, and high carbohydrate content of citrus waste makes it a good candidate as a bacterial cellulose production medium.
Bacterial (nano)cellulose is produced extracellularly at high efficiency and purity by Acetobacter species.12 Bacterial cellulose is classified as a material of nanoscale network, as it is secreted in the form of ribbon-shaped fibrils of less than 100 nm comprising 2–4 nm nanofibrils.13 Nanocellulose fibers can be applied in various industrial sectors including food industry, pharmaceutical, and electronics due to their exceptional properties, e.g., enhanced mechanical strength, high water holding capacity, and biodegradability.14
Various chemical, mechanical, microwave-assisted, and enzymatic methods or combinations of those have been proposed for the conversion of plant cellulose to nanostructured cellulose.15 High production costs and not so environment-friendly processes continue to hamper the fast track development and acceptance of nanocellulose.16
However, bacterial cellulose can be produced under static or agitated cultures. Static cultures are simple and lead to the formation of cellulose membranes at the surface of the culture, but industrial implementation is hindered due to high production costs resulting from low productivities achieved. Agitated cultures could lead to cost-competitive production of bacterial cellulose,17 but there remains a need to optimize operating conditions.
This study evaluates the synthesis and characterization of bacterial cellulose using aqueous extracts from solid citrus processing waste or whole fruits discarded as waste from open markets. Furthermore, the key physicochemical properties of bacterial cellulose produced on orange peel aqueous extracts were identified and compared with the respective properties of cellulose isolated from orange peels.
Results and Discussion
Production of Bacterial Cellulose Utilizing Citrus-Based Media
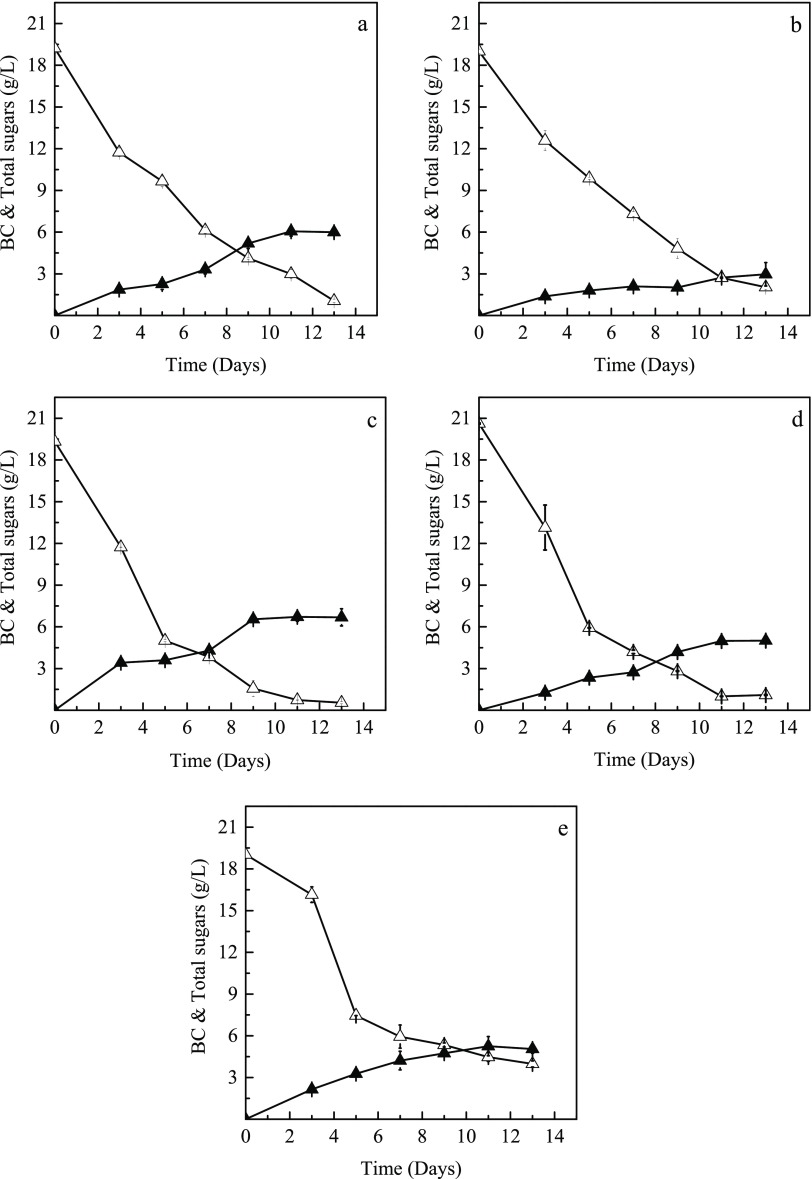
Citrus juices (orange and grapefruit) from whole fruits discarded from open markets and aqueous extracts from solid citrus waste (SCW) (orange, grapefruit, and lemon) were evaluated for their efficiency for bacterial cellulose production by the bacterial strain Komagataeibacter sucrofermentans DSM 15973. Figure 1 presents the total sugar consumption and bacterial cellulose production in shake flask fermentations of K. sucrofermentans cultivated on orange and grapefruit juices and aqueous extracts from orange, grapefruit, and lemon SCW peels. The cultivation of K. sucrofermentans in grapefruit juice-based media led to the highest bacterial cellulose concentration (6.7 g/L), yield (0.36 g bacterial cellulose per g consumed sugars), and productivity (0.61 g/L/day) after 11 days. The bacterial cellulose production achieved via bacterial cultures in grapefruit peel extracts (5.0 g/L), orange juice (6.1 g/L), and lemon peel extracts (5.2 g/L) is also promising. The lowest bacterial cellulose concentration (2.9 g/L) was produced after 13 days when orange peel extracts were used. The consumed sugar to bacterial cellulose conversion yield achieved was higher than 0.17 g/g, whereas productivity was higher than 0.25 g/L/day. At 11 days for all fermentations, the initial sucrose and glucose present in the media used were assimilated at 81.7–100 and 65.7–100%, respectively, whereas the assimilation of fructose varied within the range of 68.3–90.8%. The consumption of total sugars was in the range of 76.5–96.2% at 11 days for all cultures used.
Figure 1.
Consumption of total sugars (Δ) and bacterial cellulose production (▲) in shake flasks cultures of K. sucrofermentans using orange juice (a), orange peel extracts (b), grapefruit juice (c), grapefruit peel extracts (d), and lemon peel extracts (e).
Several studies have investigated bacterial cellulose production using various agroindustrial resources leading up to 10.8 g/L of bacterial cellulose concentration.21−26 Moon et al.27 reported the production of 18 g/L BC concentration by the strain Acetobacter xylinum KJ1 cultivated on saccharified food wastes in a 30 L bioreactor. There are few reported studies on the utilization of fruit-based fermentation media for BC production. Kurosumi et al.5 evaluated juices from oranges, pineapples, apples, Japanese pears, and grapes as fermentation feedstocks for bacterial cellulose production, with orange juice demonstrating the highest bacterial cellulose concentration (5.9 g/L) after 14 days of incubation. Castro et al.28 reported the ability of Gluconacetobacter swingsii sp. to grow and produce bacterial cellulose on pineapple peel juice (2.8 g/L) and sugar cane juice. Adebayo-Tayo et al.29 reported the utilization of pawpaw juice for the production of 7.7 g/L of BC concentration. The BC production (up to 6.7 g/L) achieved in this study are among the highest reported on fruit-based media.
Morphology of Cellulose Samples
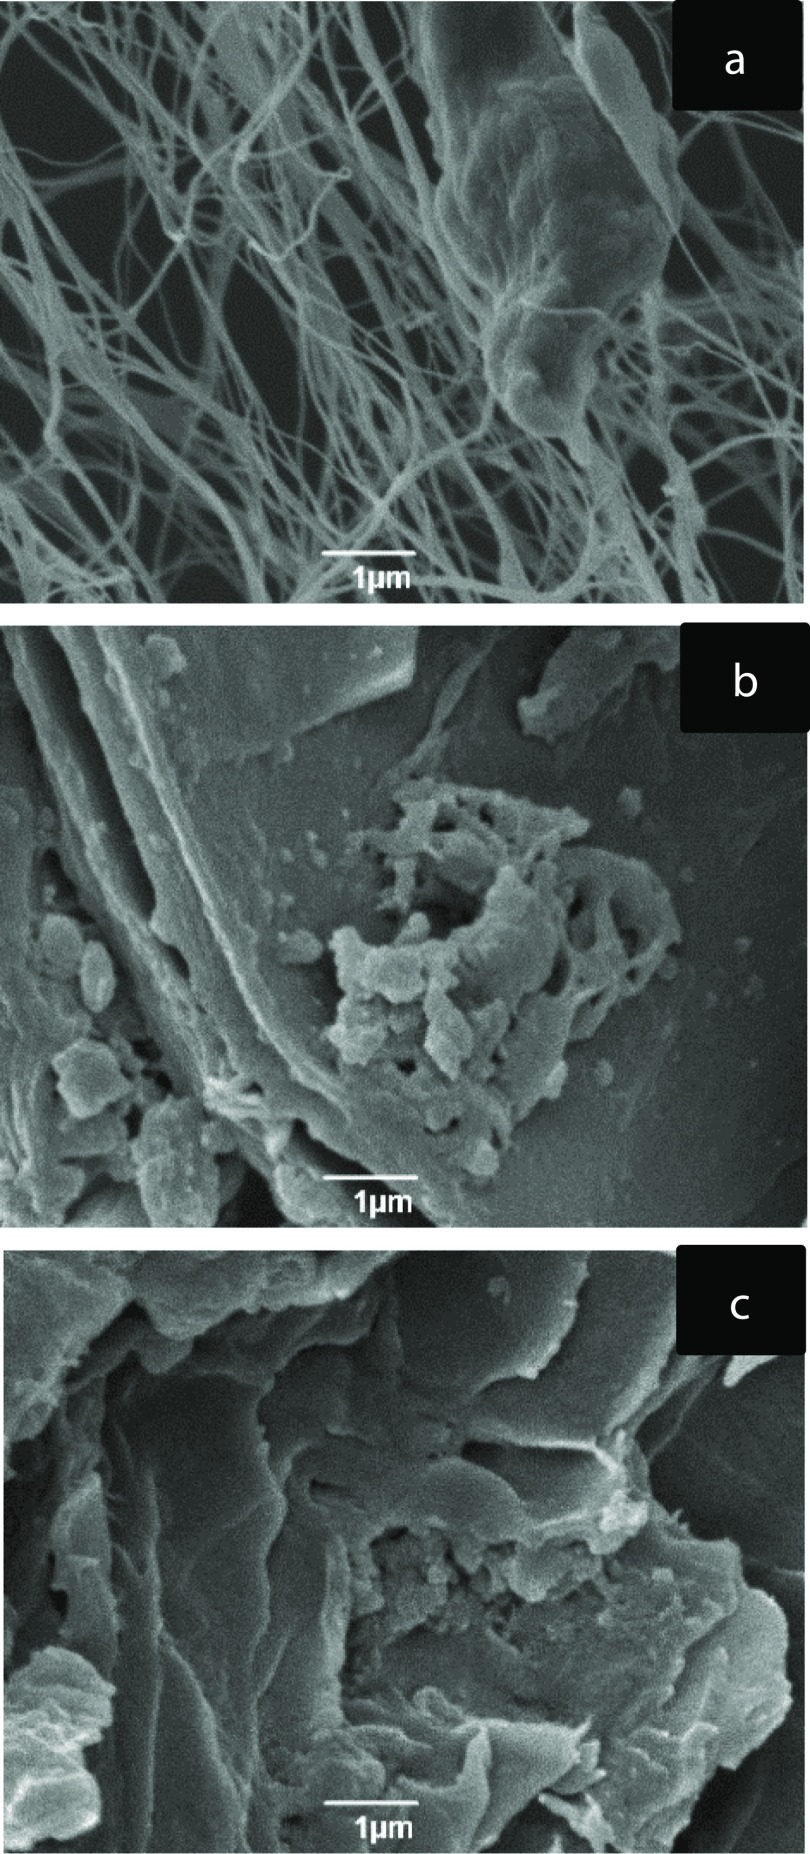
Figure 2 shows selected scanning electron microscopy (SEM) micrographs of the different cellulose samples. Whereas bacterial cellulose (Figure 2a) is formed by long fibrous network of cellulose microfibrils (D = 50–100 nm, L = several micrometers), conventional pectin extraction (CAE)-CB (Figure 2b) and OPEC-CB (Figure 2c) give a more compacted structure, where the amorphous matrix covers/binds the cellulose microfibrils matrix. Hence, in these samples, the cellulose microfibrils are not as visible as in bacterial cellulose.
Figure 2.
SEM of bacterial cellulose (a), CAE-CB (b), and OPEC-CB (c) samples.
Infrared Spectroscopy
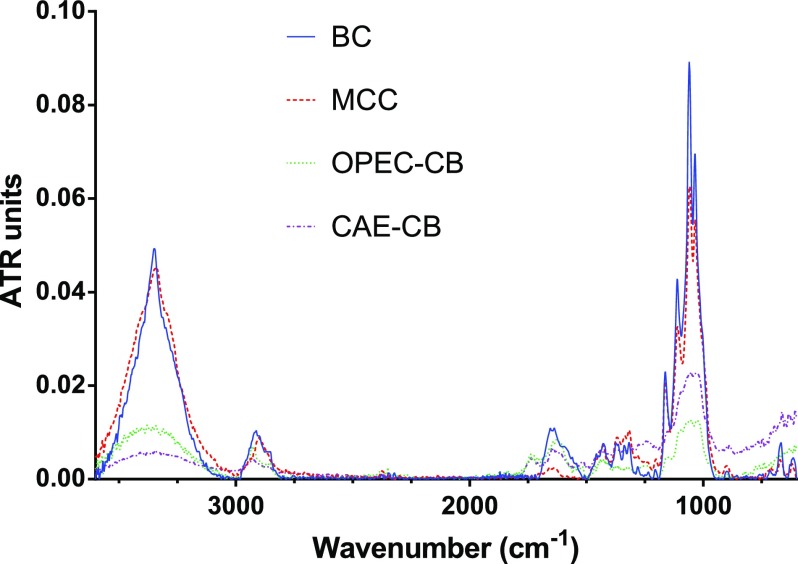
The attenuated total reflection infrared (ATR-IR) spectrum of CAE-CB, OPEC-CB, bacterial cellulose, and microcrystalline cellulose (MCC) are presented in Figure 3. Besides cellulose, the CAE-CB and OPEC-CB samples also contain residual pectin, hemicellulose (mainly evidenced by uronyl residues bands at ca. 1710–1740, 1610–1630, 1430–1455, and 1250 cm–1), and small amounts of lignin, phenolics, and possibly traces of proteins (mainly due to aromatic and amide characteristic absorptions at ca. 1600–1650, 1550–1450, and 1260–1180 cm–1).30−32 Due to the absence of pectin and hemicellulose, bacterial cellulose and MCC present similar absorption bands.
Figure 3.
Infrared spectra of MCC (red), bacterial cellulose (blue), CAE-CB (purple), and OPEC-CB (green).
The main IR absorption bands appearing in all samples are summarized in Table 1. The two bands that appear approximately at 1540 and 1640 cm–1 in the spectrum of bacterial cellulose correspond to amide bond and can be associated with remaining proteins from the culture medium or residual bacterial biomass that was not completely separated during washing of bacterial cellulose membranes. According to Sugiyama et al.,33 absorption bands of cellulose samples around 750 and 3240 cm–1 show the existence of type Iα crystalline cellulose, whereas absorption bands around 710 and 3270 cm–1 show the existence of the amorphous type Iβ. In the IR spectra of bacterial cellulose samples, the presence of 3240 and 3270 cm–1 bands that are characteristic of cellulose Iα and Iβ, respectively, shows that bacterial cultures produce both polymorphs during fermentation.
Table 1. Absorption Bands Present in the Spectra of Microcrystalline Cellulose (MCC), Bacterial Cellulose (BC), and Orange Peel Residues after Conventional Pectin Extraction (CAE-CB) and OPEC Process (OPEC-CB).
| adsorption band (cm–1) | assignment |
|---|---|
| 3600–3000 | O–H group stretching |
| 2895 | C–H stretching in cellulose skeleton |
| 1740–1700 | –C=O stretch |
| 1645–1630 | absorbed water |
| 1493–1396 | H–C–H, O–C–H in-plane bending |
| 1315 | CH2 rocking vibration at C6 carbon |
| 1296–1219 | out of plane bending vibration of C–O–H at C6 |
| 1205 | symmetrical stretching vibration from C–O–C |
| 1162 | asymmetric stretching vibrations from C–O–C |
| 1140–926 | C–C, C–OH, C–H ring and side group vibrations |
| 1107 | C–O–C (1–4) glycosidic linkages |
| 898 | C–O–C, CC–O, C–C–H deformation and stretching vibrations |
Thermogravimetric Analysis (TGA)
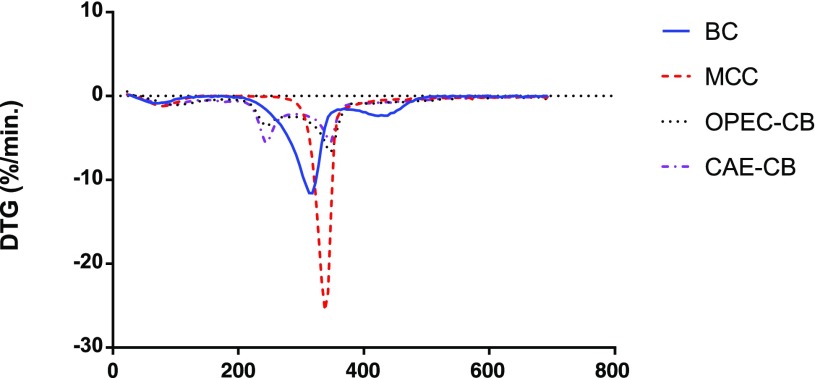
According to the TGA data shown as derivative thermogravimetric traces in Figure 4 and Table 2, all samples presented a maximum degradation temperature around 315–340 °C corresponding to the decomposition of cellulose, which shows considerable thermostability.30,31 Moreover, the derivative thermogravimetric (dTG) traces of CAE-CB and OPEC-CB show three decomposition intervals, corresponding to the elimination of water under 180 °C, breakdown of pectin and hemicellulose at the range of 220–260 °C and decomposition of cellulose at 310–380 °C.30,31 The differences in the decomposition trace of CAE-CB and OPEC-CB samples lie on the fact that the CAE-CB contains, relatively, more pectin than OPEC-CB (Table 2). As expected, MCC and bacterial cellulose, as pure cellulose materials, do not present decomposition bands characteristic of pectin and hemicellulose.
Figure 4.
Derivative thermogravimetric traces of MCC (red), CAE-CB (purple), OPEC-CB (black), and bacterial cellulose, BC (blue).
Table 2. Decomposition Temperature of Microcrystalline Cellulose (MCC), Bacterial Cellulose, and Orange Peel Residues after Conventional Pectin Extraction (CAE-CB) and OPEC Process (OPEC-CB).
| sample | decomposition temperature (°C) | relative pectin content (%) |
|---|---|---|
| MCC | 339.2 ± 0.7 | N/A |
| CAE-CB | 346.6 ± 0.2 | 20 |
| OPEC-CB | 346.8 ± 0.5 | 14 |
| bacterial cellulose | 315.8 ± 0.3 | N/A |
Powder X-ray Diffraction (XRD) Analysis
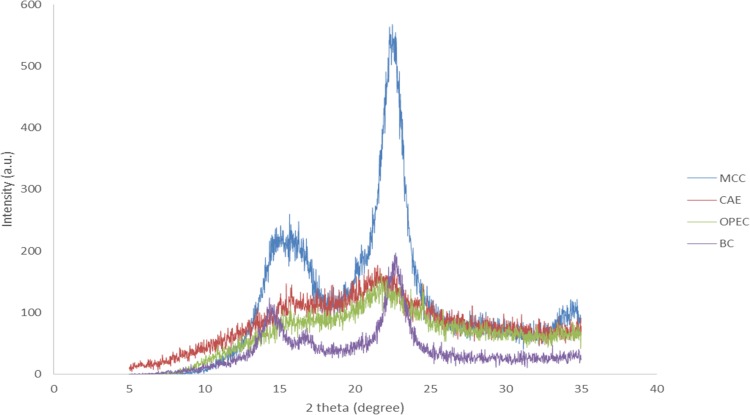
Figure 5 shows the XRD diffractograms of MCC, CAE-CB, OPEC-CB, and bacterial cellulose. The diffraction peaks at 2θ = 14.5, 16.6, and 22.6° correspond to cellulose structure. These peaks are attributed to the (1 0 0), (0 1 0), and (1 1 0) planes of cellulose Iα or the (1 1 0), (1 1 0), and (2 0 0) planes of cellulose Iβ.32 It is not trivial to distinguish the two allomorphs based exclusively on the XRD peak positions due to their small distance.34 Bacterial cellulose and MCC present more defined crystalline cellulose peaks than CAE-CB and OPEC-CB. This occurs probably due to the higher amorphous content on those latter samples, evidenced by the larger amorphous contribution band with maximum ca. 18°.
Figure 5.
X-ray diffraction patterns of MCC (blue), CAE-CB (red), OPEC-CB (green), and bacterial cellulose, BC (purple).
13C Solid-State NMR
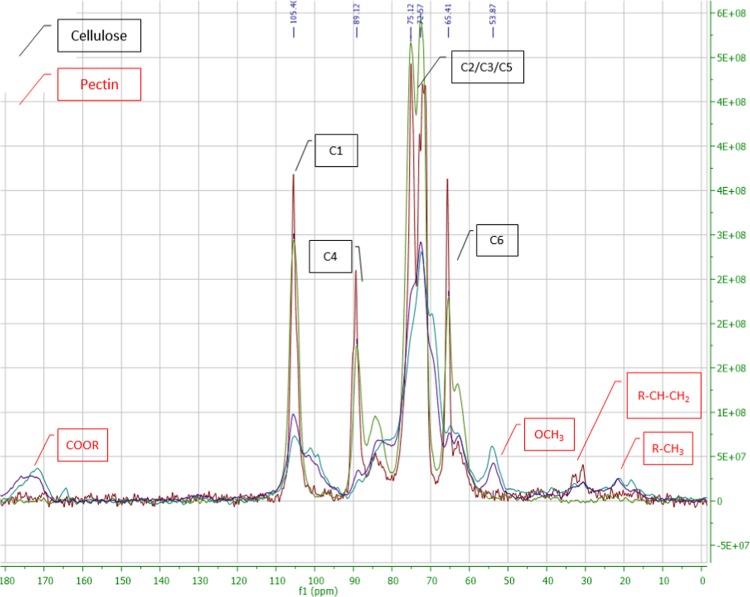
According to the 13C cross-polarization magic angle spinning (CPMAS) NMR spectrum (Figure 6), the signals that correspond to the six carbons of cellulose molecule were identified in all samples. C1 corresponds to the signal at 105 ppm, C4 at 89.1 ppm, C3 at 75.12 ppm, C2 and C5 at 72.6 ppm, and C6 at 65.4 ppm. In the spectrum of bacterial cellulose, the enhanced downfield resonance line for C4 triplet and the strong central resonance line for C1 crystalline indicate that cellulose Iα is dominant.35 CAE-CB and OPEC-CB samples presented extra signals because of the presence of other components. Signals at 174 and 53.9 ppm in CAE-CB and OPEC-CB correspond to carbonyl and methyl-ester group of pectin, respectively.15
Figure 6.
Solid-state 13C NMR spectra of MCC (green), CAE-CB (blue), OPEC-CB (purple), and bacterial cellulose, BC (red).
Crystallinity Index
Crystallinity index depends significantly on the instrument used and the data analysis method applied. According to Park et al.,36 the ATR-IR spectroscopy is the most convenient method (resulting in a ratio of crystalline to amorphous content), whereas XRD and NMR methods provide more accurate values of crystallinity index resulting in percentage values. Bacterial cellulose demonstrated the highest crystallinity index in all the examined methods followed by MCC, OPEC-CB, and CAE-CB (Table 3). As observed in Figure 3, the IR bands related to the crystallinity index of cellulose present in CAE-CB and OPEC-CB overlap with absorptions from other compounds bounded with cellulose, such as pectin and hemicellulose. Hence, the presence of these amorphous polysaccharides can underestimate the crystallinity index calculated from the IR data. Moreover, according to Liitiä et al.37 and Bernardinelli et al.,38 hemicellulose, lignin, and disordered cellulose in plant biomass resonate in the amorphous NMR spectral region and interfere with cellulose crystallinity. The XRD diffractions will also contain contributions from amorphous matter in the samples. Consequently, the determination of the crystallinity index by those techniques are restricted to result only in relative values of crystallinity index (standards would be required). However, values of crystallinity index calculated from NMR, IR, and XRD were consistent in relation to each other, and XRD, in particular, seems to have given the most realistic crystallinity index values.
Table 3. Crystallinity Index of MCC, CAE-CB, OPEC-CB, and Bacterial Cellulose Identified by XRD, IR, and 13C Solid NMR.
| crystallinity
index |
|||
|---|---|---|---|
| sample | XRD (%) | IR (ratio Cr/Am)a | NMR (%) |
| MCC | 84 ± 5.14 | 2.5 ± 0.03 | 50 ± 1.25 |
| CAE-CB | 53.3 ± 3.01 | 1.3 ± 0.01 | 16.1 ± 1.29 |
| OPEC-CB | 56.4 ± 4.89 | 1.5 ± 0.01 | 22.2 ± 1.06 |
| bacterial cellulose | 86.9 ± 2.23 | 9.7 ± 0.51 | 69 ± 4.02 |
Ratio of crystalline to amorphous content.
OPEC-CB crystallinity index values are higher than those of CAE-CB due to the lower content of pectin (“amorphous matter”) in the former (see Table 2), which reflects the higher depectination power of the microwave acid-free treatment vs conventional acid treatment.
Degree of Polymerization
Table 4 presents the degree of polymerization of MCC, CAE-CB, OPEC-CB, and bacterial cellulose. Bacterial cellulose had the highest degree of polymerization (1620), whereas MCC showed the lowest value (134). The degree of polymerization of CAE-CB seems to be almost 6-fold higher than that of OPEC-CB, which expresses the high efficiency of the microwave treatment regarding pectin extraction and biomass deconstruction. However, it is important to consider the limitation of this analysis to those samples, once they comprise other biomolecules besides cellulose, which can interfere with the analysis accuracy.
Table 4. Degree of Polymerization of MCC, CAE-CB, OPEC-CB, and Bacterial Cellulose.
| sample | degree of polymerization |
|---|---|
| MCC | 134 ± 26.63 |
| CAE-CB | 1250 ± 0.69 |
| OPEC-CB | 269 ± 16.35 |
| bacterial cellulose | 1620 ± 1.35 |
Water-Holding Capacity (WHC)
The WHC is considered one of the most important physical properties of bacterial cellulose membranes, especially for biomedical applications. The WHC of bacterial cellulose is remarkably higher (26.5 g/g) than that of CAE-CB (7.6 g/g) and OPEC-CB (7.9 g/g) samples. This is attributed to its nanofibril network (see Figure 2) that allows more water to be bound. The WHC of bacterial cellulose produced in this study is in good agreement with literature-cited publications, with similar35 or even higher39 values. Considering CAE-CB and OPEC-CB samples, their WHC is comparable to banana dietary fibers (6.7–10.5 g/g).40
Conclusions
This study showed that citrus juices derived from whole fruits discarded as waste from open markets and aqueous extracts from citrus peels produced as low-value waste streams from citrus-processing industries could be efficiently used for bacterial cellulose production. The properties of bacterial cellulose produced from citrus-based fermentations demonstrate superior properties to cellulose isolated from orange peels. However, as presented by de Melo et al.,15 it is possible to further process those cellulosic residues by means of microwave hydrothermal treatment to yield nanocellulose, which is a material with similar properties to bacterial cellulose and presents superior hydration properties in relation to its precursors.
Experimental Section
Raw Materials
Citrus fruits (oranges and grapefruits) were obtained ex gratia from a local open market in Athens, Greece, as discarded (waste) fruits. Solid citrus wastes (SCW, peel, and pulp residue after juice processing) of orange, grapefruit, and lemon were obtained from local shops.
Microorganisms
The bacterial strain K. sucrofermentans DSM 15973 was used as cellulose producer. Preculture media were prepared as proposed by Hestrin and Schramm.11 Bacterial cultures were stored at 4 °C in 2% (w/w) agar Petri dishes supplemented with 1% (w/w) glucose, yeast extract, and peptone.
Depectination of Orange Peel
Conventional Acidic Extraction of Pectin
Orange peels (<5 mm, 80 g) were added to 250 mL deionized water adjusting the pH to 1.5 with 0.5 M HCl. The mixture was heated at 90 °C for 1 h. The liquid phase containing pectin was separated from the remaining solid residue by vacuum filtration. The remaining solid residue mainly consisting of cellulosic matter (CAE-CB) was dried at 30 °C for 24 h and weighed. Figure 7 summarizes the procedure.
Figure 7.
Conventional acidic extraction of pectin under reflux at 90 °C.
Acid-Free Microwave-Assisted Extraction of Pectin
Orange peels (<5 mm, 150 g) were added in a 2 L Pyrex vessel. The microwave reactor was operated at 1200 W for 6 min and subsequently at 800 W for 19 min. At the end of the process, the remaining solid residue was about 34% of the initial. The d-limonene-free solid residue (LFSR) was subsequently submitted to pectin extraction using a microwave reactor (CEM MARS 6, One Touch Technology) and closed containers (EasyPrep Plus EasyPrep Teflon) of 100 mL. In each run, six containers were filled with 4 g of LFSR sample and 70 mL of deionized water. The equipment was operated under high agitation at 120 °C for 15 min at max. power of 1800 W. The resulting mixture was vacuum filtered. The filtrate (cellulosic matter, OPEC-CB) was dried at 30 °C for 24 h and weighed. The process is summarized in Figure 8.
Figure 8.
OPEC process for d-limonene and pectin extraction.
Formation of Nutrient-Rich Solid Citrus Waste Extracts for Bacterial Fermentations
After juice extraction, SCW were collected and mixed with water in a liquid-to-solid ratio of 3:1 and boiled for 1 h. The liquid phase was separated from the solid residues with filter paper and the sugar and free amino nitrogen (FAN) concentrations were determined (Table 5). The SCW extracts were stored at −20 °C until further use.
Table 5. Sugar and FAN Content of Citrus Juices and Aqueous Extracts from Citrus Peels.
| media | sucrose (g/L) | glucose (g/L) | fructose (g/L) | total (g/L) | FAN (mg/L) |
|---|---|---|---|---|---|
| Citrus Juices | |||||
| orange | 19.2 | 39 | 35.5 | 93.4 | 292.4 |
| grapefruit | 15.7 | 37.9 | 34.6 | 88.2 | 275.3 |
| Aqueous Extracts from Citrus Peels | |||||
| orange | 2.7 | 8 | 7.2 | 17.9 | 69.6 |
| grapefruit | 1.4 | 7.2 | 7.1 | 15.7 | 53.6 |
| lemon | 0.2 | 2.3 | 2.1 | 4.6 | 49.4 |
Bacterial Cellulose Production
Bacterial fermentations with K. sucrofermentans were conducted in 250 mL Erlenmeyer flasks and 50 mL working volume at 30 °C. All the flasks were inoculated with 10% (v/v) preculture media and the pH value of the broth was adjusted to 6 using 5 M aqueous NaOH. The flasks were initially incubated at 150 rpm for 1–2 days and then statically. The total duration of the experiments was 13 days. Before fermentation, the nutrient composition of aqueous extracts from SCW and juices derived from whole citrus fruits discarded from open markets were properly adjusted according to Hestrin and Schramm fermentation media.11 All media were filter-sterilized using a 0.22 μm filter unit (Polycap AS, Whatman Ltd., Buckinghamshire, U.K.). The initial FAN and total sugar concentration in all cases were 249 ± 25 mg/L and 19.5 ± 0.7 g/L, respectively. All citrus juices were applied as the sole carbon sources for bacterial cellulose production. However, in the case of SCW aqueous extracts, their initial total sugar concentration was lower than that of citrus juices. Thus, to reach the desirable total sugar concentration, the SCW aqueous extracts were supplemented with commercial sugars using the same sugar ratio of each individual extract. Sugar supplementation was carried out in this study to evaluate the potential for bacterial cellulose production. Process development should resort to concentration of SCW aqueous extracts via reverse osmosis. Five sets of experiments were carried out using citrus juices (orange, grapefruit) and SCW extracts (orange, lemon, and grapefruit) as fermentative media. K. sucrofermentans could not grow on lemon juice media probably due to its high acidity and the high amount of NaOH required for adjusting the initial pH of this medium to 6. Sampling was carried out in predetermined intervals to monitor sugar and FAN consumption along with bacterial cellulose production.
Characterization of CAE-CB, OPEC-CB, and Bacterial Cellulose
The properties of isolated CAE-CB and OPEC-CB, obtained from depectination of orange peels, and bacterial celluloses, produced from orange citrus waste extracts, were analyzed with respect to purity (infrared spectroscopy), decomposition temperature (thermogravimetric analysis), crystallinity index (infrared spectroscopy, X-ray diffractometry, NMR), degree of crystallinity (13C solid-state NMR), degree of polymerization, and water-holding capacity (WHC). Sample morphology characterization was performed via scanning electron microscopy (SEM).
Infrared Spectroscopy
Attenuated total reflectance infrared spectroscopy (ATR-IR) measurements were performed on a Bruker Vertex 70 instrument. Commercial microcrystalline cellulose (MCC) was used as the reference material. Spectra were recorded from 3600 to 600 cm–1 at 16 scans, 32 scans background scan time with a spectral resolution of 4 cm–1.
Thermogravimetric Analysis
Thermogravimetric analysis (TGA) was performed using NETZSCH STA 409. Fifty milligram of sample was precisely weighed into a TGA cup and heated under nitrogen flow of 50 mL/min to avoid sample oxidation. The temperature increased from room temperature up to 700 °C at 10 K/min rate.
13C Solid-State NMR
13C{1H} CPMAS spectra were acquired using a 400 MHz Bruker Avance III HD spectrometer equipped with a Bruker 4 mm H(F)/X/Y triple-resonance probe and 9.4T Ascend superconducting magnet. The CP experiments employed a 1 ms linearly ramped contact pulse, spinning rates of 12 000 ± 2 Hz, recycle delays of 5 s, spinal-64 heteronuclear decoupling (at νrf = 85 kHz), and a sum of 512 co-added transients. Chemical shifts are reported with respect to tetramethylsilane and referenced using adamantane (29.5 ppm) as an external secondary reference.
X-ray Diffractometry
X-ray diffractometry (XRD) patterns of the samples were recorded using a Bruker D8 powder diffractometer equipped with a Cu source and PSD Lynxeye detector. The samples were ground to a powder before analysis or lyophilized when referring to bacterial cellulose. The samples were scanned over a 2θ range between 5 and 90° and a θ range between 2.5 and 45° for 8.38 min, with each step recorded at 0.1 s interval. Generator voltage and filament emission were set to 40 kV and 40 mA, respectively. Data were processed using an EVA software.
Degree of Polymerization
Lyophilized samples (0.25 g) were dissolved in 50 mL copper(II) ethylenediamine solution (0.5 M). The relative viscosity (ηr) and specific viscosity (ηsp) of each sample in copper–ethylenediamine solution were measured using a Cannon-Fenske Routine Viscometer immersed in a water bath at constant temperature (25 ± 0.5 °C) and then calculated according to eqs 1–3
| 1 |
| 2 |
| 3 |
where t0 is the flow time of the solvent, t is the flow time of the solution, η is the intrinsic viscosity, and c is 0.5 g/dL.
The average molecular weight (M) was determined by the Mark–Houwink empirical equation (eq 4)
| 4 |
where α is equal to 0.905 and K is equal to 1.33 × 10⁻⁴ dL/g.
For the particular polymer–solvent system, the Mark–Houwink parameters, α and K.18 The degree of polymerization (eq 5) was calculated as M of the polymer divided by the molecular weight of an anhydroglucose monomeric unit:
| 5 |
Crystallinity Index
This study implemented three different methods for crystallinity index determination, namely, infrared spectroscopy, 13C solid-state NMR, and XRD. The method used in the present study was the peak-height method described by Segal et al.19 The IR crystallinity index of cellulose was evaluated as the intensity ratio between IR absorption bands at 1427 and 895 cm–1, which are assigned to CH2 bending mode and deformation of anomeric CH, respectively. The calculation of the XRD crystallinity index of cellulose was calculated using the peak intensity method (eq 6)
| 6 |
where CrI is the crystallinity index, I002 is the maximum intensity of the lattice diffraction, and IAM is the intensity diffraction at 2θ (∼23°).
Solid-state 13C NMR crystallinity index was determined by separating the C4 region of cellulose spectrum into crystalline and amorphous peaks and calculated by dividing the area of the crystalline peak (87–93 ppm) by the total area assigned to the C4 peak (80–93 ppm) (%).
Water-Holding Capacity
Dry sample of 0.25 g was mixed with 25 mL of distilled water and left for 1 h at room temperature. After centrifugation at 3000 rpm for 20 min, the pellet was weighed and the WHC was calculated as g of water absorbed per g of dry sample.
Scanning Electron Microscopy
The surface and morphology of the samples were evaluated by SEM (Jeol JSM-6360). The lyophilized samples were coated with gold and examined at an accelerated voltage of 20 kV and magnification of 20 000×.
High-Performance Liquid Chromatography
The concentration of sugars was determined by high-performance liquid chromatography (Prominence, Shimadzu, Kyoto, Japan) equipped with an Aminex HPX-87H (BioRad, Hercules, CA) column, coupled to a differential refractometer (RID-10A, Shimadzu, Kyoto, Japan). The mobile phase was a 10 mM H2SO4 aqueous solution with 0.6 mL/min flow rate. FAN concentration was assayed by the ninhydrin colorimetric method.20
Wet bacterial cellulose membranes were removed from the fermentation broth and rinsed with water. The resultant membranes were immersed in 1 M aqueous NaOH, boiled for 30 min, and finally washed repeatedly until a neutral pH was obtained. The dry weight of bacterial cellulose was determined either by drying the produced bacterial cellulose at 35 °C for 48 h and subsequently cooled in a desiccator or by lyophilizing the samples.
All analyses were performed in triplicate and the presented values correspond to average values.
The authors from the University of York would like to thank CNPq—Conselho Nacional de Desenvolvimento Científico e Tecnológico (Brazil)—for scholarly funding Eduardo Melo to undertake research at University of York, U.K. (234010/2014-2). A.S.M. would like to acknowledge the EPRSC for funding Systems Change: Whole systems understanding of unavoidable food supply chain waste for re-nutrition (EP/P008771/1) enabling circular economy and food waste discussions with fellow co-authors from Agricultural University of Athens. The authors from the Agricultural University of Athens would like to acknowledge the financial support provided by the research project entitled INVALOR: Research Infrastructure for Waste Valorization and Sustainable Management implemented within the National Strategic Reference Framework (NSRF) 2014–2020 and co-financed by National and Community Funds (E.U.—European Social Fund).
The authors declare no competing financial interest.
References
- https://apps.fas.usda.gov/psdonline/circulars/citrus.pdf (accessed May 23, 2018).
- Balu A. M.; Budarin V.; Shuttleworth P. S.; Pfaltzgraff L. A.; Waldron K.; Luque R.; Clark J. H. Valorisation of orange peel residues: waste to biochemicals and nanoporous materials. ChemSusChem 2012, 5, 1694–1697. 10.1002/cssc.201200381. [DOI] [PubMed] [Google Scholar]
- Pfaltzgraff L. A.The Study & Development of an Integrated & Additive-Free Waste Orange Peel Biorefinery. Ph.D. Thesis, University of York, 2014. [Google Scholar]
- Pfaltzgraff L. A.; De bruyn M.; Cooper E. C.; Budarin V.; Clark J. H. Food waste biomass: a resource for high-value chemicals. Green Chem. 2013, 15, 307–314. 10.1039/c2gc36978h. [DOI] [Google Scholar]
- Kurosumi A.; Sasaki C.; Yamashita Y.; Nakamura Y. Utilization of various fruit juices as carbon source for production of bacterial cellulose by Acetobacter xylinum NBRC 13693. Carbohydr. Polym. 2009, 76, 333–335. 10.1016/j.carbpol.2008.11.009. [DOI] [Google Scholar]
- George S.; Jayachandran K. Analysis of rhamnolipid biosurfactants produced through submerged fermentation using orange fruit peelings as sole carbon source. Appl. Biochem. Biotechnol. 2009, 158, 694–705. 10.1007/s12010-008-8337-6. [DOI] [PubMed] [Google Scholar]
- Rivas B.; Torrado A.; Torre P.; Converti A.; Domínguez J. M. Submerged citric acid fermentation on orange peel autohydrolysate. J. Agric. Food Chem. 2008, 56, 2380–2387. 10.1021/jf073388r. [DOI] [PubMed] [Google Scholar]
- Oberoi H. S.; Vadlani P. V.; Madl R. L.; Saida L.; Abeykoon J. P. Ethanol Production from Orange Peels: Two-Stage Hydrolysis and Fermentation Studies Using Optimized Parameters through Experimental Design. J. Agric. Food Chem. 2010, 58, 3422–3429. 10.1021/jf903163t. [DOI] [PubMed] [Google Scholar]
- Tsouko E.; Kourmentza C.; Ladakis D.; Kopsahelis N.; Mandala I.; Papanikolaou S.; Koutinas A.; et al. Bacterial Cellulose Production from Industrial Waste and by-Product Streams. Int. J. Mol. Sci. 2015, 16, 14832–14849. 10.3390/ijms160714832. [DOI] [PMC free article] [PubMed] [Google Scholar]
- Kuo C.-H.; Huang C. Y.; Shieh C. J.; Wang H. M. D.; Tseng C. Y. Hydrolysis of orange peel with cellulase and pectinase to produce bacterial cellulose using Gluconacetobacter xylinus. Waste Biomass Valorization 2017, 1–9. 10.1007/s12649-017-0034-7. [DOI] [Google Scholar]
- Hestrin S.; Schramm M. Synthesis of cellulose by Acetobacter xylinum. 2. Preparation of freeze-dried cells capable of polymerizing glucose to cellulose. Biochem. J. 1954, 58, 345–352. 10.1042/bj0580345. [DOI] [PMC free article] [PubMed] [Google Scholar]
- Klemm D.; Heublein B.; Fink H. P.; Bohn A. Cellulose: fascinating biopolymer and sustainable raw material. Angew. Chem., Int. Ed. 2005, 44, 3358–3393. 10.1002/anie.200460587. [DOI] [PubMed] [Google Scholar]
- Siró I.; Plackett D. Microfibrillated cellulose and new nanocomposite materials: a review. Cellulose 2010, 17, 459–494. 10.1007/s10570-010-9405-y. [DOI] [Google Scholar]
- De France K. J.; Hoare T.; Cranston E. D. Review of Hydrogels and Aerogels Containing Nanocellulose. Chem. Mater. 2017, 29, 4609–4631. 10.1021/acs.chemmater.7b00531. [DOI] [Google Scholar]
- de Melo E. M.; Clark J. H.; Matharu A. S. The Hy-MASS concept: hydrothermal microwave assisted selective scissoring of cellulose for in situ production of (meso)porous nanocellulose fibrils and crystals. Green Chem. 2017, 19, 3408–3417. 10.1039/C7GC01378G. [DOI] [Google Scholar]
- de Assis C. A.; Houtman C.; Phillips R.; Bilek E. M. T.; Rojas O. J.; Pal L.; Peresin M. S.; Jameel H.; Gonzalez R. Conversion Economics of Forest Biomaterials: Risk and Financial Analysis of CNC Manufacturing. Biofuels, Bioprod. Biorefin. 2017, 11, 682–700. 10.1002/bbb.1782. [DOI] [Google Scholar]
- Shi Z.; Zhang Y.; Phillips G. O.; Yang G. Utilization of bacterial cellulose in food. Food Hydrocolloids 2014, 35, 539–545. 10.1016/j.foodhyd.2013.07.012. [DOI] [Google Scholar]
- Polymer Data Handbook, 2nd ed.; Mark J. E., Ed.; Oxford University Press: Oxford, U.K., 2009. [Google Scholar]
- Segal L.; Creely J. J.; Martin A. E. Jr.; Conrad C. M. An Empirical Method for Estimating the Degree of Crystallinity of Native Cellulose Using the X-Ray Diffractometer. Text. Res. J. 1959, 29, 786–794. 10.1177/004051755902901003. [DOI] [Google Scholar]
- Lie S. The EBC-Ninhydrin Method for Determination of Free Alpha Amino Nitrogen. J. Inst. Brew. 1973, 79, 37–41. 10.1002/j.2050-0416.1973.tb03495.x. [DOI] [Google Scholar]
- Wu J. M.; Liu R. H. Thin stillage supplementation greatly enhances bacterial cellulose production by Gluconacetobacter xylinus. Carbohydr. Polym. 2012, 90, 116–121. 10.1016/j.carbpol.2012.05.003. [DOI] [PubMed] [Google Scholar]
- Vazquez A.; Foresti M. L.; Cerrutti P.; Galvagno M. Bacterial cellulose from simple and low cost production media by Gluconacetobacter xylinus. J. Polym. Environ. 2013, 21, 545–554. 10.1007/s10924-012-0541-3. [DOI] [Google Scholar]
- Chen L.; Hong F.; Yang X. X.; Han S. F. Biotransformation of wheat straw to bacterial cellulose and its mechanism. Bioresour. Technol. 2013, 135, 464–468. 10.1016/j.biortech.2012.10.029. [DOI] [PubMed] [Google Scholar]
- Guo X.; Cavka A.; Jönsson L. J.; Hong F. Comparison of methods for detoxification of spruce hydrolysate for bacterial cellulose production. Microb. Cell Fact. 2013, 12, 93 10.1186/1475-2859-12-93. [DOI] [PMC free article] [PubMed] [Google Scholar]
- Hong F.; Guo X.; Zhang S.; Han S. F.; Yang G.; Jönsson L. J. Bacterial cellulose production from cotton-based waste textiles: enzymatic saccharification enhanced by ionic liquid pretreatment. Bioresour. Technol. 2012, 104, 503–508. 10.1016/j.biortech.2011.11.028. [DOI] [PubMed] [Google Scholar]
- Pacheco G.; Nogueira C. R.; Meneguin A. B.; Trovatti E.; Silva M. C.; Machado R. T.; Barud H. D. S.; et al. Development and characterization of bacterial cellulose produced by cashew tree residues as alternative carbon source. Ind. Crops Prod. 2017, 107, 13–19. 10.1016/j.indcrop.2017.05.026. [DOI] [Google Scholar]
- Moon S. H.; Park J. M.; Chun H. Y.; Kim S. J. Comparisons of physical properties of bacterial celluloses produced in different culture conditions using saccharified food wastes. Biotechnol. Bioprocess Eng. 2006, 11, 26–31. 10.1007/BF02931864. [DOI] [Google Scholar]
- Castro C.; Zuluaga R.; Putaux J. L.; Caro G.; Mondragon I.; Ganán P. Structural characterization of bacterial cellulose produced by Gluconacetobacter swingsii sp. from Colombian agroindustrial wastes. Carbohydr. Polym. 2011, 84, 96–102. 10.1016/j.carbpol.2010.10.072. [DOI] [Google Scholar]
- Adebayo-Tayo B. C.; Akintunde M. O.; Sanusi J. F. Effect of different fruit juice media on bacterial cellulose production by Acinetobacter sp. BAN1 and Acetobacter pasteurianus PW1. J. Adv. Biol. Biotechnol. 2017, 14, 1–9. 10.9734/JABB/2017/34171. [DOI] [Google Scholar]
- Sabiha-Hanim S.; Aziatul-Akma A.. Polymer Characterization of Cellulose and Hemicellulose. In Polymer Science: Research Advances, Practical Applications and Educational Aspects; Méndez-Vilas A.; Solano-Martín A., Eds.; Formatex Research Center: Spain, 2016. [Google Scholar]
- Kim Y.-M.; Lee H. W.; Kim S.; Watanabe C.; Park Y.-K. Non-Isothermal Pyrolysis of Citrus Unshiu Peel. BioEnergy Res. 2015, 8, 431–439. 10.1007/s12155-014-9534-5. [DOI] [Google Scholar]
- Wada M.; Okano T.; Sugiyama J. Synchrotron-radiated X-ray and neutron diffraction study of native cellulose. Cellulose 1997, 4, 221–232. 10.1023/A:1018435806488. [DOI] [Google Scholar]
- Sugiyama J.; Persson J.; Chanzy H. Combined infrared and electron diffraction study of the polymorphism of native celluloses. Macromolecules 1991, 24, 2461–2466. 10.1021/ma00009a050. [DOI] [Google Scholar]
- Lee C. M.; Gu J.; Kafle K.; Catchmark J.; Kim S. H. Cellulose produced by Gluconacetobacter xylinus strains ATCC 53524 and ATCC 23768: Pellicle formation, post-synthesis aggregation and fiber density. Carbohydr. Polym. 2015, 133, 270–276. 10.1016/j.carbpol.2015.06.091. [DOI] [PubMed] [Google Scholar]
- Watanabe K.; Tabuchi M.; Morinaga Y.; Yoshinaga F. Structural Features and Properties of Bacterial Cellulose Produced in Agitated Culture. Cellulose 1998, 5, 187–200. 10.1023/A:1009272904582. [DOI] [Google Scholar]
- Park S.; Baker J. O.; Himmel M. E.; Parilla P. A.; Johnson D. K. Cellulose crystallinity index: measurement techniques and their impact on interpreting cellulase performance. Biotechnol. Biofuels 2010, 3, 10 10.1186/1754-6834-3-10. [DOI] [PMC free article] [PubMed] [Google Scholar]
- Liitiä T.; Maunu S. L.; Hortling B.; Tamminen T.; Pekkala O.; Varhimo A. Cellulose crystallinity and ordering of hemicelluloses in pine and birch pulps as revealed by solid-state NMR spectroscopic methods. Cellulose 2003, 10, 307–316. 10.1023/A:1027302526861. [DOI] [Google Scholar]
- Bernardinelli O. D.; Lima M. A.; Rezende C. A.; Polikarpov I.; Ribeiro deAzevedo E. Quantitative 13C MultiCP solid-state NMR as a tool for evaluation of cellulose crystallinity index measured directly inside sugarcane biomass. Biotechnol. Biofuels 2015, 8, 110 10.1186/s13068-015-0292-1. [DOI] [PMC free article] [PubMed] [Google Scholar]
- Tuinier R.; ten Grotenhuis E.; Holt C.; Timmins P. A.; de Kruif C. G. Depletion interaction of casein micelles and an exocellular polysaccharide. Phys. Rev. E 1999, 60, 848 10.1103/PhysRevE.60.848. [DOI] [PubMed] [Google Scholar]
- Wachirasiri P.; Julakarangka S.; Wanlapa S. The effects of banana peel preparations on the properties of banana peel dietary fibre concentrate. Songklanakarin J. Sci. Technol. 2009, 31, 605. [Google Scholar]


