

Abstract

Silica-supported model copper catalysts were prepared by supporting bis(1,5-diphenyl-1,3,5-pentanetrionato)dicopper(II), Cu2(dba)2, on Cab-O-Sil by a batch impregnation technique. This metal complex showed a strong affinity for the silica support, developing monolayer coverages near the value predicted from a consideration of the size and shape of the planar metal complex (2.6 wt % Cu). The supported catalysts were subsequently activated by decomposing the organic ligands at 400 °C in air followed by reduction with 2% H2/He at 250 °C. One sample was prepared having a loading of 3.70 wt % Cu2(dba)2/silica catalyst, and it was examined for the methanol synthesis reaction under the following conditions: 250 °C with an equimolar gas mixture of CO and H2 in a high-pressure batch reactor. Kinetic data over the model catalyst were fit to a rate equation, second order in the limiting reactant (H2), with a pseudo-second-order rate constant k2[CO]o[H2]o = 0.0957 [h-g total Cu]−1. A control experiment using a commercial catalyst, Cu/ZnO/Al2O3 with a copper loading of 41.20 wt %, showed a value of k2[CO]o[H2]o = 0.793 [h-g total Cu]−1. A fresh sample of Cu2(dba)2/silica was examined for methanol decomposition reaction at 220 °C. The model catalyst shows a methanol decomposition first-order rate constant greater than that of the commercial Cu/ZnO/Al2O3catalyst: 1.59 × 10⁻¹ [min-g total Cu]−1 versus 9.6 × 10⁻³ [min-g total Cu]−1. X-ray diffraction analyzes confirm the presence of CuO particles in both catalysts after calcinations. Copper metal particles were found in both catalysts (fractional Cu dispersions were 0.11 and 0.16 on commercial and model catalysts, respectively) after the reduced catalysts were used in both the methanol synthesis and decomposition reactions. Using the values of copper dispersion found in these samples, we recalculated the rate constants for the two reactions per unit surface copper. These refined rate constants showed the same trends as those reported per total amount of Cu. One role of the promoter(s) in the commercial catalyst is the inhibition of the methanol decomposition reaction, thus allowing higher MeOH synthesis reaction rates in those regimes not controlled by thermodynamics.
1. Introduction
The methanol synthesis reaction has been studied extensively over the last few decades as an important industrial process.1,2 Methanol is used as a fuel for automobiles because of its high octane number, easy handling and storage, wide availability, low boiling point, limited coke formation due to the absence of carbon–carbon bonds, and the ability to be synthesized using a variety of feed stocks.3−5 In most industrial processes, synthesis gas (CO2, H2, and CO) or purified syngas (CO and H2) is catalytically converted to methanol.6−8 In addition to its use as a fuel in automobiles, methanol has widely served as a hydrogen carrier in fuel cells and thereby resolves the difficulties of hydrogen storage onboard.9 In fuel cells, methanol is directly converted to CO and H2 by the methanol decomposition reaction or to CO2 and H2 by methanol-steam-reforming reactions.5,10,11 Copper is one of the most active metals available to catalyze both methanol synthesis and decomposition reactions. The copper-based catalyst, Cu/ZnO/Al2O3, is widely employed in industries for the production of methanol on a large scale. Other copper-based catalysts, such as copper single-crystal model catalysts and copper catalysts supported on CeO2, Al2O3, ZnO, and ZrO2, also have attracted considerable interest in methanol synthesis from syngas.2,12−20 Few studies have addressed the use of silica as a catalytic support.21,22 Therefore, some authors have concluded that Cu/SiO2 catalysts may not be as active as the other copper-supported catalysts for methanol synthesis.1 However, the use of Cab-O-Sil as a support, which has surface silanol groups, with copper has shown to be an effective method for the conversion of syngas to methanol.23,24 The silica support is not reducible under methanol synthesis reaction conditions and thus prevents the crystallization of the oxide support.25 This property minimizes the dissolution of the active copper site into the support and hence can be used as a good model system to study these reactions.26,27 The active site of the methanol synthesis catalyst is still a matter of debate as to the active oxidation state: Cu0, Cu+, or Cu2+.2,18,28 Very few reports show Cu2+ as the active site, but many reports show Cu+ and Cu0 as the active site for the catalytic reaction. It is now widely accepted that metallic copper is the main active site in commercial methanol synthesis catalysts.29−31 However, it is an open question as to the minimum Cu ensemble size required for the MeOH synthesis and decomposition reactions. In this work, we attempt to produce a model catalyst having small Cu ensembles using dinuclear Cu metal complexes as the initial approach. Earlier work showed the promise of making highly dispersed Cu/silica starting with mononuclear and multinuclear Cu metal complexes.34a−34d,36,45,46,48−50
A variety of different methods have been used to prepare Cu/SiO2 catalysts for both methanol synthesis and methanol decomposition reactions, including the urea-assisted decomposition of aqueous nitrate; impregnations of copper acetate, nitrates, and amines; and precipitation of copper nitrate onto silica surfaces.6,23−25,32 These supported copper catalysts show higher activity and selectivity than the unsupported metal catalysts in catalytic reactions due to several reasons.2 Interactions of the support with the catalyst active site may create special coordination and activity for the reaction. Further, support–metal interactions may lead to the creation of new active sites for the reaction. In addition, the support facilitates the migration of copper atoms during the reduction process to aid in developing a highly dispersed catalyst (e.g., ZnO in Cu/ZnO/Al2O3 catalyst).13,14 Moreover, the activity of the supported catalyst depends on the degree of dispersion.32,33 Highly dispersed, nanosized particles show a dramatic increase in the catalytic activity in methanol synthesis due to the presence of large Cu surface area.
The current study is directed toward the preparation of highly dispersed copper catalysts on Cab-O-Sil to study the structure/selectivity of Cu/SiO2 in methanol synthesis and methanol decomposition reactions. In this work, we draw upon our prior experience in decorating oxide surfaces with polynuclear metal complexes.34a,34b These and other references therein describe a method to affix metal complexes having a known structure to the surface of silica and other supports without destroying the metal complex. The coordinating ligands can be removed to permit access of substrates to the reactive metal (ion) ensembles and thus create an active catalyst. In this way, we explored the effect of metal ensemble size upon the reactivity of the model catalysts for methanol synthesis and decomposition reactions.35
The procedure described here is based on the previously described approach for supporting dinuclear copper complexes on Cab-O-Sil.36 The batch impregnation technique was used to affix bis(1,5-diphenyl-1,3,5-pentanetrionato)dicopper(II) (Cu2(dba)2) on Cab-O-Sil. We speculated that the four benzene rings and the quasi-π electron systems of the triketonate ligands in the Cu2(dba)2 complex interact strongly with the silanol groups present on the surface.36 Such interactions have been shown to facilitate the deposition of similar metal complexes (e.g., as [M(acac)2]2+) as a monolayer film.34b,35 The acetylacetonate ligands (acac) and other anionic ligands described in these references are known to react with the protons in the surface silanols to deprotonate this surface.37 Furthermore, copper atoms can accept an axial coordination from the deprotonated siloxides of the surface and form −Cu–O–Si≡ when heated at higher temperatures with the removal of organic ligands. From the results of other studies, it is expected that the Si–O–Cu bonds in copper silicates are stable at high temperatures and therefore the deactivation of the copper catalyst by sintering is minimized during the methanol decomposition reaction.1 Evaluation of the catalyst for methanol synthesis and methanol decomposition reactions and a comparison of reaction data with a commercial methanol synthesis catalyst will be discussed in this article.
2. Results
The Cu2(dba)2/silica precatalyst was first characterized by UV–vis spectroscopy, diffuse reflectance infrared Fourier transform spectroscopy (DRIFTS), powder X-ray diffraction (PXRD), electron spin resonance spectroscopy, and thermogravimetric analysis (TGA) and compared with the unsupported and previously characterized Cu2(dba)2/silica samples.36 Here, we use some of our previously reported data in the Supporting Information (SI) for the sake of reader’s convenience.36 The main objective of these characterizations and comparisons was to examine the morphology and to investigate the catalyst–support interactions of the Cu2(dba)2/silica precatalyst. Before and after the methanol (MeOH) synthesis and decomposition reactions, the model and commercial catalysts were examined by a battery of tests so as to describe the bulk and surface properties.
2.1. Elemental Analysis of Silica-Supported Cu2(dba)2
The progress of the deposition of the metal complex onto Cab-O-Sil was examined by recording the UV–vis absorption spectra of the solution (a) before adding Cab-O-Sil and (b) after collecting the filtrate after 24 h of stirring with Cab-O-Sil. As shown in Figure 1, the Cu2(dba)2 complex solution has similar absorption spectra before and after deposition onto the Cab-O-Sil support. This observation confirms the stability of the metal complex during the deposition process.36
Figure 1.

UV–vis spectra of (a) 1.53 × 10⁻⁵ M Cu2(dba)2 in CH2Cl2 and (b) collected filtrate after stirring the solution with 0.5 g of Cab-O-Sil for 24 h.
The variation in the absorbance values before and after decorating the silica was used to calculate the complex wt % on the Cab-O-Sil. The absorbance peak at 444 nm was used for the calculation of the concentration of complex remaining in solution. With samples showing high metal loadings, UV–vis absorption spectra were recorded after 24 h of stirring and then the amount of metal complex left in the solution was calculated. This remaining mass was subtracted from the initial mass of the metal complex and the copper wt % on silica was calculated. Given this copper wt % and the stoichiometry of the Cu2(dba)2 complex, we calculated wt % of carbon. This predicted carbon and copper compositions are shown in Table S-1 and Figure S-1. Elemental analyzes for Cu and C were performed to see whether metal complex keeps intact on the surface, and those results are combined with the UV–vis results in Table S-1. All of these elemental analysis data for various copper loadings are shown in Figure S-1, in which the predicted and observed values are nearly same at each loading. The slopes of these lines give the moles of C/moles of Cu estimated for the supported complexes. This C/Cu slope was determined using the wt % Cu determined by UV–vis, and the C/Cu slope was determined using the elemental analysis data. From all of these data, we concluded that the metal complexes did not decompose upon decorating the silica. Knowing this fact permitted us to calculate the Cu loading at monolayer loading of the Cu2(dba)2 on silica.
2.2. PXRD of Silica-Supported Cu2(dba)2
The Cu2(dba)2/silica samples showed XRD peaks at 2θ values of 6.52, 9.56, 10.30, 12.80, 14.44, 17.40, 20.16, 22.02, 22.64, 25.48, 27.54, and 29.26° (Figure 2b) and Cu loadings >3.91 wt % (Figure S-2e,f). These peaks are the same as those observed for the parent metal complex (Figure 2a). In the PXRD spectra of 2.64 wt % Cu sample (Figure S-2d), strong peaks were observed at 2θ values of 6.58, 9.68, 14.51, 22.12, and 27.60° and weak reflections were apparent as well. The PXRD spectra (Figure S-2a–c) showed new sharp peaks, but we did observe two broad peaks at 2θ = 6 and 12°. These peaks have also been observed in the PXRD spectra of Cab-O-Sil.
Figure 2.

XRD spectra of (a) unsupported Cu2(dba)2 and (b) supported Cu2(dba)2/silica precatalyst.
We interpret these results in a manner that we used earlier to interpret the PXRD results of silica-supported Cu(acac)2. Beginning with the data at higher loadings of metal complex, we see that these PXRD peaks are observed at values of 2θ not much different from the positions of the peaks in the bulk, polycrystalline metal complex. The appearance of these peaks in the supported samples as well as in polycrystalline sample indicates that the surface contains more than one layer of the metal complex having the same structure as the polycrystalline metal complex. The sample (Figure S-2d)36 at 2.64 wt % Cu shows very small diffraction lines at positions characteristic of the bulk metal complex. The sample (Figure S-2c) at 1.36 wt % does not show these sharp peaks, but only the broad peaks, characteristic of Cab-O-Sil. From these results, we conclude that the monolayer of complex/silica is concluded at a weight loading between 1.36 and 2.64 wt % Cu. The precatalyst belongs to a multilayer according to the XRD reflections shown in Figure 2b.
2.3. DRIFTS of Silica-Supported Cu2(dba)2
Figure 3 shows the DRIFTS images of unsupported and Cab-O-Sil-supported Cu2(dba)2 precatalyst. Neither the Cu2(dba)2 metal complex nor the supported samples show IR peaks in the region of 4000–1600 cm–1. By comparing the spectra of Cu2(dba)2 with silica-supported samples with various Cu loadings (Figure S-3),36 there were two noteworthy features to discuss. First, spectra of the supported samples were similar to those of the parent metal complex of Cu2(dba)2 for Cu loadings ≥2.64 wt %. Second, the peak at 1440 cm–1 in the ≤1.36 wt % copper sample was missing and started to reappear in the spectra of sample with copper loadings of 2.64 wt % and above.36 On the basis of the findings of Kenvin et al.,45 when the supported metal complex exists as more than one layer, the layers on the top do not have a strong interaction with the surface and hence behave similar to that of the metal complexes in polycrystalline Cu2(dba)2. Because DRIFTS is a surface-sensitive technique, the spectrum is dominated by the features of the Cu2(dba)2 in the topmost layer(s). Because the IR spectra of the samples of 2.64 wt % copper and higher loadings are very similar to the spectrum of the Cu2(dba)2 complex, it was concluded that for samples with ≥2.64 wt % (Figure S-3) copper loadings, a monolayer (or greater) coverage has been achieved.36 By comparing DRIFTS images of multilayer films with the precatalyst, it is clear that the precatalyst has developed into a multilayer film on the support surface.
Figure 3.

DRIFTS images of (a) unsupported Cu2(dba)2 and (b) supported Cu2(dba)2/silica precatalyst.
Kenvin45 discussed the use of IR to identify the monolayer Cu loading of Cu(acac)2/silica. He showed that an overtone vibration of the ring C–H, out-of-plane motion, was sensitive to the environment. In the polycrystalline solid, this vibration is present, whereas, it is absent when the metal complex is placed on silica. Thus, the overtone vibration served to identify the Cu metal loading in the sample, where the monolayer of metal complexes has been achieved.
2.4. Electron Paramagnetic Resonance (EPR) of Silica-Supported Cu2(dba)2
Electron paramagnetic resonance spectra were recorded for pure Cu2(dba)2 complex and the precatalyst in solid state (Figure 4) and compared to those of two different samples prepared to have 0.73 wt % Cu and 4.34 wt % Cu on silica (Figure S-4).36 The sample having a Cu loading of 0.73 wt % was selected to represent a submonolayer film, and the 4.34 wt % Cu sample was chosen to represent a multilayer sample. All of the recorded spectra are given in Figure S-4. The hyperfine structure of the unsupported sample shows four spectral lines in the g parallel region and two spectral lines in the g perpendicular region, indicating that the two copper atoms are electronically not coupled.36,47 Low symmetry of the submonolayer sample makes the lines to be broadened due to strong interactions with the surface.47 The intensity of the submonolayer spectrum is higher than that of the spectra of metal complex and the multilayer film. An additional spectral line in the g parallel region was observed for submonolayer sample showing strong interaction with surface along the Z axis.36 This spectral line feature could be explained by the Cu atom forming a coordination bond with the surface siloxide: Cu:O–Si≡. Copper is known to accept a fifth coordination bond under certain conditions.35 Identical spectral lines were observed for parent metal complex, multilayer film, and the precatalyst. However, intensities are different in all three samples.
Figure 4.

EPR spectra of (a) unsupported Cu2(dba)2 and (b) supported Cu2(dba)2/silica precatalyst.
2.5. Temperature-Programmed Decomposition of Silica-Supported Cu2(dba)2
TGA experiments were carried for the supported Cu2(dba)2/silica precatalyst and unsupported Cu2(dba)2 samples to determine their temperature-dependent decomposition kinetics, as shown in Figure 5. The expected overall weight changes were calculated using eq 1 and compared with the experimental weight loses. The final structure of the decomposed sample is assumed to be due to the formation of Cu2O (with two O–Si also coordinated, see Figure 7, starting structure) on the surface (Table S-2).36
| 1 |
The general agreement between predicted and observed weight losses upon thermolysis supports the other data we have presented to the claim that the metal complexes decorate the silica surface intact. Samples having copper loading <2.64 wt % Cu show very slow decomposition kinetics above 235 °C (Figure S-5). The other two samples, with 3.91 and 4.34 wt % Cu, exhibit a rapid weight change from 235 to 290 °C and a slow weight change above 290 °C (Figure S-5e–f).36 We speculate that the rapid weight change comes from the second layer of metal complex, which would be less strongly held by the surface.
Figure 5.

Thermal decomposition of (a) Cu2(dba)2/silica precatalyst and (b) unsupported Cu2(dba)2.
Figure 7.

Proposed surface structure of the Cu2(dba)2/silica catalysts after reduction.
These data suggest that the metal complexes at low loadings experience one type of environment, which is different from the metal complexes in the high loading samples. This environment influences the thermal decomposition kinetics. Interaction of the metal complexes with the silica could influence these kinetics through H-bonding and coordination bonding. Accordingly, we suggest that the spectra in Figure S-5a–c are those of samples containing monolayer films of Cu2(dba)2 before calcination.36 Accordingly, the spectra in Figure S-5d–f describe samples having some of the metal complexes in the overlayers.
The Supporting Information shows the predicted and observed weight losses for these supported samples (Table S-2). Although the data show a large standard deviation, ∼11%, they support the earlier conclusions regarding the integrity of the supported metal complexes before calcinations. Moreover, the thermolysis kinetics for the monolayer samples (Figure S-5a–c) are different from those observed for the multilayer samples (Figure S-5d–f).36 Thus, we estimate the monolayer completion to occur at loadings between 1.36 and 2.64 wt % Cu. The precatalyst also showed similar decomposition kinetics to the multilayer films (rapid weight change from 235 to 290 °C and a slow weight change above 290 °C); hence, we concluded that the precatalyst organized as a multilayer film on the support surface.
2.6. Atomic Absorption Spectroscopy of Cu2(dba)2/Silica and Commercial Cu MeOH Catalyst
Atomic absorption spectroscopy analyzes for copper in the Cu2(dba)2/silica and commercial catalyst showed results of 3.70 and 41.20 wt % Cu, respectively. The amount of copper in the commercial catalyst is approximately 13 times higher than that in the model Cu2(dba)2/silica catalyst. The metal loading of 3.70 wt % copper in the Cu2(dba)2/silica catalyst is greater than that required for a theoretical monolayer coverage of Cu2(dba)2 on the silica, 2.64 wt % copper.36 For this study, the 3.70 wt % copper-loaded sample was used to ensure that the silica surface was completely covered with Cu2(dba)2 complex.
A previous study36 showed that the organic ligands of the Cu2(dba)2/silica are completely decomposed below 400 °C; therefore, the model catalyst was heated to 400 °C to remove these organic ligands. After calcination, the model catalyst and the commercially available methanol synthesis catalyst were characterized by XRD. The XRD patterns of the calcined catalysts are depicted in Figure 6. These data are to be compared to the literature data (JCPDS) so as to interpret the results. The diffraction lines of CuO (JCPDS 44-0706) appear at 2θ of 32.6, 35.6, 38.8, and 48.9°. The diffraction lines of the ZnO phase (JCPDS 36-1451) are observed at 2θ of 31.8, 34.5, and 36.3°. For the model catalyst, the peaks corresponding to low indexes of CuO are clearly apparent at 2θ values of 35 and 38°.38,39 Moreover, XRD peaks attributed to the silica-supported Cu2(dba)2 (2θ = 6.58, 9.68, 14.51, 22.12, and 27.60°) are absent in the thermally decomposed sample. These results and the presence of CuO peaks confirm the complete decomposition of Cu2(dba)2/silica catalyst as well as the presence of copper atoms with a bulk oxidation state of +2. The commercial catalyst showed peaks at 2θ = 32, 35–36, 38, 43, 51, and 57°. The peaks at 32, 35, and 38° may be attributed to ZnO, whereas the Cu peaks were assigned to 35° for CuO and the peaks at 43 and 51° are attributed to Cu0.40,41 We did not see any XRD peak attributed to crystalline Al species in the commercial catalyst. The small peak at 57° could not be indexed to either a Cu or Zn species.
Figure 6.

XRD patterns of (a) supported 3.70 wt % Cu2(dba)2/silica catalyst and (b) commercial catalyst after calcinations in air at 400 °C.
After calcinations, the model catalyst was reduced with hydrogen. The proposed structure of the model catalyst after reduction with hydrogen is shown in Figure 7 if the Cu species form strong coordination bonds with the surface Si species via the oxygen in the OH group, as was discussed in earlier work.34a−34c That is, Kenvin34c suggested that the reduced Cu/silica derived from Cu(acac)2 was bonded to the siloxide oxygen and the terminal structure was −O–Cu–H for the reduced catalyst. This structural assignment finessed the problem of a dangling bond on the Cu’s. We show here a structure for Figure 7, where the oxidized coppers are terminating with −H groups. The temperature-programmed reduction data can be used to establish the complete reduction of CuO’s in the model and commercial catalysts. The previously reported catalyst precursors have shown onset reduction temperatures between 150 and 180 °C. The commercial catalyst with 61.7 wt % Cu shows a maximum reduction peak in the range of 210–250°C, which we used to confirm the complete reduction of the model catalyst and the commercial catalysts.34e
All of the catalysts were characterized by XRD after methanol synthesis and decomposition reactions. The observed XRD patterns are shown in Figure 8.
Figure 8.

XRD patterns of (a) 3.70 wt % Cu2(dba)2/silica catalyst after methanol synthesis reaction, (b) 3.70 wt % Cu2(dba)2/silica catalyst after methanol decomposition reaction, and (c) commercial catalyst after methanol decomposition and synthesis reactions.
The Cu2(dba)2/silica model catalysts show identical XRD patterns after methanol synthesis and decomposition reactions (Figure 8a,b). Two peaks at 43 and 51° were visible corresponding to Cu(111) and Cu(200),42 and a smaller peak was observed at 38°.38,39 It is quite clear that the Cu’s species were not highly dispersed in these samples. The sintering of Cu observed mimicked the results observed by Kenvin for the calcinations/reduction of Cu(acac)2 multilayers on silica.34c For the commercial catalyst, these two copper metal peaks were observed at the same positions in the XRD spectrum, but more intense than the peaks of the model catalysts, reflecting the higher copper content (41 vs 3.7 wt % Cu). In addition, the commercial catalyst showed a peak at 33 and 35°, which may be attributed to ZnO and the peak at 38° is attributed to a Cu species. Appearance of peaks for copper metal particles after methanol synthesis and decomposition reactions confirms the further reduction of bulk Cu ions to copper metal. Especially, in methanol synthesis, it has been shown that Cu+ and Cu0 are catalytically active phases. During the catalytic reactions, copper(II) species in Cu2(dba)2/silica model catalysts are reduced to copper metal.
The PXRD patterns are given in the Supporting Information (Section 7; Figures S-9 and S-10). One citation of the literature confirms the major peak locations in the commercial catalyst.34eTables S-4 and S-5 show the manipulations of these PXRD peak positions and peak width data along with the determination of the Cu dispersions and crystallite sizes for the model catalyst and the commercial catalyst. Our calculations of Cu metal surface area per gram of supported catalyst are shown in Table 1.
Table 1. Calculation of Cu Metal Surface Area/Mass of Total Catalyst.
| assume
that particles are cubes with a characteristic size L | ||
|---|---|---|
| Cu2(dba)2/silica | commercial catalyst | |
| L, nm | 3.64 | 5.25 |
| surface area, 5/L, nm2/nm3 | 1.37 × 10⁹ | 9.52 × 10⁸ |
| density of copper, ρ, gCu/cm3 | 8.96 | 8.96 |
| specific surface area, 5/ρL, m2/gCu | 37.7 | 18.1 |
| Cu weight loading in catalyst, wt % | 3.7% | 41.2% |
| Cu surface area, m2/g catalyst | 1.40 | 7.47 |
The beginning of the calculation of copper metal surface area is the assumption that the crystallites on the catalyst surface are cubes (see Figure S-11). This assumption has been supported by literature data showing high-resolution transmission electron microscopy of supported Cu catalysts and by the transmission electron microscopy (TEM) images in the Supporting Information. The next assumption is that only five of the six faces of the cube are accessible by gaseous reactants; thus, the surface/volume ratio of these crystallites is given by 5/L, where L is the crystallite size determined by using the Scherrer equation to process the PXRD peaks (see above for references to Supporting Information). The next assumption is that the density of the Cu crystallites can be estimated using the value of the bulk density for copper (8.96 g/cm3). Finally, model and commercial catalysts (3.7 and 41.2 wt % Cu, respectively) were employed to determine the Cu metal surface area per gram of catalyst for the two catalysts as 1.4 and 7.47 m2 Cu/g catalyst.
2.7. Methanol Synthesis Reaction
Activated catalysts were evaluated for the methanol synthesis reaction at 250 °C in a stirred batch autoclave. Isothermal batch reactor data were obtained for the commercial catalyst and for the model catalyst derived from Cu2(dba)2. The purpose of these reaction studies was to characterize the surface sites in these catalysts for the methanol synthesis reaction.
The synthesis of methanol obeys the following stoichiometric equation
with a rate expression43 as follows
| 2 |
Besides this synthesis reaction, methanol can decompose and form other products, such as dimethyl ether, methyl formate, methane, carbon dioxide, and hydrogen.
| 3 |
| 4 |
| 5 |
| 6 |
The batch reactor was used to attain high conversions; however, data at low conversions were used to determine the rate constants of the synthesis reaction (eq 2). Using this rate equation and limiting the analysis to low conversion data (<15%), for which the other reactions will be appearing at low reaction rates, the total pressure in the reactor can be related as a function of time to the fractional conversion of the limiting reactant, hydrogen, when the initial reactant mixture is equimolar in CO and H2. A derivation of this equation can be found in the Supporting Information.
| 7 |
Therefore, the raw data of PT versus time can be processed according to eq 7 to extract the fractional conversion of hydrogen, f, versus time for the two catalysts. First, we consider the total pressure versus time data for the two catalysts (Figure 9).
Figure 9.

Ratio of total pressure to initial pressure (PT/PT°) vs time. Each catalyst (5 g) was prereduced at 240 °C in 2 mol % H2 in He at a total pressure of 500 psig. Catalyst pellets were 3–4 mm; stirrer rotational speed is 200 min–1. (a) Model catalyst (3.70 wt % Cu); (b) commercial catalyst (41.20 wt % Cu).
These raw data show that the commercial catalyst is more reactive, on a total catalyst weight basis, than the model catalyst; however, the Cu metal loadings (3.70 and 41.2 wt % Cu) were different as well as the specific surface areas of the support (200 m2/g for Cab-O-Sil and 119 m2/g for a similar commercial catalyst, vide supra). The data can be examined in more detail, accounting for the differences in the two catalysts. These data of pressure were converted to fractional conversion of H2, using eq 7, and plotted against the product of mass of Cu in catalyst × time [g Cu-min] for two Cu metal loadings: 3.70 wt % (model catalyst) and 41.20 wt % (commercial catalyst). These data are shown in Figure S-6a.
2.7.1. Integral Method of Analysis
The data in Figure S-6a show that the initial conversion rates are different when expressed specific to the mass of Cu in the two samples. For a quantitative evaluation of the specific activities between the two catalysts, a rate law must be chosen. One rate law40 that recognizes the orders of reaction and the reversibility is given in eq 2. The rate of formation of methanol is proportional to the partial pressures of CO and H2 for the forward reaction and to the MeOH partial pressure for the reverse reaction. At low conversion, the reverse reaction will be negligible, and the dependence upon CO will be small at low H2 conversions (<0.3) such that the kinetics can be approximated by irreversible kinetics. These data of fractional conversion versus time were examined by the integral method of analysis for first-order (see Figure S-6b, Supporting Information) and second-order kinetics. The integrated rate equation for an isothermal batch reactor using a pseudo-second-order irreversible kinetics is (see Supporting Information for derivation).
| 8 |
When the data are plotted as f/(1 – f) versus time × MCu, the slope will be k[CO]o[H2]o. Figure 10 shows the data plotted assuming that second-order irreversible kinetics can be used to model the reaction dynamics at low fractional conversion of hydrogen (<0.3). We notice that both of the data sets show negative intercepts on the y axis, which is characteristic of data from a batch reactor, where it is difficult to assign a value of zero time for the initiation of the reaction.44
Figure 10.
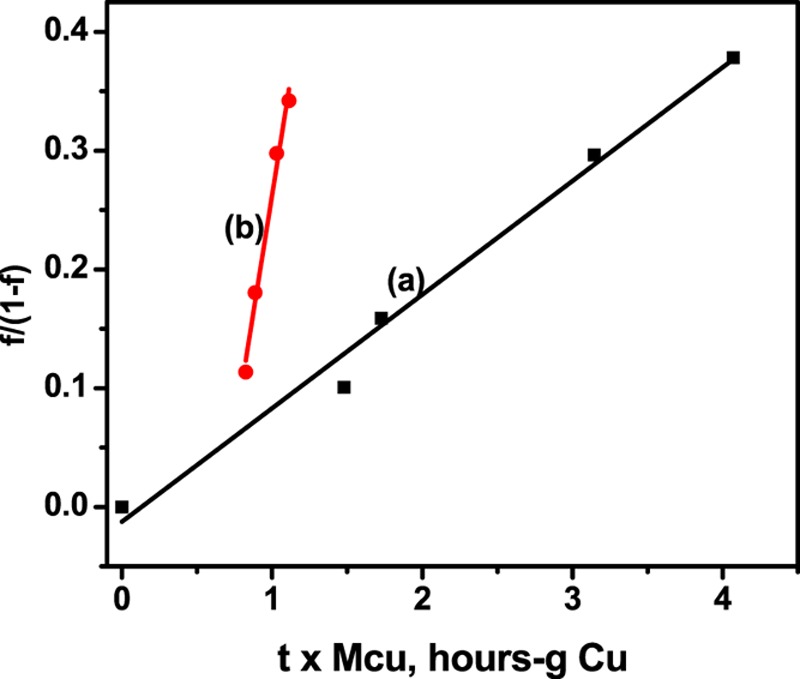
Integrated rate plots: (a) 3.70 wt % Cu2(dba)2/silica catalyst, filled squares; (b) commercial catalyst, filled circles.
The slopes of these two lines are as follows: 0.0957 [h-g total Cu]−1 for the model catalyst, and 0.793 [h-g total Cu]−1 for the commercial catalyst. These slopes are related to the pseudo-second-order rate constants as follows: k = slope/[CO]o[H2]o [=] [molarity2-h-g total Cu]−1.
2.7.2. Differential Method of Analysis
The same pressure versus time data can be reexamined by the differential method of analysis to extract the rate constants characterizing the model and commercial catalysts. The starting point for this development is the forward rate expression of eq 2, thus neglecting the reverse reaction, the MeOH decomposition reaction. We can express this equation in terms of the conversion of hydrogen, f, as follows
| 9 |
where the value 2 is the stoichiometry number for H2.
This result suggests that we plot estimates of the hydrogen conversion rate, (df/dt)/MCu, against (1 – (1/2)f)(1 – f)2 so as to establish the slope, (2)k[CO]o[H2]o (Table S-3). These processed data are shown in Figure 11 to give the following values for the slopes of the lines describing the commercial catalyst and the model catalyst: 4.58 and 0.552 [h-g total Cu]−1, respectively. We notice that these two methods for examining the same data produce ratios of slopes, commercial to model catalysts, which are very similar: 8.29 versus 8.30.
Figure 11.

Differential method of analysis of isothermal batch reactor data for MeOH synthesis.
From these data, we conclude that the commercial catalyst is about 8 times more active than the model catalyst when one accounts for the amount of total Cu present in the sample. We summarize the kinetic characterizations of the two catalysts in Table 2. Even though the rate expression, eq 2, shows an order of reaction of at least 2 in [H2], the data at low conversion could also be fitted by a rate equation that is first order in hydrogen. The ratio of rate constants for this fit of the data, commercial/model catalysts, was 7.8, not much different from the ratios obtained by fitting the data to pseudo-second-order and third-order kinetics. This result is not unexpected when the range of conversion data is low.44
Table 2. Summary of Kinetic Rate Constants Determined for the MeOH Synthesis Reaction.
| integral method | differential method | ||
|---|---|---|---|
| slope | k | k[CO]o[H2]o | 2k[CO]o[H2]o |
| commercial catalysts | 0.645 | 0.793 | 4.58 |
| model catalysts | 0.0832 | 0.0957 | 0.552 |
| order of reaction | first | second | third |
| units | [h-g-Cu]−1 | [h-g-Cu]−1 | [h-g-Cu]−1 |
2.7.3. Gas Chromatography–Mass Spectrometry (GC–MS) Analysis of MeOH Synthesis Reaction
After each catalytic reaction, catalysts were washed with 5 mL of CH2Cl2 and analyzed by GC–MS. The GC–MS results are shown in Figures S-7 and S-8. The commercial catalyst gave a comparatively sharp peak at a retention time of ∼5 min. The model catalyst produced a small peak at the same position. This peak was identified as MeOH by injecting an authentic sample of MeOH and observing a single peak to elute at 5 min.
2.8. Methanol Decomposition Reaction
The two catalysts were characterized further by the MeOH decomposition reaction, which is just the reverse reaction to the MeOH synthesis reaction, eq 2. This reverse reaction is an important tool to characterize the supported copper catalyst, as one would design a catalyst that showed a high synthesis rate constant and a low decomposition rate constant for the conditions under which kinetics control the reaction. The reaction progress was monitored by measuring the total pressure in the reactor as a function of time.
Using the ideal gas law, we can relate fractional conversion of MeOH to the total pressure as follows (Supporting Information)
| 10 |
Fractional conversion versus time data (Figure 12) can be fit to an irreversible rate law, reverse of eq 2, by an integral method of analysis to obtain a slope related to the first-order rate constant: k = [h-g-Cu]−1. We now look at the MeOH fractional conversion data when plotted as ln(1 – f) versus the reaction time × mass of Cu in the sample (Figure 13). If we now restrict these data to fractional MeOH conversions data of <0.15, it appears that the initial conversion rates are much different between the two catalysts, with the model catalyst showing the higher conversion rate per unit total mass of Cu.
Figure 12.

Fractional conversion vs time for a commercial catalyst: 10 g catalyst, 41.20 wt % Cu, initial pressure = 10 psig, rapid heating to reaction temperature = 220 °C, initial methanol = 15 g, final methanol = 9 g; for the model catalyst: 5 g catalyst, 3.70 wt % Cu, initial methanol = 15 g, final methanol = 12 g, initial pressure = 10 psig, initial temperature = 220 °C.
Figure 13.

Integrated rate plot for the conversion of methanol × time mass of Cu: (a) Cu2(dba)2/silica catalyst and (b) commercial catalyst.
From the slope, it was found that the rate constants for the commercial catalyst and the 3.70 wt % Cu model catalyst were 0.96 × 10⁻² and 1.59 × 10⁻¹ [h-g-Cu]−1, respectively. Here, we report that the commercial catalyst shows a lower rate constant than the model catalyst by a factor of ∼16, per unit mass of Cu, for the MeOH decomposition. This striking result shows the importance of the additional components added to the Cu so as to inhibit the reverse reaction that destroys the MeOH product.
2.8.1. GC–MS Analysis of Products
The commercial catalyst produced carbon monoxide as the only carbon product in GC–MS analysis, whereas the 3.70 wt % Cu/silica, [Cu2(dba)2], catalyst gave 29% carbon monoxide and 1.8% carbon dioxide by volume. The formation of carbon dioxide suggests that the water gas shift reaction has occurred during the methanol decomposition reaction and/or CO reacted with some of the O atoms in the copper oxide to form CO2 and reduce the catalyst. These results suggest that the 3.70 wt % Cu/silica[Cu2(dba)2] catalyst has a slightly different product selectivity in the methanol decomposition reaction.
3. Discussion
Our earlier study36 characterizing the Cu2(dba)2/silica catalysts showed that the samples have an initial loading of complex greater than a monolayer loading (∼2.6 wt % Cu) and these excess complexes would organize into an overlayer that developed an XRD pattern similar to that of the polycrystalline unsupported metal complex. When this sample was calcined (Figure 6), an XRD spectrum showed only crystals of CuO. This result was not unexpected based upon the work of Kenvin34c,45 who demonstrated the same result for supported multiple layers of Cu(acac)2/silica. Accordingly, we were able to prepare supported CuO/silica to test as a model catalyst for the MeOH synthesis and decomposition reactions having a low loading of Cu (∼3.7 wt %). The commercial catalyst, when calcined under the same conditions, showed both CuO and Cu0 crystallites. Apparently, some of the Cu in the commercial catalyst could not be fully oxidized to CuO at the 400 °C calcination temperature, whereas all of the Cu in the model catalyst could be fully oxidized. Indeed, some literature data report that the commercial catalysts were calcined at a higher temperature, 450 °C, than what was used here, 400 °C. These same materials, when subjected to reduction in H2, followed by reaction in CO and H2 and then used to catalyze the MeOH decomposition, showed only Cu0 species.
The appearance of Cu0 and CuO crystallites in the reduced and calcined model catalysts arising from the decomposition of the Cu2(dba)2 metal complexes shows that the Cu species are mobile on the silica surface. This result is different from that reported by Kenvin for the Cu/silica catalysts developed from the decomposition of a monolayer film of Cu(acac)2/silica.45,46 On the other hand, samples showing multiple layers of Cu(acac)2/silica (approximately two to three layers) formed crystallites upon calcining and reduction. The mononuclear Cu(acac)2 complexes Kenvin used were free to associate with −Si–OH centers and thus form a collection of metal complexes in the monolayer film that could be individually secured to the surface siloxide by a strong coordination bond between the siloxide and the Cu2+.
One indirect characterization method, N2O decomposition, suggested that these Cu centers could be separated by as much as 0.4 nm. This separation distance could reflect the separation distance between surface silanols in the Cab-O-Sil support, vide infra. The dinuclear metal complex used in this study47 showed a Cu–Cu distance of 0.3058 nm, about 1 nm shorter than the minimum distance identified by Kenvin between Cu’s derived from a monolayer film of Cu(acac)2. The actual distance between silanols on the Cab-O-Sil cannot be known for certainty owing to its amorphous nature. However, bounds for this silanol–silanol distance may be inferred from Si–Si distances in α-cristobalite. Using the c unit cell value of 0.69278 nm for α-cristobalite and recognizing that the Si–Si projected distance is ∼1/2 of this value, we estimate the distance between Si’s in α-cristobalite as 0.346 nm. The β-form of cristobalite shows a Si–Si spacing of 0.3584 nm. It is likely that the Si–Si distance in Cab-O-Sil may be larger than these values owing to the lower density of the amorphous phase. Considering these data, one might opine that the mismatch is at least (1/2)–1 nm between the Cu–Cu distance in Cu2(dba)2 and the siloxides in Cab-O-Sil so that upon ligand destruction by heating it is unlikely that the Cu’s in the metal complex will form strong coordination bonds with the surface siloxides. We speculate that this lack of strong coordination bonding between the Cu’s and the surface siloxides leads to their mobility to form Cu crystallites on the surface. This result was not what we had anticipated in planning this line of research, but very early work suggested that the formation of crystallites could occur from a submonolayer film of a metal complex, where some of the Cu ions in the metal complexes were not in registry with the siloxides prior to calcination.48
The model Cu2(dba)2/silica catalyst contains more than one layer of adsorbed Cu2(dba)2 on the silica. We speculate that the top layer interacts less strongly with the silica surface than the layer in contact with the silica. Therefore, the Cu ions developed in this top layer during calcination may agglomerate to form comparatively big CuO particles. During the chemical reactions, MeOH synthesis and decomposition, these particles were further reduced to copper metal as shown in the XRD pattern. One could estimate the average size of the Cu crystals from a consideration of the PXRD line-broadening data (Figures S-9 and S-10) and TEM data (Figures S-11–S-14 and Table S-5). The average Cu metal crystallite sizes can be estimated using the Scherrer equation, which relates the broadening of the two Cu reflections, (111) and (200), to the average metal crystallite size in the model and commercial catalysts, 3.6 and 5.3 nm, respectively. One can relate these average crystallite sizes to the fractional dispersion of Cu atoms by assuming a shape for the crystals, cubic, and an average surface atom density characterized by the (111) index plane. Here, we estimated the fractional Cu dispersions to be 0.11 and 0.16, respectively, for the commercial and model catalysts (Table S-4). We speculate further that the larger copper particles participate in the MeOH synthesis reaction, which demands large Cu ensembles.49
We compared our results to those reported in the literature for the same catalysts. Literature data for Cu/ZnO/Al2O3 catalysts show Cu crystallite sizes of 30.7 and 37.1 nm (ref 3 in SI), for which we estimate the fractional Cu dispersion to be 0.032 and 0.026, respectively. Smaller Cu crystallites, 2–10 nm, were observed in another study (ref 4 in SI) for a Cu/ZnO catalyst. In yet another study, a commercial Cu/ZnO/alumina catalyst showed Cu crystallites of ∼9 nm in size, for which the dispersion would be 0.064 (ref 5 in SI). Our results of 3–5 nm estimated from the PXRD data appear to be similar to some of the results reported in the literature.
The ratios of the rate constants multiplied by the initial concentrations of CO and H2 ([CO]o[H2]o) reported for the methanol synthesis reaction over the commercial and model catalysts (4.58 and 0.552 [h-g total Cu]−1, respectively) do not account for the dispersion of the Cu crystallites in each catalyst. The apparent rate constant, k, is related to the intrinsic rate constant, ki, as follows
| 11 |
where the ratio of the number surface Cu atoms to the total number of Cu atoms is the fractional dispersion.
Using the estimates of fractional Cu dispersions derived from XRD line-broadening data for the commercial and model catalysts (0.11 and 0.16, respectively), their intrinsic rate constants × [CO]o[H2]o are as follows: 41.6 and 3.47 [h-g surface Cu]−1, respectively. These rate constants suggest that the intrinsic surface rate constants for the reaction on the model and commercial catalysts differ by a factor of ∼12. One could interpret these results by ensemble theory, which suggests that a minimum ensemble size of Cu atoms is necessary for the MeOH synthesis reaction to occur. Thus, the catalyst that shows the greater number of these minimum Cu ensembles will demonstrate a larger intrinsic rate constant. In the present case, this catalyst would be the commercial catalyst. This intrinsic rate constant reflects the effects of catalyst structure on chemisorptions of CO and H2 to the surface and the activations of the reactant molecules. In particular, it is clear that the Cu/Cab-O-Sil is active for the MeOH synthesis reaction and that the addition of ZnO and the alumina support serve to increase the intrinsic reactivity in the MeOH synthesis and/or the promoter inhibits the MeOH decomposition when the system experiences kinetic control.
These same catalysts were characterized for reactivity using the MeOH decomposition reaction to show the following apparent first-order rate constants: 0.0096 [h-g total Cu]−1 for the commercial catalyst and 0.159 [h-g total Cu]−1 for the 3.70 wt % Cu model catalysts. Now, applying the fractional Cu dispersions calculated before, the intrinsic rate constants for the MeOH decomposition reaction over the commercial and model catalysts were as follows: 4.98 and 60.0 [h-g surface Cu]−1.
It is interesting to compare the rate constants for the two catalysts between the two reactions: MeOH synthesis and MeOH decomposition (Table 3).
Table 3. Comparison of Intrinsic Rate Constants between Model and Commercial Catalystsa.
| catalyst | MeOH synthesis reaction at 250 °C | MeOH decomposition reaction at 220 °C |
|---|---|---|
| model Cu2(dba)2 | 3.47 | 60.0 |
| commercial catalyst | 41.6 | 4.98 |
Units of rate constants: [h-g surface Cu]−1 for MeOH synthesis, rate constant × [CO]o[H2]o, whereas the decomposition rate constants are first-order rate constants, [h-g surface Cu]−1.
These data show that the MeOH synthesis reaction is faster than the MeOH decomposition reaction over the commercial catalyst (41.6 vs 4.98 [h-g surface Cu]−1); however, the opposite is true for the model catalyst (3.47 vs 60 [h-g surface Cu]−1). It must be remembered that the decomposition reaction was completed at a temperature of 220 °C, whereas the synthesis reaction was completed at 250 °C, thus emphasizing the difference in the reactivity of these catalysts between the synthesis and decomposition reactions. In developing our argument, we are using the characterizations of the Cu species only, thus begging the question of the direct role of ZnO in the catalysis. Some authors55 suggest that the ZnO facilitates the heterolytic hydrogen chemisorptions (Hδ+-Hδ−) and thus ZnO plays an indirect role in the catalysis.
Considering the reactivity of the two catalysts for the MeOH synthesis reaction, the commercial catalyst is more reactive by an order of magnitude when compared on the basis of the number of exposed Cu atoms. This large difference in reactivity between the synthesis reactions observed over these catalysts may be due in part to the ensemble size required by the synthesis reaction. The average Cu ensemble size in the commercial catalyst may be larger than the average ensemble size in the model catalyst. Thus, the commercial catalyst shows a greater number of Cu ensembles having the minimum size to initiate the synthesis reaction. Another consideration is the lower reactivity of the commercial catalyst for the MeOH decomposition reaction vis-à-vis the model catalyst. This lower reactivity of the MeOH decomposition reaction than the commercial reaction may result in fewer of the MeOH molecules decomposing to CO and H2 and thus giving the appearance of higher reactivity for the disappearance of reactants CO and H2. These differences in the catalytic properties may be attributed to the different oxidation states of Cu present in the two catalysts and the presence of the other oxide(s) in contact with these copper species. It is clear that copper species in the model catalyst show different catalytic properties from the copper species in contact with ZnO and alumina residing in the commercial catalyst. In particular, the role of ZnO/alumina may be to “break up” the copper surface into islands, which are not very reactive to the MeOH decomposition reaction. These discontinuities in the Cu surface would not be observed by the PXRD, which is a “volume”-sensitive tool rather than a “surface”-sensitive tool.
Now turning to the observed Cu dispersion in the model sample, our attempts, reported here, to prepare well-dispersed Cu/silica catalyst using dinuclear metal complexes were not successful as we reported earlier,34a,34b where we did achieve an atomically dispersed and stable Cu/silica catalyst using mononuclear Cu complexes as the copper precursor. We speculate that the Cu–Cu distance (∼0.3 nm) of the copper ions in the dinuclear metal complex did not allow these ions to realize a strong interaction between the Cu ions and the surface siloxides, as was reported by Kenvin.34c Choksi et al. reported the synthesis and characterization of a silica-supported Cu catalyst (2.27 wt % Cu) prepared from a monolayer film of copper 2,2′-bipyridine dimer on Cab-O-Sil.50 After calcination of this sample, they reported that all of the Cu ions in the sample were surface Cu’s as confirmed by the NO chemisorption and that this catalyst when reduced in H2 at 300 °C reacted with N2O to suggest that all of the Cu atoms were separated by a distance of <0.4 nm.
The Cu–Cu distance in this Cu(bipy) dimer complex is 0.289 nm.51a This distance is shorter than the Cu–Cu distance reported for the Cu2(dba)2 complex of this study. Thus, we would not expect to see high dispersion of the Cu ions developed from Cu 2,2′-biyridine unless the complex were to dissociate upon contacting the silica surface. The EPR spectrum reported by Choksi et al. for the monolayer film of Cu 2,2′-bipyridine/silica (Figure S-15) shows a striking resemblance to the EPR spectra reported for monomeric Cu 2,2′-dipyridine (OH)n, where n = 0, 1, or 2 complexes in solution.52 Moreover, the EPR parameters obtained by Choksi et al.50 (Table S-6) are not too different from the EPR parameters reported by the same authors.51b The EPR spectrum of the solid Cu 2,2′-bipyridine dimer was completely different from that of the supported metal complex (Figure S-16). Data of the system of Cu 2,2′-bipyridine species in aqueous solutions show that the dimer is favored only when pH > 7. For values of pH < 7, the monomeric Cu 2,2′-bipyridine is the favored species.53 One could interpret these data to show that the dimer complex was converted to the monomeric complex [Cu 2,2′-bipyridine]2+ upon contacting the slightly acidic surface of the Cab-O-Sil. This mononuclear Cu complex would be free to form a strong interaction with the surface siloxides, which have been produced by the action of triethylamine cosolvent.49 In a similar manner, we have54 showed that bis(heptane-2,4,6-trionato)dicopper(II), Cu2(daa)2, decomposed into monomeric Cu species when we attempted to decorate silica with the parent complex. This dinuclear metal complex is isomorphous to the Cu2(dba)2, except the triketonate (daa) ligands terminated in methyl groups rather than phenyl groups observed in the (dba) ligands. We suggest that the match between the Cu–Cu distance in the metal complex and the Si–OH–Si–OH distance of the support plays an important role in forming a strong interaction between the surface and the metal ions in the multinuclear metal ion complex decorating the surface when the metal complex remains intact.
4. Conclusions
Cu2(dba)2/silica catalysts were prepared to have 3.70 wt % copper and evaluated for methanol synthesis and decomposition reactions. Control experiments were completed with a commercial Cu/ZnO/Al2O3 catalyst (Katalco 51-8PPT, 41.2 wt % Cu). The model catalyst was less active than the commercial catalyst for the methanol synthesis reaction. On the other hand, the commercial catalyst was less active than the model catalyst for the methanol decomposition reactions after accounting for the amounts of Cu in the sample. Even when accounting for the differences in Cu metal dispersion between the two catalysts (0.11 and 0.16 for commercial and model catalysts, respectively), the model catalyst showed lower intrinsic rate constant than the control catalyst for the MeOH synthesis reaction, by a factor of 12. On the other hand, the commercial catalyst showed a lower reactivity for the MeOH decomposition reaction by a factor of 12. The role of promoters in these commercial catalysts may be related to the lower reaction activity toward the MeOH decomposition as well as increasing the rate of the MeOH synthesis reaction. The combination of higher activity for the forward reaction and lower reactivity for the reverse reaction makes the overall activity toward MeOH synthesis of the commercial catalyst particularly attractive.
The low reactivity of the model catalyst for methanol synthesis was not unexpected given that the model was designed to show only the effects of copper alone on a nonreducible oxide surface, silica. The catalytic properties of the model catalyst are characteristic of an unpromoted Cu, which was initially decorating the silica in a highly controlled environment. The effect of calcining was to (1) partially destroy the order of these catalyst precursors on the surface and (2) promote the growth of small Cu crystallites from the monolayer of CuO arising from the decomposition of the Cu(II) dinuclear metal complexes.
5. Experimental Section
5.1. Chemicals and Reagents
Cu(CH3COO)2·H2O was purchased from Strem Chemicals (7 Mulliken Way, Newburyport, MA) and used without further purification. The Cab-O-Sil (M-5 scintillation grade, 200 m2/g) was purchased from Acros Organics (Fisher Scientific). CH2Cl2 was obtained from VWR Chemicals (Matsonford Road, Radnor, PA 19087-8660). The methanol synthesis catalyst, Cu-ZnO-Al2O3, F-51-8PPT (60–100 mesh, calcined, not activated), was purchased from Katalco (Suite 230, 2 Transam Plaza Drive, Oak Brook Terrace, IL 60181-4296). The surface area38 of a similar commercial catalyst was reported to be 119 m2/g. All of the other chemicals and reagents were purchased from Sigma-Aldrich Chemical Company.
5.2. Reactor
A Parr 4560 Mini Bench Top reactor (Parr Instrument Co., Moline, IL) was used for the current study. The reactor has a volume of 400 mL and is equipped with a stirring shaft, pressure gauge, thermocouple, heating jacket, and catalyst basket, which holds 5–10 g of pelletized catalyst.
5.3. Synthesis of the Ligand
1,5-Diphenyl-1,3,5-pentanetrione was synthesized by the Claisen condensation of acetone with methyl benzoate in Ar atmosphere using monoglyme as the solvent.36
5.4. Synthesis of the Metal Complex
The synthesis of bis(1,5-diphenyl-1,3,5-pentanetrionato)dicopper(II), Cu2(dba)2, was performed by the reaction of Cu(CH3COO)2·H2O with 1,5-diphenyl-1,3,5-pentanetrione in ethanol–water solvents.36
5.5. Preparation of the Catalyst
5.5.1. Selection of Solvent
Several solvents were tested for obtaining the largest amount of metal complex deposited on the support, such as: (1) water, (2) ethanol, (3) methanol, and (4) methylene chloride. These tests were completed earlier using Co2(dba)2, another metal complex that is isostructural to the copper dinuclear metal complex. The results of these tests showed that the order of solubility of the metal complexes in the solvents was: CH2Cl2 > MeOH > EtOH ≫ water.
5.5.2. Methodology Used To Obtain Supported Catalyst
Cu2(dba)2 (1 g) was dissolved in 400 mL of CH2Cl2 and was added to 5 g of the previously dried Cab-O-Sil. The solution was then stirred for 24 h, filtered, washed with fresh aliquots of 1.00 mL of CH2Cl2, and dried under vacuum for 6 h at room temperature.
5.6. Characterization Techniques
UV–vis spectra were recorded on a Shimadzu UV-2550 spectrometer over the 250–700 nm wavelength range. The supported catalyst was characterized by X-ray diffraction (Siemens D5000 powder X-ray diffractometer), diffuse reflectance Fourier transform spectroscopy (DRIFTS), and thermogravimetric analysis (TGA) as described previously.36 Metal analyses were performed using an atomic absorption spectrometer (AA-7000 series; Schimadzu Corporation). A copper hollow cathode lamp was used with 6 mA current and a 324.8 nm wavelength. The burner height was set to 7 mm, and the slit width was set to 0.7 nm. The flame composition was acetylene (flow rate, 1.8 L min–1) and air (flow rate, 1.8 L min–1). EPR spectra were recorded on a Bruker EMX EPR spectrometer equipped with a 100 kHz field modulator. Diphenylpicrylhydrazyl (DPPH) (g = 2.007) was used to calibrate the spectra.
5.7. Activation of the Catalyst
5.7.1. Calcinations
The supported Cu2(dba)2/silica catalyst was heated in air using a furnace at 400 °C for 6 h to remove organic ligands.
5.7.2. Reduction with H2
We use here a technique to reduce the catalyst with H2 reported in the patent literature.39 The calcined catalyst was placed in a catalytic basket and transferred into the stirred batch autoclave. The reactor was flushed with 2% of H2 gas (10 psi H2 + 490 psi Ar) and heated to 100 °C. This temperature was maintained for 1 h before increasing the temperature at a rate of 10 °C/h to 240 °C. After allowing the catalyst to thermally equilibrate at 240 °C for 1 h, the H2 and Ar mixture was purged from the autoclave.
5.8. Methanol Synthesis Reactions
The activated catalyst (5 g) was transferred into the catalytic basket contained in a stainless steel reactor vessel. Syngas (CO + H2, 1:1 molar ratio) was introduced into the autoclave, and the temperature of the reactor was raised to 250 °C, where the observed pressure at the beginning of the reaction was 860 psig. The course of the reaction was followed by recording the total pressure as a function of time. The same procedure was repeated using 5 g of the commercially available methanol synthesis catalyst. Throughout each reaction, the rotational speed of the stirrer was held constant at 200 rpm. No solvent was used for the methanol synthesis reaction because the reaction is a heterogeneous gas–solid phase reaction.
5.9. Methanol Decomposition Reactions
The methanol decomposition reaction was carried out using a thermally activated Cu2(dba)2/silica catalyst. The catalyst (5 g) was activated by reducing with 2% H2 using the same procedure reported above before allowing the reactor to cool to room temperature and purging the remaining gases. Methanol (15 mL) was then deposited inside the reactor vessel. The temperature of the reactor was increased from room temperature to 220 °C and held constant to start the methanol decomposition reaction. The pressure of the reactor was monitored as a function of time. This reaction was repeated using 10 g of the commercially available methanol synthesis catalyst and 15 mL of methanol.
5.10. GC–MS Analysis of Reaction Products
After the reactions, gas samples were collected from the batch reactor and analyzed by GC–MS affixed with FID and TCD. Without cooling the reactor, all of the products were vented into 50 mL of dichloromethane solution maintained at 0 °C, to trap the condensable products. The effluent gases were then directed to a gas sampling bomb. Samples from the dichloromethane solution and from the gas sampling bomb were examined separately in the GC–MS.
5.11. Characterizations of the Catalysts by Powder X-ray Diffraction (PXRD)
All of the catalysts reported in the current study were characterized by XRD after calcinations, methanol synthesis, and decomposition reactions.
Acknowledgments
This study is based upon work performed by the Sustainable Energy Research Center at Mississippi State University and was supported by the Department of Energy under Award Number DE-FG3606GO86025. Special thanks go to Dr. W. P. Henry, an author and principal investigator, for his lifetime dedication to inorganic chemistry. Dr. Henry suddenly died of lung cancer in February 2014.
Supporting Information Available
The Supporting Information is available free of charge on the ACS Publications website at DOI: 10.1021/acsomega.7b00919.
Elemental analysis and temperature-programmed decomposition of silica-supported Cu2(dba)2 catalysts, derivation of equations to extract rate constants from isothermal batch reactor data, integral method of analysis, differential method of analysis, calculation of crystallite size from the Scherrer equation, estimation of the crystallite size from TEM data, EPR data for Cu 2,2′-bipyridine dimer and monomers (PDF)
The authors declare no competing financial interest.
Supplementary Material
References
- Liu X. M.; Lu G. Q.; Yan Z. F.; Beltramini J. Ind. Eng. Chem. Res. 2003, 42, 6518–6530. 10.1021/ie020979s. [DOI] [Google Scholar]
- Szanyi J. N.; Goodman D. W. Catal. Lett. 1991, 10, 383–390. 10.1007/BF00769173. [DOI] [Google Scholar]
- Lindstram B.; Agrell J.; Pettersson L. J. Chem. Eng. J. 2003, 93, 91–101. 10.1016/S1385-8947(02)00112-2. [DOI] [Google Scholar]
- Geissler K.; Newson E.; Vogel F.; Truong T.-B.; Hottinger P.; Wokaun A. Phys. Chem. Chem. Phys. 2001, 3, 289–293. 10.1039/b004881j. [DOI] [Google Scholar]
- Agrell J.; Birgersson H.; Boutonnet M. J. Power Sources 2002, 106, 249–257. 10.1016/S0378-7753(01)01027-8. [DOI] [Google Scholar]
- Toyir J.; De la Piscina P. R. I.; Fierro J. L. G.; Homs N. Ì. Appl. Catal., B 2001, 29, 207–215. 10.1016/S0926-3373(00)00205-8. [DOI] [Google Scholar]
- Wu J.; Saito M.; Takeuchi M.; Watanabe T. Appl. Catal., A 2001, 218, 235–240. 10.1016/S0926-860X(01)00650-0. [DOI] [Google Scholar]
- Baltes C.; Vukojevia S.; Schath F. J. Catal. 2008, 258, 334–344. 10.1016/j.jcat.2008.07.004. [DOI] [Google Scholar]
- Shukla A. K.; Christensen P. A.; Dickinson A. J.; Hamnett A. J. Power Sources 1998, 76, 54–59. 10.1016/S0378-7753(98)00140-2. [DOI] [Google Scholar]
- Wu H. S.; Chung S. C. J. Comb. Chem. 2007, 9, 990–997. 10.1021/cc070066r. [DOI] [PubMed] [Google Scholar]
- Lindstram B. R.; Pettersson L. J. Int. J. Hydrogen Energy 2001, 26, 923–933. 10.1016/S0360-3199(01)00034-9. [DOI] [Google Scholar]
- Hu J.; Wang Y.; Cao C.; Elliott D. C.; Stevens D. J.; White J. F. Catal. Today 2007, 120, 90–95. 10.1016/j.cattod.2006.07.006. [DOI] [Google Scholar]
- Tanaka Y.; Kawamura C.; Ueno A.; Kotera Y.; Takeuchi K.; Sugi Y. Appl. Catal. 1983, 8, 325–333. 10.1016/0166-9834(83)85003-9. [DOI] [Google Scholar]
- King D. S.; Nix R. M. J. Catal. 1996, 160, 76–83. 10.1006/jcat.1996.0125. [DOI] [Google Scholar]
- Nitta Y.; Suwata O.; Ikeda Y.; Okamoto Y.; Imanaka T. Catal. Lett. 1994, 26, 345–354. 10.1007/BF00810608. [DOI] [Google Scholar]
- Cheng W.-H. Acc. Chem. Res. 1999, 32, 685–691. 10.1021/ar980088+. [DOI] [Google Scholar]
- Cheng W.-H.; Shiau C.-Y.; Liu T. H.; Tung H. L.; Lu J.-F.; Hsu C. C. Appl. Catal., A 1998, 170, 215–224. 10.1016/S0926-860X(98)00055-6. [DOI] [Google Scholar]
- Wu-Hsun C. Appl. Catal., A 1995, 130, 13–30. 10.1016/0926-860X(95)00102-6. [DOI] [Google Scholar]
- Koeppel R. A.; Baiker A.; Schild C.; Wokaun A. Stud. Surf. Sci. Catal. 1991, 63, 59–68. 10.1016/S0167-2991(08)64572-3. [DOI] [Google Scholar]
- Choi Y.; Stenger H. G. Appl. Catal., B. 2002, 38, 259–269. 10.1016/S0926-3373(02)00054-1. [DOI] [Google Scholar]
- Yang Y.; Mims C.; Disselkamp R.; Mei D.; Kwak J.-H.; Szanyi J.; Peden C.; Campbell C. Catal. Lett. 2008, 125, 201–208. 10.1007/s10562-008-9592-4. [DOI] [Google Scholar]
- Yatsu T.; Nishimura H.; Fujitani T.; Nakamura J. J. Catal. 2000, 191, 423–429. 10.1006/jcat.2000.2810. [DOI] [Google Scholar]
- Bailie J. E.; Rochester C. H.; Millar G. J. Catal. Lett. 1995, 31, 333–340. 10.1007/BF00808597. [DOI] [Google Scholar]
- Millar G. J.; Rochester C. H. Catal. Lett. 1992, 14, 289–295. 10.1007/BF00769666. [DOI] [Google Scholar]
- Meitzner G.; Enrique I. Catal. Today 1999, 53, 433–441. 10.1016/S0920-5861(99)00135-2. [DOI] [Google Scholar]
- Robbins J. L.; Iglesia E.; Kelkar C. P.; DeRites B. Catal. Lett. 1991, 10, 1–10. [Google Scholar]
- Breen J. P.; Ross J. R. H. Catal. Today 1999, 51, 521–533. 10.1016/S0920-5861(99)00038-3. [DOI] [Google Scholar]
- Klier K.; Chatikavanij V.; Herman R. G.; Simmons G. W. J. Catal. 1982, 74, 343–360. 10.1016/0021-9517(82)90040-9. [DOI] [Google Scholar]
- Grandjean D.; Pelipenko V.; Batyrev E. D.; Van den Heuvel J. C.; Khassin A. A.; Yurieva T. M.; Weckhuysen B. M. J. Phys. Chem. C 2011, 115, 20175–20191. 10.1021/jp201839s. [DOI] [Google Scholar]
- Nakamura J.; Choi Y.; Fujitani T. Top. Catal. 2003, 22, 277–285. 10.1023/A:1023588322846. [DOI] [Google Scholar]
- Klier K. In Advances in Catalysis; Eley D. D., Pines H., Weisz P. B., Eds.; Academic Press: New York, 1982; Vol. 31, pp 243-313. [Google Scholar]
- Shen W.; Ichihashi Y.; Matsumura Y. Catal. Lett. 2002, 79, 125–127. 10.1023/A:1015334914620. [DOI] [Google Scholar]
- Sakurai H.; Haruta M. Catal. Today 1996, 29, 361–365. 10.1016/0920-5861(95)00305-3. [DOI] [Google Scholar]
- a Bruce D. A.; Bertrand J. A.; White M. G. AIChE J. 1993, 39, 1966. 10.1002/aic.690391207. [DOI] [Google Scholar]; b Beckler R. K.; White M. G. J. Catal. 1986, 102, 252–256. 10.1016/0021-9517(86)90160-0. [DOI] [Google Scholar]; c Kenvin J. C.; White M. G.; Mitchell M. B. Langmuir 1991, 7, 1198–1205. 10.1021/la00054a030. [DOI] [Google Scholar]; d Mitchell M. B.; Vasumathi R. C.; White M. G. Langmuir 1994, 10, 4523–4529. 10.1021/la00024a023. [DOI] [Google Scholar]; e Kurra P.; Kasatkina I.; Girgsdiesa F.; Trunschkea A.; Schlögla R.; Resslerb T. Appl. Catal., A 2008, 348, 153–164. 10.1016/j.apcata.2008.06.020. [DOI] [Google Scholar]
- Spivey J. J.; White M. G. Catalysis 2005, 18, 72–115. 10.1039/9781847553300-00072. [DOI] [Google Scholar]
- Ranaweera S. A.; Henry W. P.; Rowe M. D.; Walters K. B.; White M. G.; Rodriguez J. M. Inorg. Chim. Acta 2014, 423, 281–289. 10.1016/j.ica.2014.07.078. [DOI] [Google Scholar]
- Pike J.; Chan S. W.; Zhang F.; Wang X. Q.; Hanson J. Appl. Catal., A 2006, 303, 273–277. 10.1016/j.apcata.2006.02.008. [DOI] [Google Scholar]
- Flores J. H.; Peixoto D. P. B.; Appel L. G.; De Avillez R. R.; Pais Da Silva M. I. Catal. Today 2011, 172, 218–225. 10.1016/j.cattod.2011.02.063. [DOI] [Google Scholar]
- Brown D. M.; Hsiung T. H.; Rao P.; Roberts G. W. U.S. Patent 4,801,574, Jan 31, 1989.
- Yurieva T. M.; et al. Phys. Chem. Chem. Phys. 2004, 6, 4522–4526. 10.1039/b407728h. [DOI] [Google Scholar]
- Lei H.; Nie R.-F.; Fei J.-H.; Hou Z.-Y. J. Zhejiang Univ., Sci., A 2012, 13, 395–406. 10.1631/jzus.A1100345. [DOI] [Google Scholar]
- Theivasanthi T.; Algar M. Arch. Phys. Res. 2010, 1, 112–117. [Google Scholar]
- Choi Y.; Stenger H.. Fuel Chemistry Division Preprints; American Chemical Society, 2002; Vol. 47, pp 723–724. [Google Scholar]
- White M. G.Heterogeneous Catalysis; Prentice-Hall: Englewood Cliffs, NJ, 1990; pp 3–13. [Google Scholar]
- Kenvin J. C.; White M. G. J. Catal. 1992, 135, 81–91. 10.1016/0021-9517(92)90270-R. [DOI] [Google Scholar]
- Kenvin J. C.; White M. G. J. Catal. 1991, 130, 447–458. 10.1016/0021-9517(91)90127-P. [DOI] [Google Scholar]
- a Maki A. H.; McGarvey B. R. J. Chem. Phys. 1958, 29, 31–34. 10.1063/1.1744456. [DOI] [Google Scholar]; b Dyrek K.; Che M. Chem. Rev. 1997, 97, 305–331. 10.1021/cr950259d. [DOI] [PubMed] [Google Scholar]
- Beckler R. K.; White M. G. J. Catal. 1998, 112, 157–167. 10.1016/0021-9517(88)90129-7. [DOI] [Google Scholar]
- a White M. G. Catal. Today 1993, 18, 73–109. 10.1016/0920-5861(93)80102-7. [DOI] [Google Scholar]; b Van Der Voort P.; Baltes M.; Vansant E. F.; White M. G. Interface Sci. 1997, 5, 209–216. [Google Scholar]
- Choksi H. N.; Zippert A.; Berdahl P.; Bertrand J. A.; Perry D. L.; Mitchell M. B.; White M. G. J. Mol. Catal. A: Chem. 1995, 97, 85–89. 10.1016/1381-1169(94)00065-4. [DOI] [Google Scholar]
- a Casey A. T.; Hoskins B. F.; Whillans F. D. J. Chem. Soc. D 1970, 0, 904–905. 10.1039/C29700000904. [DOI] [Google Scholar]; b Casey A. T. Aust. J. Chem. 1972, 25, 2311–2318. 10.1071/CH9722311. [DOI] [Google Scholar]; c Hoskins B. F.; Whillans F. D. J. Chem. Soc., Dalton Trans. 1975, 1267–1272. 10.1039/dt9750001267. [DOI] [Google Scholar]
- Garribba E.; Micera G.; Sanna D.; Strinna-Erre L. Inorg. Chim. Acta 2000, 299, 253–261. 10.1016/S0020-1693(99)00508-3. [DOI] [Google Scholar]
- Fabian I. Inorg. Chem. 1989, 28, 3805–3807. 10.1021/ic00319a011. [DOI] [Google Scholar]
- Ranaweera S. Ph.D. Thesis, Mississippi State University, MS, 2012. [Google Scholar]
- Herman R. G.; Klier K.; Simmons G. W.; Finn B. P.; Bulko J. B.; Kobylinski T. P. J. Catal. 1979, 56, 407–429. 10.1016/0021-9517(79)90132-5. [DOI] [Google Scholar]
Associated Data
This section collects any data citations, data availability statements, or supplementary materials included in this article.