Abstract
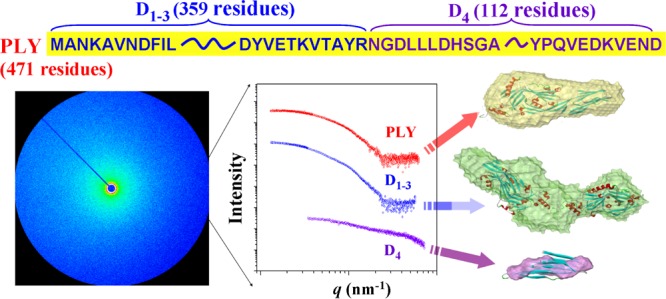
Pneumolysin (PLY) and its truncated fragments, domains 1–3 (D1–3), and domain 4 (D4), were purified as recombinant proteins after being cloned and over-expressed in Escherichia coli. The three-dimensional structures of these proteins were quantitatively investigated in a biomimetic condition, phosphate buffered saline (PBS) by synchrotron X-ray scattering. X-ray scattering analysis revealed important structural features including structural parameters. PLY was present as a monomeric form in PBS. The monomeric form resembled its crystallographic structure with a discrepancy of only 6.3%, confirming that PLY forms a stable structure and, thus, retains its structure in the crystalline state and even in PBS solution. D4 was also present as a monomeric form, but its structure was very different from that of the corresponding part in the crystallographic PLY structure; the discrepancy was 92.0%. Such a dissimilar structure might originate from a less folded-chain conformation. This result suggested that the structure of D4 is highly dependent on the crystalline or solution state and further on the presence or absence of the D1–3 unit. In contrast, D1–3 was dimeric rather than monomeric. Its structure was close to the most probable dimeric form of the corresponding part in the crystallographic PLY structure with 13.1% discrepancy. This fact indicated that the D1–3 unit forms a stable structure and, indeed, such structure is well maintained in the crystalline state as well as in PBS although presented as a dimer. This result further supported that the whole structural stability of PLY is mainly attributed to the structure of D1–3. All of PLY, D1–3, and D4 revealed aggregation tendencies during purification and storage. Overall, the structural characteristics of PLY and its domains in PBS may correlate to the PLY oligomer formation yielding large pore structures for the penetration of cell membranes.
Introduction
Streptococcus pneumoniae is a Gram-positive bacterium, which is known as a major human pathogen causing systemic infections (pneumonia, meningitis, bacteremia) as well as local infections (sinusitis, otitis media).1−8S. pneumoniae has been recognized as the most common causative pathogen of bacterial pneumonia in children (<5 years) and elderly people (>65 years) and is a major cause of morbidity and mortality worldwide.3−8
S. pneumoniae produces several virulence factors including polysaccharide capsules, surface proteins, and pneumolysin.3−8 In particular, pneumolysin (PLY) is a member of the thiol-activated, cholesterol-dependent cytolysin family of toxins and plays a major role in causing invasive pneumococcal infections.3−9 PLY was found to form transmembrane channels in cholesterol-containing membranes of human cells, causing the target cells’ lysis.10−18 For such pore formation on the cell membrane, it was known that 30–50 PLY monomers oligomerize via interaction with cholesterol molecules in cell membranes, forming a very large size ring structure of 260 Å in diameter.11,16,18
PLY is a 53 kDa protein consisting of 471 amino acid residues.19 Its crystal structure was recently determined;16−18 better quality crystals could be achieved when PLY was mutated with substitutions Asp385Asn and Cys432Ala.16 X-ray crystallography analyses confirmed that PLY is composed of four domains (D1, D2, D3, and D4) where D1, D2, and D3 are contiguous and connected to the C-terminal D4 via D2. Its solution structure was further examined.17,20 However, the solution structure was analyzed qualitatively rather than quantitatively. Thus, more detailed structural information on PLY in physiological conditions is necessary not only to understand the pore formation mechanism in human body but also to develop better strategy for drugs and vaccines against pneumococcal infections.
In this study, we investigated three-dimensional (3D) structures of PLY and its domains (D1–3 and D4) in buffer solutions by synchrotron X-ray scattering. It was found that PLY is present in phosphate buffered saline (PBS; pH = 7.4) as a monomer and its 3D structure is similar to the crystal structure, in spite of showing a certain level of mismatch. D4 was also confirmed to be present in solution as a monomer. Its 3D structure was very far from that of the corresponding part in the PLY crystalline structure; the structure seems to be composed of a less folded chain. In contrast, D1–3 tended to form a dimmer rather than a monomer. The structure of D1–3 in the dimeric state revealed to be comparable to that of the most possible dimer constructed from the corresponding domain parts in the PLY crystal structure. PLY and its domains revealed an aggregation tendency in solutions. Such aggregation tendencies may directly relate to the favorable formation of a large size ring structure of PLY oligomers penetrating cell membranes. The ring structure formation may be further significantly promoted by favorable interactions of the D4 unit with cholesterol molecules in the cell membranes.
Results and Discussion
Structural Characteristics of PLY in Solution
Figure 1a is representative of the X-ray scattering data of PLY in PBS at room temperature. The scattering data were analyzed by using the Guinier’s law21 (Figure 2a), giving a radius of gyration Rg,G of 3.20 nm for PLY in PBS (Table 1).
Figure 1.
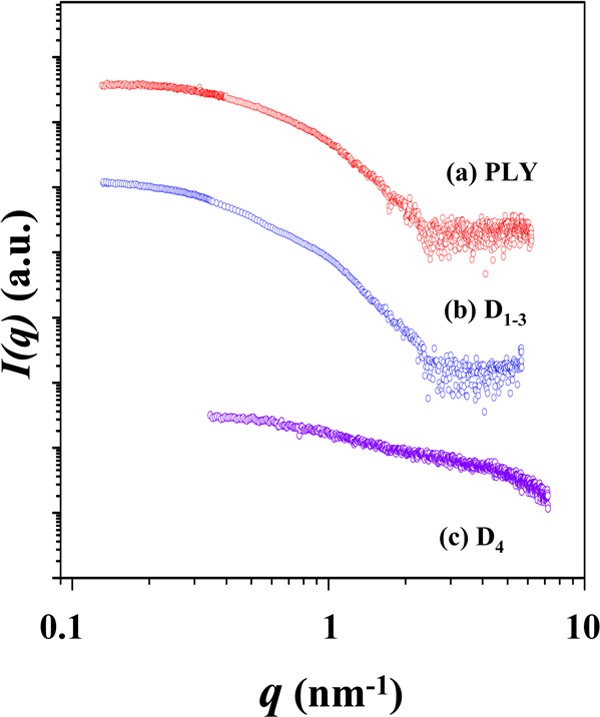
Synchrotron X-ray scattering profiles of PLY and its domains measured in PBS (pH = 7.4) at 25 °C; the concentration used was 3.3 mg/mL for PLY, 4.4 mg/mL for D1–3, and 2.1 mg/mL for D4. For clarity, each scattering profile is shifted along the I(q) axis.
Figure 2.
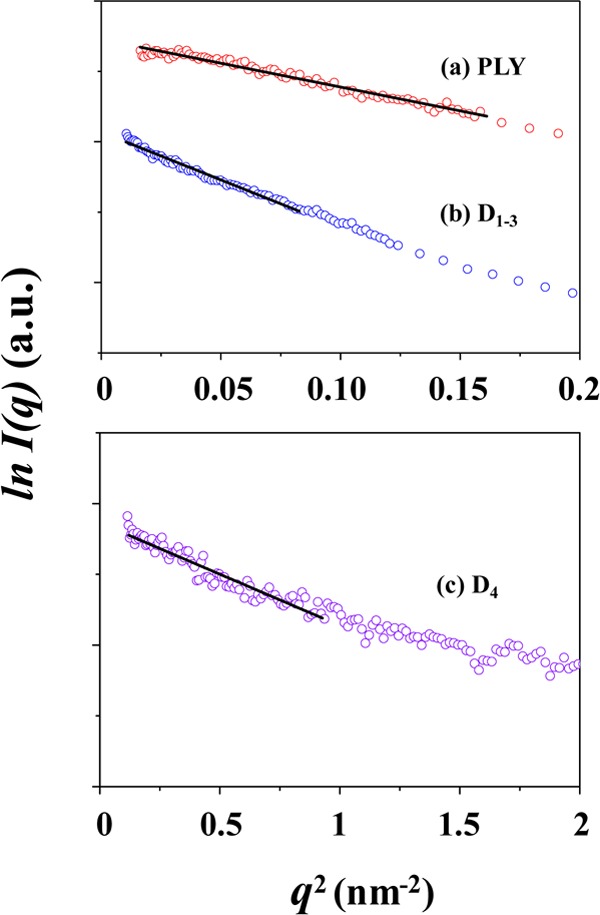
Table 1. Structural Parameters and Molecular Masses Obtained from X-ray Scattering Measurements in PBS Solution and Data Analyses.
| structural characteristic | PLY | D1–3 | D4 |
|---|---|---|---|
| Rg,Ga (nm) | 3.20 (0.16)f | 4.51 (0.12) | 1.48 (0.05) |
| Rg,p(r)b (nm) | 3.48 (0.02) | 4.62 (0.02) | 1.74 (0.01) |
| Dmaxc (nm) | 12.00 (0.01) | 14.80 (0.01) | 7.00 (0.01) |
| Mmd (Da) | 52 900 (300) | 71 800 (300) | 13 900 (200) |
| structure formation | monomer | dimer | monomer |
| structural shape | nonglobular | nonglobular | nonglobular |
| σe (%) | 6.3 | 13.1 | 92.0 |
Rg,G (radius of gyration) obtained from the Guinier analysis of the measured X-ray scattering data.
Rg,p(r) (radius of gyration) obtained from the p(r) function for the measured X-ray scattering data.
Dmax (maximum dimension of the particle) obtained from the p(r) function for the measured X-ray scattering data.
Molecular mass obtained from the analysis of the measured X-ray scattering data using a bovine serum albumin (BSA) standard (Mw,BSA = 66 430 Da).
 where xmi and xc are the ith measured and calculated
data, respectively; here, the measured data were obtained experimentally,
whereas the calculated data were obtained from the atomic coordinates
of the corresponding part(s) in the crystallographic PLY structure
(PDB code 4ZGH).
Standard deviation.
The scattering data were further analyzed using the indirect Fourier transformation (IFT) method.22,23 The analysis results are shown in Figure 3 and Table 1. From the pair distance distribution function p(r) profile obtained by IFT analysis, the radius of gyration Rg,p(r) is determined to be 3.48 nm, which is slightly larger than the Rg,G value; this fact indicates that the Rg,G value was slightly underestimated. The 2Rg,G value is much smaller than the maximum diameter Dmax (12.00 nm), suggesting that PLY has a 3D structure in PBS which is very far from an ideal spherical shape. This deviation is also confirmed in the p(r) profile, which is very different from the symmetric bell-shaped p(r) profile of an ideal sphere (Figure 3b). From the p(r) profile, the radial electron density distribution function ρ(r) was obtained. As shown in Figure 3c, the density reveals a maximum at the center of the structure and then turns to decrease gradually, reaching to a minimum around r = 3 nm (here, r is the distance between the paired scattering elements in PLY); thereafter, the density further varies in an oscillating mode. This density profile characteristics again indicate that the 3D structure of PLY in PBS is far from an ideal spherical shape.
Figure 3.
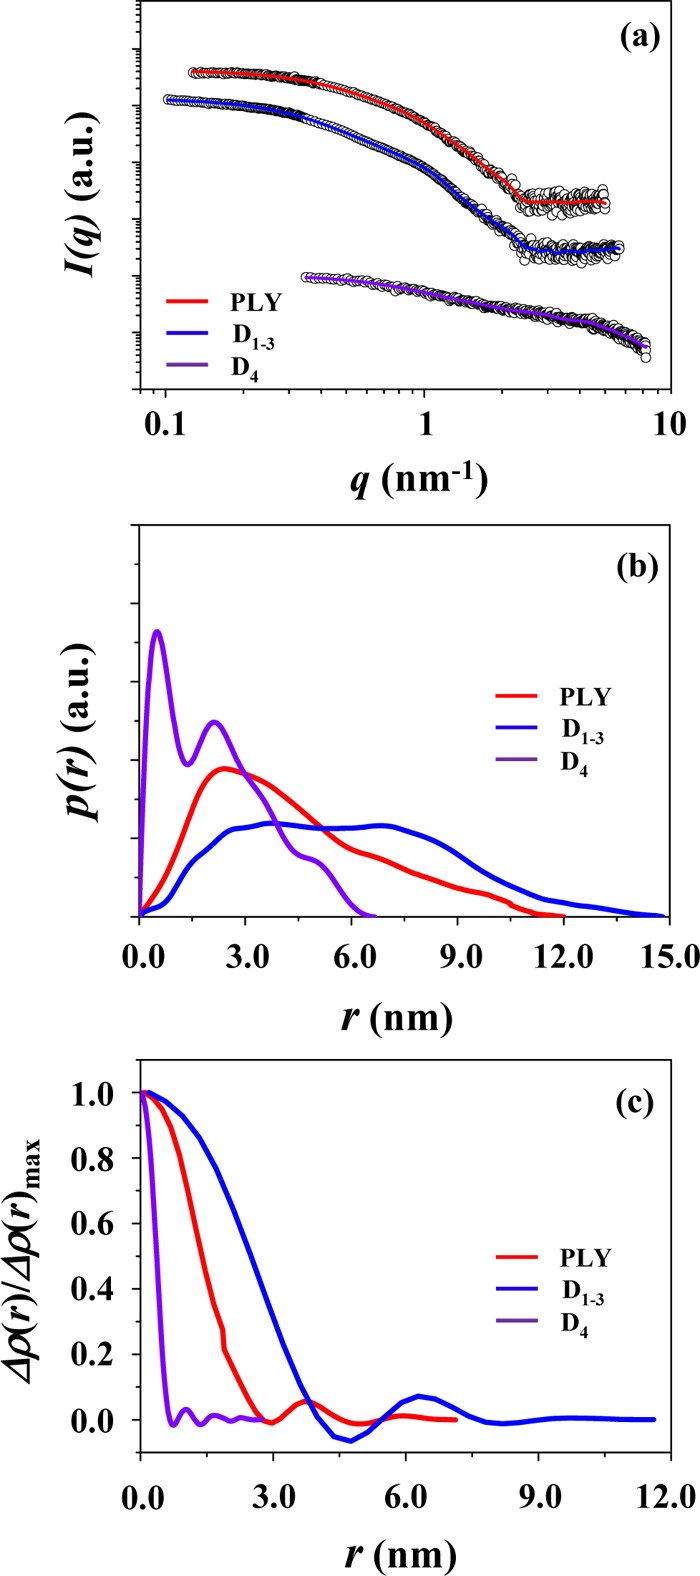
IFT analyses of the X-ray scattering data in Figure 1: (a) the symbols are the experimental data, and the solid lines are the fits obtained from the data analysis; (b) pair distance distribution function p(r) profiles obtained by the data analysis; (c) electron density distribution function ρ(r) profiles obtained by the data analysis, which were normalized to the maximum density.
From the scattering profile, the molecular mass (Mm) of PLY was determined. As shown in Figure 4, the scattering profile, which was measured at a given concentration (3.3 mg/mL), was extrapolated to q = 0, giving the scattering intensity I(q = 0); here, q is the magnitude of the scattering vector defined by q = (4π/λ)sin θ, where 2θ is the scattering angle and λ is the wavelength of the X-ray beam. In the same manner, I(q = 0) was obtained for the BSA standard at a known concentration (2.0 mg/mL). From the extracted I(q = 0) values and the known concentrations, the PLY in PBS was determined to have Mm = 52 900 Da with respect to the molecular weight (Mw,SBA = 66 430 Da) of the bovine serum albumin (BSA) standard (Table 1), according to a method described in the literature.24 Since all the recombinant PLY, D1–3, and D4 proteins contain the two remnant amino acids, glycine (75.07 Da), and proline (115.13 Da), the measured Mm value is very close to the molecular weight (52 899 + 190) of PLY calculated from its amino acid sequences. Indeed, this analysis proves that PLY is present in PBS solution as a monomeric form.
Figure 4.
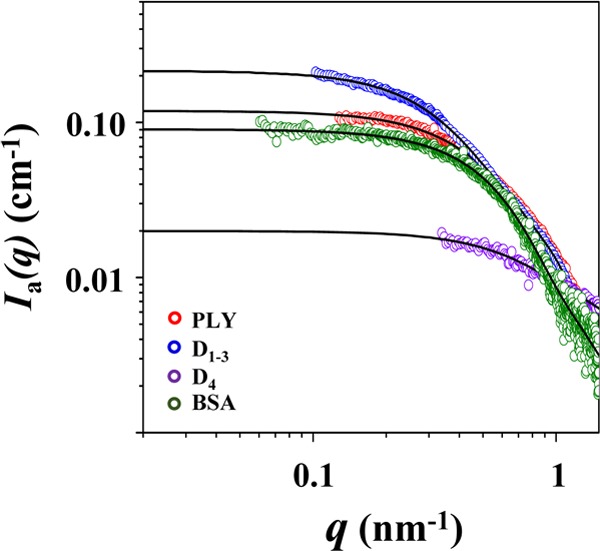
Analyses of the X-ray scattering intensity profiles in the absolute scale, extracting Ia(q = 0) values; here, the absolute scattering intensity profiles were obtained from the X-ray scattering data measured in PBS at 25 °C by using the scattering of water standard. The symbols are the experimental data, and the solid lines are the fits obtained from the data analysis using the IFT method. The concentration used was 3.3 mg/mL for PLY, 4.4 mg/mL for D1–3, 2.1 mg/mL for D4, and 2.0 mg/mL for the BSA standard.
From the X-ray scattering data, the 3D structure of PLY was reconstructed by the ab initio shape-determination analysis using the DAMMIF and GASBOR programs.25,26 Structural analysis was proceeded inside the search volume of Dmax calculated from the p(r) profile. Successive runs of GASBOR on the same data set, starting from the same initial configuration of dummy residues, provided different models for analysis and improvement in the reliability of the final structural solution. When five independent models were generated and compared, the most probable one was selected using the program DAMAVER27 to align all the other models, average the aligned models, compute probability map, and filter the averaged model at a given cut-off volume. The obtained 3D structure of PLY in PBS is displayed in Figure 5a; here, surface rendering of the envelope structure was done by using the program Discovery Studio 2.0 (Accelrys Inc., San Diego, CA). The 3D envelope structure was found to be superimposed well with the crystallographic structure (Figure 5a); the superposition of the envelope structure to the crystallographic structure was carried out by using the program SUPCOMB.28
Figure 5.
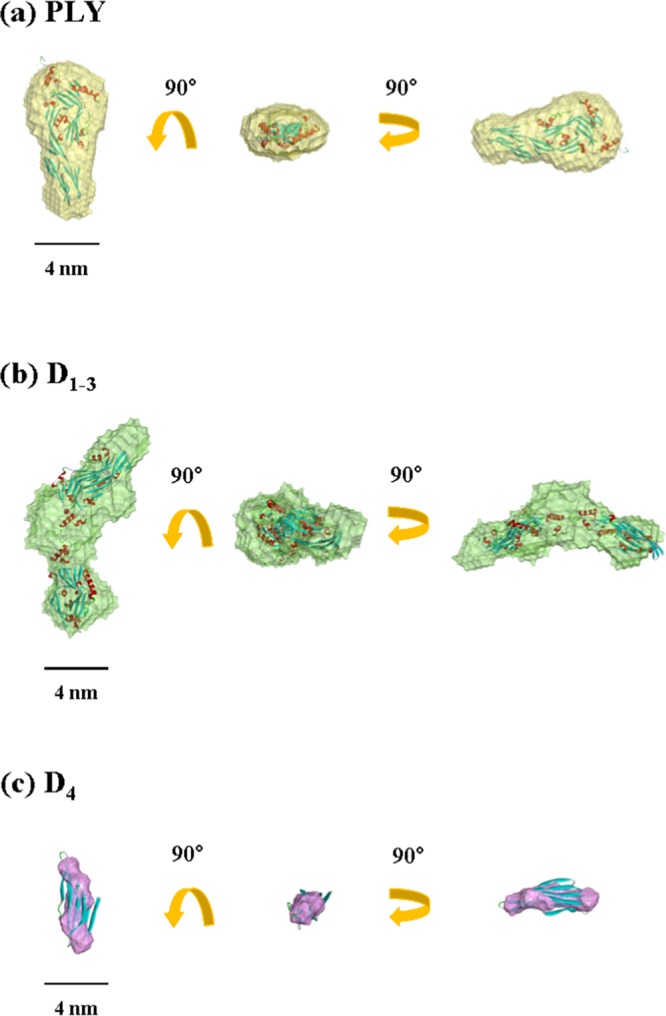
Structural models reconstructed from the analysis results of the measured X-ray scattering data in Figure 1: (a) the structure of PLY in PBS was superimposed with the ribbon diagram for the crystallographic PLY structure (PDB code 4ZGH); (b) the structure of D1–3 in PBS was superimposed with the ribbon diagram for the most possible dimmer of the corresponding unit in the crystallographic PLY structure; (c) the structure of D4 in PBS was superimposed with the ribbon diagram for the corresponding unit in the crystallographic PLY structure.
The X-ray scattering data were further compared with those calculated from the atomic coordinates of the crystallographic PLY structure (PDB code 4ZGH) using the program CRYSOL.29 As shown in Figure 6a, the scattering profile of the solution PLY structure is reasonably well matched with that of the crystallographic structure over q ≤ 0.023 nm–1; they show only 6.3% deviation (=σ) over the considered q range. A reasonably good agreement was confirmed in the pair distribution function profiles (Figure 6b) as well as in the density profiles (Figure 6c).
Figure 6.
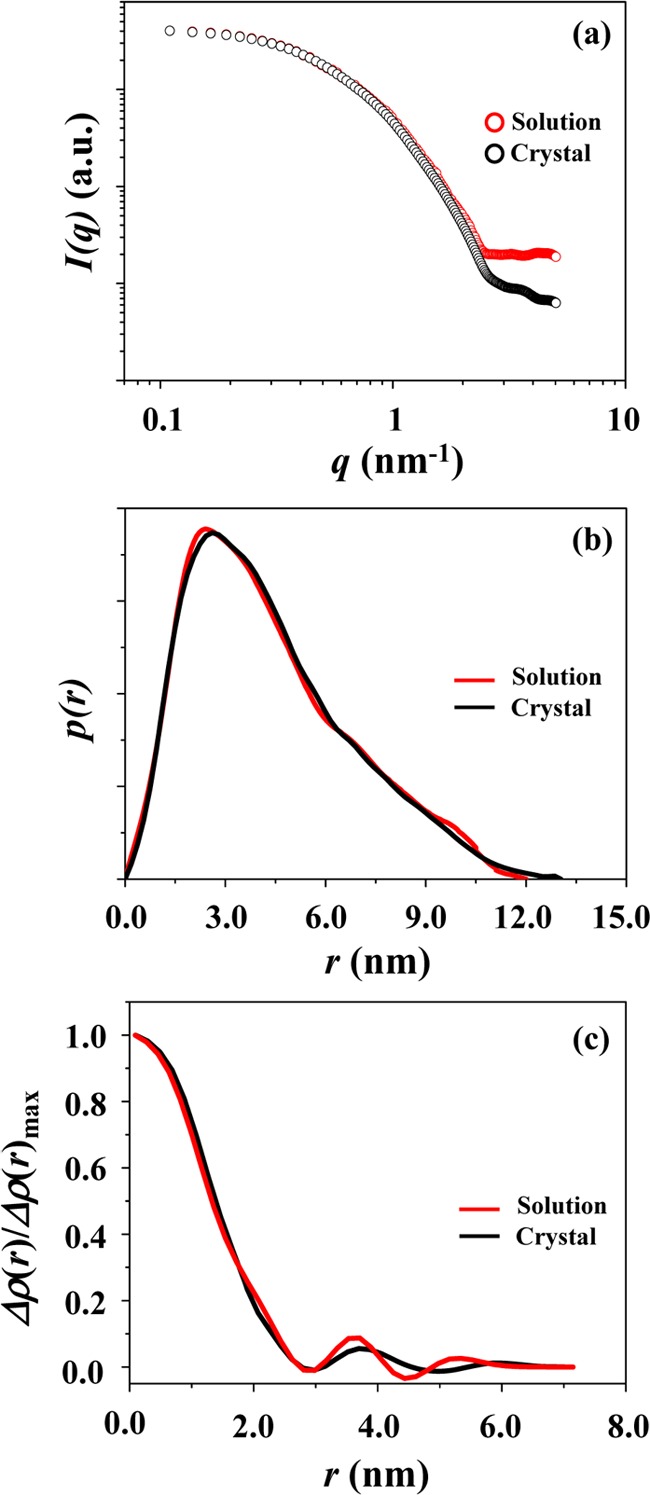
PLY: (a) the X-ray scattering profile (which was obtained by fitting the measured scattering data in Figure 1a using the IFT analysis program (GIFT or GNOM)) is compared with that calculated from the atomic coordinates of the crystallographic PLY structure using the program CRYSOL; (b) the comparison of the pair distance distribution function p(r) profiles obtained from the measured and calculated X-ray scattering data by the IFT analysis; (c) the comparison of the normalized electron density distribution function ρ(r) profiles obtained from the IFT analyses of the measured and calculated X-ray scattering data.
The above X-ray scattering analysis results and their comparisons with the crystallographic structure collectively provide important structural information in the following.
First, PLY reveals a tendency to form a 3D structure as a monomer in PBS. The 3D structure retains in a crystalline state and even in solution. Such structural sustainability indicates that such a 3D structure is quite stable. Due to the structural stability, PLY seems to favorably have structural behavior like a rigid body.
Second, such structural stability and rigidity of PLY may directly relate to its aggregations in buffer solutions. In this study, we have sometimes faced problems with aggregation of PLY during the purification process and even in storage with changing temperature and time. Its aggregation might take place in a manner far from a single crystal formation in a reasonably large size which is commonly required for crystallographic analysis. This situation seemed to cause great difficulties in the structural identification of PLY by X-ray crystallography for a long time. Nevertheless, its crystallographic analysis has recently succeeded due to the continuous research efforts.16,17
Finally, the structurally stable and rigid characteristics of PLY might further relate to its large ring structure formation in cell membranes via the cholesterol-mediated oligomerization reported in the literature.11,16,18 The structurally stable and rigid characteristics may favorably make great contribution to such large ring structure formation via their interaction between the D4 unit and cholesterol units in cell membranes.
Structural Characteristics of D1–3 in Solution
A representative of the X-ray scattering data of D1–3 in PBS is shown in Figure 1b. The analysis results are shown in Figures 2b, 3, 4 and Table 1. The detailed analysis revealed that D1–3 in PBS solution gives radius of gyration Rg,G = 4.51 nm, Rg,p(r) = 4.62 nm, and Dmax = 14.80 nm. The 2Rg values are much smaller than the Dmax value. Surprisingly, the p(r) profile exhibits two broad peaks, which is quite different in shape from those of the proteins in spherical or globular shapes. Moreover, all the structural parameters are relatively larger than those of PLY, although the number of its amino acid residues is lower than that of PLY. The p(r) profile is also quite different from that of PLY. The ρ(r) profile, which was obtained from the p(r) profile, shows a maximum at the center of the structure and then decreases, reaching a minimum around r = 4.7 nm. Thereafter, the ρ(r) continues to vary with r in an oscillating mode. Apparently, the r-dependent variation of the ρ(r) resembles that of PLY. However, the ρ(r) varies in a relatively larger r-scale. Overall, these X-ray scattering characteristics collectively confirm that D1–3 in PBS solution reveals a 3D structure far from the globular or spherical shape as well as from that of PLY in PBS and, furthermore, relatively much larger in size than that of PLY even though it is composed of less amino acids than PLY.
The molecular mass of D1–3 was determined from the scattering profile (Figure 4). D1–3 was found to have Mm = 71 800 Da. This value is larger than that of PLY and further close to twice the molecular weight of D1–3 calculated from its amino acid residues. Together with the scattering characteristics and structural parameters, the Mw value suggests that D1–3 is present in PBS solution as a dimeric form rather than a monomer.
From the X-ray scattering data, the 3D structure of D1–3 was attempted to reconstruct by ab initio shape-determination analysis. The obtained 3D envelope structure was further attempted to superimpose with a possible dimeric form (Figure 7) of the D1–3 structural unit separated from the crystallographic PLY. As shown in Figure 5b, the 3D structure of D1–3 in PBS is reasonably superimposed with the dimeric form of the corresponding unit in the crystallographic PLY structure, but still shows a certain level of mismatch.
Figure 7.
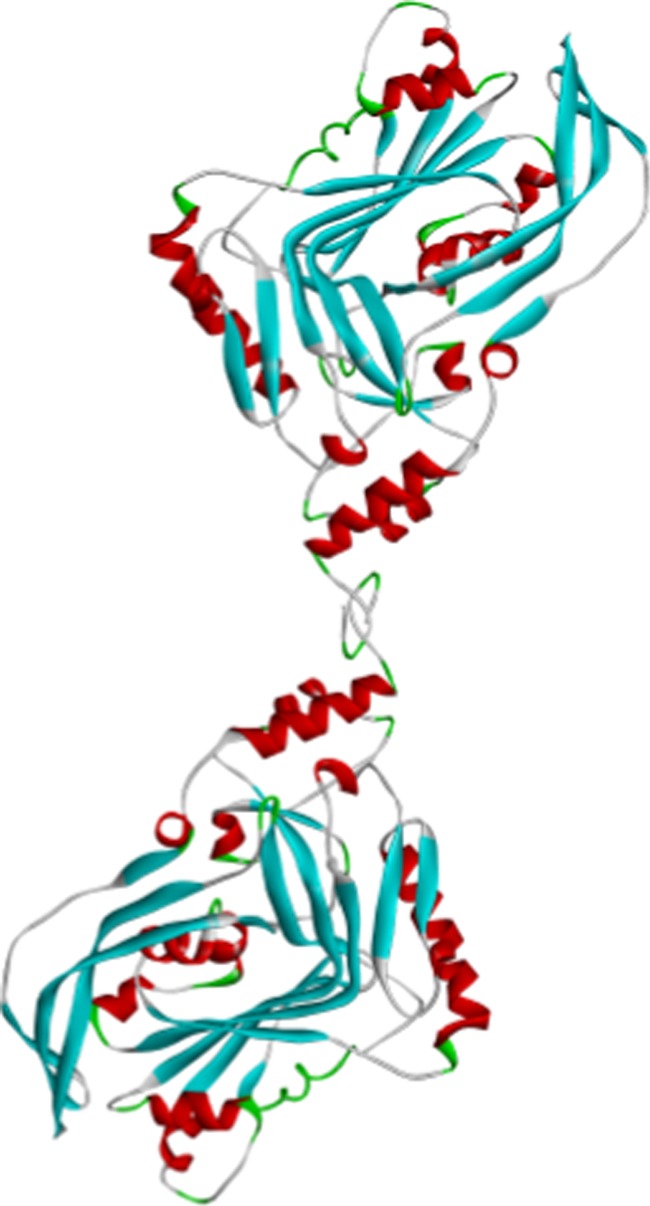
Most possible dimeric structure of D1–3 in PBS; here, the ribbon diagram of a single D1–3 was extracted from the crystallographic PLY structure.
To find the degree of such mismatch, an X-ray scattering profile was calculated from the atomic coordinates of the crystallographic D1–3 unit in a most probable dimeric form (Figure 7) and then compared with the experimentally measured scattering profile. The mismatch was found to be σ = 13.1% over the range of q ≤ 0.025 nm–1 (Figure 8a). A certain level of structural difference was further confirmed in the p(r) profiles as well as in the ρ(r) profiles (Figure 8b,c).
Figure 8.
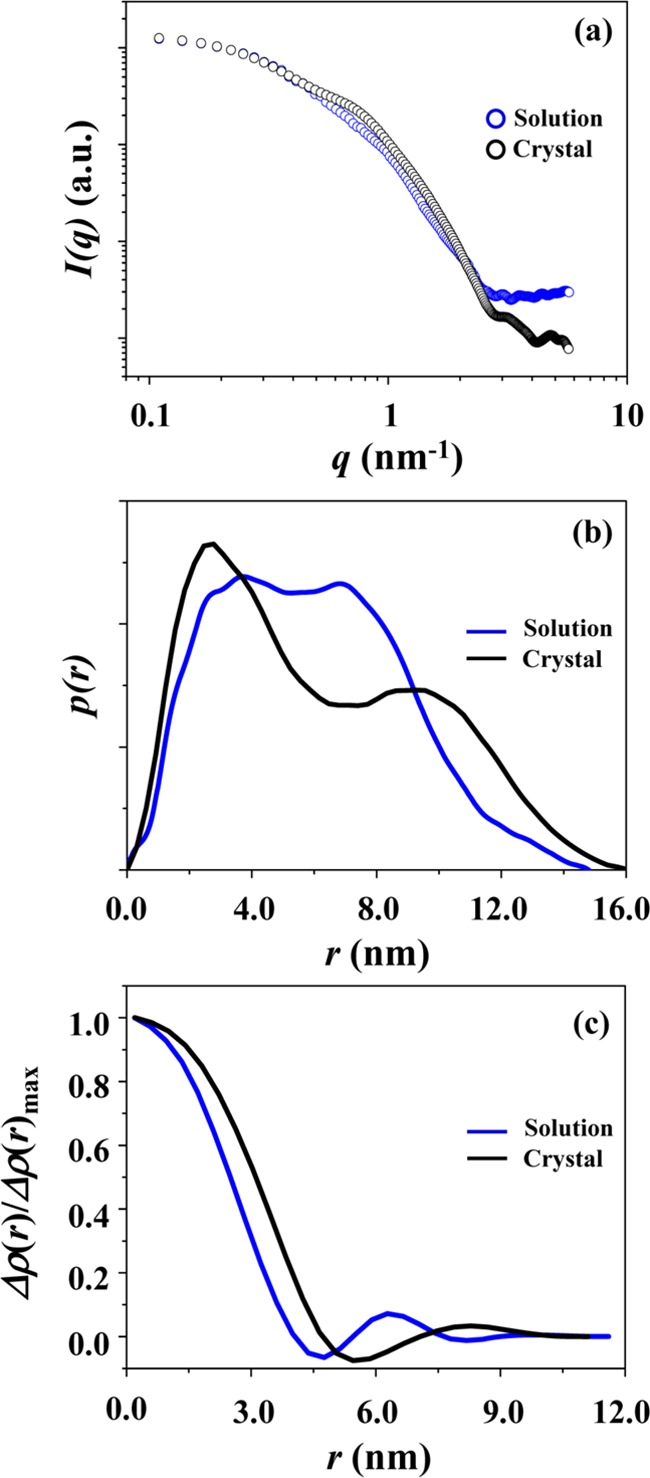
D1–3: (a) the X-ray scattering profile (which was obtained by fitting the measured scattering data in Figure 1b using an IFT analysis program (GIFT or GNOM)) is compared with that calculated from the atomic coordinates for the most possible dimer (Figure 7) of the corresponding part in the crystallographic PLY structure using the program CRYSOL. (b) The comparison of the pair distance distribution function p(r) profiles obtained from the measured and calculated X-ray scattering data by the IFT analysis. (c) The comparison of the normalized electron density distribution function ρ(r) profiles obtained from the IFT analyses of the measured and calculated X-ray scattering data.
X-ray scattering analysis results collectively provide some key structural information on D1–3 in PBS solution as follows. D1–3 prefers to be present in PBS as a dimeric form rather than a monomer. This dimer formation characteristic may relate closely to an aggregation tendency of PLY often observed in several buffer solutions used during purification and storage. The 3D structure of D1–3 in PBS is apparently similar to the most probable dimeric structure of the corresponding domain unit of the crystallographic PLY structure, although a certain extent of mismatch is found. These results confirm that the individual D1–3 units of the dimeric form in PBS are almost identical to the structure of the corresponding part of PLY in the crystallographic state. This fact confirms that the D1–3 unit is structurally stable and, therefore, can retain its structure in PBS in addition to the crystalline state. Such structural stability of the D1–3 unit can contribute greatly to the overall structural stability of PLY.
Structural Characteristics of D4 in Solution
A representative of the X-ray scattering data of D4 in PBS is shown in Figure 1c. The scattering profile was quite different from those of PLY and D1–3. The analysis results are illustrated in Figures 2c, 3, 4 and Table 1. D4 reveals Rg,G = 1.48 nm, Rg,p(r) = 1.74 nm, and Dmax = 7.00 nm. The Rg,G value is slightly smaller than Rg,p(r). These structural parameters are much smaller than those of PLY and D1–3. The p(r) profile is also very far in shape from those of PLY and D1–3. Moreover, the Dmax value is almost 2 times larger than 2Rg. The ρ(r) profile shows variations with r, which is similar to those observed for PLY and D1–3; however, such variations took place in a much shorter length scale, when compared to those of PLY and D1–3. Its molecular mass is only 13 900 Da, which is in good agreement with the molecular weight calculated from the amino acid residues. These results collectively show that the structure of D4 is relatively much smaller due to its low molecular weight and the structure is very much different from globular or spherical shape.
Figure 5c shows a 3D structure of D4 in PBS, which was reconstructed by the ab initio shape-determination analysis of the X-ray scattering data. We attempted to superimpose the obtained 3D structure with that of the D4 unit in the crystallographic PLY structure. However, it was found that the structure of D4 in PBS solution significantly mismatched with that of the corresponding crystallographic domain. Such severe mismatch is due to its chain conformation far from the more folded conformation in the crystallographic PLY structure.
The structural difference is again confirmed in the X-ray scattering profiles; here, the scattering data of the D4 unit in the crystalline state were calculated from its atomic coordinates in the crystallographic PLY structure. The X-ray scattering profile of D4 in the solution is highly mismatched with that of the corresponding domain in the PLY crystal, as shown in Figure 9a. The mismatch is 92.0% (=σ) over the measured q range. The large mismatch is further found in the p(r) profiles as well as in the ρ(r) profiles (Figure 9b,c).
Figure 9.
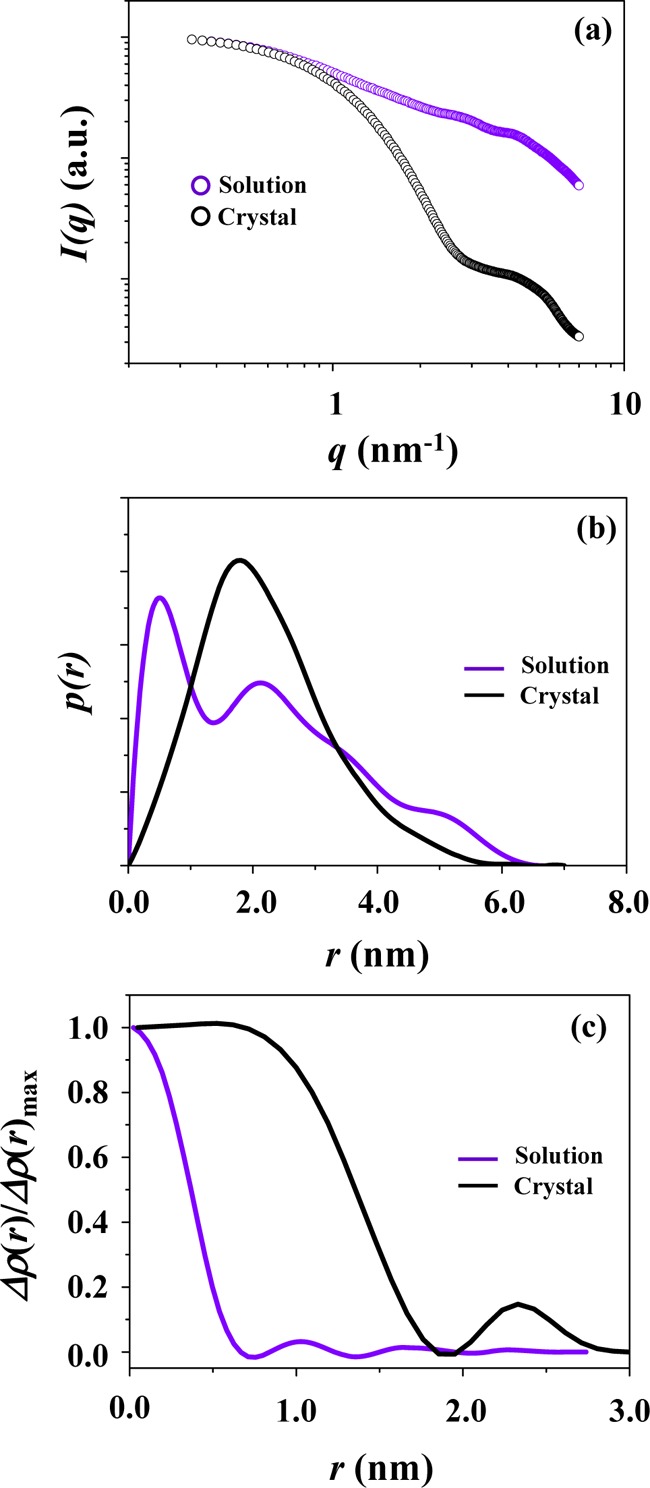
D4: (a) the X-ray scattering profile (which was obtained by fitting the measured scattering data in Figure 1c using the IFT analysis program (GIFT or GNOM)) is compared with that calculated from the atomic coordinates of the corresponding unit in the crystallographic PLY structure using the program CRYSOL. (b) The comparison of the pair distance distribution function p(r) profiles obtained from the measured and calculated X-ray scattering data by the IFT analysis. (c) The comparison of the normalized electron density distribution function ρ(r) profiles obtained from the IFT analyses of the measured and calculated X-ray scattering data.
Overall, these analysis results provide the following key structural features.
First, D4 tends to form a 3D structure as a monomer. The 3D structure is quite different from that of the corresponding unit in the crystallographic PLY structure.
Second, D4 exhibits a less folded structure in PBS. Such a structure seems to favor under the conditions without the assistance or cooperation of the D1–3 unit; namely, the presence and cooperation of the D1–3 unit may be necessary to a more folded structure formation of the D4 unit in both solution and crystalline states.
Finally, D4 in PBS solution has often exhibited serious aggregation behavior in spite of its monomeric structure formation with a less folded or completely unfolded chain characteristics. This result indicates that D4 has a certain level of tendency to aggregate with the less folded or completely unfolded chain characteristics in the monomeric form. Such aggregation tendency of D4 may inherently contribute to the aggregation in solution and the large ring structure formation on the cell membrane surface of PLY. The ring structure formation of PLY could be significantly promoted by the constructive interaction of the D4 unit with the cholesterol molecules at the cell membrane.
Conclusions
PLY, a cytolytic toxin of S. pneumoniae, and its truncated fragments (D1–3 and D4) were purified as recombinant proteins after being cloned and over-expressed in Escherichia coli. PLY and its domains were investigated from the view of 3D structures in PBS, a biomimetic condition, by synchrotron X-ray scattering. The quantitative X-ray scattering analysis produced structural parameters and features for PLY and its domains in PBS. The important structural features were found as follows.
First, PLY and D4 are monomeric respectively, whereas D1–3 is dimeric.
Second, PLY reveals a structure, which resembles the crystallographic structure; the structural mismatch is only 6.3%. These results confirm that the monomeric PLY is structurally stable and rigid and, consequently, retains its own structure in both solution and crystalline states.
Third, D4 reveals a structure far from that of the corresponding part in the crystallographic PLY structure; the structural mismatch is huge, 92.0%. Such huge structural mismatch suggests that D4 exhibits a less folded-chain conformation rather than a folded-chain conformation observed in the crystallographic PLY structure.
Fourth, the dimeric D1–3 exhibits a 3D structure resembling the most probable dimeric form of the corresponding part in the crystallographic PLY structure; the structural mismatch is 13.1%. The results show that the D1–3 unit is structurally stable and further retains its structure well in the buffer solution in addition to the crystalline state. Such structural stability of the D1–3 unit can contribute greatly to the overall structural stability of PLY.
Finally, in buffer solution PLY and D1–3 were found to sometimes aggregate, whereas D4 was often aggregated. Such aggregation behaviors may directly relate to the favorable formation of a large size ring structure of PLY on cell membranes. The ring structure formation may be further significantly promoted by favorable interactions of the D4 unit with the hydroxyl group of cholesterol at the cell membrane surface.
Materials and Methods
Expression and Purification of Recombinant PLY and Its Domains
DNA fragments encoding PLY and its domains were cloned from S. pneumoniae D39 strain by the polymerase chain reaction into an expression vector pGEX-6P-2. The recombinant PLY (471 amino acids), D1–3 (359 amino acids),30,31 and D4 (112 amino acids)30,31 were expressed as fusion proteins to glutathione-S-transferase (GST) for affinity purification and then cleaved by a specific protease leaving two extra amino acids (glycine and proline) at the N-termini of PLY and its domains. To purify the recombinant proteins, E. coli BL21 (DE3) strain carrying the cloned PLY or domains in the pGEX-6P-2 vector was grown on an OD600 of 0.6–0.8 and induced with 0.5 mM IPTG for 2 h at 30 °C with vigorous shaking. Cells were harvested by centrifugation, resuspended in phosphate-based bacterial protein extraction reagent (Cell Biolabs, San Diego, CA) and lysed at room temperature. The cell debris was removed by centrifugation at 10 000 × g for 30 min. For the affinity purification of the recombinant PLY, D1–3, and D4, manufacturers’ instructions were followed. Briefly, the total cell lysate was loaded onto a glutathione-Sepharose 4B column (GE healthcare, Pittsburgh, PA) pre-equilibrated with PBS (pH = 7.4). After washing the column with PBS and then with 50 mM Tris–HCl (pH 8), GST fusion proteins were eluted using 10 mM reduced glutathione (Sigma-Aldrich Co., St. Louis, MO) in 50 mM Tris–HCl (pH 8). The eluted GST fusion proteins were specifically cleaved by PreScission protease (GE healthcare) in cleavage buffer (50 mM Tris–HCl, 150 mM NaCl, 1 mM ethylenediaminetetraacetic acid, 1 mM dithiothreitol, pH 7.0) at 4 °C overnight. PLY, D1–3, and D4 were further purified by affinity chromatography on glutathione-Sepharose 4B column to remove the GST tag and PreScission enzyme, and then concentrated using Amicon ultracentrifugal filters (Merck Millipore, Billerica, MA) to final concentrations of 2–5 mg/mL in PBS: 3.3 mg/mL for PLY, 4.4 mg/mL for D1–3, and 2.1 mg/mL for D4. SDS-PAGE was performed to follow each purification step and to check the purity of the prepared proteins.
Synchrotron X-ray Scattering Measurement and Data Analysis
Synchrotron X-ray scattering measurements were carried out at the 4C SAXS beamline (BL)32−36 of the Pohang Accelerator Laboratory (PAL) at the Pohang University of Science and Technology, Korea. The monochromatized X-ray beam with a wavelength λ of 0.6753 Å was employed and a two-dimensional (2D) charge-coupled detector (model Rayonix 2D MAR, Evanston, IL) was used. The sample-to-detector distances were 3931.8 and 1039.0 mm. Scattering angles were calibrated by using a silver behenate standard (TCI, Tokyo, Japan) and a pre-calibrated polystyrene-block-poly(ethylene-ran-butylene)-block-polystyrene standard. Each protein solution was filtered through a disposable syringe equipped with a poly(tetrafluoroethylene) filter of 0.2 μm pore size before measurements; in most of the PLY and D1–3 solutions, filtrations were not necessary. Scattering data were collected at 25 °C for 10 s.
Each 2D scattering pattern was circularly averaged from the beam center, normalized to the transmitted X-ray beam intensity (monitored with a scintillation counter placed behind the sample), and further corrected for scattering arising from the PBS solution used. The obtained X-ray scattering data were initially analyzed by using the Guinier’s law,21 giving radius of gyration (Rg,G). Then, the X-ray scattering data were analyzed using the IFT method,22,23 providing pair distance distribution function p(r) profiles; in these analyses, the GIFT program22 or the GNOM program23 was used. p(r) can be expressed as follows
| 1 |
where, I(q) is the scattered X-ray intensity, q is the magnitude of the scattering vector defined by q = (4π/λ)sin θ, 2θ is the scattering angle, λ is the wavelength of the X-ray beam, and r is the distance between the paired scattering elements in PLY or its domains. From the p(r) profile, the radius of gyration Rg,p(r) and maximum diameter Dmax of the given biomacromolecule can be extracted; here, Rg,p(r) can be expressed by the following equation
| 2 |
From the p(r) profile, the radial electron density distribution function ρ(r) was additionally extracted by using the DECON program.22
The X-ray scattering data were further analyzed to determine the molecular mass Mm of each protein. From the X-ray scattering profile, Mm can be obtained using the following relation24
| 3 |
where c is the concentration of protein, Mw,BSA is the molecular weight of bovine serum albumin (BSA) standard (Mw,SBA = 66 430 Da; Sigma-Aldrich, St. Louis, MO), and cBSA is the concentration of BSA standard. Here, it is assumed that the proteins of this study have partial specific volumes same as or close to that of BSA because most of the proteins are known to have very similar partial specific volumes; proteins reveal an averaged partial specific volume ν̅ of 0.7425 cm3/g.24Ia(q = 0) and Ia,BSA(q = 0) are the absolute intensities of protein and BSA standard at q = 0, respectively. Ia(q = 0) was obtained by extrapolating the scattering profile of protein to q = 0 using the GIFT program22 or GNOM program.23 In the same manner, Ia,BSA(q = 0) was obtained from the scattering profile of BSA standard. The scattering intensity profiles in the absolute scale were obtained from the measured scattering data using the absolute scattering intensity of water (Ia,water(q = 0) = 1.632 × 10⁻² cm–1 at 25 °C24,37)
| 4 |
and
| 5 |
where, Iwater(q = 0) is the measured scattering intensity of water at q = 0, which is obtained by extrapolating the scattering profile to q = 0, and I(q) and IBSA(q) are the measured scattering profiles of protein and BSA standard respectively.
To obtain a 3D structure, the X-ray scattering data were additionally analyzed by using ab initio shape-determination programs (DAMMIF25 and GASBOR26). In addition, the X-ray scattering profile of PLY in the crystalline state was calculated from its atomic coordinates obtained from the Protein Data Bank (PDB code: 4ZGH).16,17
Acknowledgments
This study was supported by the National Research Foundation of Korea (Haeksim Program 2015R1A2A2A2A01005642).
The authors declare no competing financial interest.
References
- Neufeld F.; Schnitzler R.. Pneumokokken Handbuch der Pathogenen Mikro-organismen, 3rd ed.; Gustav Fischer: Berlin, Germany, 1928. [Google Scholar]
- Griffith F. The significance of pneumococcal types. J. Hyg. 1928, 27, 113–159. 10.1017/s0022172400031879. [DOI] [PMC free article] [PubMed] [Google Scholar]
- Garcia-Bustos J. F.; Tomasz A. Teichoic acid-containing muropeptides from Streptococcus pneumoniae as substrates for the pneumococcal autolysin. J. Bacteriol. 1987, 169, 447–453. 10.1128/jb.169.2.447-453.1987. [DOI] [PMC free article] [PubMed] [Google Scholar]
- Mosser J. L.; Tomasz A. Choline-containing teichoic acid as a structural component of pneumococcal cell wall and its role in sensitivity to lysis by an autolytic enzyme. J. Biol. Chem. 1970, 245, 287–298. [PubMed] [Google Scholar]
- Alonso De Velasco E.; Verheul A. F.; Verhoef J.; Snippe H. Streptococcus pneumoniae: Virulence factors, pathogenesis, and vaccines. Microbiol. Rev. 1995, 59, 591–603. [DOI] [PMC free article] [PubMed] [Google Scholar]
- Hirst R. A.; Kadioglu A.; O’Callaghan C.; Andrew P. W. The role of pneumolysin in pneumococcal pneumonia and meningitis. Clin. Exp. Immunol. 2004, 138, 195–201. 10.1111/j.1365-2249.2004.02611.x. [DOI] [PMC free article] [PubMed] [Google Scholar]
- Bogaert D.; De Groot R.; Hermans P. W. Streptococcus pneumoniae colonisation: The Key to pneumococcal disease. Lancet Infect. Dis. 2004, 4, 144–154. 10.1016/S1473-3099(04)00938-7. [DOI] [PubMed] [Google Scholar]
- Rossjohn J.; Gilbert R. J. C.; Crane D.; Morgan P. J.; Mitchell T. J.; Rowe A. J.; Andrew P. W.; Paton J. C.; Tweten R. K.; Parker M. W. The molecular mechanism of pneumolysin, a virulence factor from Streptococcus pneumoniae. J. Mol. Biol. 1998, 284, 449–461. 10.1006/jmbi.1998.2167. [DOI] [PubMed] [Google Scholar]
- Mitchell A. M.; Mitchell T. J. Streptococcus pneumoniae: Virulence factors and variation. Clin. Microbiol. Infect. 2010, 16, 411–418. 10.1111/j.1469-0691.2010.03183.x. [DOI] [PubMed] [Google Scholar]
- Gilbert R. J. C.; Rossjohn J.; Parker M. W.; Tweten R. K.; Morgan P. J.; Mitchell T. J.; Errington N.; Rowe A. J.; Andrew P. W.; Byron O. Self-interaction of pneumolysin, the pore-forming protein toxin of Streptococcus pneumoniae. J. Mol. Biol. 1998, 284, 1223–1237. 10.1006/jmbi.1998.2258. [DOI] [PubMed] [Google Scholar]
- Gilbert R. J. C.; Jimenez J. L.; Chen S.; Tickle I. J.; Rossjohn J.; Parker M.; Andrew P. W.; Saibil H. R. Two structural transitions in membrane pore formation by pneumolysin, the pore-forming toxin of Streptococcus pneumoniae. Cell 1999, 97, 647–655. 10.1016/S0092-8674(00)80775-8. [DOI] [PubMed] [Google Scholar]
- Gilbert R. J. C.; Heenan R. K.; Timmins P. A.; Gingles N. A.; Mitchell T. J.; Rowe A. J.; Rossjohn J.; Parker M. W.; Andrew P. W.; Byron O. Studies on the structure and mechanism of a bacterial protein toxin by analytical ultracentrifugation and small-angle neutron scattering. J. Mol. Biol. 1999, 293, 1145–1160. 10.1006/jmbi.1999.3210. [DOI] [PubMed] [Google Scholar]
- Gilbert R. J. C. Pore-forming toxins. Cell. Mol. Life Sci. 2002, 59, 832–844. 10.1007/s00018-002-8471-1. [DOI] [PMC free article] [PubMed] [Google Scholar]
- Tilley S. J.; Orlova E. V.; Gilbert R. J. C.; Andrew P. W.; Saibil H. R. Structural basis of pore formation by the bacterial toxin pneumolysin. Cell 2005, 121, 247–256. 10.1016/j.cell.2005.02.033. [DOI] [PubMed] [Google Scholar]
- Sonnen A. F.-P.; Plitzko J. M.; Gilbert R. J. C. Incomplete pneumolysin oligomers form membrane pores. Open Biol. 2014, 4, 140044 10.1098/rsob.140044. [DOI] [PMC free article] [PubMed] [Google Scholar]
- Marshall J. E.; Faraj B. H. A.; Gingras A. R.; Lonnen R.; Sheikh M. A.; El-Mezgueldi M.; Moody P. C. E.; Andrew P. W.; Wallis R. The crystal structure of pneumolysin at 2.0 Å resolution reveals the molecular packing of the pre-pore complex. Sci. Rep. 2015, 5, 13293 10.1038/srep13293. [DOI] [PMC free article] [PubMed] [Google Scholar]
- Lawrence S. L.; Feil S. C.; Morton C. J.; Farrand A. J.; Mulhern T. D.; Gorman M. A.; Wade K. R.; Tweten R. K.; Parker M. W. Crystal structure of Streptococcus pneumoniae pneumolysin provides key insights into early steps of pore formation. Sci. Rep. 2015, 5, 14352 10.1038/srep14352. [DOI] [PMC free article] [PubMed] [Google Scholar]
- van Pee K.; Mulvihill E.; Müller D. J.; Yildiz Ö. Unraveling the pore-forming steps of pneumolysin from Streptococcus pneumoniae. Nano Lett. 2016, 16, 7915–7924. 10.1021/acs.nanolett.6b04219. [DOI] [PubMed] [Google Scholar]
- Walker J. A.; Allen R. L.; Falmagne P.; Johnson M. K.; Boulnois G. J. Molecular cloning, characterization, and complete nucleotide sequence of the gene for pneumolysin, the sulfhydryl-activated toxin of Streptococcus pneumoniae. Infect. Immun. 1987, 55, 1184–1189. [DOI] [PMC free article] [PubMed] [Google Scholar]
- Solovyova A. S.; Nöllmann M.; Mitchell T. J.; Byron O. The solution structure and oligomerization behavior of two bacterial toxins: Pneumolysin and perfringolysin O. Biophys. J. 2004, 87, 540–552. 10.1529/biophysj.104.039974. [DOI] [PMC free article] [PubMed] [Google Scholar]
- Guinier A.; Fournet G.. Small Angle Scattering X-Ray; Wiley: New York, 1955. [Google Scholar]
- Glatter O. J. A new method for the evaluation of small-angle scattering data. J. Appl. Crystallogr. 1977, 10, 415–421. 10.1107/S0021889877013879. [DOI] [Google Scholar]
- Svergun D. I. Determination of the regularization parameter in indirect-transform methods using perceptual criteria. J. Appl. Crystallogr. 1992, 25, 495–503. 10.1107/S0021889892001663. [DOI] [Google Scholar]
- Mylonas E.; Svergun D. I. Accuracy of molecular mass determination of proteins in solution by small-angle X-ray scattering. J. Appl. Crystallogr. 2007, 40, s245–s249. 10.1107/S002188980700252X. [DOI] [Google Scholar]
- Franke D.; Svergun D. I. DAMMIF, a program for rapid ab-initio shape determination in small-angle scattering. J. Appl. Crystallogr. 2009, 42, 342–346. 10.1107/S0021889809000338. [DOI] [PMC free article] [PubMed] [Google Scholar]
- Svergun D. I.; Petoukhov M. V.; Koch M. H. Determination of domain structure of proteins from X-ray solution scattering. Biophys. J. 2001, 80, 2946–2953. 10.1016/S0006-3495(01)76260-1. [DOI] [PMC free article] [PubMed] [Google Scholar]
- Volkov V. V.; Svergun D. I. Uniqueness of ab initio shape determination in small-angle scattering. J. Appl. Crystallogr. 2003, 36, 860–864. 10.1107/S0021889803000268. [DOI] [PMC free article] [PubMed] [Google Scholar]
- Kozin M. B.; Svergun D. I. Automated matching of high-and low-resolution structural models. J. Appl. Crystallogr. 2001, 34, 33–41. 10.1107/S0021889800014126. [DOI] [Google Scholar]
- Svergun D.; Barberato C.; Koch M. H. J. CRYSOL—a program to evaluate X-ray solution scattering of biological macromolecules from atomic coordinates. J. Appl. Crystallogr. 1995, 28, 768–773. 10.1107/S0021889895007047. [DOI] [Google Scholar]
- Tweten R. K. Nucleotide sequence of the gene for perfringolysin O (theta-toxin) from Clostridium perfringens: Significant homology with the genes for streptolysin O and pneumolysin. Infect. Immun. 1988, 56, 3235–3240. [DOI] [PMC free article] [PubMed] [Google Scholar]
- Rossjohn J.; Feil S. C.; McKinstry W. J.; Tweten R. K.; Parker M. W. Structure of a cholesterol-binding, thiol-activated cytolysin and a model of its membrane form. Cell 1997, 89, 685–692. 10.1016/S0092-8674(00)80251-2. [DOI] [PubMed] [Google Scholar]
- Yoon J.; Kim K.-W.; Kim J.; Heo K.; Jin K. S.; Jin S.; Shin T. J.; Lee B.; Rho Y.; Ahn B.; Ree M. Small-angle X-ray scattering station 4C2 BL of Pohang Accelerator Laboratory for advance in Korean Polymer Science. Macromol. Res. 2008, 16, 575–585. 10.1007/BF03218563. [DOI] [Google Scholar]
- Kim K.-W.; Kim J.; Yun Y. D.; Ahn H.; Min B.; Kim N. H.; Rah S.; Kim H.-Y.; Lee C.-S.; Seo I. D.; Lee W.-W.; Choi H. J.; Jin K. S. Small-angle X-ray scattering beamline BL4C SAXS at Pohang Light Soruce II. Biodesign 2017, 5, 24–29. [Google Scholar]
- Ree B. J.; Satoh Y.; Jin K. S.; Isono T.; Kim W. J.; Kakuchi T.; Satoh T.; Ree M. Well-defined and stable nanomicelles self-assembled from brush cyclic and tadpole copolymer amphiphiles: A versatile smart carrier platform. NPG Asia Mater. 2017, 9, e453 10.1038/am.2017.205. [DOI] [Google Scholar]
- Kim M.; Rho Y.; Jin K. S.; Ahn B.; Jung S.; Kim H.; Ree M. pH-dependent structures of ferritin and apoferritin in solution: Disassembly and reassembly. Biomacromolecules 2011, 12, 1629–1640. 10.1021/bm200026v. [DOI] [PubMed] [Google Scholar]
- Jin K. S.; Shin S. R.; Ahn B.; Jin S.; Rho Y.; Kim H.; Kim S. J.; Ree M. Effect of C60 fullerene on the duplex formation of i-Motif DNA with complementary DNA in solution. J. Phys. Chem. B 2010, 114, 4783–4788. 10.1021/jp9122453. [DOI] [PubMed] [Google Scholar]
- Orthaber D.; Bergmann A.; Glatter O. SAXS experiments on absolute scale with Kratky systems using water as a secondary standard. J. Appl. Crystallogr. 2000, 33, 218–225. 10.1107/S0021889899015216. [DOI] [Google Scholar]


