

Abstract
Target- and phenotype-agnostic assessments of biological activity have emerged as viable strategies for prioritizing scaffolds, structural features, and synthetic pathways in screening sets, with the goal of increasing performance diversity. Here, we describe the synthesis of a small library of functionalized stereoisomeric azetidines and its biological annotation by “cell painting,” a multiplexed, high-content imaging assay capable of measuring many hundreds of compound-induced changes in cell morphology in a quantitative and unbiased fashion. Using this approach, we systematically compare the degrees to which a core scaffold’s biological activity, inferred from its effects on cell morphology, is affected by variations in stereochemistry and appendages. We show that stereoisomerism and appendage diversification can produce effects of similar magnitude, and that the concurrent use of these strategies results in a broader sampling of biological activity.
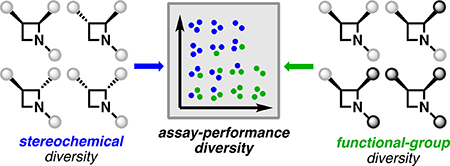
Graphical Abstract
INTRODUCTION
The discovery of chemical probes and drug leads frequently relies on high-throughput screening (HTS) of small molecules.1 Despite the capability of current HTS facilities to screen millions of compounds per month,1 the cost-effectiveness of these endeavors could be improved by instead screening smaller but equally performance-diverse compound collections.2 Such collections comprise compounds having many distinct mechanisms of action with only a small degree of redundancy and with a smaller fraction of compounds lacking bioactivity. The curation of compound collections is especially relevant in settings where molecular targets are unknown, when no structural information is available, or when difficult-to-culture but often more biologically meaningful (e.g., primary) cells are used.3 In these contexts, two capabilities seem especially relevant: (1) new synthetic methods4 and strategies3,5 aimed at sampling novel, sp3-rich chemical space well-poised to uncover new biology,6–8 and (2) rapid and inexpensive multiplexed (high-dimensional) methods to create biological fingerprints or profiles of compounds that are independent of specific, targeted biological processes.
In a previous study, we systematically quantified the performance diversity of compound collections using simple target- and phenotype-agnostic biological assays.9 Specifically, we used a high-content imaging assay termed “cell painting” to annotate compound activity (Figure 1A).10,11 This assay quantifies hundreds of specific changes in human cell morphology elicited by compounds in vitro, thus providing an unbiased, high-dimensional measure of bioactivity rich enough to distinguish compound mechanisms of action (MoAs).12 Considered collectively, the changes in many distinct cellular features constitute a “fingerprint” that characterizes the biological activity of a compound. Comparing multidimensional fingerprints can then reveal which compounds are biologically active and inform whether different compounds act by similar or distinct MoAs. Cell painting also has the particular strengths of being performed on label-free compounds, remaining relatively inexpensive, and producing results without long delays. These factors led us to hypothesize that the evaluation by cell painting of small molecules as they are synthesized, i.e., in “real time,” could be a powerful method to assemble performance-diverse collections and simultaneously assist in prioritizing structural motifs and synthetic pathways likely to lead to performance diversity. We recently reported on the real-time annotation of triads of constitutional isomers13 and a set of functionally diverse bicyclic scaffolds14 (Figure 1B). Here, we describe the biological annotation of ad hoc series of azetidine-containing stereoisomers by cell painting. Studying series of closely related compounds with a high-dimensional profiling assay15,16 provides a platform where the contributions to performance diversity of functional-group and three-dimensional structural variations can be, to an extent, decoupled and assessed independently.
Figure 1. Biological annotation by cell painting: experimental workflow and studied scaffolds.

(A) Human U-2 OS cells are seeded in 384-well plates, then treated with compounds in 6-point, 2-fold serial dilutions; after 24 h, cells are fixed, stained with 5 dyes targeting 8 organelles and cell components, and imaged (Opera Phenix); microscope images are analyzed using CellProfiler software.22,23 Each compound at each concentration is thus associated with a profile consisting of 1140 robust z-scores characterizing specific morphological changes relative to vehicle control (DMSO). (B) Previously, we demonstrated the annotation of triads of constitutional isomers and of functionally diverse [6,5]-fused bicyclic compounds. Here, a stereochemically exhaustive library of azetidines enabled orthogonal annotation of stereochemical and functional changes. Blue dots indicate the sites of functional diversification on each scaffold.
RESULTS AND DISCUSSION
The Broad Institute’s Diversity-Oriented Synthesis (DOS) collection of over 100 000 synthetic small molecules includes a subset of chiral azetidines,17 which have resulted in the discovery of lead scaffolds in multiple disease areas.5 Motivated in particular by a promising antimalarial lead for which the stereochemical configuration of the azetidine proved critical to activity,18 we recently developed conditions for the directed, stereospecific C—H arylation of readily available azetidine building blocks.19 We thus envisioned exploiting this method toward the generation of a focused library of stereoisomers for study in cell painting.
We selected chemical transformations and coupling partners to yield products having structural and calculated physicochemical descriptors in compliance with Lipinski’s Rule of 5 (Table SI–1).20 Both enantiomers of azetidine-2-carboxylic acid (1) were N-protected and provided an aminoquinoline directing group (Figure 2A). The resulting C—H arylation substrates (2) were subjected to the reaction conditions reported previously, leading to cis p-Br-phenyl and p-tolyl derivatives (2S,3R)- and (2R,3S)-3 and −4. This reaction was also performed with in situ epimerization to provide the corresponding trans-congeners. Next, Boc protection and hydrolytic removal of the aminoquinoline auxiliary from the cis-isomers of 3 were achieved with or without epimerization at the azetidine C2, leading to carboxylic acid series 5. Each stereoisomer of 5 was next subjected to the same series of transformations designed to enable appendage diversification at the C2-carboxylic acid, azetidine nitrogen, and aryl bromide sites (Figure 2B; for clarity, transformations are only shown on one stereoisomer). Reduction of the carboxylic acid afforded series 6, which was either subjected to Boc removal (7) and cyclopropyl thiourea (8) or urea (9) formation, or to a Suzuki coupling21 to install a pyridazine moiety (10), followed by Boc removal (11). Alternatively, each isomer of 5 was converted to the corresponding morpholine amide (12), with the Boc carbamate then converted to a cyclopropyl urea (13) and a pyridazine ring (14) introduced as described previously. All isomers of aryl bromide 12 were also directly converted to pyridazine derivatives (15). Finally, conversion of the carbamates of series 5 to cyclopropyl ureas (16) enabled the coupling of chiral 3-phenylmorpholines. Carried out only on the cis-congeners of 16, this transformation gave rise to four stereoisomers of series 17.
Figure 2. Diastereoselective C—H arylation enables generation of compounds for study in cell painting.

(A) Stereospecific C—H arylation followed by epimerization and/or hydrolysis enables access to pilot compound set. (B) Appendage diversification of key carboxylic acid 5 yields expanded compound set.
Series 1–5, synthesized first, were subjected to a preliminary, proof-of-concept cell-painting experiment. Showing promising activity, only series 3 and 4 from the preliminary assay were retested, now in conjunction with series 6–17. The cell-painting experiments closely followed a previously developed protocol (Figure 1A, see Supporting Information for further details).10,13,14 Human osteosarcoma cells (U-2 OS) were seeded in 384-well plates at an approximate density of 1500 cells per well. Cells were treated with the newly synthesized compounds at 6 different concentrations (100 to 3.125 μM in DMSO, 2-fold dilution). Each plate also contained cells treated with positive controls (colchicine, nocodazole, wortmannin, and radicicol) at 6 different concentrations (20 to 0.625 μM in DMSO, 2-fold dilution) and DMSO alone (vehicle control). After 24 h, the cells were treated with dyes specific to five sets of organelles or cellular components: nucleus; endoplasmic reticulum; nucleoli and cytoplasmic RNA; F-actin cytoskeleton, Golgi, and plasma membrane; and mitochondria (Table SI–2). Experiments were run in quadruplicate.
High-content imaging and subsequent analysis using CellProfiler22,23 allowed, for each treatment condition (defined by a given compound at a given concentration), the extraction of 1140 cellular features. Each feature corresponds to a specific change in cell morphology vs vehicle control (DMSO). The “profile” resulting from the combination of all features (Figure 3) thus reveals a distinct combination of morphological changes for each treatment condition. For example, differences in cell densities, shapes, and compartment distributions can be observed between stereoisomers (2R,3R)-4 and (2R,2S)-4, themselves different from colchicine and DMSO.
Figure 3. Cell images reveal different morphological effects of diastereomers of 4 in comparison with each other as well as DMSO (vehicle control) and colchicine (positive control).

Sample microscope images of vehicle- and compound-treated U-2 OS cells with corresponding morphological profiles. Images are shown for vehicle- and compound-treated U-2 OS cells. For each well, 9 images are acquired in a 3 × 3 grid; each panel accounts for 1 of these 9 sites. Each image is accompanied by its corresponding morphological profile; this profile consists of 1140 feature measurements that are normalized to the vehicle control.
Using these profiles as a general measure of potency, we found that both functional and three-dimensional structural variations had significant effects on the level of biological activity (Figure 4). For each azetidine derivative, we calculated activity scores between the four replicates of each treatment condition and the vehicle-control wells using a Mahalanobis distance metric.24 We then averaged these activity scores for each compound across all concentrations, and aggregated by series (Figure 4A). Comparison of these activity scores revealed that while not all compounds exerted significant effects on cell morphology, those that did appeared to behave differently than at least a subset of their stereoisomers. This result is consistent with the notion that molecular interactions with biological targets can be highly stereospecific, and additionally suggests that cell painting is capable of discerning differences in activity arising from these stereospecific interactions. All compounds also exhibited a clear concentration dependence in the observed effects, with higher concentrations of compounds associated with larger activity scores (Figure 4B). Series 3, 4, 6, 7, and 11, which included the most active compounds, were selected for a more detailed study.
Figure 4. Comparison of compound-induced morphological changes reveals differences in activity between and within series.

(A) Dot plot of compound activities reveals contributions from both series identity and stereochemistry. The activity scores measure the degree to which compound-induced morphological changes are distinct from those induced by DMSO alone and are calculated according to a Mahalanobis distance metric.24 Each point represents a unique compound, averaged across all replicates and concentrations. Five series (highlighted) exhibit high variation in compound activity between stereoisomers. (B) The stratification of compound activities in series 3, 4, 6, 7, and 11 are recapitulated when plotted as a function of concentration. The concentration-dependence additionally suggests that the activities observed are real (i.e., not due to outliers). For each activity score, a multidimensional perturbation value (mp-value) was calculated following the procedure developed by Hutz et al.26 Data points for which mp-value >0.05 are designated as being “not significant” (i.e., not significantly different from DMSO alone).
Interestingly, different stereoisomers within several selected series induced distinct changes in cell morphology, suggesting that their biological effects are mediated by different mechanisms (Figure 5). A principal component analysis (PCA)25 of compound profiles within each series was consistent with earlier results (cf. Figure 4B): differences in biological effects (activity or MoA) become more apparent at higher concentrations, with data populating increasingly distant regions of principal-component space. In addition, we identified cases in which specific enantiomers elicit distinct effects on cell morphology, whereas in others morphological differences appear to be only diastereospecific (Figure 5). Series 7 and 11 fall in the former category, with (2R,3R)-7 and (2R,3R)-11 clearly distinguished in terms of biological activity from their respective stereoisomers above 25 μM. Similarly, (2R,3S)-4 elicits at 100 μM a significantly different morphological change compared to those elicited by its stereoisomers.
Figure 5. Principal component analysis within active series illuminates stereospecific behaviors.

Principal component analysis of compound-induced changes in cell morphology reveals the distinct profiles of stereoisomers within the same series. Each stereoisomer is depicted in a different color, and the three highest concentrations tested are shown, each in quadruplicate. Within each series, an mp-value was calculated for each pair of stereoisomers at the same concentration; those highlighted are distinguishable from their respective isomers with an mp-value <0.05, except where noted. The results show that changes in stereochemical configuration can cause statistically significant differences in biological activity, as assessed by their morphological profiles.
Conversely, in series 3 both cis-isomers [(2R,3R)-3 and (2S,3S)-3] follow a concentration-dependent variation along the first principal component (PC1) almost exclusively, whereas both trans-congeners [(2S,3R)-3 and (2R,3S)-3] display a concentration-dependent variation on the second principal component (PC2). (2R,3R)-3 appears to display the strongest activity at 100 μM while remaining aligned with its enantiomer (along PC1), suggesting that their morphological effects are elicited via a common MoA, but with different potencies. An analogous observation can be made of series 6.
We corroborated these mechanistic hypotheses by calculating the similarity between morphological profiles at 100 μM as measured by Pearson correlations (Figure 6). Indeed, in series 3 and 6, cis-isomer profiles are more highly correlated with each other than with trans-isomer profiles and vice versa. Also, consistently, (2R,3S)-4, (2R,3R)-7, and (2R,3R)-11 do not appear to correlate with their respective stereoisomers. Of note and despite being weakly active, series 17 demonstrates that the distinction of biological effects of stereoisomers is not limited to stereoisomerism on the azetidine core (Figure 2B and Figure SI–1), further validating the annotation method.
Figure 6. Correlation analysis further indicates that observed differences in activity may be associated with distinct mechanisms of action.

Heat maps showing the relationships between stereoisomers within the same series, based on the similarities of their morphological profiles assessed by Pearson correlation coefficients. For each series, Pearson correlation coefficients were calculated pairwise between stereoisomers at 100 μM. Pearson correlation coefficients were also calculated between each pair of positive controls at 20 μM. The correlations reinforce the observations of the principal component analysis: that changes in stereochemistry can have an effect on not only biological activity but also on the mechanism of action of compounds.
In order to evaluate the impact of functional variations on azetidine scaffolds of identical stereoconfiguration, we performed principal component and correlation analyses on all compounds of the selected series (3, 4, 6, 7, 11), rather than one series at a time (Figure 7 and Figure SI–2). In addition, we evaluated the statistical significance of differences in activities between stereoisomers using multidimensional perturbation (mp) values, as reported by Hutz et al.26 The effects of appendage diversification are consistent with those seen with series of compounds previously annotated using this method,13,14 with the effects being most notable for the (2R,3R)-isomers. Specifically, at 100 μM, activities are distinguished with a high level of confidence (mp < 0.05) and the values of pairwise Pearson correlations (Figure SI–2B) remain low, indicating that the effects on cell morphology observed may be the consequences of molecular interactions resulting in distinct MoAs. In contrast, compounds of the selected series with (2R,3S)- and (2S,3R)-configurations show a smaller spread of biological activity, even when varying appendage identity, indicating that varying both stereochemistry and appendage identity is necessary to achieve performance diversity.
Figure 7. Stereochemical diversity can be a driver of performance diversity.

The morphological profiles of all stereoisomers of series 3, 4, 6, 7, and 11 were studied concurrently by principal component analysis. Identical data are represented in the four quadrants, with a different core stereochemical configuration emphasized (bold) on each plot and only 100 μM data (four replicates each) are shown for clarity; clockwise from top left: (2R,3R), (2R,3S), (2S,3S), (2S,3R). Circled point clusters are those deemed distinct from all their congeners of same core stereoconfiguration (mp < 0.05).26
This concept can be analyzed more comprehensively by assessing the spread of each compound subset in additional principal components (Figure 8). The unique “PC-finger-prints” associated with each chemical series and stereochemical configuration indicate a useful contribution of each compound subset toward increasing performance diversity. Specifically, we can identify instances where structural variations do not lead to significant diversity in cell-morphological profiles, both in series with identical functional groups and varying stereoconfiguration (series 7 and series 11) and, vice versa, in sets with variations of functional groups and identical stereoconfiguration [(2S,3R) and to a lesser extent (2R,3S)]. These results provide a quantitative confirmation for trends identified previously (Figure 7). Taken together, these observations suggest equally important and complementary roles for stereochemical and functional-group diversity on the performance diversity of compound sets.
Figure 8. Appendage and stereochemical diversity synergize to increase performance diversity.

Heat map depicting the variances of different compound subsets (at 100 μM) in each principal component. Only the first six principal components are shown (accounting for >90% of the variance). The results show a complementarity between appendage diversification and stereoisomerism. The unique “PC-fingerprint” of each series and stereochemical configuration indicates a useful contribution to performance diversity from including each subset.
CONCLUSION
We use cell painting as a means to perform hundreds of unbiased “assays” rapidly and inexpensively in parallel, where the individual “assays” yield information regarding the influence of a small-molecule perturbagen on a measurable cell-morphological feature. We do not aim to interpret individual features (reflecting changes in morphology); in contrast, we use the ensemble of compound-induced measurements as a profile or fingerprint of a compound’s actions. These multidimensional profiles resulting from a single multiplexed assay can then be compared to each other as a means to understand whether a compound has any effect on cells, and if it does induce changes in cells, whether the effect is similar to a reference set of compounds (i.e., has a known MoA) or distinct (i.e., is a candidate for a novel MoA). Traditionally, profiles of compounds’ actions are obtained only after a large number of goal-oriented assays are achieved, generally at high cost and over an extensive period of time. Overall, we envision cell painting and other multiplexed assays as a means to assemble screening libraries comprising active compounds having a large number of distinct MoAs, what we call “performance diversity”.
We demonstrate that cell painting can discern differences in biological activity arising exclusively from stereoisomerism, and further examine the impact of stereochemical diversity on the performance diversity of a model library of disubstituted azetidines. Our results point to the incorporation of stereochemical diversity as a possible general strategy to increase the performance diversity of compound collections: comparison of concentration-dependent effects on cell morphology, as well as principal component analysis and calculations of Pearson correlations (within and between stereoisomeric series) demonstrate significant differences between stereoisomers, which in certain cases may be attributed to different MoAs. Moreover, we observe that while appendage variations or stereoisomerism alone can lead to similarly diverse biological profiles, maximum diversity is achieved when both parameters are varied simultaneously.
We also note that the synthesis of our model library was enabled by the recent development of a stereospecific C—H arylation reaction;19 we postulate that the synthesis of prospective performance-diverse libraries, and therefore also the discovery of novel probes and therapeutics, will be greatly facilitated by the development of creative chemical transformations and synthetic strategies targeting sp3-rich, stereochemically diverse small-molecule sets.
Supplementary Material
ACKNOWLEDGMENTS
We thank the Broad Institute Compound Management group for assistance in storing and plating compounds, and the Broad Institute Automation Equipment team for assistance with high-throughput screening instrumentation. We thank Dr. Maria Kost-Alimova and Cathy Hartland for assistance with highcontent imaging, Patrick O’Hearn for high-resolution mass spectrometry data, and Drs. Michael F. Mesleh and Jenna B. Yehl for assistance with NMR. This work was supported by grants from the National Institutes of Health (R01GM038627 and R35GM127045 to S.L.S.). B.M. was supported by a postdoctoral fellowship from Harvard University. J.Z. was supported by a postdoctoral fellowship from the German Academic Exchange Service (DAAD). B.K.H. was supported by the National Science Foundation (DGE1144152 and DGE1745303). O.V. was supported by a postdoctoral fellowship from the Wenner-Gren Foundations and the Swedish Chemical Society (Stiftelsen Bengt Lundqvists Minne). J.C.B. was supported by the German Federal Environment Foundation (DBU) and by the Elisabeth-Meurer fellowship. S.D.N. Jr. was supported in part by Harvard University’s Graduate Prize Fellowship. M.M. was supported by a fellowship from the National Science Foundation (DGE1144152) and by Harvard University’s Graduate Prize Fellowship. S.L.S. is an investigator at the Howard Hughes Medical Institute.
Footnotes
ASSOCIATED CONTENT
Supporting Information
The Supporting Information is available free of charge on the ACS Publications website at DOI: http://dx.doi.org/10.1021/jacs.8b07319.
Protocols for compound synthesis, characterization data, methods for biological annotation and computational analysis (PDF)
Compound list (XLSX)
Cell painting data (XLSX)
The authors declare no competing financial interest.
REFERENCES
- (1).Macarron R; Banks MN; Bojanic D; Burns DJ; Cirovic DA; Garyantes T; Green DV; Hertzberg RP; Janzen WP; Paslay JW; Schopfer U; Sittampalam GS Nat. Rev. Drug Discovery 2011, 10 (3), 188–195. [DOI] [PubMed] [Google Scholar]
- (2).Petrone PM; Wassermann AM; Lounkine E; Kutchukian P; Simms B; Jenkins J; Selzer P; Glick M Drug Discovery Today 2013, 18 (13—14), 674–680. [DOI] [PubMed] [Google Scholar]
- (3).Galloway WR; Isidro-Llobet A; Spring DR Nat. Commun 2010, 1 (80), 1–13. [DOI] [PubMed] [Google Scholar]
- (4).Taylor AP; Robinson RP; Fobian YM; Blakemore DC; Jones LH; Fadeyi O Org. Biomol. Chem 2016, 14 (28), 6611–6637. [DOI] [PubMed] [Google Scholar]
- (5).Gerry CJ; Schreiber SL Nat. Rev. Drug Discovery 2018, 17 (5), 333–352. [DOI] [PMC free article] [PubMed] [Google Scholar]
- (6).Dandapani S; Rosse G; Southall N; Salvino JM; Thomas C J. Curr. Protoc Chem. Biol 2012, 4, 177–191. [DOI] [PMC free article] [PubMed] [Google Scholar]
- (7).Lovering F; Bikker J; Humblet C J. Med. Chem 2009, 52 (21), 6752–6756. [DOI] [PubMed] [Google Scholar]
- (8).Méndez-Lucio O; Medina-Franco JL Drug Discovery Today 2017, 22 (1), 120–126. [DOI] [PubMed] [Google Scholar]
- (9).Wawer MJ; Li K; Gustafsdottir SM; Ljosa V; Bodycombe NE; Marton MA; Sokolnicki KL; Bray M-A; Kemp MM; Winchester E; Taylor B; Grant GB; Hon CS; Duvall JR; Wilson JA; Bittker JA; Dančík V; Narayan R; Subramanian A; Winckler W; Golub TR; Carpenter AE; Shamji AF; Schreiber SL; Clemons PA Proc. Natl. Acad. Sci. U. S. A 2014, 111 (30), 10911–10916. [DOI] [PMC free article] [PubMed] [Google Scholar]
- (10).Bray M-A; Singh S; Han H; Davis CT; Borgeson B; Hartland C; Kost-Alimova M; Gustafsdottir SM; Gibson CC; Carpenter AE Nat. Protoc 2016, 11 (9), 1757–1774. [DOI] [PMC free article] [PubMed] [Google Scholar]
- (11).Caicedo JC; Cooper S; Heigwer F; Warchal S; Qiu P; Molnar C; Vasilevich AS; Barry JD; Bansal HS; Kraus O; Wawer M; Paavolainen L; Herrmann MD; Rohban M; Hung J; Hennig H; Concannon J; Smith I; Clemons PA; Singh S; Rees P; Horvath P; Linington RG; Carpenter AE Nat. Methods 2017, 14 (9), 849–863. [DOI] [PMC free article] [PubMed] [Google Scholar]
- (12).Bray M-A; Gustafsdottir SM; Rohban MH; Singh S; Ljosa V; Sokolnicki KL; Bittker JA; Bodycombe NE; Dančík V; Hasaka TP; Hon CS; Kemp MM; Li K; Walpita D; Wawer MJ; Golub TR; Schreiber SL; Clemons PA; Shamji AF; Carpenter AE GigaScience 2017, 6 (12), 1–5. [DOI] [PMC free article] [PubMed] [Google Scholar]
- (13).Gerry CJ; Hua BK; Wawer MJ; Knowles JP; Nelson SD Jr.; Verho O; Dandapani S; Wagner BK; Clemons PA; Booker-Milburn KI; Boskovic ZV; Schreiber SL J. Am. Chem. Soc 2016, 138 (28), 8920–8927. [DOI] [PMC free article] [PubMed] [Google Scholar]
- (14).Nelson SD Jr; Wawer MJ; Schreiber SL Org. Lett 2016, 18 (24), 6280–6283. [DOI] [PMC free article] [PubMed] [Google Scholar]
- (15).Kim Y-K; Arai MA; Arai T; Lamenzo JO; Dean EF 3rd; Patterson N; Clemons PA; Schreiber SL J. Am. Chem. Soc 2004, 126 (45), 14740–14745. [DOI] [PubMed] [Google Scholar]
- (16).Tanikawa T; Fridman M; Zhu W; Faulk B; Joseph IC; Kahne D; Wagner BK; Clemons PA J. Am. Chem. Soc 2009, 131 (14), 5075–5083. [DOI] [PMC free article] [PubMed] [Google Scholar]
- (17).Lowe JT; Lee MD IV; Akella LB; Davoine E; Donckele EJ; Durak L; Duvall JR; Gerard B; Holson EB; Joliton A; Kesavan S; Lemercier BC; Liu H; Marié J-C; Mulrooney CA; Muncipinto G; Welzel-O’Shea M; Panko LM; Rowley A; Suh B-C; Thomas M; Wagner FF; Wei J; Foley MA; Marcaurelle LA J. Org. Chem 2012, 77 (17), 7187–7211. [DOI] [PMC free article] [PubMed] [Google Scholar]
- (18).Kato N; Comer E; Sakata-Kato T; Sharma A; Sharma M; Maetani M; Bastien J; Brancucci NM; Bittker JA; Corey V; Clarke D; Derbyshire ER; Dornan GL; Duffy S; Eckley S; Itoe MA; Koolen KM; Lewis TA; Lui PS; Lukens AK; Lund E; March S; Meibalan E; Meier BC; McPhail JA; Mitasev B; Moss EL; Sayes M; Van Gessel Y; Wawer MJ; Yoshinaga T; Zeeman A-M; Avery VM; Bhatia SN; Burke JE; Catteruccia F; Clardy JC; Clemons PA; Dechering KJ; Duvall JR; Foley MA; Gusovsky F; Kocken CHM; Marti M; Morningstar ML; Munoz B; Neafsey DE; Sharma A; Winzeler EA; Wirth DF; Scherer CA; Schreiber SL Nature 2016, 538 (7625), 344–349. [DOI] [PMC free article] [PubMed] [Google Scholar]
- (19).Maetani M; Zoller J; Melillo B; Verho O; Kato N; Pu J; Comer E; Schreiber SL J. Am. Chem. Soc 2017, 139 (32), 11300–11306. [DOI] [PMC free article] [PubMed] [Google Scholar]
- (20).Lipinski CA; Lombardo F; Dominy BW; Feeney PJ Adv. Drug Delivery Rev 1997, 23 (1–3), 3–25. [DOI] [PubMed] [Google Scholar]
- (21).Bruno NC; Tudge MT; Buchwald SL Chem. Sci 2013, 4, 916–920. [DOI] [PMC free article] [PubMed] [Google Scholar]
- (22).Carpenter AE; Jones TR; Lamprecht MR; Clarke C; Kang IH; Friman O; Guertin DA; Chang JH; Lindquist RA; Moffat J; Golland P; Sabatini DM Genome Biol. 2006, 7 (10), R100. [DOI] [PMC free article] [PubMed] [Google Scholar]
- (23).Lamprecht MR; Sabatini DM; Carpenter AE BioTechniques 2007, 42 (1), 71–75. [DOI] [PubMed] [Google Scholar]
- (24).Mahalanobis PC Proc. Natl. Inst Sci. Calcutta 1936, 2 (1), 49–55. [Google Scholar]
- (25).Replicates were averaged prior to calculation, then individual replicate data was centered and projected on principal-component space. [Google Scholar]
- (26).Hutz JE; Nelson T; Wu H; McAllister G; Moutsatsos I; Jaeger SA; Bandyopadhyay S; Nigsch F; Cornett B; Jenkins JL; Selinger DW J. Biomol. Screening 2013, 18 (4), 367–377. [DOI] [PubMed] [Google Scholar]
Associated Data
This section collects any data citations, data availability statements, or supplementary materials included in this article.