Abstract
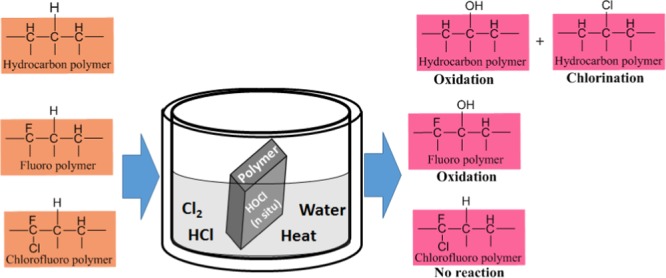
Polypropylene, poly(ethylene terephthalate), ethylene chloro tetrafluoroethylene, ethylene tetrafluoroethylene, and epoxy vinyl ester resin (Derakane 470-300) were evaluated in aqueous HCl containing chlorine gas at high temperature as a corrosion media. Fourier transform infrared, X-ray diffraction, energy-dispersive X-ray, and dynamic mechanical analyzer are used for identification of nature of chemical reactions on polymer chain. Puncture resistance and hardness tests were done to evaluate the mechanical strength after the exposure. The scanning electron microscopy image was taken to check the morphological change of polymer surface. Chlorination and oxidation reactions were observed to be responsible for the stability behavior of polymer. A mechanism proposed for both chlorination and oxidation on polymer.
1. Introduction
Corrosion is a big challenge to scientists, as the Gibbs free energy of this natural process is always negative. Corrosion can cause economic penalties to critical industrial sectors.1,2 Global corrosion cost is estimated to be 2.5 trillion USD, equivalent to 3.4% of the gross domestic product.3 Acidic systems cover a major portion in the corrosion phenomenon and the related costs involved in it. One such critical corrosion media is aqueous hydrochloric acid containing chlorine gas.4
Chlorine is widely used in industry, 60% of the total chemicals depend upon the chlorine manufacturing process.5 Of the 40 million metric ton annual production of chlorine worldwide, 75% goes to industrial practice of chemical manufacturing, namely poly(vinyl chloride) (PVC) manufacturing (30), solvent (24), organic (13), water, and paper (10).6,7 In all these processes, hydrochloric acid is generated as a byproduct and chlorine gas is invariably present in the product or the byproduct mixture. Water as chlorination media includes major industrial processes namely, PVC polymerization, chlorination of PVC-producing CPVC8 and water treatment. Presence of water is practically undeniable, even the process is in non-aqueous media. Corrosion in such reaction media cause economic setback to the processes. Often, polymers used either directly in reaction system or as coating on metal surface is a fruitful option to prevent corrosion.9−12 Yet, the stability of the polymer at different reaction conditions is a matter of critical investigation.
Several reports are disclosed about the corrosion resistivity of polymer materials as coating and construction material.13−15 Concentrated H2SO4,16 concentrated HCl,17,18 chlorinated solvents, or high-temperature hydrochloric acid19−21 are quite common corrosive system that are well studied; however, study of aqueous hydrochloric acid containing chlorine gas or as media of industrial chlorination process are scanty in literature. The present study primarily focuses on understanding the effect and stability of the materials used for coating and construction purposes in aqueous hydrochloric acid containing chlorine gas.
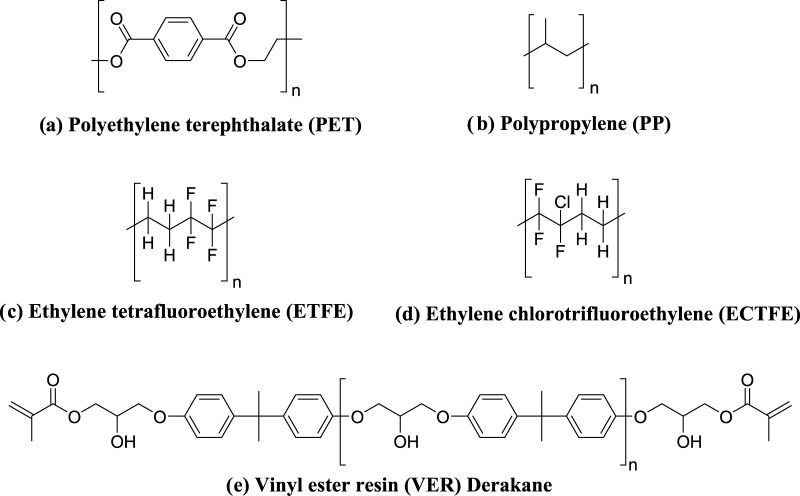
Polypropylene (PP), poly(ethylene terephthalate) (PET), ethylene chloro tetrafluoroethylene (ECTFE), ethylene tetrafluoroethylene (ETFE), and epoxy vinyl ester resin (VER, Derakane 470-300) are chosen for the study. Structural description of these polymers are given in Figure 1.
Figure 1.
Structure of polymer samples taken for testing.
These materials are used in various chemical processes involving acidic and corrosion media. The present study is primarily focused on the effect of these materials in chlorine-dissolved aqueous hydrochloric acid. Some of the polymers are used in the shape of cloth and sheet to understand the effect of exposure. Specimen samples were exposed in the system for stipulated time period and characterized in detail before and after the exposure through Fourier transform infrared (FTIR), X-ray diffraction (XRD), scanning electron microscopy (SEM), energy dispersive X-ray analysis, and dynamic mechanical analyzer (DMA) study.
2. Results and Discussion
2.1. Poly(ethylene Terephthalate) (PET)
Poly(ethylene terephthalate) (PET) has very good barrier and hardness properties, so it is widely used in packaging,22 coating,23,24 and construction25 material, or as filter in acidic system. The PET cloth sample when immersed in the present system showed changes.
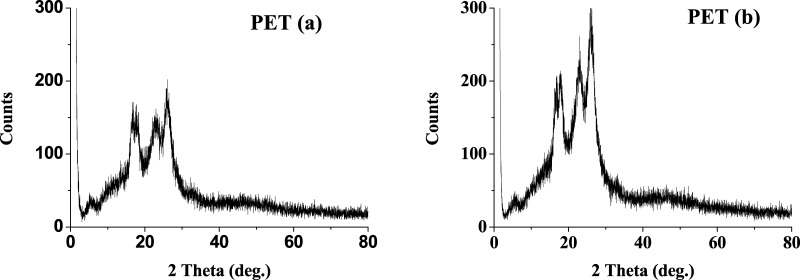
The XRD of the PET cloth coupons, before and after, show a noticeable change (Figure 2). The 2θ peaks obtained at 16.0, 17.5, 22.5, and 25.5 corresponds to the reflections from the (01̅0), (010), (110), and (100) planes for a semicrystalline PET26 shows an increase in intensity and a shift to a higher 2θ in every plane of reflections. This results into reduction in the d spacing from 5.29 to 5.26, 5.01 to 4.97, 3.93 to 3.87, and 3.43 to 3.42 Å for (01̅0), (010), (110), and (100) planes, respectively (Table 1). Also, the increase in the reflected radiation intensity resulted in a higher degree of crystallinity. Interestingly, the relative ratio of intensity was changed to 1.07:1:1.2 to 0.9:1:1.3 of the respective peaks before and after exposure. The peak at 2θ of 22.5° of the 010 plane corresponds to the increase in the amorphous region with respect to the crystalline region.27 This may be indicative of the fact that the surface of PET is affected by the acidic oxidizing environment.
Figure 2.
XRD of PET polymer samples (a) before treatment and (b) after treatment.
Table 1. Data for the Evaluation of Polymer Samples before and after Exposurea.
| % crystallinity |
C (wt %) |
F (wt %) |
O (wt %) |
Cl (wt %) |
Tg (DMA) (°C) |
puncture resistance
(N) |
tensile strength (kg/cm2) |
Barcol
hardness |
||||||||||
|---|---|---|---|---|---|---|---|---|---|---|---|---|---|---|---|---|---|---|
| B | A | B | A | B | A | B | A | B | A | B | A | B | A | B | A | B | A | |
| PET | 42.8 | 45.8 | 69.97 | 58.66 | 30 | 41.16 | 0 | 0.15 | 150.19 | 142.1 | 718.21 | 26.8 | ||||||
| PP | 56.1 | 54.1 | 97.95 | 72.96 | 2.01 | 12.53 | nil | 13.8 | 85.34 | 118.4 | 513 | 66 | 320 | 302 | 78 | 78 | ||
| ETFE | 52.75 | 42.28 | 46.62 | 45.66 | nil | 11 | nil | nil | ||||||||||
| ECTFE | 96.2 | 85.3 | 35.81 | 45.45 | 40.97 | 35.74 | 9.12 | 9.21 | 13.96 | 9.46 | 124.65 | 125.88 | 489.15 | 433.12 | ||||
| VER | 64.51 | 70.64 | 32.38 | 21.38 | 0.09 | 5.93 | 819 | 815 | 38 | 32 | ||||||||
B = Before the treatment. A = After the treatment. Atom wt % taken from EDX value.
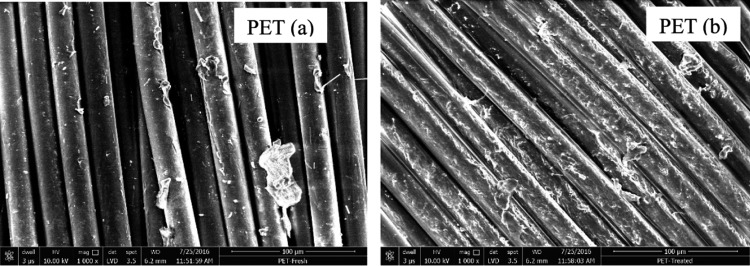
The SEM pictures show a distinct difference between fresh and treated PET samples (Figure 3). In addition to the etched PET surface, the gaps between the strands have been reduced, which supports the XRD data. Physically, the specimen was observed to be more opaque and brittle, which is in accordance with one of the reports that found brittleness of PET when exposed to chlorinated solvents.28
Figure 3.
SEM Image of PET polymer samples (a) before treatment and (b) after treatment.
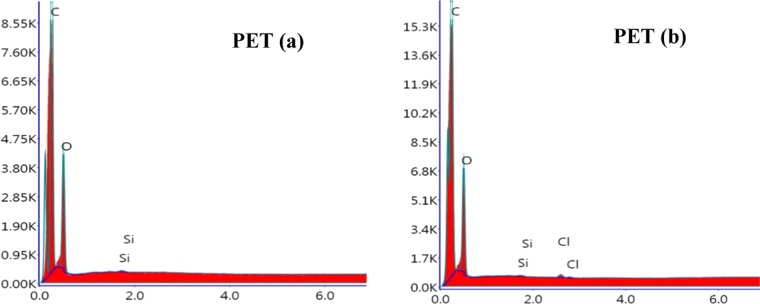
Energy-dispersive X-ray study as shown in Figure 4 shows a new peak of Cl after exposure, indicating a chemical attack on the surface or the polymer chain of PET by chlorination. The C-to-O ratio of untreated PET is 2.33:1, not far from the theoretical value of 2.5:1 (with respect to −C10H8O4– polymeric unit) (Table 1); little more on −OH ratio as commercial PET contains more hydroxyl end groups.29 Adherence of molecular chlorine or HCl is ruled out because the samples were extensively dried before testing. Interestingly, the oxygen content increased from initial to the exposed specimen. The moisture content of the dried PET samples was <0.05 wt %, so adhered water is not the source of oxygen. The oxidation of PET by HOCl could be the likely cause for the presence of oxygen. HOCl generated in the system by the reaction of chlorine and water is a highly oxidizing agent,30 which can initiate the hydroxylation of PET.31,32
Figure 4.
EDX spectra of PET polymer samples (a) before treatment and (b) after treatment.
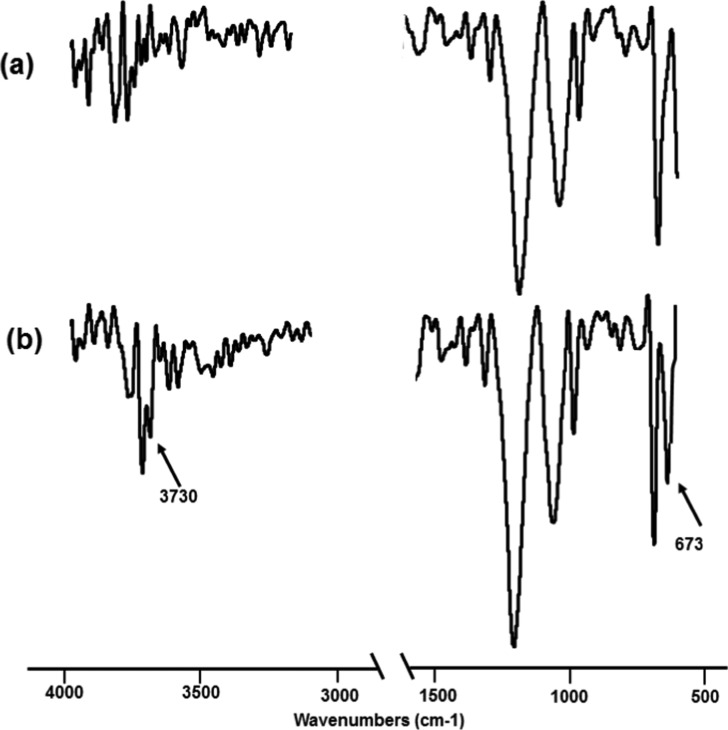
The FTIR spectra (Figure 5) of poly(ethylene terephthalate) samples before and after treatment clearly distinguish the peak 673 cm–1 in the treated sample correspond to the C–Cl stretching vibration; the literature reported value of 668 cm–1.33 This distinctively proves the chlorination reaction of PET during the treatment. The absence of peak at 3700 cm–1, which corresponds to the −OH stretching (nonhydrogen bonded)34,35 in the treated PET, in the untreated sample also proves the hydroxylation of PET.
Figure 5.
FTIR spectra (in transmittance mode) of PET polymer samples (a) before treatment and (b) after treatment.
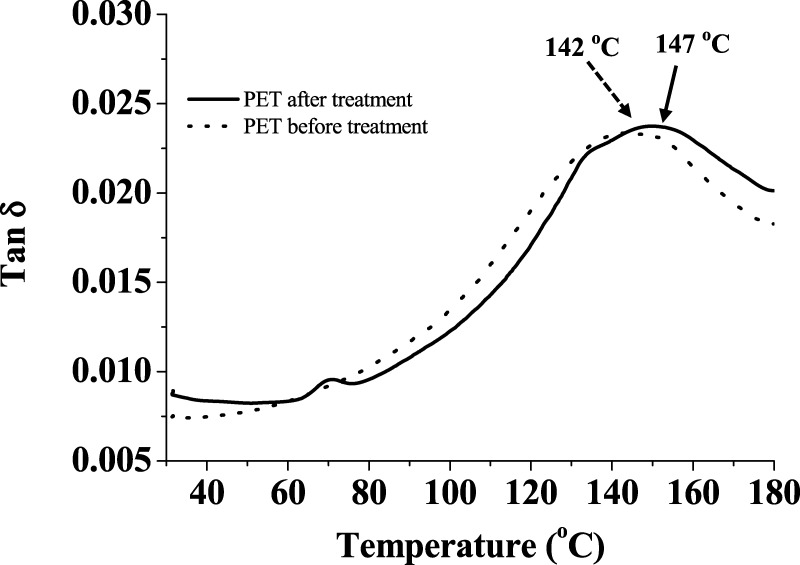
The DMA analysis (Figure 6) of fresh PET cloth is in agreement with the literature value.36 The treated sample shows a 5 °C lower shift of tan δ maxima (in DMA) from 147.19 to 142.1 °C after the exposure, this may be due to the oxidation of the PET chain.
Figure 6.
DMA graph of PET polymer samples before treatment and after treatment.
The test of puncture resistance (ASTM D4833) of fresh PET cloth shows 781 N, whereas that of the treated PET cloth sample shows 27 N. Such a huge drop in the strength is evidence of the damage to the PET polymer chain likely due to chemical attack as seen in above-mentioned test reports.
2.2. Polypropylene (PP)
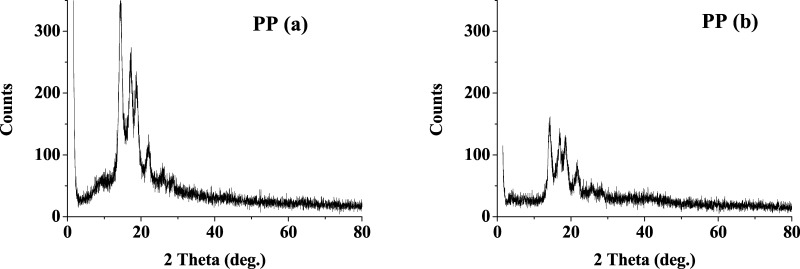
Polypropylene (PP), a purely hydrocarbon polymer, has considerable chemical resistance used as solvent storage container37 and piping;38,39 therefore, it was thought to check the stability in the present system. An increase in the degree of amorphous content and a reduction in crystallinity, i.e., decrease in intensity, are observed from the XRD pattern of the PP sample (Figure 7). Peaks at 2θ of 14.41, 17.20, 18.72, and 22.02° comply with the literature value that correspond to the (110), (040), (130), (111), and (131) plane reflections.40 The treated PP shows the peaks at the same position as the untreated one, but with reduced intensity, this may be indicative of the change in the polymer structure and orientations. The intensity of the peak corresponding to the (110) plane is comparatively more reduced, that is, the bulk orientation of PP polymer becomes less ordered probably due to the reduced crystallinity in treated PP.41
Figure 7.
XRD spectra of PP samples (a) before treatment and (b) after treatment.
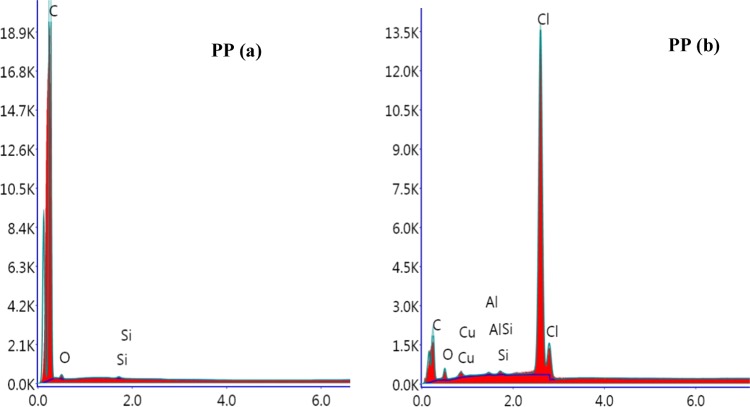
The SEM image of the PP samples (Figure 8) signifies the change in the surface topography. The roughness and demarcation incurred during exposure to the present system. The nature of chemical attack is further substantiated in the EDX spectra (Figure 9), in which the appearance of a chlorine peak is an evidence of the chlorination reaction in the PP chain.42 Moreover, as seen from the EDX spectra, the oxygen content in the treated PP is higher than that in the untreated one. Similar to the PET sample, this observation also dictates the hydroxylation of the PP chain by HOCl. Interestingly, the atomic ratio 1:1 of Cl to O indicates that HOCl could be responsible for both chlorination and hydroxylation.
Figure 8.
SEM image of PP polymer samples (a) before treatment and (b) after treatment.
Figure 9.
EDX spectra of PP polymer samples (a) before treatment and (b) after treatment.
The FTIR of PP does not reveal much of information probably because the C–Cl vibration frequency is masked by the frequency of the propylene chain sequence and the −CH2– rocking vibrations that appear broadly near 700 cm–1.43,44 However, there is a sharp indication of a nonhydrogen-bonded −OH stretching at 3734 cm–1 in the treated PP; the peak is likely to be caused due to the hydroxylation by HOCl.45
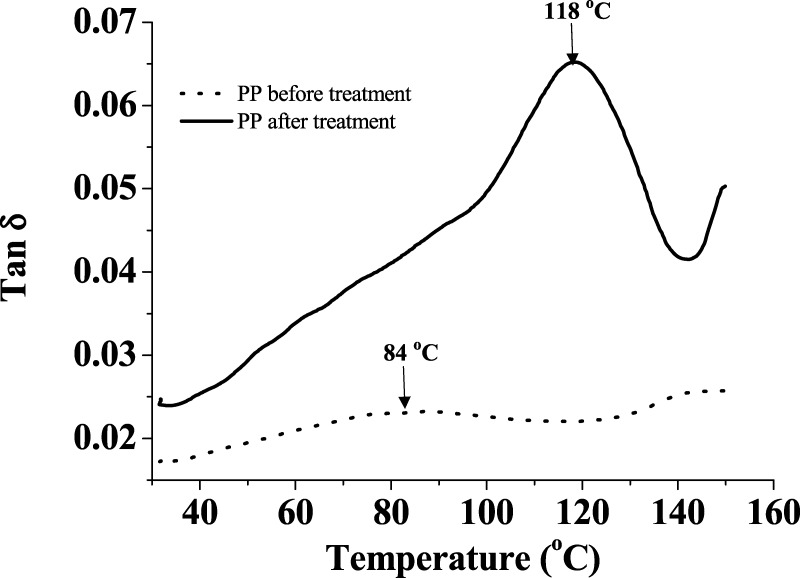
tan δ maxima in the DMA of the PP cloth sample shows a 34 °C upshift from 84 °C to 118 °C after exposure (Figure 10). The likely reason is the chlorination of the PP polymer chain.46
Figure 10.
DMA graph of PP polymer samples before treatment and after treatment.
Mechanical test of treated PP sample produce an inferior puncture resistance of 66 N with respect to fresh PP cloth sample of 513 N (Table 1). This drop in puncture resistance supports the chlorination reaction with the polymer chain. The PP sample becomes more brittle after the exposure.
2.3. ETFE
Ethylene tetrafluoroethylene copolymer (ETFE) is a copolymer of ethylene. It is mostly used in coating applications.47 It has got properties of corrosion resistance, barrier properties, good process ability, and high operating temperature durability. However, in the present system, ETFE changes from colorless to white and opaque.
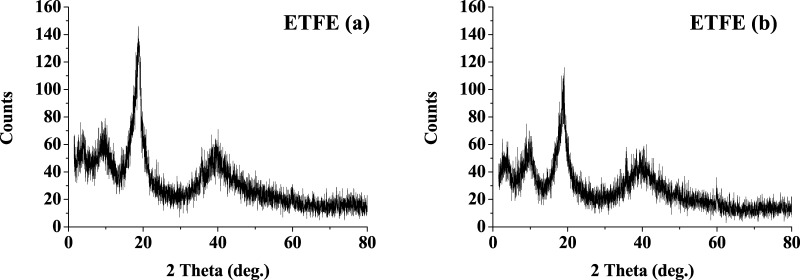
The XRD pattern of untreated ETFE matches with the literature values,48 which show that a highest peak at 2θ 18.8° corresponds to the reflection of the (004) plane (Figure 11). A slight decrease in the intensity and an increase in d spacing from 4.69 to 4.72 Å were observed. The crystallinity was reduced from 96.2 to 85.3%. According to the literature, reflections from (001) and (003) are weaker and that from (002) is relatively strong.48 However, it can be seen that the (001), (002), and (003) reflections are of same intensity. Phongtamrug et al. found a correlation between the ethylene content and d spacing such that ethylene content less than 50% may be the cause of a larger d spacing.49 Thus, the ethylene content in ETFE in the present system is reduced from the original 1:1 ethylene and tetrafluoroethylene composition. The change in the intensity could also be anticipated due to change from orthorhombic to hexagonal meso phase, as reported in the literature.48
Figure 11.
XRD spectra of ETFE polymer samples (a) before treatment and (b) after treatment.
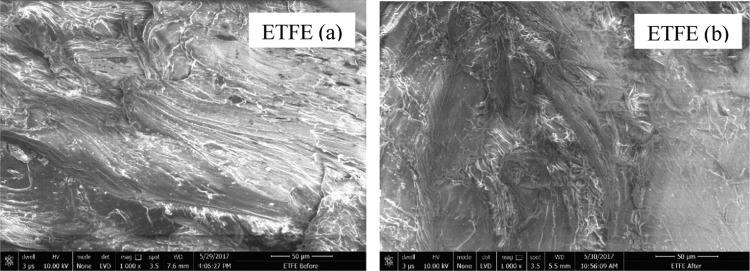
Microscopic look of the SEM image dictates that the topography of the surface nature of the ETFE sample remains same after exposure (Figure 12). More scratches or dots are observed in untreated sample, which could be due to the softness of the ETFE.50
Figure 12.
SEM image of ETFE polymer samples (a) before treatment and (b) after treatment.
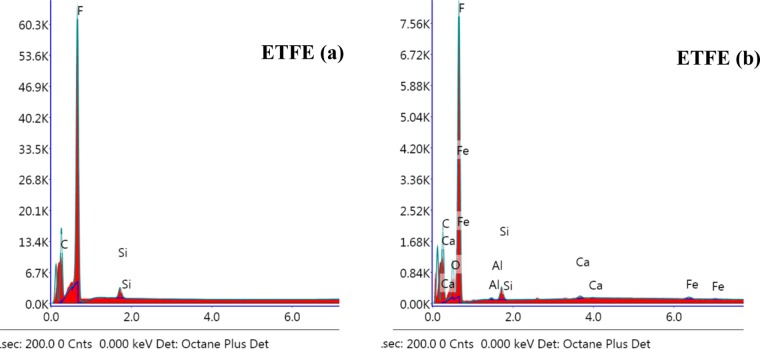
The EDX spectra, shown in Figure 13, do not reveal the presence of chlorine, but reasonable amount of oxygen is seen in the treated sample. The presence of fluorine perhaps is restricted due to chlorination, but oxidative attack could not be restrained. Although the FTIR matches the literature value with ETFE characteristic peaks,50 the peak at 3740 cm–1 (Figure 14) designates free nonhydrogen-bonded −OH, which eventually supports the oxidation. Nevertheless, the ratio of C/F is maintained at 1:1 as per the molecular formula (Figure 1).
Figure 13.
EDX spectra of ETFE polymer samples (a) before treatment and (b) after treatment.
Figure 14.
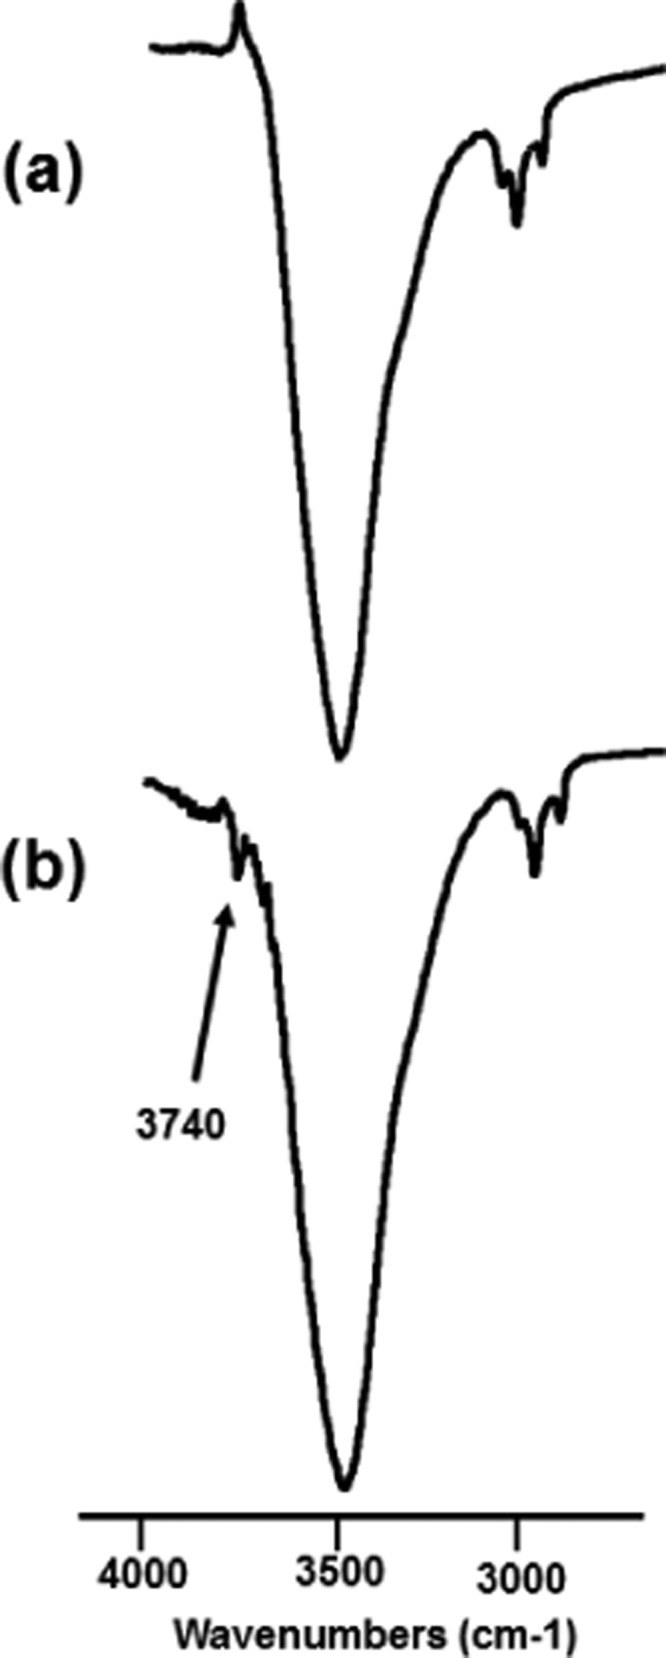
FTIR spectra (in transmittance mode) of ETFE polymer samples (a) before treatment and (b) after treatment.
2.4. ECTFE
ECTFE is similar to ETFE, except that ethylene is copolymerized with chlorotrifluoroethylene and the benefits of processibility and high molecular weight are obtained.51 The variation in molecular structure due to chlorine52 may be important to understand the effect of corrosion behavior and the oxidative stress on chlorinated acidic water system.
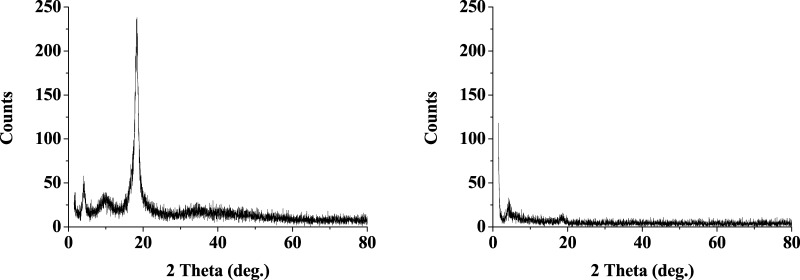
The XRD pattern of ECTFE (Figure 15) matches with the literature values of 2θ of 5, 10, and 17°.53 However, it shows a dramatic change after the exposure. Crystallinity of the material is reduced from 96% to 85% after exposure to the system. It is also evident from the spectra that the peak at 2θ of 10° has disappeared.
Figure 15.
XRD spectra of ECTFE polymer samples (a) before treatment and (b) after treatment.
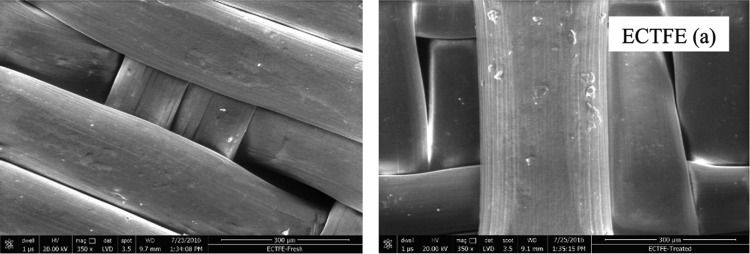
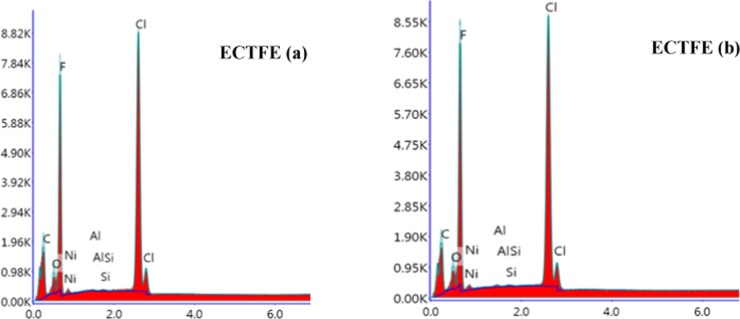
The SEM image (Figure 16) shows a smooth surface of the exposed sample both before and after the exposure. This signifies no change in the surface morphology of ECTFE in the present system. The EDX spectra (Figure 17) reveal that there is no change in oxygen content; however, change in fluorine, chlorine, and carbon content is observed (Table 1) after exposure in the said conditions. Also, no change in FTIR was noticed. The oxidative stability of ECTFE is reported to be higher than that of ETFE, which might be the likely cause for ECTFE to remain stable in the present system.54
Figure 16.
SEM image of ECTFE polymer samples (a) before treatment and (b) after treatment.
Figure 17.
EDX spectra of ECTFE polymer samples (a) before treatment and (b) after treatment.
The DMA of ECTFE produce similar thermogram and keep Tg at 124.2 °C (before treatment) and 125.8 °C (after treatment), which are matched with the literature value of 124.6 °C.55 Similar observation was found in puncture-resistance test. The force exerted was 489 N before and 433 N after the exposure.
Therefore, it is evident from the data that the chemical constituents of the ECTFE molecular chain remain intact in the present system. The probable reason for the change in the XRD pattern is the morphological change without affecting the mechanical strength of the polymer specimen.
2.5. Vinyl Epoxy Resin (Derakane Momentum 470-300)
Vinyl epoxy resin (VER), a highly cross-linked polymer of bisphenol-A glycidylether and methacrylic acid, was the first construction material following World War II.56 The VER was competitive over polyester with respect to the chemical attack and superb chemical resistivity including conc. H2SO4, chlorine water, HNO3,56 allowing it to apply for chemical vessels, reactors, etc.
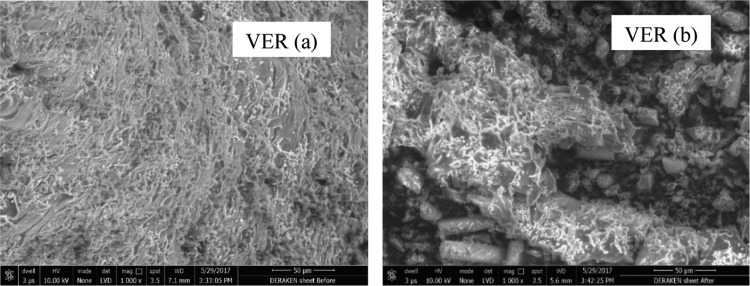
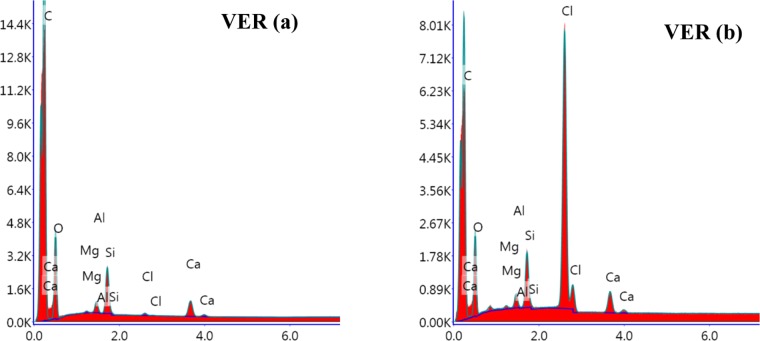
The change in the XRD of the VER sample upon exposure was not noticeable; in fact, two very broad peaks observed at 2θ of 19.34 and 18.90°. The microscopic SEM image of the VER sheet captures the differences in the surface of the specimen, as shown in Figure 18.
Figure 18.
SEM image of VER polymer samples (a) before treatment and (b) after treatment.
This change was further supported by the EDX spectrum, which shows an increase in the chlorine content after the exposure (Figure 19). Interestingly, the oxygen content decreased in the treated sample (Table 1). This could be explained in two ways. First, it can be considered that the chlorine attack is occurring by replacing oxygen. The decrease in the atom percent of oxygen was more significant (from 32.38 to 21.38) than the increase in the atom percent of chlorine (from 0.09 to 5.84) probably because oxygen is divalent whereas chlorine is monovalent. The second possibility is the permanent loss of a repeating unit from the polymer chain. Considering the structure mentioned in Figure 1, a single unit contains C25H36O8 and the loss of one acrylic acid unit provides a C22H32O6 unit. So, the relative contribution of oxygen is more from the acrylic acid unit in a single-polymer chain. However, this is contrary to few reports.57 Thus, the first explanation seems more probable.
Figure 19.
EDX spectra of VER polymer samples (a) before treatment and (b) after treatment.
Nevertheless, in case of any of the possibilities, the tensile strength and hardness of the Derakane sheet (Table 1) did not show a significant change. The DMA analysis also supports the observation, as is evident by the tan δ maxima of 125 °C.
2.6. Sheet Versus Cloth Specimen
Depending upon the application, the same material may be used in different shape and physical form. With that interest PP was checked both as cloth and sheet specimen, become the sheet material is applicable for construction and cloth material is used for filtration purpose. The cloth sample is severely changed as shown above, whereas the sheet specimen did not show a major change. Minimum change was observed in the tensile strength from 320 N to 302 N, though Barcol hardness remained unchanged at 78, in the specified time period of exposure.
2.7. Chlorination and Oxidation
Chlorine dissolves at 3 g/L water at 70 °C, and reaction of chlorine with water is well studied producing HCl and HOCl. A highly reactive compound, HOCl is not only known for oxidation but also chlorination.32 Chloronium (Cl+) ion is the active chlorinating species at pH < 1, as proposed by Swain et al.,58 probably the reason for chlorination in the present case. A review by Deborde and Gunten reveals the chlorination and oxidation of various organic compounds in chlorine water.32 Mikdam et al. described the detailed kinetics of HOCl reactivity and oxidative degradation of the PP polymer.59 The nature of effect as seen through the loss of mechanical strength of the polymer sheet as well as the cloth samples, diffusion of chlorine and water is the likely phenomenon to initiate chemical reaction with polymer chain. HOCl content at low pH is less; nevertheless, it possesses a high oxidation potential in the presence of molecular chlorine.60
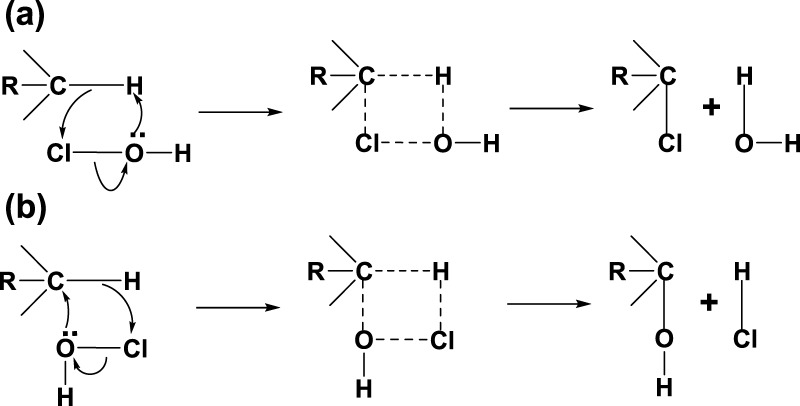
Based on the literature information and the results obtained above, a mechanism described below can provide more insight into the chlorination and oxidation (Scheme 1). The availability of proton (C–H) is the key factor in the chemical attack in the present case. This could be true and explains the fact that Teflon (poly(tetrafluoroethylene)) is inert in the present system. Both oxidation and chlorination reactions can happen at the C–H center under different modes of reaction, with HOCl passing through a cyclic intermediate. The preference of reactivity of HOCl to the proton may be governed by the electronic or steric configuration of the attached carbon. Interestingly, the reactivity of ETFE is restricted to oxidation. This may be due to the fact that fluorine is a highly electronegative group that does not allow bonding electron to be given away, as described in (a). In ECTFE, due to the presence of chlorine, steric reason dominates, making the polymer inactive to chemical reaction.
Scheme 1. Proposed Mechanism of Chlorination (a) and Oxidation (b).
3. Conclusions
Aqueous HCl containing chlorine gas system at temperature >50 °C is a very important and unique corrosion system for the corrosion-resistant materials. The said corrosion media are one of the very common systems used in various chlorination processes in the industries. Materials like PP, PET, ECTFE, ETFE, and VER (Derakane 470-300) used in the corrosion media even show some changes in the present system, which possesses acidic, chlorination, and oxidation environment to initiate the corrosion reaction. PP and PET are affected by both chlorination and oxidation, whereas ETFE could resist chlorination but failed to resist oxidation attack. ECTFE did not show any chemical change except the morphological change noticed in the XRD and SEM image, without any drop in mechanical strength. Some change was observed in VER (Derakane), but it could maintain the strength intact. FTIR, XRD, EDX, DMA, and SEM are very supportive analytical tools to evaluate the corrosion stability of the specimen investigated. The aforementioned studies recommend that ECTFE as a coating material and VER as a construction material for chemical process can be used in the corrosion media of aqueous hydrochloric acid containing chlorine gas at temperature 70 °C. The availability of methylenic proton (>CH2) is predicted to be more reactive to HOCl, whereas >C(Cl)H is observed to be inactive to HOCl mostly due to steric reason. Nevertheless, electron-withdrawing substituents in >CH2 may prevent chlorination.
4. Experimental Section
4.1. Materials and Methods
The polymer samples were obtained through original manufacturing process. The cloth sample was 40 μm in diameter × 6 in. × 6 in., whereas the sheet sample was of size 200 mm × 300 mm × 3 mm. Chlorine was obtained from GACL, India, and HCl was purchased from SD fine chemicals, India. VER was obtained having glass fiber as base material.
XRD was checked in Bruker Model D8 ADVANCE. Cu Kα beam radiation and data were analyzed through Defrac.Suite EVA software. FTIR was checked in Nicolet 6000 using ATR mode form 650 to 4000 cm–1 at a resolution of 4 cm–1. Thermogravimetric analysis and differential scanning calorimetry was done by TA Instruments, Model TGAQ500 and DSCQ2000, under air at 10 °C/min, respectively. DMA was done by Perkin Elmer Model PE8000 under air in the single-cantilever mode. SEM and energy dispersive X-ray analysis were recorded by FEI Ltd Model Nova NanoSEM 450. Puncture test (ASTM D4833), tensile strength (ASTM D638), and Barcol hardness (ASTM D2583) were tested by the laboratory instruments of Central Institute of Plastics Engineering and Technology, Ahmedabad, India.
4.2. Procedure
A jacketed glass vessel of 5 L equipped with a top lid, a chlorine gas inlet, and an outlet system was filled with 2 L of 6 wt % hydrochloric acid aqueous solution. Hot water circulation was passed through the jacket of the vessel (Figure 20). Chlorine gas was continuously purged through the inlet of the vessel and the outlet was connected to a scrubber filled with 20% caustic so that no chlorine is detected at the scrubber outlet. The solution was continuously stirred for homogeneous mixing. The system with desired corrosion media was ready for testing the specimen. The top lid was kept tightly closed during purging of chlorine gas.
Figure 20.
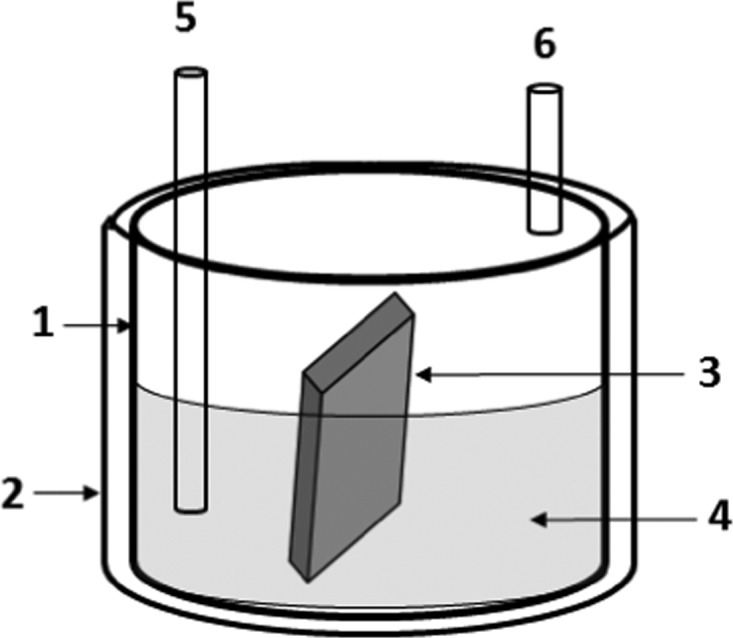
(1) Testing bath; (2) heating jacket maintaining constant temperature; (3) test specimen; (4) corrosion medium containing 6% HCl in water under chlorine purging; (5) chlorine gas inlet; (6) chlorine gas outlet.
The top lid was opened and the coupon specimens were inserted into the solution and tightly closed. The coupons were partially submerged into the solution, so that 1/4th remained in air. The process was run for nonstop 1440 h (60 days) to observe reasonable change in the coupons. There was need of three such vessels to accommodate all the testing coupons. After the desired time period, the chlorine supply was stopped and the coupons were taken out carefully without touching the surface, washed with water, and dried under air circulating oven at 70 °C for 3 h. Drying of the coupons was monitored through constant weight measurement. Completion of drying was noticed by no drop in weight. Afterward, the sample specimens were taken for testing.
Acknowledgments
Authors acknowledge Reliance Technology Group to support this work. The authors also acknowledge the support of R. Dave, V. Solanki, R. Desai, K. N. Solanki, and R. Damor.
The authors declare no competing financial interest.
References
- Hou B.; Li X.; Ma X.; Du C.; Zhang D.; Zheng M.; Xu W.; Lu D.; Ma F. The cost of corrosion in China. npj Mater. Degrad. 2017, 1, 4 10.1038/s41529-017-0005-2. [DOI] [Google Scholar]
- Popoola L. T.; Grema A. S.; Latinwo G. K.; Gutti B.; Balogun A. S. Corrosion problems during oil and gas production and its mitigation. Int. J. Ind. Chem. 2013, 4, 35 10.1186/2228-5547-4-35. [DOI] [Google Scholar]
- Koch G.; Varney J.; Thompson N.; Moghissi O.; Gould M.; Payer J.. Nace International: International Measures of Prevention, Application and Economics of Corrosion Technologies Study; Jacobson G., Ed.; NACE International: Huston, 2016. [Google Scholar]
- Vodo K. S. K.; Jekla I. U. Contact with chlorinated water: selection of the appropriate steel. Mater. Technol. 2011, 45, 639–644. [Google Scholar]
- Greenwood N. N.; Earnshaw A.. Chemistry of the Elements, 2nd ed.; Elsevier, 1997; pp 792–793. [Google Scholar]
- Schmittinger P.; Florkiewicz T.; Curlin L. C.; Lüke B.; Scannell R.; Navin T.; Zelfel E.; Bartsch R.. Chlorine, Ullmann’s Encyclopedia of Industrial Chemistry; Wiley, 2011. [Google Scholar]
- Bommaraju T. V.; Lüke B.; O’Brien T. F.; Blackburn M. C.. Chlorine, Kirk-Othmer Encyclopedia of Chemical Technology; John Wiley & Sons, Inc.: New York, 2003. [Google Scholar]
- Munshi P.; Ingle N. D.; Kapadia P. P.; Jasra R. V.. Process for Chlorination of a Polymer. U.S. Patent US20170029536A1, 2017.
- Advances in Corrosion Science and Technology; Fontana M. G., Staehle R. W., Eds.; Plenum Press: New York, 1976; p 55. [Google Scholar]
- Foroulis Z. A. Anti-Corros. Methods Mater. 1988, 35, 4–12. 10.1108/eb020667. [DOI] [Google Scholar]
- Wu L.; Baghdachi J.. Functional Polymer Coatings: Principles, Methods, and Applications; Wiley, 2015, p 368. [Google Scholar]
- Miranda T. J.Surface Coatings: 1 Raw Materials and Their Usage; Springer, 1993; p 622. [Google Scholar]
- Ryntz R. A.; Yaneff P. V.. Coatings of Polymers and Plastics; CRC Press, 2003; p 416. [Google Scholar]
- Lyon S. B.; Bingham R.; Mills D. J. Advances in corrosion protection by organic coatings. Prog. Org. Coat. 2017, 102, 2–7. 10.1016/j.porgcoat.2016.04.030. [DOI] [Google Scholar]
- Lee H.; Dellatore S. M.; Miller W. M.; Messersmith P. B. Mussel-inspired surface chemistry for multifunctional coatings. Science 2007, 318, 426–430. 10.1126/science.1147241. [DOI] [PMC free article] [PubMed] [Google Scholar]
- Panossian Z.; de Almeida N. L.; de Sousa R. M. F.; de Souza Pimenta G.; Marques L. B. S. Corrosion of carbon steel pipes and tanks by concentrated sulfuric acid. Corros. Sci. 2012, 58, 1–11. 10.1016/j.corsci.2012.01.025. [DOI] [Google Scholar]
- Tang J.; Shao Y.; Zhang T.; Meng G.; Wang F. Corrosion behaviour of carbon steel in different concentrations of HCl solutions containing H2S at 90 °C. Corros. Sci. 2011, 53, 1715–1723. 10.1016/j.corsci.2011.01.041. [DOI] [Google Scholar]
- Khadom A. A.; Yaro A. S.; Kadum A. A. H.; AlTaie A. S.; Musa A. Y. The effect of temperature and acid concentration on corrosion of low carbon steel in hydrochloric acid media. Am. J. Appl. Sci. 2009, 6, 1403–1409. 10.3844/ajassp.2009.1403.1409. [DOI] [Google Scholar]
- Gupta S. S.; Sanyal B. Corrosion of steel by chlorinated solvents and its inhibition I. Factors affecting the decomposition of CCl4 and its action on mild steel. Br. Corros. J. 1979, 14, 155–159. 10.1179/bcj.1979.14.3.155. [DOI] [Google Scholar]
- Stroo H. F.; Ward C. H.. In Situ Remediation of Chlorinated Solvent Plumes; Springer Science & Business Media: Huston, TX, 2010. [Google Scholar]
- Bonin P. M. L.; J̧dral W.; Odziemkowski M. S.; Gillham R. W. Electrochemical and Raman spectroscopic studies of the influence of chlorinated solvents on the corrosion behavior of iron in borate buffer and in simulated groundwater. Corros. Sci. 2000, 42, 1921–1939. 10.1016/S0010-938X(00)00027-5. [DOI] [Google Scholar]
- Lange J.; Wyser Y. Recent innovations in barrier technologies for plastic packaging—a review. Packag. Technol. Sci. 2003, 16, 149–158. 10.1002/pts.621. [DOI] [Google Scholar]
- Curtzwiler G. W.; Williams E. B.; Maples A. L.; Davis N. W.; Bahns T. L.; De Leon J. E.; Vorst K. L. Ultraviolet protection of recycled poly(ethylene terephthalate). J. Appl. Polym. Sci. 2017, 134, 45181 10.1002/app.45181. [DOI] [Google Scholar]
- Duarte L. T.; Silva E. M. P.; Branco J. R. T.; Lins V. F. C. Production and characterization of thermally sprayed poly(ethylene terephthalate) coatings. Surf. Coat. Technol. 2004, 182, 261–267. 10.1016/j.surfcoat.2003.08.062. [DOI] [Google Scholar]
- Paszun D.; Spychaj T. Chemical recycling of poly(ethylene terephthalate). Ind. Eng. Chem. Res. 1997, 36, 1373–1383. 10.1021/ie960563c. [DOI] [Google Scholar]
- Bhatt N. V.; Deshmukh R. R. X-ray crystallographic studies of polymeric materials. Indian J. Pure Appl. Phys. 2002, 40, 361–366. [Google Scholar]
- Johnson J. E. X-Ray diffraction studies of the crystallinity in polyethtylene terephthalate. J. Appl. Polym. Sci. 1959, 2, 205–209. 10.1002/app.1959.070020514. [DOI] [Google Scholar]
- Oyeleke G. O.; Popoola A. V.; Adetuyi A. O. Changes in surface properties and dyeability of poly(ethylene terephthalate) fibre pretreated with selected chlorinated solvents. J. Polym. Biopolym. Phys. Chem. 2015, 3, 6–11. [Google Scholar]
- Papaspyrides C. D.; Vouyiouka S. N.. Solid State Polymerization; Wiley, 2009; p 304. [Google Scholar]
- Eslamain S.Handbook of Engineering Hydrology: Environmental Hydrology and Water Management; CRC press, Taylor Francis Group, 2014; p 606. [Google Scholar]
- Arnold J. C.Environmental Effects on Crack Growth in Polymers. In Comprehensive Structural Integrity; Milne I., Ritchie R. O., Karihaloo B., Eds.; Elsevier: Pargamon, 2003; Chapter 6, Vol. 6 Environmentally Assisted Fatigue, p 299. [Google Scholar]
- Deborde M.; Gunten U. V. Reactions of chlorine with inorganic and organic compounds during water treatment kinetics and mechanisms: a critical review. Water Res. 2008, 42, 13–51. 10.1016/j.watres.2007.07.025. [DOI] [PubMed] [Google Scholar]
- Ebenezar J.Recent Trends in Materials Science and Applications. Springer Proceedings in Physics; Springer, 2017; Vol. 189, p 396. [Google Scholar]
- Cruz M. P.; Barbosa L. C. A.; Maltha C. R. A.; et al. Chemical characterization of pitch in eucalyptus pulp and paper industry. Quim. Nova 2006, 29, 459–466. 10.1590/S0100-40422006000300011. [DOI] [Google Scholar]
- Wen P.; Wu Z.; He Y.; Ye B. C.; Han Y.; Wang J.; Guan X. Microwave-assisted synthesis of a semi-interpenetrating polymer network slow-release nitrogen fertilizer with water absorbency from cotton stalks. ACS Sustainable Chem. Eng. 2016, 4, 6572–6579. 10.1021/acssuschemeng.6b01466. [DOI] [Google Scholar]
- Alves N. M.; Mano J. F.; Gómez-Ribelles J. L. Molecular mobility in polymers studied with thermally stimulated recovery. II. Study of the glass transition of a semicrystalline PET and comparison with DSC and DMA results. Polymer 2002, 43, 3627–3633. 10.1016/S0032-3861(02)00176-3. [DOI] [Google Scholar]
- Fang H.; Wang J.; Lynch R. A. Migration of di(2-ethylhexyl)phthalate (DEHP) and di-nbutylphthalate (DBP) from polypropylene food containers. Food Control 2017, 73, 1298–1302. 10.1016/j.foodcont.2016.10.050. [DOI] [Google Scholar]
- Hametner C. Polypropylene pipes for drinking water supply. J. Macromol. Sci., Part A 1999, 36, 1751–1758. 10.1081/MA-100101625. [DOI] [Google Scholar]
- Duvall D. Oxidation resistance of polypropylene random copolymer pipe to chlorinated water. J. Failure Anal. Prev. 2014, 14, 336–342. 10.1007/s11668-014-9809-3. [DOI] [Google Scholar]
- Nishino T.; Matsumoto T.; Nakamae K. Surface structure of isotactic polypropylene by X-ray diffraction. Polym. Eng. Sci. 2000, 40, 336–343. 10.1002/pen.11167. [DOI] [Google Scholar]
- Favaro M. M.; Branciforti M. C.; Bretas R. E. S. A X-ray study of β-phase and molecular orientation in nucleated and non-nucleated injection molded polypropylene resins. Mater. Res. 2009, 12, 455–464. 10.1590/S1516-14392009000400014. [DOI] [Google Scholar]
- Beccagutti B.; Cafiero L.; Pietrantonio M.; Pucciarmati S.; Tuffi R.; Ciprioti S. V. Characterization of some real mixed plastics from WEEE: a focus on chlorine and bromine determination by different analytical methods. Sustainability 2016, 8, 1107 10.3390/su8111107. [DOI] [Google Scholar]
- Andreassen E.Infrared and Raman Spectroscopy of Polypropylene. In Polypropylene; Karger-Kocsis J., Ed.; Kluwer Publishers, 1999; pp 320–328. [Google Scholar]
- Drushel H. V.; Ellerbe J. S.; Cox R. C.; Lane L. H. Infrared spectrophotometric analysis of ethylene-propylene copolymers. Anal. Chem. 1968, 40, 370–379. 10.1021/ac60258a002. [DOI] [Google Scholar]
- Zhou Z.; Jaaskelainen A. S.; Vuorinen T. Oxidation of cellulose and carboxylic acids by hypochlorous acid: kinetics and mechanisms. J. Pulp Pap. Sci. 2008, 34, 212–218. [Google Scholar]
- Schoen L. A. A.Process for Chlorinating Ethylene Polymers. U.S. Patent US4197386A1980.
- Teng H. Overview of the development of the fluoropolymer industry. Appl. Sci. 2012, 2, 496–512. 10.3390/app2020496. [DOI] [Google Scholar]
- Funaki A.; Phongtamrug S.; Tashiro K. Crystal structure analysis of ethylene–tetrafluoroethylene alternating copolymer. Macromolecules 2011, 44, 1540–1548. 10.1021/ma102785y. [DOI] [Google Scholar]
- Phongtamrug S.; Tashiro K.; Funaki A.; Arai K.; Aida S. Structural study of a series of ethylene–tetrafluoroethylene copolymers with various ethylene contents, Part 1: Structure at room temperature investigated for uniaxially-oriented samples by an organized combination of 2D-WAXD/SAXS and IR/Raman spectra. Polymer 2008, 49, 561–569. 10.1016/j.polymer.2007.11.036. [DOI] [Google Scholar]
- Calleja G.; Houdayer A.; Etienne-Calas S.; Bourgogne D.; Flaud V.; Silly G.; Shibahara S.; Takahara A.; Jourdan A.; Hamwi A.; Amedur B. Conversion of poly (ethylene-alt-tetrafluoroethylene) copolymers into poly(tetrafluoroethylene) by direct fluorination: a convenient approach to access new properties at the ETFE surface. J. Polym. Sci., Part A: Polym. Chem. 2011, 49, 1517–1527. 10.1002/pola.24588. [DOI] [Google Scholar]
- Drobny J. G.Fluoroplastics (Rapra Review Report 184); Smithers Rapra: Boca Raton, FL, 2005; Vol. 6, p 178. [Google Scholar]
- Boschet F.; Ameduri B. Copolymers of chlorofluoroethylene: synthesis, properties, and applications. Chem. Rev. 2014, 114, 927–980. 10.1021/cr2002933. [DOI] [PubMed] [Google Scholar]
- Guerra G.; Rosa C. D.; Iuliano M.; Petraccone V.; Corradini P.; Pucciariello R.; Villani V.; Ajroldi G. On the conformation and the crystalline structure of an ethylene-chlorotrifluoroethylene alternating copolymer. Makromol. Chem. 1992, 193, 549–558. 10.1002/macp.1992.021930226. [DOI] [Google Scholar]
- Randová A.; Bartovská L.; Pilnacek K.; Lanc M.; Vopicka O.; Matejka P.; Izak P.; Macedonio M. K. F.; Drioli A. F. E.; Jansen J. C.; Nicolo E. D.; Friess K.; et al. Sorption of organic liquids in poly(ethylene chlorotrifluoroethylene) Halar 901: experimental and theoretical analysis. Polym. Test. 2017, 58, 199–207. 10.1016/j.polymertesting.2016.12.027. [DOI] [Google Scholar]
- Sibilia J. P.; Schaffhauser R. J.; Roldan L. G. Molecular transitions in an alternating copolymer of ethylene and chlorotrifluoroethylene. J. Polym. Sci., Polym. Phys. Ed. 1976, 14, 1021–1028. 10.1002/pol.1976.180140606. [DOI] [Google Scholar]
- Jaswal S.; Gaur B. New trends in vinylester resins. Rev. Chem. Eng. 2014, 30, 567–581. 10.1515/revce-2014-0012. [DOI] [Google Scholar]
- Sanchez-Amaya J. M.; Osuma R. M.; Bethencourt M.; Botana F. J. Monitoring the degradation of a high solid epoxy coating by means of EIS and EN. Prog. Org. Coat. 2007, 60, 248–254. 10.1016/j.porgcoat.2007.07.020. [DOI] [Google Scholar]
- Swain C. G.; Crist D. R. Mechanisms of chlorination by hypochlorous acid. the last of chlorinium ion, Cl+. J. Am. Chem. Soc. 1972, 94, 3195–3200. 10.1021/ja00764a050. [DOI] [Google Scholar]
- Mikdam A.; Colina X.; Minarda G.; Billonb N.; Maurinc R. A kinetic model for predicting the oxidative degradation of additive free polyethylene in bleach desinfected water. Polym. Degrad. Stab. 2017, 146, 78–94. 10.1016/j.polymdegradstab.2017.09.020. [DOI] [Google Scholar]
- Ushijima Y.; Nakano M. No or little production of singlet molecular oxygen in HOCl or HOCl/H2O2; a model system for myeloperoxidase/H2O2/Cl–. Biochem. Biophys. Res. Commun. 1980, 93, 1232–1237. 10.1016/0006-291X(80)90621-X. [DOI] [PubMed] [Google Scholar]


