

Abstract

Nearly 50 years have passed since the classic studies by Larson and Lister [Larson D. W.; Lister M. W.. Can. J. Chem. 1968, 46, 823]and Hay and Leong [Hay R. W.; Leong K. N.. J. Chem. Soc. A 1971, 0, 3639]on the copper-catalyzed decarboxylation of acetonedicarboxylic acid (H3Acdica). Although the authors laid the foundations for what we know about this reaction; still very little information exists regarding the underlying aqueous metal-enol(ate)s of (acetonedicarboxylato)copper. In this study, UV–visible titrations revealed three pK values, pK[Cu(H2A)], pK[Cu(HA)], and pK[Cu(A)]. We associated the first two with ionization of α-carbon CH2 groups in [CuII(H2Acdica)keto]1+ and [CuII(HAcdica)keto]0 to form unstable metal-enolates, {[CuII(HAcdica)enolate]} and {[CuII(Acdica)enolate]}, which through β-carbonyl oxygen protonation can form metal-enols [CuII(H2Acdica)enol]1+ and [CuII(HAcdica)enol]0. The square-planar CuII center (electron paramagnetic resonance results) plays a dual role of stabilizing negative electron density at the β-carbonyl oxygen and as an electron sink in [[CuI(HAcdica)enolate]0]‡ and [[CuI(Acdica)enolate]1–]‡ (confirmed through cyclic voltammetry as two single 1e– transfers). The π → π* transition associated with [CuII(HAcdica)enol]0 was used to determine pK[Cu(A)] (deprotonation of enol OH) and enolization rate constant (stopped-flow spectroscopy) but also exhibited a time-dependent decrease in absorbance (on the order of min–1), suggesting a new method to possibly obtain experimental values for the estimated “kCuL” decarboxylation rate constant of metal-enolate [CuL]1– calculated by Larson and Lister. On the basis of our results, we postulate that decarboxylation takes place primarily through {[CuII(HAcdica)enolate]} and [CuII(HAcdica)enol]0. These results add to our understanding of aqueous metal-enol(ate)s, which contain underlying CuII/I redox chemistry, “active methylenes” and enol tautomers and enolate anions, which play roles in many catalytic reactions of interdisciplinary importance.
Introduction
Naturally occurring 1,3- and 1,3,5-β-keto(carboxylic) acids rely on β-carbonyl/α-carbon CH2 resonance to form keto-enol tautomers and enolates with transition metals and have remained as an area of continued research due to their wide importance across chemical disciplines.1 Although fundamental research studies, such as the metal-ion-catalyzed decarboxylation of oxaloacetate,2−10 have provided detailed information on reaction mechanisms, other studies seek to broaden our understanding of the biochemical significance of metal-enol(ate)s. For example, in active sites of enolases, Serratia endopeptidase, dioxygenase, and in β-keto acid cleavage enzymes, transition metals have been shown or postulated to induce enolization and stabilize reactive enolates, which otherwise do not exist at significant concentration at circumnetural pH.11−15 At physiological pH, deprotonation of β-keto acid α-carbon CH2 is generally unfavorable in the absence of metal ions or metalloenzymes, but in their presence, pathways for enol and enolate formation open up.16 Copper exhibits some of the strongest effects and has been shown to dramatically shift the pKa of α-carbon-associated enol and enolate species by an astonishing 10–12 pKa units.17 Metal-enolates are also important in C–C bond forming reactions,18,19 during Cu/O2-catalyzed aliphatic oxidation of C–C bonds, and include CuI/II redox chemistry, important to understanding electron transfer mechanisms in catalytic copper cycles.20−22 In water treatment, environmental engineers have also indicated the possible role of copper-enol(ate)s in catalyzing increased levels of hazardous halogenated disinfectant by-products following chlorination.23
Despite a significant body of published literature on β-keto(carboxylic)acid copper complexes, we were surprised to find very little recent information on the copper complexes associated with the copper-catalyzed decarboxylation of acetonedicarboxylate. Acetonedicarboxylate is a naturally occurring oxidative decarboxylation product of citric acid and is the much lesser known “1,3” β-ketoglutarate isomer of krebs cycle intermediate α-ketoglutarate.24,25
In its ketonic form, acetonedicarboxylate has two acid dissociation constants, that is, pKa1 = 3.23 and pKa2 = 4.27 at 0.01 M ionic strength and 25 °C.26 Although the keto forms are generally favored in aqueous solution, the keto-enol tautomer equilibria may be dependent on forward “enolization” (kE0, kE1, kE2) and reverse (kK0, kK1, kK2) “ketonization” or deprotonation at the β-carbonyl oxygen (pKa3, pKa4) to form enolates (shown in Scheme 1). Although UV–visible spectroscopy has been used to confirm the π → π* transition of the αβ carbonyl π-system associated with “H3Acdica(enol)” (242 nm, ε = 294 M–1 cm–1) and enolate anion “Acdica3–” (268 nm, ε = 346 M–1 cm–1), a significant increase in the decarboxylation rate constant of H2Acdica1– (2.90 × 10⁻³ min–1) in comparison to that of H3Acdica (1.25 × 10⁻³ min–1) and HAcdica2– (0.10 × 10⁻³ min–1) led the authors to suggest a six-membered enol transition state to explain the increase.26,27 There is no mention in the current scientific literature on the possible (kE0, kE1, kE2) and (kK0, kK1, kK2) values and pKa’s (pKa3, pKa4) for acetonedicarboxylate (shown in Scheme 1), but we mention them here because the enol and enolate forms of the ligand play a strong role in coordination to metal ions.8
Scheme 1. Structure of the Acetonedicarboxylic Acid Ligand Keto, Enol, and Enolate Species.

Equilbria include acid dissociation constants (pKa1, pKa2, pKa3, pKa4), ketonization rates (kK0, kK1, kK2), and enolization rates (kE0, kE1, kE2).
Without discussion of these possible equilibria in classic studies on copper-catalyzed decarboxylation of acetonedicarboxylate, accurate assignment of underlying metal-enol(ate)s would be difficult. Despite this impediment, studies by Larson and Lister (1968), Hay and Leong (1971), and Yerhoff and Larson (1972) left a significant legacy toward our knowledge on metal-ion-catalyzed decarboxylation of acetonedicarboxylate.6,26,27 Larson and Lister determined rate constants for copper-catalyzed decarboxylation of acetonedicarboxylate (kCuA and kCuL for [CuA]0 and [CuL]1– complexes, respectively, and kCu for overall), verified kCuA through monitoring absorbance at 400 nm, the [CuA]0 stability constant (log KCuA = 2.049), and enolic proton dissociation constant (pKCuA(1968) = 3.81).27 They noticed that the level of enolization (Fourier transform infrared (FTIR) and acid/base behavior results) seemed much higher with CuII than with CoII, NiII, and ZnII complexes and postulated that decarboxylation active species involved a six-membered enolate ring state (Scheme 2).
Scheme 2. Proposed Structures for [CuA]0 “[CuA(H2O)2]0” and [CuL]1– “[CuL(H2O)2]1–“, and Key Results from Classic Studies on the Copper-Catalyzed Decarboxylation of Acetonedicarboxylate.

Hay and Leong accepted the enolic dissociation constant (pKCuA(1968) = 3.81), but bell-shaped pH rate profiles led them to postulate displacement of another proton at a higher pH either from copper-coordinated H2O or a kinetically stable copper-enolate (e.g., [CuL(H2O)2]1– shown in Scheme 2) to explain the rate decrease.26 Although placement of the enolic C=C bond in [CuL]1– “[CuL(H2O)2]1–” differed between that reported by Larson and Lister and that by Hay and Leong, coordination through the Acdica3–(enolate) species was confirmed by Yerhoff and Larson through isolation of a bright green metal-bridged polymer compound (NaCuL·XH2O, thermogravimetric analysis, FTIR, and powder X-ray diffraction analysis).6 This verified the existence of a metal-enolate but could not explain the chemistry of any potential overlooked enol or enolate copper complexes in aqueous solution or resolve which complexes were responsible for decarboxylation.
To address the unresolved issues brought up by these studies and provide much needed insight into the aqueous metal-enol/enolate complexes associated with the copper-catalyzed decarboxylation of acetonedicarboxylate, we undertook the present study. Through our results, analysis, and discussion, we were able to uncover the underlying chemical properties of aqueous metal-enol and metal-enolate complexes that help in explaining their reactivity in regard to catalyzing decarboxylation.
Results and Discussion
Electronic Spectra and UV–Visible Spectral Titrations for pKa Determination
We conducted acid–base titrations (Figure S1), but besides the readily discernable first derivative final equivalence point (Figure S2), pKa values could not be determined with high accuracy. Before pH 4.0, the (acetonedicarboxylato)copper solution was clear but became light green between pH 4.0 and 4.5 and then the green color intensity increased up to a pH of 7.00 where precipitates were visible (see Figures S1 and S3 for visual). Because of the limitations of acid–base titrations, we turned to UV–visible spectral titrations. In classic studies, only one band (400 nm) was mentioned over the visible wavelength range and was used to conduct a continuous method of variation plots and calculate the apparent molar absorbance values of [CuA]0 (205 M–1 cm–1) and [CuL]1– (30 M–1 cm–1) from nonlinear regression fitting to absorbance data.27 Additionally, previous studies employed relatively large concentrations (on the order of 10–3–10–2 M). Although a high concentration would be beneficial to measure rates of decarboxylation, higher concentrations may not be needed to analyze the UV region. In our analysis of (acetondedicarboxylato)copper solution, we chose concentrations of 14, 1.4, and 0.1 mM and scanned a wavelength range from 190 to 900 nm. UV–visible spectral studies served a dual purpose: (1) to further explore copper-based bands and intraligand transitions and (2) to obtain new pKa values through titrations. Visible spectra and titration of 14 and 1.4 mM (acetonedicarboxylato)copper solutions are shown in Figure 1.
Figure 1.

UV–visible spectral titration of the (acetonedicarboxylato)copper solution at different pH values: (a) 14 mM and (b) 1.4 mM. At 25 °C, μ = 0.01 M (NaCl) and pH increments = 0.25. Spectral titration curves plotted as a function of pH: (c) 14 mM solution titration data used to find pK[Cu(H2A)] at 400 and 757 nm and (d) 1.4 mM solution titration data used to find pK[Cu(HA)] at 400 and 757 nm. Curve-fitted lines represent the Henderson–Hesselbalch equation.
At pH 5.75 and above (14 mM solution), there was significant formation of green hydrolyzed solids, inhibiting further UV–visible spectral analysis, but in 1.4 and 0.1 mM solutions, only a small portion of hydrolyzed products appeared between pH 6.5 and 7.0. The two main bands associated with copper complexes were at 400 nm (151 M–1 cm–1) and 757 nm (60.7 M–1 cm–1) (shown in Figure 1a,b). The molar absorbance in our study differed from the apparent molar absorbance value for 400 nm (205 M–1 cm–1) calculated by Larson and Lister, primarily due to differing methods of calculation. Following a short recalculation to account for the difference in calculation methods and assumptions (see Additional Experimental Methods section of the Supporting Information), we obtained a value much closer to ours (155.2 M–1 cm–1). Converting to energy, the 400 nm band (25 000 cm–1) is significantly higher than the weak transition at 757 nm (13 210 cm–1) and falls within the 20 000–25 000 cm–1 range associated with electronic charge-transfer transitions in copper complexes.28,29 We associate these bands with an enolic oxygen ligand-to-metal charge transfer, (O)π → CuII transition, and d–d transition, respectively. The 2p → d charge transfer between ligand oxygen 2px/2py π-orbitals and the copper 3d electron shell and the 757 nm d–d transition are largely Laporte forbidden, but d–p mixing helps in relaxing Laporte rules, giving the observed spectra.30 These results are in agreement with the accounts in the literature of significant overlap between the π-system (β-carbonyl/C=C) of similar-structured 1,3-, 1,3,5-β-keto acid, β-diketone, and α-hydroxy carboxylic acid ligands with copper or transition-metal orbitals.7,31−35 Nonlinear fits to determine pKa in the 14 mM solution returned values of pK[Cu(H2A)] = 3.88 ± 0.02 at 400 nm and pK[Cu(H2A)] = 3.85 ± 0.02 at 757 nm (see Figure 1c). In the 1.4 mM solution, nonlinear fits revealed pKa values of pK[Cu(HA)] = 4.78 ± 0.03 at 400 nm and pK[Cu(HA)] = 4.71 ± 0.05 at 757 nm (see Figure 1d). The reason for obtaining different pKa values by switching the concentration 14 versus 1.4 mM may be due to changes in the concentration of free and complexed ligands in solution brought about by underlying equilibria and pH effects. The first step in copper catalysis at acidic pH is “ketonic” complex formation, [CuII(H2Acdica)keto]1+, with pK[CuH2A]]ave = 3.865 associated with ionization of the α-carbon CH2 group to form an unstable metal-enolate {[CuII(HAcdica)enolate]} (shown in Scheme 3).
Scheme 3. Newly Proposed Equilbria for (Acetonedicarboxylato)copper Solutions Associated with pH Values Close to pK[Cu(H2A)].

The metal-enolate species can undergo fast protonation to form a metal-enol, [CuII(H2Acdica)enol]1+, which is far more stable at acidic pH than the metal-enolate. At pH 3.5, H+ concentrations of the 1.4 and 14 mM (acetonedicarboxylato)copper solutions are 4.4 and 44 times higher than [H+] = 3.14 × 10⁻⁴ M and increase to 14 and 140 times at pH 4.0 ([H+] = 1.0 × 10⁻⁴ M), respectively. At similar or comparable concentrations of [Cu(HxAcdica)] and [H+], it is possible that protonated species H2Acdica1–(enol) and H2Acdica1–(keto) will be preferred over copper complexes. Evidence of this could be found in Larson and Lister, where at pH below pKCuA(1968) = 3.81 (pK[Cu(H2A)] in this study), rates of decarboxylation in (acetonedicarboxylato)copper solutions were only 20% higher than those in acetonedicarboxylate solutions without copper, indicating a marginal increase in reactivity.27 Competition between H+ and CuII ions for ligands and catalyzed enolization reactions at acidic pH has also been found in studies on oxalacetate, 2-oxalopropionic acid, and acetylacetone metal-enol(ate)s.2−5,7,37 An inflection point over the pH range 3.0–4.0 of the pH-dependent bell-shaped copper-catalyzed decarboxylation rate constant profile in Hay and Leong happened to coincide with pK[Cu(H2A)], which falls between those two pH values. This inflection point may therefore provide a previously overlooked hint toward the underlying reaction mechanism. The location of the C=C bond in {[CuII(HAcdica)enolate]} (Scheme 3) would assist the drive for the electron shift needed to induce decarboxylation at the terminal carboxylic group. The formation of the C=C bond outside the six-membered ring transition state in {[Cu(n–1)(HAcdica)enolate]} would lead to a “kinetic enolate” effect as opposed to a “thermodynamic enolate” effect with a C=C bond inside the six-membered ring (Scheme 4).36
Scheme 4. Proposed Decarboxylation Active Species Associated with kCuA.

Invoking this knowledge may help in explaining why the kCuA decarboxylation rate constant (201 × 10–3 min–1) is 36 times faster than the estimated rate constant for kCuL (5.6 × 10⁻³ min–1).27 This would make unstable {[CuII(HAcdica)enolate]} associated with pK[Cu(H2A)] and subsequent {[Cu(n–1)(HAcdica)enolate]} responsible for decarboxylation.
At a lower metal/complex concentration (1.4 mM), protonated species H2Acdica1–(enol), H2Acdica1–(keto), and HAcdica2–(keto) are favored over {[CuII(HAcdica)enolate]} and [Cu(H2Acdica)enol]1+. At pH beyond ligand pKa2 = 4.27, the HAcdica2–(keto) concentration increases, allowing the formation of a ketonic [CuII(HAcdica)keto]0 species (Scheme 5).
Scheme 5. Newly Proposed Equilbria for (Acetonedicarboxylato)copper Solutions Associated with pH Values Close to pK[Cu(HA)] and pK[Cu(A)].
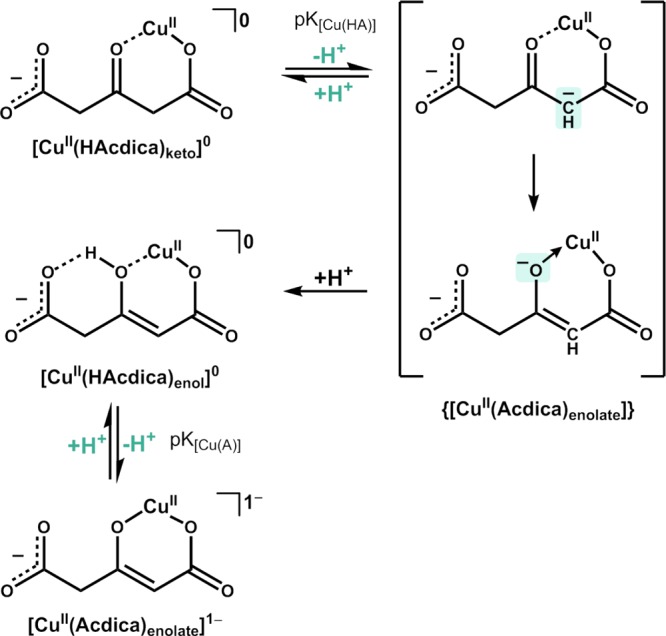
The [CuII(HAcdica)keto]0 species undergoes deprotonation at α-carbon (pK[Cu(HA)]) to form unstable metal-enolate {[CuII(Acdica)enolate]} (Scheme 5), which can be protonated at the β-carbonyl oxygen to form metal-enol [CuII(HAcdica)enol]0. Intramolecular hydrogen bonding with the ionized carboxylic group of [CuII(HAcdica)enol]0 may help in stabilizing the enolic proton in a configuration that still allows charge transfer from the oxygen to the copper center to initiate catalysis (Scheme 6).38
Scheme 6. Proposed Decarboxylation Active Species Associated with kCuL.

At pH range 6.0–7.0, the H+ concentration is low and deprotonation of [CuII(HAcdica)enol]0 becomes favorable. This manifest itself as pK[Cu(A)] between [CuII(HAcdica)enol]0 and [CuII(Acdica)enolate]1– and is supported by the ability of Yerhoff and Larson to isolate a NaCuL·2H2O species. The possible explanations why previous studies may not have found pK[Cu(HA)] are as follows: the higher concentrations employed, use of different analytical methods, and the presence of acetate/chloroacetate buffers, which could interact with (acetonedicarboxylato)copper complexes.26,27
At 0.1 mM concentration of (acetonedicarboxylato)copper, we could examine the UV range during titrations in considerable detail (see Figure 2). The spectral titration spanned from pH 1.5 to 7.25 and had three bands of interest. We assigned the main band at 246 nm (6970 M–1 cm–1) to the π → π* transition of [CuII(HAcdica)enol]0 based on the molar absorbance of roughly the same order of magnitude as that of the acetonedicarboxylate enol in 95% EtOH (2713 M–1 cm–1).26 The lowering of energy between wavelengths 242 nm (41 322.3 cm–1) and 246 nm (40 650.4 cm–1) implies increased stabilization of the copper-enol(ate) complexes compared to that of the free acetonedicarboxylate enol and [CuII(H2Acdica)enol]1+.
Figure 2.

UV–visible spectral titration of the (acetonedicarboxylato)copper solution at different pHs: (a) [(acetonedicarboxylato)copper] = 0.1 mM, μ = 0.01 M (NaCl), and temperature = 25 °C and (b) spectral titration data points at 246 nm with nonlinear curve fitting between pH 3.0 and 7.0 to determine pK[Cu(A)].
We associate the 242 nm band shown in the inset of Figure 2a with the π → π* transition of H2Acdica1–(enol) and [CuII(H2Acdica)enol]1+, which may occur together in (acetonedicarboxylato)copper solutions. An isosbestic point (Ip1) at pH 4.25 separates the 242 nm band associated with H2Acdica1–(enol) and [CuII(H2Acdica)enol]1+ from the broad 246 nm band associated with the [CuII(HAcdica)enol]0 complex. Nonlinear fits to absorbance data at 246 nm (Figure 2b) returned pK[Cu(A)] = 6.23 ± 0.04. This value is somewhat close to the pKa value of Cu(H2O)n2+ hydrolysis (pKa = 6.8 at 25 °C) and was also postulated by Hay and Leong to possibly lie somewhere between pHs 6 and 7.26,39 Instead, we associate this with deprotonation of [CuII(HAcdica)enol]0 at the enolic oxygen to form [CuII(Acdica)enolate]1– because metal-enol(ate)s can be deprotonated at the α-carbon or β-carbonyl oxygen (Scheme 5).8 To confirm the stoichiometry of aqueous complexes at different pHs, we used the method of continuous variation (Figures S6 and S7). At pHs 4.8 and 5.5, data points were symmetric with a peak at χ = 0.5, indicating a 1:1 complex stoichiometry for the 246 nm band associated with [CuII(HAcdica)enol]0 (shown in Figure S6b,d). Using the absorbance at 400 nm for the continuous method of variation plots at pH values 3.6, 4.2, and 4.7, Larson and Lister showed that all exhibited a maximum at 0.5, indicating 1:1 complexes.27 Following suit, we analyzed copper-based bands 400 nm (and 757 nm) at pHs 4.0, 5.5, and 6.5 (shown in Figure S7a–c, respectively). At pH 4.0, the 757 nm band was unsymmetrical, whereas the 400 nm absorbance had a maximum at roughly χ = 0.5–0.6. At pH 5.5, both 400 and 757 nm had a maximum at χ = 0.5, indicating 1:1 ligand-to-copper stoichiometry. At pH 6.0, both 400 and 757 nm had maximum absorbance at χ = 0.5–0.6, indicating nearly 1:1 stoichiometry (Table 1).
Table 1. UV–Visible Spectral (Electronic) Information of the (Acetonedicarboxylato)copper Solutiona.
Copper-Catalyzed Enolization Kinetic Rate Constant Determination
Copper-catalyzed enolization is generally presumed to be greatly favored over the reverse ketonization rate constants, with the exception of acidic pH where the H+ concentration is high enough to compete with CuII ions for ligand coordination.37 At [CuII(HxAcdica)] ≫ [H+], [CuII(H2Acdica)enol]1+ formation is favored (eq 1) and is supported by our ability to determining pK[CuH2A] only in the 14 mM solution (Figure 1a,c).
| 1 |
But when [CuII(HxAcdica)] ≤ [H+], ketonic complex [CuII(H2Acdica)keto]1+ and protonated species are favored, which allowed the detection of the second (pK[Cu(HA)]) (Figure 1b,d) and subsequent formation of [CuII(HAcdica)enol]0 through enolization of [CuII(HAcdica)keto]0. This is illustrated below in eqs 2–4.
| 2 |
| 3 |
| 4 |
where kE3 and kE4 are the enolization rate constants and kK3 and kK4 are the ketonization rate constants. The forward rate constants (kE3 and kE4) include intermediate steps of α-carbon deprotonation, metal-enolate formation, and finally protonation at the β-carbonyl oxygen (Schemes 3 and 5). The equilibria involving CuII may be related to the log KCuA = 2.049 stability constant determined by Larson and Lister. To determine forward copper-catalyzed enolization rate constants, we conducted stopped-flow kinetics experiments in acetate-buffered solutions (pHs 3.50, 4.40, 4.97, and 5.50) and monitored UV absorbance changes at either 242 or 246 nm. Stopped-flow kinetic traces at pH 3.50 measured using 242 nm absorbance changes (not shown) were used to try to obtain kE3 for the enolization reaction, CuII + H2Acdica1–(keto) “[CuII(H2Acdica)keto]1+” = [CuII(H2Acdica)enol]1+, but fits to data returned low R2 values (R2 = 0.50–0.63 with kE3 ≈ 0.05–0.07 s–1). We attributed this to somewhat poor buffering at a lower pH and competing reactions in eqs 2–4. Kinetic runs at pH 5.5 (shown in Figure 3) were assigned to the enolization reaction, CuII + HAcdica2–keto “[CuII(HAcdica)enol]0” = [CuII(HAcdica)enol]0, in which we obtained R2 = 0.99 with kE4(ave) = 0.213 ± 0.001 s–1.
Figure 3.

First-order kinetics of [CuII(HAcdica)enol]0 complex formation at pH 5.5. [CuII] = 0.5 mM, [acetonedicarboxylate] = 0.5 mM, μ = 0.01 M (NaCl), and temp. = 25 °C, where kE4-1–kE4-4 represent rate constants from four independent kinetic runs (n = 4).
The enolization rate constant for [CuII(HAcdica)enol]0 formation was on the same order as that of the copper-catalyzed enolization of oxaloacetate “oxac2–”, that is, [Cu(oxac)keto] ⇆ [Cu(oxac)enol] with kenol = 0.41 s–1 and ketonization kketo = 0.04 s–1.34,37kE4(ave) is 3–4 times higher than kE3, indicating that formation of the acidic [CuII(H2Acdica)enol]1+ complex takes place at a significantly lower rate than that of [CuII(HAcdica)enol]0. At the 0.5 mM concentration employed in the stopped-flow experiments, the low kE3 may represent additional evidence in support of competition between CuII and H+ for ligands at acidic pH, as we mentioned earlier. In [CuII(HAcdica)enol]0, the enolic C=C bond is most likely formed within the six-membered ring transition state, as evidenced by a shift in wavelength to 246 nm and significant increase in molar absorbance, indicating increased bond conjugation (Schemes 5 and 6). Although we did not measure ketonization rates (kK3 and kK4) in the current study, analysis in a future study might be beneficial (Table 2).
Table 2. UV–Visible Spectral Titration pKa Values and Enolization Rate Constantse.
| UV–visible spectral titration | |||
| [CuII(H2Acdica)keto]1+ ⇆ {[CuII(HAcdica)enolate]} + H+ | pK[Cu(H2A)] | 3.88 ± 0.02a | 3.85 ± 0.02a |
| [CuII(HAcdica)keto]0 ⇆ {[CuII(Acdica)enolate]} + H+ | pK[Cu(HA)] | 4.78 ± 0.03b | 4.71 ± 0.05b |
| [CuII(HAcdica)enol]0 ⇆ [CuII(Acdica)enolate]1– + H+ | pK[Cu(A)] | 6.23 ± 0.04c | |
| from Larson and Lister (1968) | |||
| [CuA]0 ⇆ [CuL]1– + H+ | pKCuA(1968) | 3.81d | |
| Enolization rate constant | |||
| CuII + H2Acdica1– (keto) → [Cu(H2Acdica)enol]1+ | kE3 | 0.05–0.07 s–1 | |
| CuII + HAcdica2– (keto) → [Cu(HAcdica)enol]0 | kE4(ave) | 0.213 ± 0.001 s–1 |
μ = 0.6 M (NaClO4), temperature = 25 °C.
Note: pK[Cu(H2A)] and pK[Cu(HA)] involve deprotonation at the α-carbon methylene groups, whereas pK[Cu(A)] involves deprotonation at the β-carbonyl oxygen. “{ }” indicates unstable species.
Electrochemical Cyclic Voltammetry (CV)
Over the −0.6 to +0.6 V scan range, in total there were three cathodic peaks (I = Epc1, II = Epc2, III = Epc3) and three anodic peaks (IV = Epa4, V = Epa5, VI = Epa6) corresponding to redox couples I–VI, II–V, and III–IV (see Figure 4 and Table 3). Although there are three redox couples, the spectra are indicative of primarily two single 1e– transfers.40 The first is redox couple I–VI (present from pH 3.0 to 6.0/6.5), and the second is redox couple III–VI (present from pH 3.0 to 7.0). Redox couple II–V also represents a 1e– transfer but is a minor species because it appears at pH 5.5. Redox couple I–VI had |Ipa6/Ipa1| ≠ 1.0 and peak splitting ΔEp (Epc1–Epa6 = 0.214–0.250 V vs Ag/AgCl) larger than that of both II–V and III–IV redox couples (Epc2–Epa5 = 0.154–0.153 V vs Ag/AgCl and Epc3–Epa4 = 0.067–0.091 V vs Ag/AgCl, respectively) (shown in Table S1).
Figure 4.

Cyclic voltammogram scans of the 1.0 mM solution of (acetonedicarboxylato)copper at various pHs with a glassy carbon (GC) working electrode and a Pt auxillary electrode with potential measured against a Ag/AgCl reference electrode at 25 °C. Scan window = −0.6 to + 0.6 V. Scan rate = 0.05 V s–1. Electrolyte = 0.1 M NaCl in N2-saturated solutions.
Table 3. Redox Potential from CV Scans of the (Acetonedicarboxylato)copper Complex in N2-Saturated Solutions at Different pHsa,b,c,d.
| I | II | III | IV | V | VI | Eo′ | |
|---|---|---|---|---|---|---|---|
| pH | Epc1 | Epc2 | Epc3 | Epa4 | Epa5 | Epa6 | [(Epc3 + Epa4)/2] |
| 3.0 | –0.028 | 0.191 | 0.100 | –0.255 | |||
| (0.182) | (0.401) | (0.310) | (−0.045) | ||||
| 3.5 | –0.029 | 0.186 | 0.100 | –0.248 | 0.143 | ||
| (0.181) | (0.396) | (0.310) | (−0.038) | (0.353) | |||
| 4.0 | –0.034 | 0.181 | 0.100 | –0.248 | 0.141 | ||
| (0.176) | (0.391) | (0.310) | (−0.038) | (0.351) | |||
| 4.5 | –0.050 | 0.174 | 0.100 | –0.256 | |||
| (0.160) | (0.384) | (0.310) | (−0.046) | ||||
| 5.0 | –0.060 | 0.174 | 0.100 | –0.285 | |||
| (0.150) | (0.384) | (0.310) | (−0.075) | ||||
| 5.5 | –0.044 | 0.000 | 0.167 | 0.100 | –0.154 | –0.294 | |
| (0.166) | (0.210) | (0.377) | (0.310) | (0.056) | (−0.084) | ||
| 6.0 | –0.048 | 0.012 | 0.167 | 0.100 | –0.141 | ||
| (0.162) | (0.222) | (0.377) | (0.310) | (0.069) | |||
| 6.5 | –0.049 | 0.013 | 0.168 | 0.100 | –0.141 | ||
| (0.161) | (0.223) | (0.378) | (0.310) | (0.069) | |||
| 7.0 | 0.169 | –0.169 | |||||
| (0.379) | (0.041) |
Epcx = cathodic peak potential, Epcy = anodic peak potential, and Eo′ = standard reduction potential.
Rows containing nonbold values are original data (V vs Ag/AgCl) and rows containing bold values are V vs standard hydrogen electrode (SHE).
For calculation, V vs SHE = V vs Ag/AgCl + 0.210 V.45
Eo′ was calculated only at pHs 3.5 and 4.0 because these had |Ipa4/Ipc3| ≈ 1.0 (see Table S1) for data.
The large difference in size between I and VI suggests that reduction in I may be associated with an electron transfer from the acetonedicarboxylate ligand to the copper center, resulting in decarboxylation and consequently an “irreversible” reaction. Plotting the current of I (Epc1) as a function of pH yielded a curve similar to UV–visible spectral titration curves with a large ∼30 μA drop in current between pHs 4.0 and 4.5 (Figure S8a). Below that pH range, the complexes in the solution are [CuII(H2Acdica)keto]1+ and [CuII(H2Acdica)enol]1+ (Scheme 3). Although Hay and Leong proposed that a “keto” complex (e.g., [CuL(H2O)2]1– as shown in Scheme 2) was responsible for the large increase in rate constant for copper-catalyzed decarboxylation of acetonedicarboxylate and has been supported by oxaloacetate studies pointing toward a highly reactive acidic keto complex, we propose instead that unstable {[Cu(n–1)(HAcdica)enolate]} (Scheme 4) provides the additional “push” for catalysis.8,26 On the basis of this and information in Scheme 3, the reduction I and oxidation VI peaks of redox couple I–VI can be represented as eqs 5 and 6, respectively
| 5 |
| 6 |
The pH behavior of redox couple III–IV helped considerably in the assignment of the reaction associated with the second 1e– copper center reduction. Peak splitting, ΔEp (Epc3–Epa4 = 0.067–0.091 V vs Ag/AgCl), was the smallest compared to that for redox couples I–VI and II–V. We also noticed that redox couple III–IV is reversible only at a very limited pH range. At pHs 3.5 and 4.0, |Ipa4/Ipa3| = 1.027 and 1.076 but decreased to 0.640, 0.591, 0.422, 0.362, and 0.362 at pHs 4.5, 5.0, 5.5, 6.0, and 6.5, respectively (see Table S1). With |Ipa4/Ipa3| ≈ 1.0 at pHs 3.5 and 4.0, we could calculate the formal reduction potential, Eo′, as 0.353 and 0.351 V versus SHE, respectively (see Table 3). Because pK[Cu(H2A)] is in very close proximity to this pH range, it is highly likely that the reversible 1e– transfer of III–IV at acidic pH (3.5–4.0) may be associated with interconversion between [CuII(H2Acdica)enol]1+ and [[CuI(HAcdica)enolate]]‡. The current of anodic peak IV (Ipa4) plotted as a function of pH exhibited an approximate inflection point at pH ∼4.75 (shown in Figure S8b). To explain the proximity to pK[Cu(HA)] and departure from unity (|Ipa4/Ipa3| ≠ 1) at increasing pH, we return to Schemes 5 and 6 where deprotonation at α-carbon CH2 in [CuII(HAcdica)keto]0 prior to ring closure in {[CuII(Acdica)enolate]} shows that electron density can be shifted from the β-carbonyl oxygen onto the copper center. This similar type shift in electron density from the ionized α-carbon “CH2” group in (pentane-2,4-dione)copper allowed the copper center to act as an electron sink.2,5,22,41 A similar phenomenon was found in 23 aliphatic/aromatic substituted 1,3-diketo copper chelates, but they had mostly negative potentials +0.038 to −0.687 V versus SCE (+0.238 to −0.487 V vs SHE) in comparison to those for III (+0.401 to +0.377 V vs SHE) found in our study (Table 3).42 Even though acetonedicarboxylate has two carboxylic groups that are moderately electron-withdrawing, the high favorability of CuII coordination to RCOO– may help in neutralizing this effect.43 A reduction potential higher than standard reduction potentials of CuII → CuI (+0.153) and CuII → Cu0 (+0.337) indicates the favorability of the copper center in III–IV as an electron acceptor.44 On the basis of the aforementioned data, “reversibility” in III–IV can be shown as eq 7, whereas “irreversibility” in III and IV at a higher pH is shown in eqs 8 and 9 below:
At pH 3.5–4.0
| 7 |
At pH 4.5–7.0
| 8 |
| 9 |
Enolization step “kE4” leading to [CuII(HAcdica)enol]0 formation is finished on the order of s–1 (see Figure 3) while the decarboxylation reaction is on the order of min–1. To confirm [CuII(HAcdica)enol]0 instability, we monitored the absorbance of 246 nm of a 0.11 mM solution of (acetonedicarboxylato)copper as a function of time at pH 7.0 (shown in Figure S5). Although formation of {[CuII(Acdica)enolate]} is possible over the 4.5–7.0 pH range, formation of protonated metal-enol [CuII(HAcdica)enol]0 is significantly more favorable due to the increased stability imbued through β-carbonyl/terminal COO– group hydrogen bonding or hydrogen bonding with solvent H2O (Scheme 5). To make an assignment for the II–V redox couple, we once again relied on a plot of V (Ipa5) current as a function of pH (Figure S8), which showed a sigmoid curve with midpoint between pHs 6.0 and 6.5, which would be in direct accordance with the pK[Cu(A)] value from UV–visible spectral titrations. The II–V redox couple appeared at pH 5.5, and by pH 7.0, I–III are almost completely gone, with V increasing in current from pH 5.5 to 7.0, indicating only reoxidation (Figure 4 inset) of the copper center. To explain the irreversibility of II–V, II can be associated with the formation of an aqueous and solid hydrolyzed metal-enolate most likely similar in structure to the NaCuL·2H2O solid isolated by Yerhoff and Larson, which may aggregate as a metal-bridged polymer (Scheme 2). This is shown below in eqs 10 and 11
| 10 |
| 11 |
Electron Paramagnetic Resonance (EPR) Spectra of (Acetonedicarboxylato)copper
Low-temperature (100 K) EPR X-band scans were conducted at pHs 4.0, 4.5, 4.75, 5.5, 6.0, and 7.0 (shown in Figure 5). The four-peak hyperfine splitting corresponded to the magnetic moment between 63/65Cu isotopes with I = 3/2 and spin of CuII 3d9 (S = 1/2).
Figure 5.

X-band EPR spectra of 1.0 mM (acetonedicarboxylato)copper and 10% v/v glycerol solution at different pHs. X-band ∼9.437 GHz, module frequency = 100 kHz, power = 10.02 mW, μ = 0.01 M (NaCl), and temperature = 100 K.
The spectra exhibited normal anisotropy with g|| > g⊥ > 2.0023, indicating a 3dx2–y2 ground state (Table 4) implying an elongated octahedral, square pyramidal or square-planar geometry.46 On the basis of the isolated compound, NaCuL·2H2O, where L = C5H3O5, we could infer some information about the coordination structure.6,27 A hydration number of 2 would most likely agree with a square-planar structure, that is, copper-coordinated to the β-carbonyl oxygen, carboxylate group oxygen, and neutral H2O ligands opposite to the other coordinating oxygen atoms on the x–y plane (i.e., a [Cu(Acdica)(H2O)2]1– complex). In the EPR spectra of copper-citrate, Malmstrom and Vangaard assigned a CuO2 chromophore with two oxygens on the xy plane based on g|| = 2.349 and g⊥ = 2.074 to a d–d band at 13 700 cm–1, whereas in the work of Dunhill and Vangaard (g|| = 2.37 and g⊥ = 2.07), copper-citrate was assigned a distorted octahedral geometry.47,48 The g-factors of g|| ≈ 2.403 and g⊥ ≈ 2.077 (Table 4) and the d–d transition of (acetonedicarboxylato)copper (13 210 cm–1) are close to these values, so binding to at least two oxygens on the xy plane is a reasonable assignment. However, solvent H2O could presumably take the remaining coordinating positions on the xy and z axes, which may lead to an overall distorted octahedral geometry in solution. To further confirm either a CuO2 or CuO4 chromophore with (acetonedicarboxylato)copper, we converted A|| to mK to compare with that from Peisach and Blumberg.49 Converted A|| values were 11.36, 11.15, 10.94, 11.44, and 11.71 at pHs 4.0, 4.5, 4.75, 5.5, and 6.0, respectively, and fell at the lower range of ∼12 mK for nonblue type 2 copper complexes with a CuO4 chromophore. The parallel hyperfine splitting (A||) of type 2 copper complexes is also known to resemble aqueous copper ions, that is, [Cu(H2O)6]2+ (124 × 10–4 and/or 127 × 10–4 cm–1).50−52 At pHs 4.0, 5.5, and 6.0, parallel hyperfine splitting values were very close with 121.48 × 10⁻⁴, 122.38 × 10⁻⁴, and 125.30 × 10⁻⁴ cm–1, respectively. The decrease at pHs 4.50 and 4.75 to 119.30 × 10⁻⁴ and 117.05 × 10⁻⁴ cm–1 is close to pK[Cu(HA)] and may indicate a change in the copper coordination sphere. Assuming the CuO4 square-planar chromophore, the ratio g||/A|| indicates the amount of tetrahedral distortion in square-planar complexes, with very low distortion at 105–135 cm and increasing distortion at 220–700 cm.53 The values at pHs 4.50 (215.44 cm) and 4.75 (219.63 cm) fall closest to this range, thus indicating significant tetrahedral distortion. The metal-enol complexes of (acetonedicarboxylato)copper start in the CuII oxidation state, but CuIIL-type complexes can undergo tetrahedral distortion to approximate the preferential geometry of aqueous CuI and metastable CuIL type complexes, which are not as constrained by specific geometric coordination modes.54 As the pH is increased to 7.0, the four hyperfine splitting peaks become undetectable and the EPR spectral intensity decreases, indicating the formation of an “EPR-silent” species at pH 7.0 (see Figure 5). The presence of the d–d transition (757 nm) at pH 7.0 would seem directly in opposition to the EPR spectra because diamagnetic (3d10) species would be colorless over the visible wavelength range. However, the disappearance of CV “reduction” peaks I–III at pH 7.0 leaving only the anodic “oxidation” peak V (Figure 4) indicates that unstable [CuI(Acdica)enolate]1– (aq) is easily reoxidized to [CuII(Acdica)enolate]1– (aq), which is more stable in aqueous solution (eqs 10 and 11). On the basis of these findings, actual reasoning for the broadening and loss of hyperfine structure in frozen glassy state may therefore be due to exchange between the paramagnetic and diamagnetic species in aqueous solution.55 This paramagnetic/diamagnetic copper center exchange might also explain the reasoning behind the metal-bridged polymer solid structure (Scheme 2) proposed by Yerhoff and Larson because a metal-bridged polymer might have copper in both CuII and CuI oxidation states. To obtain additional information on the covalency or ionic nature of in-plane σ-bonds and out-of-plane π-bonding, we calculated corresponding α2 and β2 values, respectively, where unity means primarily ionic σ-bonding or π-bonding and α2 or β2 = 0.5 corresponds to primarily covalent bonding.56,57 For calculation of α2, we used eq 12
| 12 |
where α2 is the covalency of in-plane σ-bonds. Parameters A||, g||, and g⊥ are taken from Table 4; “ge” is the free electron value (ge = 2.0023) and “P” is the dipolar interaction term (0.0360 cm–1).56 To calculate β2, we employed eq 13, which can be rewritten as eq 14
| 13 |
| 14 |
where β2 is the covalency of out-of-plane π-bonds. Parameters g|| and α2 were taken from Table 4, ge is the value for the free electron, and λ is the spin-orbit coupling constant of free copper (828 cm–1). Finally, ΔE is the crystal field splitting energy in cm–1 for the d–d transition at 757 nm (i.e., 13 210.04 cm–1). At pHs 4.0, 4.5, 4.75, 5.5, and 6.0, α2 = 0.78–0.80, which is roughly halfway between unity and 0.5, indicating that there is significant covalency in the Cu–O in-plane σ-bonds on the x–y axis and in the range similar to that for other oxygen-bonded copper carboxylic complexes in the literature. For the β2 values, out-of plane π-bonding is strictly ionic (β2 = 1.00–1.03).
Table 4. EPR Parameters for (Acetonedicarboxylato)copper Solutionsa.
| g|| | g⊥ | A|| | α2 | β2 | g||/A|| | |
|---|---|---|---|---|---|---|
| pH 4.00 | 2.401 | 2.078 | 121.48 | 0.79 | 1.01 | 211.41 |
| pH 4.50 | 2.403 | 2.077 | 119.30 | 0.78 | 1.02 | 215.44 |
| pH 4.75 | 2.404 | 2.077 | 117.05 | 0.78 | 1.03 | 219.63 |
| pH 5.50 | 2.401 | 2.078 | 122.38 | 0.79 | 1.01 | 209.78 |
| pH 6.00 | 2.405 | 2.077 | 125.30 | 0.80 | 1.00 | 205.29 |
| pH 7.00 | 2.077 |
Note: A|| are in (×10–4) cm–1. α2 and β2 are unitless. g||/A|| are in cm.
Conclusions
In this study, we employed UV–visible spectra and spectral titrations, stopped-flow kinetics, CV, and EPR to uncover new important details on the aqueous metal-enol(ate)s associated with the copper-catalyzed decarboxylation of acetonedicarboxylate. Spectral titrations revealed pK[Cu(H2A)] and pK[Cu(HA)] (ionization of β-carbonyl adjacent αCH2 groups) and pK[Cu(A)] (enol “OH” ionization in [CuII(HAcdica)enol]0 to form metastable {[CuII(Acdica)enolate]}). Ionization in pK[Cu(H2A)] and pK[Cu(HA)] is followed by a shift in electron density to the β-carbonyl oxygen, forming unstable metal-enolates, {[CuII(HAcdica)enolate]} and {[CuII(Acdica)enolate]}. The unstable metal-enolates can proceed decarboxylation (through CuII acting as a catalytic electron sink prior to the decarboxylation step) but can also form metal-enols [CuII(H2Acdica)enol]1+ and [CuII(HAcdica)enol]0. Preliminary results monitoring the decrease in absorbance at 246 nm (associated with [CuII(HAcdica)enol]0) at pH 7.0 at various times (Figure S5) suggest that this wavelength can be used to monitor “decarboxylation” in this complex. Not only does this permit access to experimentally determined decarboxylation rate constants in the near future for the metal-enol but would prove “kCuL” estimated through calculation by Larson and Lister. Metal-enolates [CuII(Acdica)enolate]1– and [CuI(Acdica)enolate]1– associated with redox couple II–V had significantly lower potentials than those of the metal-enol species [CuII(H2Acdica)enol]1+ and [CuII(HAcdica)enol]0 associated with III–IV, indicating higher favorability of copper center reduction through metal-enols instead of metal-enolates. This finding differs significantly from previous studies on (oxalacetato)copper metal-enol(ate)s, where authors considered metal-enols to be inactive; could this be related to the six-membered intramolecular hydrogen-bonded structure of [CuII(HAcdica)enol]0 versus a possible five-membered structure in (oxalacetato)copper or some other mechanism? Despite electron transfers (CV) and the coordination geometry of the copper center (EPR) in β-keto carboxylic acid complexes, playing an important role in these reactions, surprisingly few studies have compared/contrasted these properties. Therefore, future metal-enol(ate) studies may choose to include CV and EPR analysis. Follow-up studies on acetonedicarboxylic acid may focus on obtaining enol/enolate pKa values and enolization and ketonization rates, as well as confirmation of pKa’s from this study using 1H NMR and 13C NMR. Having access to other acetonedicarboxylic acid pKa’s would also allow researchers to gauge by just how much copper coordination reduced the original ligand α-carbon pKa values.
Experimental and Analytical Methods
Chemicals
Acetonedicarboxylic acid (purity >95%) was purchased from Tokyo Chemical Industry Co. Ltd. CuCl2·2H2O, glacial acetic acid, sodium acetate, NaOH, HCl, and NaCl were all purchased from Sinopharm Chemical Reagent Co. Ltd., Beijing. All reagents were of analytical grade, and Millipore Milli-Q water was used in all experiments. The pH in all experiments was monitored using an Orion 3-STAR pH meter with Gel pH electrode (Thermo Scientific) and calibrated using NIST pH standards (pHs 4.0, 7.0, and 10.0). To minimize decarboxylation of stock solutions through nonmetal-catalyzed reactions, each set of experiments required freshly prepared stock solutions of acetonedicarboxylic acid; (acetonedicarboxylato)copper refers to a 1:1 molar ratio of [CuII]/[acetonedicarboxylate].
UV–Visible Spectra and Spectral Titrations
The low-concentration spectra (0.1 mM, Figure 2a) and high-concentration spectra (1.4 mM, Figure 1b and 14.0 mM, Figure 1a) were recorded by making separate solutions (pHs 1.5–7.5, at 0.25 increments; pHs 3.0–7.5 for 14 mM) with the same concentration of μ = 0.01 M (NaCl). Milli-Q water was N2-gas-sparged 2 h prior to experiments, which was continued during pH adjustment and dilution to the final volume of 45 mL. pH was adjusted using 0.1 M HCl, 0.1 M NaOH (0.1 and 1.4 mM solutions), and 0.5 M NaOH (14 mM solution). Aliquots were removed from centrifuge tubes and placed into a 1 cm quartz cuvette for analysis using a Hitachi dual-beam U-3010 UV-spectrophotometer (Hitachi High-Technologies Co., Japan). The path length was 10 mm, and slit width was 2 nm at a wavelength scan rate of 600 nm min–1 from 190 to 900 nm. UV–visible batch titration spectral pKa’s were estimated by nonlinear least-squares regression using the Henderson–Hesselbalch equation, eq 15, and fit to experimental data using the reconfigured form shown in eq 16 in the nonlinear fitting module of Origin 8.5.
| 15 |
| 16 |
where Aobs is the curve fit-calculated observed absorbance at wavelength X, Abase is the absorbance at basic pH, Aacid is the absorbance at acidic pH, and A1 is the absorbance of points near the pKa to be determined.58
Stopped-Flow Kinetic Experiments
Briefly, 50 mL centrifuge tubes were filled with solutions of 0.5 copper or 0.5 mM 3-oxopentanedioate followed by addition of acetate buffer (total concentration was [CH3COOH] + [CH3COO–Na+] = 50 mM) with subsequent pH adjustment (pHs 3.50, 4.40, 4.97, and 5.50) and dilution to a final volume of 50 mL. μ = 0.01 M (NaCl) was used as a background ionic strength, and temperature was 25 °C. Copper solution and acetonedicarboxylate solutions were withdrawn using 5 mL syringes and placed at the drive syringe locations of an Applied Photophysics Ltd. SX20 stopped-flow reaction analyzer. Contents were mixed using a 1:1 ratio, and the UV absorbance was measured at either 242 nm (pH 3.50) or 246 nm (pHs 4.40, 4.97, and 5.50) with 15 s monitoring time and collection of 1000 data points per run. Because 246 nm is correlated with [CuII(HAcdica)enol]0, we could assume a first-order reaction in which the change in absorbance as a function of time is proportional to that species. For first-order kinetic fittings, we employed the “ExpDecay1” module in Origin 8.5 to determine enolization rate constants kE3 and kE4.
CV Experiments
Solutions of (acetonedicarboxylato)copper (1.0 mM) were prepared by adding aliquots of copper and acetondicarboxylate to 50 mL polyethylene centrifuge tubes with 0.1 M NaCl as an electrolyte. During dilution to the final volume of 45 mL, we adjusted the pH (3.0, 3.5, 4.0, 4.5, 5.5, 6.0, 6.5, and 7.0) using 0.1 M HCl or NaOH. Milli-Q water for stock solutions and experimental solutions was sparged with N2 gas for 2 h prior to experiments and during pH adjustment to remove dissolved oxygen. The 50 mL glass beaker used in CV experiments was left open to the laboratory atmosphere. Electrochemical measurements were conducted using CHI660E Electrochemical Workstation (CH Instruments, Inc.; Shanghai, China). CV scans employed a three-electrode system of a 3 mm GC working electrode (0.07 cm2), a platinum auxillary electrode, and a (3 mol KCl) Ag/AgCl reference electrode. Using NaCl electrolyte concentration of ≥0.1 M with copper complexes, we compared our CV peaks to the standard potential for CuCl(s) formation, E° = +0.538 V versus normal hydrogen electrode to ensure no interference.30
EPR Experiments
Solutions of (acetonedicarboxylato)copper (1.0 mM) were prepared by adding aliquots of copper and acetonedicarboxylate to 50 mL centrifuge tubes with μ = 0.01 M (NaCl). During dilution to the final volume of 45 mL, we adjusted the pH (4.00, 4.50, 4.75, 5.50, 6.00, and 7.00) using 0.1 M HCl or NaOH and added glycerol (10% v/v) as a glassing agent. Control experiments at 100 K without glycerol and at 298 K are shown in Figures S9 and S10. Samples were withdrawn and placed into standard 3 mm quartz tubes for EPR analysis. For analysis, we employed a Bruker EMXplus-10/12 EPR spectrometer at X-band (9.437 ± 0.008 GHz) and 100 K temperature controlled using a liquid-nitrogen-cooled sample cavity. Instrument settings were as follows: power = 10.02 mW, center field = 3100 G, sweep width = 2600 G, receiver gain = 2.52 × 10⁴, module frequency = 100 kHz, module amplitude = 1.0 G, time constant = 327.68 ms, conversion time = 60 ms, and sweep time = 61.44 s. The g-tensors (g|| and g⊥) were calculated as the average between +1/2 and −1/2 hyperfine splitting peaks of the derivative spectra and the largest peak in the integrated EPR spectra, respectively. The parallel hyperfine splitting constant (A||) was determined by taking the difference between −3/2 and −1/2 peaks, as indicated in the inset of Figure 5.
Acknowledgments
This work was supported by the major program (Grant No. 51290282) granted by the National Natural Science Foundation of China and the Chinese Academy of Sciences President’s International Fellowship Initiative (Grant No. 2017PE0033).
Supporting Information Available
The Supporting Information is available free of charge on the ACS Publications website at DOI: 10.1021/acsomega.7b00321.
Acid–base titrations, first-order derivative acid–base titration curves, photograph of 0.5 mM (acetonedicarboxylato)copper solutions from pH 2.0 to 12.0, UV–visible monitoring of 246 nm absorbance decrease over time, method of continuous variation plot of 246 nm absorbance at pHs 4.8 and 5.5, method of continuous variation plot of 400 and 757 nm absorbance at pHs 4.0, 5.5, and 6.5, values for |Ipax/Ipcy| and ΔEp calculated from CV data, a plot of CV current for Ipax and Ipcy as a function of pH, EPR spectra at 100 K with no glycerol, EPR spectra at 298 K, and EPR parameters for spectra in Table S2 (PDF)
The authors declare no competing financial interest.
Supplementary Material
References
- Zabicky J.The Chemistry of Metal Enolates; Wiley, 2009. [Google Scholar]
- Mao H.-K.; Leussing D. L. An Investigation of an Enzyme Model. The Influence of Solvent on the Metal-Ion-Catalyzed Decarboxylation of Oxalacetate. Inorg. Chem. 1981, 20, 4240–4247. 10.1021/ic50226a042. [DOI] [Google Scholar]
- Birus M.; Leussing D. L. Comparison of an Enzymatic Reaction and Its Model: Metal Ion Promoted Decarboxylation of Oxalacetate. Inorg. Chem. 1982, 21, 374–380. 10.1021/ic00131a067. [DOI] [Google Scholar]
- Tsai S.-J.; Leussing D. L. Reaction Models for Cooperative Catalysis between Metal Ions and Acids or Bases: Hydration and Enolization of Oxalacetate. Inorg. Chem. 1987, 26, 2620–2629. 10.1021/ic00263a015. [DOI] [Google Scholar]
- Hynes M. J.; Blanco C. A.; Mooney M. T. Metal-catalysed Ionization of a Cyclic 1,3-Diketone. The Effects of Nickel(II) and Copper(II) on the Ionization of 2-Acetylcyclohexanone. J. Chem. Soc., Perkin Trans. 2 1991, 2, 2055–2060. 10.1039/p29910002055. [DOI] [Google Scholar]
- Yerhoff F. W.; Larson D. W. 3-Ketoglutarates: Compounds with Mn(II), Co(II), Ni(II), Cu(II), Zn(II), Mg, and Na. Can. J. Chem. 1972, 50, 826–833. 10.1139/v72-129. [DOI] [Google Scholar]
- Kubala G.; Martell A. E. Zn(II)-, Al(III)-, and Cu(II)-Catalyzed Decarboxylation of 2-Oxalopropionic Acid. J. Am. Chem. Soc. 1982, 104, 6602–6609. 10.1021/ja00388a021. [DOI] [Google Scholar]
- Leussing D. L. Successful Application of Marcus Theory to catalysis by labile metal ions. Transition Met. Chem. 1998, 23, 771–781. 10.1023/A:1006967518734. [DOI] [Google Scholar]
- Grissom C. B.; Cleland W. W. Carbon Isotope Effects on the Metal Ion Catalyzed Decarboxylation of Oxalacetate. J. Am. Chem. Soc. 1986, 108, 5582–5583. 10.1021/ja00278a036. [DOI] [Google Scholar]
- Salama A.; Gelles E. 736. The Interaction of Transition-metal Ions with Oxaloacetic Acid. Part I. The Role of Chelate Compounds in the Decarboxylation. J. Chem. Soc. 1958, 3673–3683. 10.1039/JR9580003673. [DOI] [Google Scholar]
- Liu H.; Zhang Y.; Yang W. How Is the Active Site of Enolase Organized To Catalyze Two Different Reaction Steps?. J. Am. Chem. Soc. 2000, 122, 6560–6570. 10.1021/ja9936619. [DOI] [Google Scholar]
- Bastard K.; Smith A. A.; Vergne-Vaxelaire C.; Perret A.; Zaparucha A.; De Melo-Minardi R.; Mariage A.; Boutard M.; Debard A.; Lechaplais C.; Pelle C.; Pellouin V.; Perchat N.; Petit J. L.; Kreimeyer A.; Medigue C.; Weissenbach J.; Artiguenave F.; De Berardinis V.; Vallenet D.; Salanoubat M. Revealing the hidden functional diversity of an enzyme family. Nat. Chem. Biol. 2014, 10, 42–9. 10.1038/nchembio.1387. [DOI] [PubMed] [Google Scholar]
- Park H. I.; Ming L.-J. Mechanistic studies of the astacin-like Serratia metalloendopeptidase serralysin: highly active (>2000%) Co(II) and Cu(II) derivatives for further corroboration of a “metallotriad” mechanism. J. Biol. Inorg. Chem. 2002, 7, 600–610. 10.1007/s00775-002-0338-2. [DOI] [PubMed] [Google Scholar]
- Gopal B.; Madan L. L.; Betz S. F.; Kossiakoff A. A. The Crystal Structure of a Quercetin 2,3-Dioxygenase from Bacillus subtilis Suggests Modulation of Enzyme Activity by a Change in the Metal Ion at the Active Site(s). Biochemistry 2005, 44, 193–201. 10.1021/bi0484421. [DOI] [PubMed] [Google Scholar]
- Grogan G. Emergent mechanistic diversity of enzyme-catalysed β-diketone cleavage. Biochem. J. 2005, 388, 721–730. 10.1042/BJ20042038. [DOI] [PMC free article] [PubMed] [Google Scholar]
- Zhong Z.; Snowden T. S.; Best M. D.; Anslyn E. V. Rate of Enolate Formation Is Not Very Sensitive to the Hydrogen Bonding Ability of Donors to Carboxyl Oxygen Lone Pair Acceptors; A Ramification of the Principle of Non-Perfect Synchronization for General-Base-Catalyzed Enolate Formation. J. Am. Chem. Soc. 2004, 126, 3488–3495. 10.1021/ja0306011. [DOI] [PubMed] [Google Scholar]
- Zhong Z.; Postnikova B. J.; Hanes R. E.; Lynch V. M.; Anslyn E. V. Large pKa shifts of alpha-carbon acids induced by copper(II) complexes. Chem. Eur. J. 2005, 11, 2385–94. 10.1002/chem.200400396. [DOI] [PubMed] [Google Scholar]
- He C.; Zhang G.; Ke J.; Zhang H.; Miller J. T.; Kropf A. J.; Lei A. Labile Cu(I) Catalyst/Spectator Cu(II) Species in Copper-Catalyzed C–C Coupling Reaction: Operando IR, in Situ XANES/EXAFS Evidence and Kinetic Investigations. J. Am. Chem. Soc. 2013, 135, 488–493. 10.1021/ja310111p. [DOI] [PubMed] [Google Scholar]
- Yi H.; Liao Z.; Zhang G.; Zhang G.; Fan C.; Zhang X.; Bunel E. E.; Pao C.-W.; Lee J.-F.; Lei A. Evidence of CuI/CuII Redox Processes by X-Ray Absorption and EPR-Spectroscopy:Direct Synthesis of Dihydrofurans from β-Ketocarbonyl Derivatives and Olefins. Chem. - Eur. J. 2015, 21, 18925–18929. 10.1002/chem.201503822. [DOI] [PubMed] [Google Scholar]
- Saraf S. L.; Miłaczewska A.; Borowski T.; James C. D.; Tierney D. L.; Popova M.; Arif A. M.; Berreau L. M. Anion Effects in Oxidative Aliphatic Carbon-Carbon Bond Cleavage Reactions of Cu(II) Chlorodiketonate Complexes. Inorg. Chem. 2016, 55, 6916–6928. 10.1021/acs.inorgchem.6b00456. [DOI] [PubMed] [Google Scholar]
- Solomon E. I.; Chen P.; Metz M.; Lee S.-K.; Palmer A. E. Oxygen Binding, Activation, and Reduction to Water by Copper Proteins. Angew. Chem., Int. Ed. 2001, 40, 4570–4590. . [DOI] [PubMed] [Google Scholar]
- Cheng B.; Yi H.; He C.; Liu C.; Lei A. Revealing the Ligand Effect on Copper(I) Disproportionation via Operando IR Spectra. Organometallics 2015, 34, 206–211. 10.1021/om501053k. [DOI] [Google Scholar]
- Blatchley E. R. III; Margetas D.; Duggirala R. Copper catalysis in chloroform formation duringwater chlorination. Water Res. 2003, 37, 4385–4394. 10.1016/S0043-1354(03)00404-4. [DOI] [PubMed] [Google Scholar]
- Tian J.; Bryk R.; Itoh M.; Suematsu M.; Nathan C. Variant tricarboxylic acid cycle in Mycobacterium tuberculosis: identification of alpha-ketoglutarate decarboxylase. Proc. Natl. Acad. Sci. U.S.A. 2005, 102, 10670–5. 10.1073/pnas.0501605102. [DOI] [PMC free article] [PubMed] [Google Scholar]
- Datta S. P.; Grzybowski A. K.; Tate S. S. Metal Catalysed Decomposition of alpha-Hydroxypolycarboxylic Acids. Nature 1965, 1047–1049. 10.1038/2071047a0. [DOI] [PubMed] [Google Scholar]
- Hay R. W.; Leong K. N. The Uncatalysed and Metal-ion Catalysed Decarboxylation of 3-oxoglutaric Acid: A Model for an Enzyme System. J. Chem. Soc. A 1971, 0, 3639–3647. 10.1039/j19710003639. [DOI] [Google Scholar]
- Larson D. W.; Lister M. W. Catalytic decomposition of acetonedicarboxylic acid. Can. J. Chem. 1968, 46, 823–832. 10.1139/v68-143. [DOI] [Google Scholar]
- Ferguson J. Spectra of Transition Metal Ions in Crystals. Rev. Pure Appl. Chem. 1964, 14, 1. [Google Scholar]
- Thompson D. W.Structure and Binding in Inorganic Derivatives of beta-diketones. In Structural and Bonding; Thompson D. W., Ed.; Springer: Berlin, 1971; pp 27–47. [Google Scholar]
- Miessler G. L.; Tarr D. A.. Inorganic Chemistry, 3rd ed.; Pearson Education, Inc.: Beijing, China, 2004. [Google Scholar]
- Martell A. E. Catalytic effects of metal chelate compounds. Pure Appl. Chem. 1968, 17, 129–178. 10.1351/pac196817010129. [DOI] [PubMed] [Google Scholar]
- Covey W. D.; Leussing D. L. Zinc(II) Catalysis of Oxalacetate Enolization and Decarboxylation. J. Am. Chem. Soc. 1974, 96, 3860–3866. 10.1021/ja00819a026. [DOI] [Google Scholar]
- Fitzpatrick J. H.; Hopgood D. Metal Ion Catalyzed Decarboxylation. Kinetics and Mechanism of the Oxidative Decarboxylation of Copper(II) Complexes of Aminomalonic Acid in Aqueous Solution. Inorg. Chem. 1974, 13, 568–574. 10.1021/ic50133a014. [DOI] [Google Scholar]
- Raghavan N. V.; Leussing D. L. Kinetic Study of the Copper(II) Catalyzed Enolization and Decarboxylation of Oxaloacetate. Uncovering the Missing Link. J. Am. Chem. Soc. 1974, 96, 7147–7149. 10.1021/ja00829a078. [DOI] [Google Scholar]
- Eguchi L. A.; Saltman P. Kinetics and Mechanisms of Metal Reduction by Hemoglobin. 2. Reduction of Copper (II) Complexes. Inorg. Chem. 1987, 26, 3669–3672. 10.1021/ic00269a011. [DOI] [Google Scholar]
- Anslyn E. V.; Dougherty D. A.. Modern Physical Organic Chemistry; University Science Books: Sausalito, CA, 2006. [Google Scholar]
- Raghavan N. V.; Leussing D. L. Kinetic Study of the Copper(II)-Catalyzed Enolization, Ketonization, and Decarboxylation of Oxaloacetate. J. Am. Chem. Soc. 1976, 98, 723–730. 10.1021/ja00419a014. [DOI] [Google Scholar]
- Chiang Y.; Guo H.-X.; Kresge A. J.; Tee O. S. Flash Photolysis of 2,2,6-Trimethyl-4H-1,3-dioxin-4-one in Aqueous Solution: Hydration of Acetylketene and Ketonization of Acetoacetic Acid Enol. J. Am. Chem. Soc. 1996, 118, 3386–3391. 10.1021/ja9540435. [DOI] [Google Scholar]
- Houghton R. P.Metal Complexes in Organic Chemistry; Cambridge University Press: Great Britain, 1979. [Google Scholar]
- Low C. T. J.; Ponce de Leon C.; Walsh F. C. Copper deposition and dissolution in mixed chloride-sulphate acidic electrolytes: cyclic voltammetry at static disc electrode. Trans. IMF 2015, 93, 74–81. 10.1179/0020296714Z.000000000220. [DOI] [Google Scholar]
- Pearson R. G.; Anderson O. P. Rates and Mechanism of Formation of Mono(acetylacetonato)copper(II) Ion in Water and Methanol. J. Am. Chem. Soc. 1970, 9, 39–46. 10.1021/ic50083a008. [DOI] [Google Scholar]
- Lintvedt R. L.; Russell H. D.; Holtzclaw H. F. J. Polarographic Reduction of Copper Chelates of 1,3-Diketones. IV. Chelate Stability and Electron-Transfer Mechanism. Inorg. Chem. 1966, 5, 1603–1607. 10.1021/ic50043a030. [DOI] [Google Scholar]
- Österberg R. Models for Copper-Protein Interaction Based on Solution and Crystal Structure Studies. Coord. Chem. Rev. 1974, 12, 309–347. 10.1016/S0010-8545(00)82028-7. [DOI] [Google Scholar]
- Moeller T.Inorganic Chemistry; Wiley-Interscience: New York, NY, 1982. [Google Scholar]
- Friis E. P.; Andersen J. E. T.; Madsen L. L.; Bonander N.; Møller P.; Ulstrup J. Dynamics of Pseudomonas aeruginosa azurin and its Cys3Ser mutant at single-crystal gold surfaces investigated by cyclic voltammetry and atomic force microscopy. Electrochim. Acta 1998, 43, 1114–1122. 10.1016/S0013-4686(98)99006-5. [DOI] [Google Scholar]
- Garribba E.; Micera G. The Determination of the Geometry of Cu(II) Complexes An EPR Spectroscopy Experiment. J. Chem. Educ. 2006, 83, 1229–1232. 10.1021/ed083p1229. [DOI] [Google Scholar]
- Malmstrom B. G.; Tore V. Electron Spin Resonance of Copper Proteins and Some Model Complexes. J. Mol. Biol. 1960, 2, 118–124. 10.1016/S0022-2836(60)80034-4. [DOI] [Google Scholar]
- Dunhill R. H.; et al. Electron Spin Resonance of Copper (II) Citrate Chelates. J. Chem. Phys. 1966, 45, 1474. 10.1063/1.1727788. [DOI] [Google Scholar]
- Peisach J.; Blumberg W. E. Structural Implications Derived from the Analysis of Electron Paramagnetic Resonance Spectra of Natural and Artificial Copper Proteins. Arch. Biochem. Biophys. 1974, 165, 691–708. 10.1016/0003-9861(74)90298-7. [DOI] [PubMed] [Google Scholar]
- Lewis W. B.; Alei M. J.; Morgan L. O. Magnetic Resonance Studies on Copper(II) Complex Ions in Solution. I. Temperature Dependences of the 17O NMR and Copper(II) EPR Linewidths of Cu(H2O)62+. J. Chem. Phys. 1966, 44, 2409–2417. 10.1063/1.1727057. [DOI] [Google Scholar]
- Lancaster K. M.; George S. D.; Yokoyama K.; Richards J. H.; Gray H. B. Type-zero copper proteins. Nat. Chem. 2009, 1, 711–715. 10.1038/nchem.412. [DOI] [PMC free article] [PubMed] [Google Scholar]
- Tabbì G.; Giuffrida A.; Bonomo R. P. Determination of formal redox potentials in aqueous solution of copper(II) complexes with ligands having nitrogen and oxygen donor atoms and comparison with their EPR and UV–Vis spectral features. J. Inorg. Biochem. 2013, 128, 137–145. 10.1016/j.jinorgbio.2013.07.035. [DOI] [PubMed] [Google Scholar]
- Sakaguchi U.; Addison A. W. Spectroscopic and Redox Studies of Some Copper(II) Complexes with Bio-mimetic Donor Atoms: Implications for Protein Copper Centres. J. Chem. Soc., Dalton Trans. 1979, 600–608. 10.1039/dt9790000600. [DOI] [Google Scholar]
- Ambundo E. A.; Deydier M.-V.; Grall A. J.; Aguera-Vega N.; Dressel L. T.; Cooper T. H.; Heeg M. J.; Ochrymowycz L. A.; Rorabacher D. B. Influence of Coordination Geometry upon Copper(II/I) Redox Potentials. Physical Parameters for Twelve Copper Tripodal Ligand Complexes. Inorg. Chem. 1999, 38, 4233–4242. 10.1021/ic990334t. [DOI] [Google Scholar]
- Warren L. E.; Horner S. M.; Hatfield W. E. Chemistry of α-Diketone-Bis(thiosemicarbazone)copper(II) Complexes. J. Am. Chem. Soc. 1972, 94, 6392–6396. 10.1021/ja00773a023. [DOI] [Google Scholar]
- Cozar O.; Bratu I.; Szabo L.; Cozar I. B.; Chis V.; David L. IR and ESR study of copper(II) complexes with 15N-labelled lysine and ornithine. J. Mol. Struct. 2011, 993, 397–403. 10.1016/j.molstruc.2011.02.001. [DOI] [Google Scholar]
- Kivelson D.; Neiman R. ESR Studies on the Bonding in Copper Complexes. J. Chem. Phys. 1961, 35, 149–155. 10.1063/1.1731880. [DOI] [Google Scholar]
- Seok Y.-J.; Yang K.-S.; Kang S.-O. A simple spectrophotometric determination of dissociation constants of organic compounds. Anal. Chim. Acta 1995, 306, 351–356. 10.1016/0003-2670(95)00011-N. [DOI] [Google Scholar]
Associated Data
This section collects any data citations, data availability statements, or supplementary materials included in this article.