

Abstract

Perovskites form an interesting class of photocatalytic compounds because of their chemical stability and exotic chemistry. Although barium zirconates have been known for a long time, their photocatalytic study in the literature is very limited. Herein, we have studied the effect of structural disorder, oxygen vacancies and carbon dots (CDs) on photocatalytic activity of BaZrO3−δ (BZO) hollow nanospheres. High alkaline conditions during hydrothermal synthesis lead to the formation of disordered states as well as oxygen vacancies in BZO and create midgap states within the band gap of BZO. The midgap states further shift its absorption onset toward visible light and their presence and effects have been proved by ultraviolet–visible diffuse reflectance spectroscopy, X-ray photoelectron spectroscopy, and electron spin resonance analysis. A composite that consists of CDs shows upconversion photoluminescence and charge-carrier transfer properties to enhance the light absorption of a photocatalyst and its activity. The photocatalytic efficiency of the compounds were examined by H2 evolution and the degradation of methylene blue (MB) dye. In this study, loading of 3 wt% CDs on BZO shows the highest hydrogen evolution efficiency (670 μmol/h/g) with an apparent quantum yield of ∼4% and the highest MB dye degradation efficiency (∼90%) among all synthesized composites. The synergistic effect of increased visible light absorption along with enhanced photogenerated charge-carrier transfer efficiency in the presence of CDs and oxygen vacancies in BZO contributes to the enhanced photocatalytic efficacy of hybrid nanomaterials under visible light irradiation.
Introduction
To alleviate the rising energy demand and threats posed by increasing pollution level, improvement of sunlight-driven photocatalysis is an encouraging and viable alternative to other conventional energy sources such as fossil fuels. In order to convert solar energy into chemical energy, photocatalytic H2 production via water splitting is highly sought after as it is carbon-neutral, and considered as the “holy grail” in chemistry, as only water is formed as the byproduct in its combustion.1,2 Since the seminal work of photoelectrochemical H2 production from water by Honda and Fujishima in 1972, a wide range of scientific investigations have been carried out in the quest for efficient photocatalyst materials.3 Although wide-band-gap metal oxide semiconductors are extensively used for photocatalytic H2 production owing to their low cost, easy synthesis process, and tunable morphologies, they suffer from poor visible light absorption of the solar spectrum. Among the oxide photocatalysts, perovskite oxides are a class of materials with intriguing properties such as high thermal and chemical stability, tunable electronic structure by doping of foreign elements, and so forth. So far, a large number of perovskite oxide materials such as SrTiO3, CaTiO3, KTaO3, and so forth have been reported in photocatalytic H2 production.4 Perovskite oxide materials have general chemical formula ABO3, where A and B represent a lanthanide or alkaline or rare-earth metal ion and a transition-metal ion, respectively. Ideally, perovskite oxides crystallize in the cubic phase with the Pm3̅m space group. In the unit cell of a cubic perovskite oxide, the larger cation A resides on the corner of the unit cell, whereas the smaller cation B forms a BO6 unit by residing at the center of the unit cell.5 A typical wide-band-gap perovskite oxide, barium zirconate, BaZrO3, is a promising material with a wide range of applications owing to its capability to host a wide range of dopants into its lattice and its high conductivity value.6,7 Yuan et al. have shown photocatalytic water splitting using BaZrO3 as a photocatalyst without the assistance of any cocatalyst.8 Without any crystal defects, BaZrO3 can harvest only ultraviolet light, which is only 4–7% in the solar spectrum because of its large band gap. Light absorption ability of such wide-band-gap materials can be tuned to the visible light by modifying their band position, thus introducing oxygen vacancies or by doping different foreign metals or anion dopants into their lattice. Recently, several reports have proved that oxygen vacancies in oxide semiconductors can improve the solar light absorption by narrowing their band gap, thereby reducing the photogenerated charge-carrier recombination probability.9 The probability of electron–hole recombination can be reduced by the presence of surface oxygen vacancies, which act as trap states for photoinduced charge carriers.10 Trap states further induce midgap energy levels in the material and thus allow fine-tuning of the electronic structure. Defect or oxygen vacancy-mediated photocatalytic H2 evolution has been reported for several semiconductors in recent literature.9,11 In the year 2010, Zou et al. have shown enhanced photocatalytic H2 production of BaZrO3 doped with Sn(IV).12 Here, doping of Sn(IV) impurity decreases the band gap of BaZrO3 by forming an additional impurity level near the conduction band, thereby changes its charge-carrier excitation process. Also, Díaz-Torres et al. have shown the shift in absorption onset of BaZrO3 toward the visible light and enhanced photocatalytic activity in Bi-doped BaZrO3.13
Since the report on fluorescent carbon nanoparticles, referred to as carbon dots (CDs) herein, a new class of carbon-based zero-dimensional (<10 nm) material has gained massive attention in numerous research areas such as photocatalysis, photovoltaics, sensing, bioimaging, optoelectronics, and so forth, owing to its ease in synthesis, processing and functionalization, low cost, low toxicity, high water solubility, exceptional photoinduced electron transfer ability, high surface area, and so on.14−20 Because of these properties, CDs have been considered as a suitable replacement for organic dyes and semiconductor quantum dots.21 CDs show tunable absorbance and luminescence properties because of their surface modification. Apart from general downconversion fluorescence properties, where the photoluminescence (PL) emission wavelength is longer than the excitation wavelength, some CDs also exhibit special type of optical properties called upconversion PL or UCPL wherein they emit at a shorter wavelength when excited at a longer wavelength.22 Owing to its UCPL properties, CDs can enhance the light absorption of a semiconductor to a visible or even near-infrared region.23 From preceding works, it has been found that the introduction of CDs onto a photocatalyst can enhance its light absorption as well as photogenerated charge-carrier separation.24 To date, there are several reports of enhanced photocatalytic activity of CD-incorporated photocatalysts, such as enhanced photocatalytic H2 production by carbon quantum dots/TiO2 composites,25 enhanced photocatalytic rhodamine B dye degradation by carbon nanodots/WO3 photocatalysts,26 enhanced overall water splitting and dye degradation by CDs/TiO2 nanotube arrays,27 and enhanced methylene blue (MB) dye degradation by CDs/BiVO4 composites.28
The catalytic efficacy of a photocatalyst can be improved by enhancing its light absorption capability, as the first step in photocatalysis involves a light-assisted excitation process. Hence, by improving the light absorbance in the visible region of the solar spectrum and efficiently separating the photogenerated carriers, the photocatalytic efficiency of wide-band-gap materials such as BZO could be improved. From preceding reports, it is known that semiconductor particles with suitable inner voids can enhance the light absorption by multiple reflections and scattering of incident light.29 For example, a TiO2 hollow sphere shows superior photocatalytic efficiency compared to its dense counterpart.30 Therefore, the creation of hollow nanospheres through morphological modification can enhance incident light absorption. Further, it is known that carbon-based nanomaterials can pave an efficient way to channelize the flow of photogenerated carriers owing to their superior electron-accepting and -transport properties.24 Hence, the photocatalytic efficiency of a semiconductor could be increased through the design of a composite with a carbon-based nanomaterial. Herein, we have synthesized CDs and BaZrO3−δ hollow nanospheres by a facile hydrothermal process and their composites, varying the percentage of CDs by the dispersion method. The best-performing hybrid photocatalyst has been assessed by the photocatalytic H2 generation rate and MB dye degradation efficiency.
Results and Discussion
The powder X-ray diffraction (PXRD) pattern of CDs is shown in Figure 1A and it exhibits one broad peak centered at ∼25° and one less-intense peak at ∼42°, which can be assigned to the (002) and (101) planes of a highly disordered graphitic carbon, respectively.34Figure 1B shows the PXRD patterns of bare BZO and xC_BZO (x = 1–4) hybrid nanomaterials. It is well observed that BZO is free from any impurity peaks and can be indexed to the cubic phase with the Pm3̅m space group (no. 221) [JCPDS file no. 06-0399]. In the hybrid compounds, we could not find any peak of CDs, which may be due to a very low content of CDs in the hybrid compounds and high crystallinity of BZO compared to CDs.28 No PXRD peak shifting has been observed for bare and hybrid compounds, affirming the phase and structural retention of BZO in the hybrid compounds.
Figure 1.

Powder X-ray diffractogram of (A) CDs and (B) xC_BZO (x = 0–4) hybrid nanomaterials.
The presence of different functional groups in the as-synthesized CDs is confirmed by its Fourier transform infrared (FTIR) analysis as shown in Figure S1 (Supporting Information). A broad peak at ∼3150–3750 cm–1 is attributed to the stretching frequency of −O–H and −N–H, the peak at ∼2940 cm–1 corresponds to the sp2–C–H stretching frequency, and the two strong peaks at 1650 and 1558 cm–1 could be because of =C–O stretching and −N–H bending frequencies of secondary amines, respectively. The different weak peaks at 1441, 1375, 1291, and 1048 cm–1 could be attributed to different functional groups such as sp2 carbon, −C–N, and −O–H. The presence of hydroxyl, amines, and carbonyl groups ensures high solubility of CDs in water.35 The presence of different groups such as sp2 carbon, secondary amines, and carbonyl groups proves the formation of polyaromatic structures during the synthesis of CDs.36
From the Raman spectra in Figure S2 (Supporting Information), we notice two different peaks at 1325 and 1548 cm–1, corresponding to the D band and G band, respectively. The D band appears because of out-of-plane stretching vibration of sp3 carbon atoms of the disordered states, whereas the G band arises from in-plane stretching vibration of sp2 carbon atoms inside the ordered aromatic region.37 Hence, as the D band corresponds to the number of disordered states or defect sites and the G band corresponds to the number of ordered states inside the CDs, the ratio of peak intensities between these two bands, that is ID/IG, can give an idea to evaluate the extent of defects in it.38 Hereafter, fitting these two peaks by Gaussian distribution, we have found the ratio of ID/IG is 1.17, revealing a considerable number of defect sites in the as-synthesized CDs.
To investigate the optical absorption profile of CDs, we have analyzed the UV–visible spectrum of the as-synthesized CDs in aqueous solution. From Figure 2, it can be seen that the absorption spectrum of CDs consists of three distinct regions—a strong absorption peak at ∼240 nm, another intense strong peak at ∼340 nm, and a weak and broad band at around 445 nm extended up to 600 nm. The high-energy UV absorption at ∼240 nm, less-intense peak at 340 nm, and the broad band peak extended in the visible region are attributed to the π–π* transition of sp2-hybridized carbons, n−π* transition of the carbon lattice, and different surface states of the surface functional groups in the n−π* band gap, respectively.39,40 Upon excitation at 340 nm, the aqueous solution shows a strong PL emission peak centered at 460 nm, which indicates that the CDs are fluorescent in nature.
Figure 2.

Absorbance spectrum and emission spectrum excited at a 340 nm wavelength of as-synthesized CDs in aqueous solution.
To further investigate the detailed optical properties of the as-synthesized CDs, PL studies were performed with variable wavelengths. Figure 3A shows the excitation-dependent PL spectra of as-synthesized CDs recorded at different excitation wavelengths (λex) with 40 nm increments from 320 to 480 nm in water. With the increase in excitation wavelength, the emission maxima progressively shift toward the longer wavelength and after the excitation wavelength exceeds 360 nm, the emission intensity decreases. The reason behind the PL of CDs is not fully understood yet. The excitation wavelength-dependent PL of CDs could be due to several reasons, such as different size distributions, exciton of carbons, emissive traps, free zig-zag sites, presence of heteroatoms, surface defects, and so forth.41,42
Figure 3.
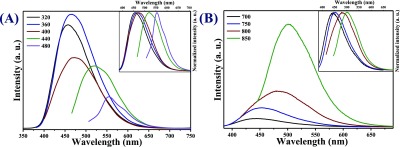
(A) Downconversion PL spectra of CDs with 40 nm increment. Inset to (A) is normalized spectra of (A) and (B) upconversion PL spectra of CDs with 50 nm increments. Inset to (B) is normalized spectra of (B).
Significantly, apart from strong PL properties, these as-synthesized CDs show remarkable upconversion PL properties. Figure 3B shows the PL spectra of CDs when excited by low-energy light (700–850 nm). It is found that the upconverted emission is located at 445–500 nm. Here, this upconversion PL property of CDs could be due to the multiphoton process.19 Hence, the upconversion PL property of as-synthesized CDs could be useful in designing an efficient photocatalyst with a wide-band-gap material as a coupling of these CDs onto the photocatalyst can utilize a wide spectral range.23
Figure 4A shows the field-emission transmission electron microscopy (FETEM) image of a BZO hollow nanosphere. The contrast difference between the dark edge and the light core of the BZO sphere proves the hollow nature of the spherical nanoparticles. In hydrothermal synthesis, under the influence of a high alkaline environment, the Ostwald ripening process drives the formation of hollow spheres.30,43 The formation of hollow structures can be discussed in several different stages, such as hydrolysis, nucleation, and growth process, as reported previously.44 In the initial stage of the reaction, precursors undergo hydrolysis to form corresponding metal hydroxides in aqueous alkaline condition. With time, the concentration of the metal salts increases owing to more hydrolysis of metal salts, and at a particular time and temperature, the solution becomes supersaturated. The reaction between the metal hydroxides in this supersaturated and hot solution favors nucleation and forms tiny particulates by suppressing the grain-growth process. Because of very small size, the particulates have a high surface energy and agglomerate under the influence of van der Waals forces to form larger particles with lesser surface energy. This process of agglomeration continues until an electrostatic barrier layer is established.45 Hence, BZO forms by hydrolysis or decomposition of metal hydroxide monomers in the reaction medium. During the course of the reaction, the dense spheres undergo recrystallization to form crystalline hollow spheres by the Ostwald ripening process. In this process, smaller crystallites from the core of the sphere tend to dissolute more with time and relocate over the larger particles on the surface of the spherical particles. Outward diffusion of the smaller particles from the core of a sphere contributes to the edge thickness, leading to a partial or complete void formation in the core of the sphere.43 The products are formed in the spherical shape to minimize the surface energy and owing to the high concentration of OH– ions in the reaction medium.46 The formation of the BZO products can be explained by the following dehydration pathway
Figure 4.

Field-emission transmission electron microscopic image of (A) BZO hollow nanospheres and (B) high-resolution transmission electron microscopic image of BZO hollow spheres. The inset to (C) is the fast Fourier transformed image of the highlighted portion in image (B), (C) shows the inverse fast Fourier transformed image of the masked fast Fourier transformed image shown in the inset to (C), (D) shows the selected area electron dispersion patterns of BZO, (E) shows the field-emission transmission electron microscopic image of CDs, and (F) shows the high-resolution transmission electron microscopic image of CDs. The inset to (G) is the fast Fourier transformed image of the highlighted portion in image (F), (G) shows the inverse fast Fourier transformed image of the masked fast Fourier transformed image shown in the inset to (G) of CDs, and (H) shows the selected area electron diffraction patterns of as-synthesized CDs.
The dehydration of the supersaturated solution under high temperature may retain a fraction of OH– ions and H2O molecules in the structure and thereby form defective crystals, and the dehydration of the fraction of these retained OH– ions favors the formation of oxygen vacancies in the lattice of BZO. Figure 4B shows the high-resolution transmission electron microscopy (HRTEM) image of a selected area of BZO, and Figure 4C shows the inverse fast Fourier transformed (IFFT) image of the masked FFT shown in the inset to (C) of BZO. From the IFFT image, the interplanar spacing is found to be 0.29 nm, corresponding to the (110) lattice plane of BZO. The selected area electron dispersion (SAED) pattern of BZO shown in Figure 4D proves the crystalline nature.
Figure 4E shows the FETEM images of as-synthesized CDs. CDs are found to be spherical in shape and of ∼2–7 nm in size and dispersed evenly without much significant agglomeration. Figure 4F shows the HRTEM image of a single CD, and Figure 4G shows the IFFT image of the masked FFT shown in the inset to (G). From the IFFT image, the interplanar spacing is found to be 0.32 nm, corresponding to the (002) lattice plane of CDs. The SAED pattern of BZO shown in Figure 4H indicates low crystallinity of as-synthesized CDs.
To further confirm the homogeneous elemental distribution of CDs in xC_BZO (x = 1–4) hybrid nanomaterials, elemental mapping of 3C_BZO was carried out. From Figure S3A (Supporting Information), it is clear that all the constituent elements of 3C_BZO are homogeneously distributed. Figure S3B–F (Supporting Information) proves the presence of elements Ba, Zr, O, C, and N in this hybrid nanomaterial. Although in TEM analysis, the used Cu grid has a thin carbon coating, we have found that element carbon is also present over the BZO nanospheres, which proves the presence of carbon in 3C_BZO.
Among many factors, the efficiency of a photocatalyst is highly
dependent upon its ability to absorb light, as the first step is to
generate photogenerated charge carriers in a photocatalyst. As shown
in Figure 5, the main
absorption peak of BZO is at 230 nm, which can be assigned to band-to-band
transition. A band tail with an absorption extended beyond 400 nm
is observed because of the presence of disordered states or defect
states or oxygen vacancies in the compound, as it is known that the
impurities or defect-state transitions give the band tail in absorption
spectra in semiconductors.47 In the Kröger–Vink
notation, different kinds of structural and electronic order–disorder
states in BZO are represented as [ZrO6]×,  ,
,  ,
,  , where [ZrO6]× denotes the normal six-coordinate
Zr octahedron,
, where [ZrO6]× denotes the normal six-coordinate
Zr octahedron,  signifies
penta-coordinate Zr with two
electrons,
signifies
penta-coordinate Zr with two
electrons,  denotes penta-coordinate
Zr with one unpaired
electron, and
denotes penta-coordinate
Zr with one unpaired
electron, and  denotes penta-coordinate Zr with no trapped
electrons.48,49 Here, [ZrO6]× denotes normal octahedra and [ZrO6]′ acts as a donor.48,49 In the xC_BZO
(x = 1–4) hybrid nanomaterials, the absorption
onset of the compounds is red-shifted and the band tail absorption
intensity increases in the wavelength range of 350–800 nm with
progressive increase in CD amount. Increased light absorption by a
catalyst can increase the population of photogenerated charge carriers,
which can, in turn, increase their photocatalytic efficiency. Diffuse
reflectance spectra of synthesized CDs cover the whole spectral region,
indicating a small band gap, shown in Figure S4 (Supporting Information).
denotes penta-coordinate Zr with no trapped
electrons.48,49 Here, [ZrO6]× denotes normal octahedra and [ZrO6]′ acts as a donor.48,49 In the xC_BZO
(x = 1–4) hybrid nanomaterials, the absorption
onset of the compounds is red-shifted and the band tail absorption
intensity increases in the wavelength range of 350–800 nm with
progressive increase in CD amount. Increased light absorption by a
catalyst can increase the population of photogenerated charge carriers,
which can, in turn, increase their photocatalytic efficiency. Diffuse
reflectance spectra of synthesized CDs cover the whole spectral region,
indicating a small band gap, shown in Figure S4 (Supporting Information).
Figure 5.

Diffuse reflectance spectra of as-synthesized BZO and xC_BZO (x = 0–4) hybrid nanomaterials.
Surface properties and the core-level electronic structure of the constituent elements for CDs, BZO, and 3C_BZO were analyzed using X-ray photoelectron spectroscopy (XPS) data. Figure 6A depicts the XPS survey spectrum of as-synthesized CDs with three intense peaks at binding energies (BE) of 285.6, 400, and 531.2 eV corresponding to C 1s, O 1s, and N 1s, respectively, indicating that the synthesized products are N-doped CDs. Upon deconvolution of C 1s core-level spectrum of CDs, it could be fitted into three different peaks at BE of 284.77, 286.16, and 287.83 eV, which are attributed to aliphatic or graphitic (C–C/C=C), oxygenated (C–O/C=O), and nitrous (C–N) carbon atoms, shown in Figure 6B.50 The N 1s core-level spectrum shown in Figure 6C upon deconvolution shows three peaks at BE of 399.1, 400, and 401 eV, which are attributed to pyridinic, pyrrolic, and graphitic nitrogen groups, respectively.37,38
Figure 6.

(A) X-ray photoelectron spectroscopic survey spectrum, (B) C 1s core-level, and (C) N 1s core-level X-ray photoelectron spectroscopic spectrum of as-synthesized CDs.
Figure 7 represents the O 1s core-level XPS spectra of BZO and 3C_BZO samples. Asymmetric peaks of the O 1s spectrum of BZO and 3C_BZO upon deconvolution can be fitted into two different peaks at BE of 529.3 and 531.5 eV for BZO and at BE of 529 and 531.2 eV for 3C_BZO. These two O 1s peaks indicate the presence of two surface oxygen species in the compounds. The peak at a lower binding energy corresponds to the lattice oxygen (Olatt.), whereas the peak at a higher binding energy is due to surface hydroxyl or oxygen adsorbed on the material surface or organic oxygen moieties (Oads.). This (Oads.) region is also known to be the signature of oxygen vacancies in a sample.51 The number of oxygen vacancies in a compound can be evaluated by calculating the relative peak area ratio of Oads./Olatt..51 The value of peak area, relative peak area ratio, and peak position of Olatt. and Oads. are tabulated in Table 1. From Table 1, we can see that the value of the relative peak area ratio of Oads./Olatt. for 3C_BZO is much higher (1.69) than that for BZO (0.92), indicative of increased oxygen vacancies with the incorporation of CDs onto BZO. To get a clear insight into how CDs increase the number of oxygen vacancies in the hybrid material, we have also analyzed the O 1s core-level XPS spectrum of CDs. Figure S5 (Supporting Information) shows the O 1s spectrum of CDs, deconvoluted into two asymmetric peaks with a calculated Oads./Olatt. value of 0.58. Hence, it is clear that some surface organic groups attached to CDs may also suffer from oxygen vacancies. Incorporation of CDs onto BZO nanospheres thus increases the amount of oxygen vacancies in the hybrid nanomaterials. This phenomenon explains the reason behind an increase in the intensity of the band tail absorption peak of hybrid compounds, as seen in Figure 5.
Figure 7.

O 1s core-level X-ray photoelectron spectroscopic spectra of BZO and 3C_BZO.
Table 1. Peak Position, Peak Area, and Relative Peak Area Ratio (Oads./Olatt.) of XPS O 1s Core-Level Spectra for BZO and 3C_BZO Hybrid Nanomaterials.
| compound | peaks | peak position (eV) | peak area | Oads./Olatt. |
|---|---|---|---|---|
| BZO | Olatt. | 529.33 | 3089 | 0.92 |
| Oads. | 531.5 | 2826 | ||
| 3C_BZO | Ollatt. | 529 | 2352 | 1.69 |
| Oads. | 531.22 | 3966 |
The oxidation states of Ba and Zr have been assessed from Ba 3d and Zr 3d core-level spectra of BZO and 3C_BZO. In Figure 8A, Ba 3d core-level XPS spectra of BZO appear at BE of 779.5 and 794.8 eV, corresponding to Ba 3d5/2 and Ba 3d3/2, respectively. In case of 3C_BZO, Ba 3d core-level XPS spectra for Ba 3d5/2 and Ba 3d3/2 appear at BE of 779.4 and 794.7 eV, respectively. The difference in binding energy between the two peaks (ΔBE) of Ba 3d core-level XPS spectra for both the compounds is found to be ∼15.3 eV, indicating that Ba is present in (+2) oxidation state in both the compounds .52 The asymmetric Zr 3d core-level XPS spectra of BZO and 3C_BZO are depicted in Figure 8B. Upon deconvolution, we observe three different peaks at BE of 177.57, 181.56, and 183.93 eV for BZO and at BE of 177.21, 181.09, and 183.46 eV for 3C_BZO corresponding to Ba 4p3/2, Zr 3d5/2, and Zr 3d3/2, respectively.52,53 The binding energy difference (ΔBE) between the two peaks of Zr 3d core-level XPS spectra for both the compounds is found to be ∼2.37 eV, which proves the (+4) oxidation state of Zr in both the samples. An energy shift in the XPS binding energy in CD-modified BZO hybrid nanoparticles is observed, indicative of a strong electronic interaction between CDs and BZO.
Figure 8.

(A) Ba 3d core-level X-ray photoelectron spectroscopic spectra and (B) Zr 3d core-level XPS spectra of BZO and 3C_BZO hybrid nanomaterials.
XPS valence band spectra of BZO and 3C_BZO hybrid nanomaterials are shown in Figure S6 (Supporting Information). From Figure S6 (Supporting Information), it is clear that both the spectra have an identical valence band edge with a clear band tail. From preceding reports, we know that in any compound, this band tail in valence band spectra signifies the presence of a lattice disorder.54 With the incorporation of CDs onto BZO, we could not notice any shift in the valence band position of 3C_BZO. Therefore, the enhancement in light absorption in xC_BZO hybrid nanomaterials could be explained by the effective electronic transition because of the presence of midgap states or disordered states and upconversion PL of CDs.
In our studied systems, the oxygen vacancy is an important
parameter
proposed for controlling photocatalytic activity; hence, it is important
to understand the nature of oxygen vacancies present in BZO and CD-incorporated
hybrid nanomaterials. From literature, it is known that three different
types of oxygen vacancies such as neutral, singly ionized, and doubly
ionized can be present in a compound. Among these vacancies, the number
of trapped electrons present are two, one, and zero in neutral, singly
ionized, and doubly ionized oxygen vacancies, respectively.55 Owing to their different spin states, electron
spin resonance (ESR) technique could be employed to determine the
nature of the oxygen species in these compounds. Among these three
different types of oxygen vacancies, singly ionized oxygen vacancy
gives a strong ESR signal as it has only one unpaired electron, and
neutral oxygen vacancy with two unpaired electrons gives a triplet
in ESR analysis. If the neutral oxygen vacancy has paired electrons,
then it cannot give any ESR signal.55 From Figure 9, we observe that
the BZO and 3C_BZO show a broad peak at around g—tensor
value of 2.005, which is due to singly ionized paramagnetic oxygen
vacancies ( ).56 Figure S7
(Supporting Information) shows the ESR
spectra of as-synthesized CDs in room temperature, and it shows an
intense ESR signal at g—tensor value of 2.005.
As seen from FTIR and Raman analysis, CDs have nitrous groups, carbonyl
groups, and surface defects on them. Hence, the origin of their ESR
spectra may be due to the presence of unpaired electrons in surface
defects and nitrous or carbonyl groups. Hence, from the UV–vis
diffuse reflectance spectroscopy study, XPS analysis, and ESR study,
we can say that all the studied compounds have a certain amount of
oxygen vacancies and structural ordered–disordered states in
their structures, which could be beneficial for their photocatalytic
activities.
).56 Figure S7
(Supporting Information) shows the ESR
spectra of as-synthesized CDs in room temperature, and it shows an
intense ESR signal at g—tensor value of 2.005.
As seen from FTIR and Raman analysis, CDs have nitrous groups, carbonyl
groups, and surface defects on them. Hence, the origin of their ESR
spectra may be due to the presence of unpaired electrons in surface
defects and nitrous or carbonyl groups. Hence, from the UV–vis
diffuse reflectance spectroscopy study, XPS analysis, and ESR study,
we can say that all the studied compounds have a certain amount of
oxygen vacancies and structural ordered–disordered states in
their structures, which could be beneficial for their photocatalytic
activities.
Figure 9.

Electron spin resonance spectra of BZO hollow spheres and 3C_BZO hybrid nanomaterials at room temperature.
To observe the charge-transfer and charge-recombination processes in a photocatalyst, PL spectra have been widely used. It is notable from the PL spectra shown in Figure 10A that upon photo excitation at 256 nm, both BZO and 3C_BZO hybrid nanomaterials emit at 396 nm. Bare BZO has high PL intensity, which is attributed to the lattice disorder and trap states in BZO.57 In 3C_BZO, the PL intensity at 396 nm drops significantly. This phenomenon could be owing to the reduction in photogenerated electron–hole recombination. On introduction of CDs onto BZO, the photogenerated electrons in the conduction band of BZO move efficiently to the CD particles as CDs are excellent charge carriers, thereby preventing their recombination with the photogenerated holes present in the valence band of BZO.17 Hence, owing to efficient charge transfer, in the hybrid nanomaterials, a sharp drop in PL indicates decreased recombination, which can in turn enhance its photocatalytic activity.
Figure 10.
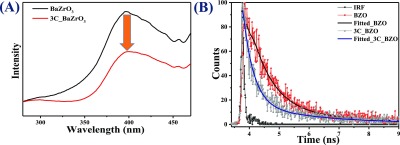
(A) Steady-state PL at an excitation of 256 nm and (B) time-resolved PL spectra of BZO and 3C_BZO hybrid nanomaterials at an excitation of 375 nm and emission observed at 450 nm.
Time-resolved PL (TRPL) spectroscopic analysis was performed to further get an insight into the charge-transfer process between BZO and CDs in the best-performing 3C_BZO catalyst. For comparison, TRPL was also performed for BZO. The samples were excited at a wavelength of 375 nm and the emission observed at 450 nm is shown in Figure 10B. PL decay profiles are fitted with a biexponential function to calculate the exciton lifetime, ⟨τ⟩. The decay profile exhibits biexponential decay patterns, which infer multiple processes involved during the decay of emissive excitons or the radiative transitions. The fitting parameters (χ2) and detailed spectroscopic results, exciton lifetimes (τ1, τ2), pre-exponential factors (α1, α2), and average exciton lifetimes (⟨τ⟩) are summarized in Table 2.
Table 2. Fitting Parameter (χ2), Initial Intensity (α1, α2), Excited-State Lifetime (τ1, τ2), and Average Exciton Lifetime (⟨τ⟩ ns) for CDs, BZO, and 3C_BZO Hybrid Nanomaterials.
| compound | α1 | α2 | τ1 | τ2 | ⟨τ⟩ | χ2 |
|---|---|---|---|---|---|---|
| CDs | 0.1082 | 0.0051 | 0.752 | 4.831 | 1.7001 | 0.921 |
| BZO | 0.1038 | 0.0126 | 0.732 | 3.445 | 1.7183 | 0.951 |
| 3C_BZO | 79.2237 | 16.5278 | 0.355 | 2.323 | 1.4909 | 0.908 |
The average lifetime of the compounds were calculated by using the following equation58
From the average lifetime values, a decrease in average exciton lifetimes for 3C_BZO is observed compared to BZO. The exciton lifetime for 3C_BZO (1.49 ns) is found to be lower than that of bare BZO (1.72 ns), indicating the photogenerated electronic interaction and facile charge transport from BZO to CDs in the hybrid nanomaterials.59
Photocatalytic Hydrogen Production
Photocatalytic H2 evolution from water by xC_BZO (x = 0–4) hybrid nanomaterials under UV–visible light and visible light was analyzed in the presence of a 0.25 M Na2SO3/0.35 M Na2S mixture as sacrificial hole scavenger and is shown in Figure 11. In bare BZO, the valence band maxima and the conduction band minima are more positive than the H2O/O2 redox potential and more negative than the H2/H+ redox potential, respectively.8 In photocatalytic H2 evolution reaction, a sacrificial reagent can enhance the catalytic efficiency of a photocatalyst as the sacrificial reagent (Na2SO3) can trap the photogenerated holes of the semiconductor and leave the photogenerated electrons in the conduction band, which in turn decreases the charge-carrier recombination and thus boosts the charge separation.60,61 The role of the sacrificial reagent (0.25 M Na2SO3/0.35 M Na2S) in the photocatalytic H2 production can be explained by the following equations61
| 1 |
| 2 |
| 3 |
| 4 |
| 5 |
| 6 |
Figure 11.

Rate of photocatalytic H2 production from xC_BZO (x = 0–4) hybrid nanomaterials under (A) UV–visible light irradiation and (B) visible light irradiation with a 0.25 M Na2SO3/0.35 M Na2S mixture as sacrificial reagent.
When the semiconductor is photoexcited by a light with energy more than or equal to its band gap energy, electrons are excited to the conduction band, leaving an equivalent number of holes in the valence band as shown in eq 1. With a high lifetime and charge mobility, these photogenerated charge carriers may reach the surface of the semiconductor where they can undergo redox reactions with the reactants adsorbed onto the semiconductor surface. As shown in eq 2, electrons can produce H2 by reducing water. The holes can produce S22– and SO42– ions by oxidizing the sacrificial ions, S2– and SO32–, respectively (eqs 3 & 4). As described in eq 5, S2– ions form optically transparent S2O32– ions by reacting with SO32– ions in solution. In this process, colorless S2O32– ions are formed by the reaction of S2– and SO32– ions with photogenerated holes, as described in eq 6.
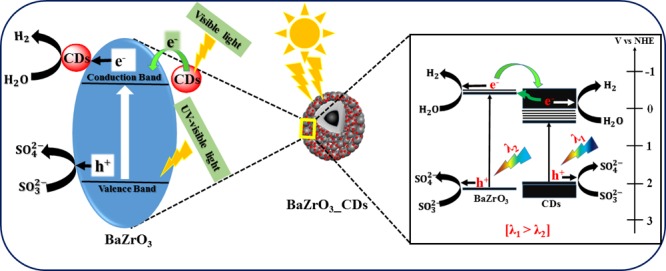
In the present work, the amount of H2 gas produced by as-synthesized BZO under UV–visible light irradiation is 290 μmol per hour per gram. Compared to bare BZO, the CD-modified photocatalysts exhibit superior catalytic activity, inferring the vital role of CDs in BZO. The improved H2 production efficacy can be attributed to the enhanced light absorption of the catalysts in the visible light regime after CD loading and faster charge transfer to CDs. From Figure 11A, we note that 3 wt % is the optimal CD loading concentration for the highest amount of H2 gas evolution (670 μmol/h/g), whereas 1C_BZO, 2C_BZO, and 4C_BZO produce 385, 480, and 405 μmol/h/g of H2 gas, respectively. The calculated apparent quantum yield (AQY) of BZO and 3C_BZO is ∼2 and ∼4%, respectively. It is observed that beyond 3 wt% CDs loading, the H2 gas production efficacy decreases. This could be due to the presence of surplus CDs on the surface of BZO, which can effectively block the active sites for photogenerated charge carriers to react with surface-adsorbed species.62 These excess CDs then act as charge-carrier recombination centers, which reduce the photocatalytic efficiency of BZO. Thus, 3 wt % of CDs loading on BZO is optimal for efficient photocatalytic activity. A similar trend in photocatalytic H2 evolution is also found under visible light irradiation when we use borosilicate glass reactor for photocatalytic experiments, which is shown in Figure 11B. Under this condition, also 3C_BZO produces the highest amount of H2 (250 μmol/h/g) from water, whereas BZO, 1C_BZO, 2C_BZO, and 4C_BZO give 87, 139, 222, and 186 μmol/h/g, respectively. The photocatalytic H2 production efficacy of these materials under visible light decreases as result of cutting ultraviolet light by a glass reactor. The role of CDs in photocatalytic H2 evolution from water by BZO is graphically illustrated in Scheme 1.
Scheme 1. Graphical Representation of Photocatalytic H2 Evolution from Water by xC_BZO (x = 0–4) Hybrid Nanomaterials with a 0.25 M Na2SO3/0.35 M Na2S Mixture as Sacrificial Reagent.
Photocatalytic Dye Degradation
Besides hydrogen production, as-synthesized xC_BZO (x = 0–4) hybrid nanomaterials also show effectiveness in degrading organic dyes commonly found in industrial wastewater. Here, to examine the degradation efficiency, we have chosen MB as the model system. Figure 12A shows MB dye degradation of best performing hybrid catalyst 3C_BZO at pH 13. Monitoring the peak at 664 nm of MB, the intensity of the peak was suppressed with time, and within 1 h the intensity reduced to more than 90%. Degradation efficiency of the catalysts was evaluated by comparing the initial concentration of the dye (C0) with the final concentration (C) of the dye. Figure 12B shows the degradation efficiency of xC_BZO (x = 0–4) hybrid nanomaterials. It has been found that 3C_BZO has the highest degradation efficiency of ∼90%, whereas degradation efficiency of BZO, 1C_BZO, 2C_BZO, and 4C_BZO are ∼78, ∼85, ∼89, and ∼80%, respectively. The enhancement in dye degradation efficiency of xC_BZO hybrids compared to bare BZO could be owing to the enhanced light absorptivity and superior charge-transfer capability of the CDs. The photocatalytic dye degradation process in BZO_CDs hybrid materials happens via several steps and in the first step BZO and CDs absorb suitable energy light, which promotes electrons to their respective conduction bands, leaving holes in the valence bands. Owing to the superior charge-transfer ability of CDs, photogenerated electrons from the conduction band of BZO tend to transfer to the conduction band of CDs and reduce the probability of carrier recombination between electrons and holes in BZO. Additionally, because of the upconversion PL nature of the CDs, the emitted shorter wavelength light can also photoexcite BZO and increase the carrier density in it. In the next step, these electrons in the conduction bands of BZO and CDs can react with O2 and form superoxide radical anions in the solution. Similarly, photogenerated holes can react with water and produce hydroxyl radicals. These hydroxyl radicals later combine and form hydrogen peroxide. Finally, these hydroxyl radicals oxidize the dye molecules and hydrogen peroxide regenerates hydroxyl radicals in the solution by reacting with superoxide radical anions (Scheme 2).
Figure 12.

(A) Chronological absorption spectral patterns of MB dye over 1 h during the photodegradation process in the presence of 3C_BZO under UV–visible light and (B) plot of (C/C0) with respect to time (minute) for BZO and xC_BZO (x = 1–4) hybrid nanomaterials.
Scheme 2. Graphical Representation of Photocatalytic Dye Degradation from Water by xC_BZO (x = 0–4) Hybrid Nanomaterials.

Conclusions
In summary, we have synthesized BZO and CDs by facile hydrothermal synthesis. 1–4 wt % of C_BZO hybrid catalysts are synthesized by dispersing CDs and BZO together. The synthesized products are found to be an efficient catalyst for photocatalytic H2 production and MB dye degradation. Synthesized samples were analyzed with the help of several analytical techniques and it was found that the presence of defect states, oxygen vacancies, and the addition of CDs onto BZO lead to an increment of visible light absorption by the photocatalysts and owing to the high charge-transfer rate of CDs, the photogenerated charge-carrier recombination is reduced. We have observed that 3 wt % CDs loaded onto BZO shows the highest efficiency in both photocatalytic H2 production and MB dye degradation. The AQY of 3C_BZO (∼4%) is doubled than that of the BZO (∼2%) under UV–visible light irradiation. In brief, this work proves that CDs can considerably enhance the photocatalytic activity of a wide-band-gap material such as BZO, which provides a facile scheme to develop hybrid materials that could be utilized in energy harvesting and environmental renovation.
Experimental Section
Materials
All the chemicals used in the experiments were of analytical grade and used without further purification. Citric acid (Merck), ethylenediamine (Merck), zirconium oxychloride octahydrate (Sigma-Aldrich), barium chloride dihydrate (Merck), potassium hydroxide pellets (Merck), sodium sulfide (Sigma-Aldrich), sodium sulfite (Sigma-Aldrich), glacial acetic acid (Merck), and MB (Merck) were used as received. Milli-Q water (18.2 MΩ cm) was used in all the experiments.
Synthetic Procedures
Preparation of CDs
Water-soluble CDs were prepared by following a facile carbonation process via the hydrothermal route.31 Citric acid (2.1 g) was dissolved in 20 mL of water in a Teflon-made reactor by continuous stirring. After complete dissolution of citric acid in water, 670 μL of ethylenediamine was added dropwise under vigorous stirring. This solution was then placed inside a stainless-steel jacket and kept inside a preheated electric oven at 200 °C for 5 h. After cooling down to room temperature, a brownish red solution was filtered through a 0.4 μm syringe filter to separate larger particles. This filtrate was then dialyzed using a dialysis bag (Da = 1000) and Milli-Q water for 1 day to remove unreacted reagents. The water was changed every 4 h. As-synthesized CDs were collected by drying the dialyzed solution at 80 °C overnight.
Preparation of BZO
Barium zirconate hollow spheres were prepared by following a modified hydrothermal method.32 The reactions were carried out in a stainless-steel autoclave with a Teflon liner at 200 °C and autogenous pressure. Initially, a 20 M KOH aqueous solution was prepared in a round-bottomed flask. This aqueous solution was kept under constant stirring until it attained room temperature. Then, a stoichiometric amount of BaCl2·2H2O and ZrOCl2·8H2O were mixed with the as-prepared KOH aqueous solution in a 100 mL Teflon-made reactor. The solution was vigorously stirred for 1 h and then sealed inside a stainless-steel autoclave and heated inside an electric oven at 200 °C for 24 h. The autoclave was allowed to cool down to room temperature naturally after the reaction. To remove the impurities, the obtained white precipitate of BZO was centrifuged and washed several times by water, dilute acetic acid, and ethanol. Finally, the washed BZO was dried at 100 °C inside an electric oven overnight.
Preparation of CDs_BZO Hybrid Nanomaterials
To prepare x wt % CDs_BZO (x = 0–4) (hereinafter referred to as “xC_BZO”) hybrid nanomaterials with the different weight percentage of CDs, we have taken a certain amount of BZO in a round-bottomed flask and to it added the calculated amount of CDs. These compounds were then dispersed in ethanol at 45 °C for 2 h by sonication. By removing ethanol by a rotary evaporator, we collected the different hybrid compounds.
Photocatalytic Hydrogen Production Experiment
All photocatalytic H2 production reactions for water reduction were performed in a two-neck double-walled quartz round-bottomed flask and in a two-neck double-walled round-bottomed flask made of borosilicate glass. Water was constantly circulated through the outer jacket of the reactor to maintain a constant temperature within the reactor. To prevent gas leakage during photocatalysis experiments, open ports of the reactor were sealed with a rubber septum. A 300 W tungsten-halogen lamp (OSRAM, USA) having emission within 195–1100 nm kept 15 cm apart from the reactor was used as the light source for photocatalytic experiments. The catalyst (25 mg) was dispersed in 50 mL aqueous solution of sacrificial hole scavenging reagents (0.25 M Na2SO3/0.35 M Na2S) followed by purging with pure N2 gas for 15 min at a flow rate of 0.2 L/min to ensure anaerobic condition within the reactor. After N2 purging, the reactor was degassed by a vacuum pump to eliminate air and other gases from it. This process of purging and degassing was repeated twice. During the light irradiation, the photocatalyst-suspended solution was constantly stirred to ensure a uniform light exposure of the photocatalyst particles and prevent sedimentation of the catalyst. At a fixed time interval, 1 mL gas from the headspace of the reactor was collected by a gas-tight syringe and analyzed by gas chromatography (Agilent 7890A gas chromatograph with a Molesieve column, thermal conductivity detector, and nitrogen as the carrier gas). No considerable gas evolution was observed in the absence of either photocatalyst or light irradiation, which confirms the role of the photocatalyst in photocatalytic H2 gas production. Under the same reaction condition, by using the following equation, the AQYs of the photocatalysts were calculated5
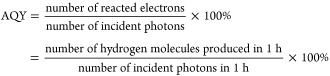 |
Photocatalytic Dye Degradation Experiment
Photocatalytic MB dye degradation experiments were performed in a 100 mL round-bottomed quartz flask by illuminating with a 300 W tungsten-halogen lamp (OSRAM, USA) kept 15 cm away from the reactor. The photocatalyst (50 mg) was dispersed in 50 mL of 10–5 M aqueous MB solution for the photocatalytic dye degradation analysis. The pH of the dye solution was adjusted to 13 by adding the required amount of aqueous NH3 solution. In order to achieve adsorption–desorption equilibrium among the dye, catalyst particles, dissolved oxygen, and atmospheric oxygen, the mixture was stirred for 30 minutes in the dark. During 1 h light irradiation, 2 mL of solution was collected from the photoreactor every 15 min. The collected dye solutions were centrifuged for 5 min to settle the suspended photocatalysts and the electronic absorption spectra of the supernatant dye solution were recorded in the range of 200–800 nm. By monitoring change in absorbance at 664 nm, the degradation of the MB dye was determined. The photocatalytic degradation efficiency was calculated as follows
where C0 is the initial MB dye concentration and C is the MB dye concentration in the filtrates at a certain time after light irradiation.33
Characterization
A Rigaku X-ray diffractometer (model TTRAX III) with Cu Kα1 (λ = 1.54056 Å) as the radiation source at 50 kV of operating voltage and 100 mA of operating current was used to record the PXRD patterns. A JEOL JEM 2100 microscope was used to carry out the FETEM analysis and elemental mapping of the compounds at an operating voltage of 200 kV. The UV–visible diffuse reflectance spectra of the photocatalysts over a wavelength range of 200–800 nm were measured in a JASCO V-650 spectrophotometer with an integrating sphere of 150 mm and BaSO4 as an internal reflectance standard. The absorbance spectra of MB solutions were measured on a PerkinElmer LAMBDA 25 spectrophotometer. Laser micro-Raman analysis was carried out in a HORIBA LabRAM HR spectrometer. PL spectra were recorded in a HORIBA Scientific Fluoromax-4 spectrophotometer. TRPL measurements were performed on a LifeSpec II Edinburgh instrument. FTIR spectra were recorded using a PerkinElmer instrument with KBr pellet. ESR spectra were measured on an X-band Microwave Unit, JES-FA200 ESR spectrometer at room temperature at 100 G amplitude (χ), 9.444 GHz microwave frequency, and 100 kHz modulation frequency. A PHI 5000 Versaprob II, FEI Inc. instrument was used to carry out XPS analysis of the samples. To compensate for the surface charging effect, all the peaks were referenced with respect to the C 1s spectrum (284.77 eV). All the XPS core-level spectral data were analyzed and quantified by using XPSPEAK 4.1 software and the background of all XPS spectra were subtracted by employing the Tougaard background method.
Acknowledgments
We thank the Department of Science and Technology for financial support (project no. SERB/EMR/2016/005123). ASP thanks Uday Narayan Pan and Milan Mahadani for their help. Instrumental assistance from Indian Institute of Technology (IIT) Guwahati, Central Instruments Facility (CIF) IIT Guwahati, Department of Physics IIT Guwahati, and ACMS IIT Kanpur is hereby acknowledged.
Supporting Information Available
The Supporting Information is available free of charge on the ACS Publications website at DOI: 10.1021/acsomega.8b01577.
FTIR spectrum of as-synthesized CDs, Raman spectrum of as-synthesized CDs, overall elemental mapping in TEM images, diffuse reflectance spectra of synthesized CDs, O 1s core-level XPS spectrum of as-synthesized CDs, XPS valence band spectra of BZO and 3C_BZO hybrid nanomaterials, and room temperature ESR spectrum of as-synthesized CDs (PDF)
The authors declare no competing financial interest.
Supplementary Material
References
- Li X.; Yu J.; Low J.; Fang Y.; Xiao J.; Chen X. Engineering Heterogeneous Semiconductors for Solar Water Splitting. J. Mater. Chem. A 2015, 3, 2485–2534. 10.1039/c4ta04461d. [DOI] [Google Scholar]
- Bard A. J.; Fox M. A. Artificial Photosynthesis: Solar Splitting of Water to Hydrogen and Oxygen. Acc. Chem. Res. 1995, 28, 141–145. 10.1021/ar00051a007. [DOI] [Google Scholar]
- Fujishima A.; Honda K. Electrochemical Photolysis of Water at a Semiconductor Electrode. Nature 1972, 238, 37–38. 10.1038/238037a0. [DOI] [PubMed] [Google Scholar]
- Grabowska E. Selected perovskite oxides: Characterization, preparation and photocatalytic properties-A review. Appl. Catal., B 2016, 186, 97–126. 10.1016/j.apcatb.2015.12.035. [DOI] [Google Scholar]
- Patra A. S.; Gogoi G.; Sahu R. K.; Qureshi M. Modulating the Electronic Structure of Lanthanum Manganite by Ruthenium Doping for Enhanced Photocatalytic Water Oxidation. Phys. Chem. Chem. Phys. 2017, 19, 12167–12174. 10.1039/c7cp01444a. [DOI] [PubMed] [Google Scholar]
- MacManus-Driscoll J. L.; Foltyn S. R.; Jia Q. X.; Wang H.; Serquis A.; Civale L.; et al. Strongly enhanced current densities in superconducting coated conductors of YBa2Cu3O7-x + BaZrO3. Nat. Mater. 2004, 3, 439–443. 10.1038/nmat1156. [DOI] [PubMed] [Google Scholar]
- Bi L.; Shafi S. P.; Traversa E. Y-doped BaZrO3 as a chemically stable electrolyte for proton-conducting solid oxide electrolysis cells (SOECs). J. Mater. Chem. A 2015, 3, 5815–5819. 10.1039/c4ta07202b. [DOI] [Google Scholar]
- Yuan Y.; Zhang X.; Liu L.; Jiang X.; Lv J.; Li Z.; et al. Synthesis and photocatalytic characterization of a new photocatalyst BaZrO3. Int. J. Hydrogen Energy 2008, 33, 5941–5946. 10.1016/j.ijhydene.2008.07.052. [DOI] [Google Scholar]
- Sambandam B.; Michael R. J. V.; Manoharan P. T. Oxygen Vacancies and Intense Luminescence in Manganese Loaded ZnO Microflowers for Visible Light Water Splitting. Nanoscale 2015, 7, 13935–13942. 10.1039/c5nr02666k. [DOI] [PubMed] [Google Scholar]
- Tan H.; Zhao Z.; Zhu W.-b.; Coker E. N.; Li B.; Zheng M.; et al. Oxygen Vacancy Enhanced Photocatalytic Activity of Pervoskite SrTiO3. ACS Appl. Mater. Interfaces 2014, 6, 19184–19190. 10.1021/am5051907. [DOI] [PubMed] [Google Scholar]
- Pan X.; Xu Y.-J. Defect-Mediated Growth of Noble-Metal (Ag, Pt, and Pd) Nanoparticles on TiO2 with Oxygen Vacancies for Photocatalytic Redox Reactions under Visible Light. J. Phys. Chem. C 2013, 117, 17996–18005. 10.1021/jp4064802. [DOI] [Google Scholar]
- Yuan Y.; Zhao Z.; Zheng J.; Yang M.; Qiu L.; Li Z.; et al. Polymerizable complex synthesis of BaZr1–xSnxO3 photocatalysts: Role of Sn4+ in the band structure and their photocatalytic water splitting activities. J. Mater. Chem. 2010, 20, 6772–6779. 10.1039/c0jm00455c. [DOI] [Google Scholar]
- Borja-Urby R.; Díaz-Torres L. A.; Salas P.; Moctezuma E.; Vega M.; Ángeles-Chávez C. Structural study, photoluminescence, and photocatalytic activity of semiconducting BaZrO3:Bi nanocrystals. Mater. Sci. Eng., B 2011, 176, 1382–1387. 10.1016/j.mseb.2011.01.024. [DOI] [Google Scholar]
- Yeh T.-F.; Teng C.-Y.; Chen S.-J.; Teng H. Nitrogen-Doped Graphene Oxide Quantum Dots as Photocatalysts for Overall Water-Splitting under Visible Light Illumination. Adv. Mater. 2014, 26, 3297–3303. 10.1002/adma.201305299. [DOI] [PubMed] [Google Scholar]
- Liu J.; Liu Y.; Liu N.; Han Y.; Zhang X.; Huang H.; et al. Metal-Free Efficient Photocatalyst for Stable Visible Water Splitting via a Two-Electron Pathway. Science 2015, 347, 970–974. 10.1126/science.aaa3145. [DOI] [PubMed] [Google Scholar]
- Martindale B. C. M.; Hutton G. A. M.; Caputo C. A.; Reisner E. Solar Hydrogen Production Using Carbon Quantum Dots and a Molecular Nickel Catalyst. J. Am. Chem. Soc. 2015, 137, 6018–6025. 10.1021/jacs.5b01650. [DOI] [PubMed] [Google Scholar]
- Mirtchev P.; Henderson E. J.; Soheilnia N.; Yip C. M.; Ozin G. A. Solution phase synthesis of carbon quantum dots as sensitizers for nanocrystalline TiO2 solar cells. J. Mater. Chem. 2012, 22, 1265–1269. 10.1039/c1jm14112k. [DOI] [Google Scholar]
- Liu C.; Chang K.; Guo W.; Li H.; Shen L.; Chen W.; et al. Improving Charge Transport Property and Energy Transfer with Carbon Quantum Dots in Inverted Polymer Solar Cells. Appl. Phys. Lett. 2014, 105, 073306. 10.1063/1.4893994. [DOI] [Google Scholar]
- Cao L.; Wang X.; Meziani M. J.; Lu F.; Wang H.; Luo P. G.; et al. Carbon Dots for Multiphoton Bioimaging. J. Am. Chem. Soc. 2007, 129, 11318–11319. 10.1021/ja073527l. [DOI] [PMC free article] [PubMed] [Google Scholar]
- Wang Y.; Hu A. Carbon Quantum Dots: Synthesis, Properties and Applications. J. Mater. Chem. C 2014, 2, 6921–6939. 10.1039/c4tc00988f. [DOI] [Google Scholar]
- Liu J.; Liu X.; Luo H.; Gao Y. One-step Preparation of Nitrogen-doped and Surface-passivated Carbon Quantum Dots with High Quantum Yield and Excellent Optical Properties. RSC Adv. 2014, 4, 7648–7654. 10.1039/c3ra47577h. [DOI] [Google Scholar]
- Li H.; Kang Z.; Liu Y.; Lee S.-T. Carbon Nanodots: Synthesis, Properties and Applications. J. Mater. Chem. 2012, 22, 24230–24253. 10.1039/c2jm34690g. [DOI] [Google Scholar]
- Guo Y.; Yao P.; Zhu D.; Gu C. A Novel Method for the Development of a Carbon Quantum Dot/Carbon Nitride Hybrid Photocatalyst that Responds to Infrared Light Irradiation. J. Mater. Chem. A 2015, 3, 13189–13192. 10.1039/c5ta02262b. [DOI] [Google Scholar]
- Xu X.; Bao Z.; Zhou G.; Zeng H.; Hu J. Enriching Photoelectrons via Three Transition Channels in Amino-conjugated Carbon Quantum Dots to Boost Photocatalytic Hydrogen Generation. ACS Appl. Mater. Interfaces 2016, 8, 14118–14124. 10.1021/acsami.6b02961. [DOI] [PubMed] [Google Scholar]
- Yu H.; Zhao Y.; Zhou C.; Shang L.; Peng Y.; Cao Y.; et al. Carbon quantum dots/TiO2 composites for efficient photocatalytic hydrogen evolution. J. Mater. Chem. A 2014, 2, 3344–3351. 10.1039/c3ta14108j. [DOI] [Google Scholar]
- Song B.; Wang T.; Sun H.; Shao Q.; Zhao J.; Song K.; et al. Two-step hydrothermally synthesized carbon nanodots/WO3 photocatalysts with enhanced photocatalytic performance. Dalton Trans. 2017, 46, 15769–15777. 10.1039/c7dt03003g. [DOI] [PubMed] [Google Scholar]
- Wang Q.; Huang J.; Sun H.; Zhang K.-Q.; Lai Y. Uniform carbon dots@TiO2 nanotube arrays with full spectrum wavelength light activation for efficient dye degradation and overall water splitting. Nanoscale 2017, 9, 16046–16058. 10.1039/c7nr06809c. [DOI] [PubMed] [Google Scholar]
- Tang D.; Zhang H.; Huang H.; Liu R.; Han Y.; Liu Y.; et al. Carbon quantum dots enhance the photocatalytic performance of BiVO4 with different exposed facets. Dalton Trans. 2013, 42, 6285–6289. 10.1039/c3dt50567g. [DOI] [PubMed] [Google Scholar]
- Huo Y.; Chen X.; Zhang J.; Pan G.; Jia J.; Li H. Ordered macroporous Bi2O3/TiO2 film coated on a rotating disk with enhanced photocatalytic activity under visible irradiation. Appl. Catal., B 2014, 148–149, 550–556. 10.1016/j.apcatb.2013.11.040. [DOI] [Google Scholar]
- Li H.; Bian Z.; Zhu J.; Zhang D.; Li G.; Huo Y.; et al. Mesoporous Titania Spheres with Tunable Chamber Stucture and Enhanced Photocatalytic Activity. J. Am. Chem. Soc. 2007, 129, 8406–8407. 10.1021/ja072191c. [DOI] [PubMed] [Google Scholar]
- Zhu S.; Meng Q.; Wang L.; Zhang J.; Song Y.; Jin H.; et al. Highly Photoluminescent Carbon Dots for Multicolor Patterning, Sensors, and Bioimaging. Angew. Chem., Int. Ed. 2013, 52, 3953–3957. 10.1002/anie.201300519. [DOI] [PubMed] [Google Scholar]
- Dong Z.; Ye T.; Zhao Y.; Yu J.; Wang F.; Zhang L.; et al. Perovskite BaZrO3 hollow micro- and nanospheres: controllable fabrication, photoluminescence and adsorption of reactive dyes. J. Mater. Chem. 2011, 21, 5978–5984. 10.1039/c0jm04534a. [DOI] [Google Scholar]
- Liu J.; Zhang L.; Li N.; Tian Q.; Zhou J.; Sun Y. Synthesis of MoS2/SrTiO3 composite materials for enhanced photocatalytic activity under UV irradiation. J. Mater. Chem. A 2015, 3, 706–712. 10.1039/c4ta04984e. [DOI] [Google Scholar]
- Das A.; Gude V.; Roy D.; Chatterjee T.; De C. K.; Mandal P. K. On the Molecular Origin of Photoluminescence of Nonblinking Carbon Dot. J. Phys. Chem. C 2017, 121, 9634–9641. 10.1021/acs.jpcc.7b02433. [DOI] [Google Scholar]
- Peng J.; Gao W.; Gupta B. K.; Liu Z.; Romero-Aburto R.; Ge L.; et al. Graphene Quantum Dots Derived from Carbon Fibers. Nano Lett. 2012, 12, 844–849. 10.1021/nl2038979. [DOI] [PubMed] [Google Scholar]
- Ding H.; Yu S.-B.; Wei J.-S.; Xiong H.-M. Full-Color Light-Emitting Carbon Dots with a Surface-State-Controlled Luminescence Mechanism. ACS Nano 2016, 10, 484–491. 10.1021/acsnano.5b05406. [DOI] [PubMed] [Google Scholar]
- Bhattacharyya S.; Ehrat F.; Urban P.; Döblinger M.; Feldmann J.; Urban A. S.; et al. Effect of Nitrogen Atom Positioning on the Trade-Off Between Emissive and Photocatalytic Properties of Carbon Dots. Nat. Commun. 2017, 13, 1401. 10.1038/s41467-017-01463-x. [DOI] [PMC free article] [PubMed] [Google Scholar]
- Zheng F.; Yang Y.; Chen Q. A High Lithium Anodic Performance of Highly Nitrogen-Doped Porous Carbon Prepared from a Metal-Organic Framework. Nat. Commun. 2014, 5, 5261. 10.1038/ncomms6261. [DOI] [PubMed] [Google Scholar]
- Reckmeier C. J.; Wang Y.; Zboril R.; Rogach A. L. Influence of Doping and Temperature on Solvatochromic Shifts in Optical Spectra of Carbon Dots. J. Phys. Chem. C 2016, 120, 10591–10604. 10.1021/acs.jpcc.5b12294. [DOI] [Google Scholar]
- Schneider J.; Reckmeier C. J.; Xiong Y.; von Seckendorff M.; Susha A. S.; Kasák P.; Rogach A. L. Molecular Fluorescence in Citric Acid-Based Carbon Dots. J. Phys. Chem. C 2017, 121, 2014–2022. 10.1021/acs.jpcc.6b12519. [DOI] [Google Scholar]
- Bandi R.; Gangapuram B. R.; Dadigala R.; Eslavath R.; Singh S. S.; Guttena V. Facile and Green Synthesis of Fluorescent Carbon Dots from Onion Waste and Their Potential Applications as Sensor and Multicolour Imaging Agents. RSC Adv. 2016, 6, 28633–28639. 10.1039/c6ra01669c. [DOI] [Google Scholar]
- Zong J.; Zhu Y.; Yang X.; Shen J.; Li C. Synthesis of Photoluminescent Carbogenic Dots using Mesoporous Silica Spheres as Nanoreactors. Chem. Commun. 2011, 47, 764–766. 10.1039/c0cc03092a. [DOI] [PubMed] [Google Scholar]
- Zou Y.; Luo Y.; Wen N.; Ye T.; Xu C.; Yu J.; et al. Fabricating BaZrO3 hollow microspheres by a simple reflux method. New J. Chem. 2014, 38, 2548–2553. 10.1039/c3nj01415k. [DOI] [Google Scholar]
- Ye T.; Dong Z.; Zhao Y.; Yu J.; Wang F.; Guo S.; et al. Controllable Synthesis and Photoluminescence of Single-Crystalline BaHfO3 Hollow Micro- and Nanospheres. Langmuir 2011, 27, 8878–8884. 10.1021/la201749z. [DOI] [PubMed] [Google Scholar]
- Brinker C. J.; Scherer G. W.. Sol-Gel Science: The Physics and Chemistry of Sol-Gel Processing; Academic Press: San Diego, CA, 1990; p 462. [Google Scholar]
- Moreira M. L.; Longo V. M.; Avansi W.; Ferrer M. M.; Andrés J.; Mastelaro V. R.; et al. Quantum Mechanics Insight into the Microwave Nucleation of SrTiO3 Nanospheres. J. Phys. Chem. C 2012, 116, 24792–24808. 10.1021/jp306638r. [DOI] [Google Scholar]
- Zhang J.; Liu S.; Yu J.; Jaroniec M. A simple cation exchange approach to Bi-doped ZnS hollow spheres with enhanced UV and visible-light photocatalytic H2-production activity. J. Mater. Chem. 2011, 21, 14655–14662. 10.1039/c1jm12596f. [DOI] [Google Scholar]
- Kröger F. A.; Vink H. J. Relations between the Concentrations of Imperfections in Crystalline Solids. Solid State Phys. 1956, 3, 307–435. 10.1016/s0081-1947(08)60135-6. [DOI] [Google Scholar]
- Cavalcante L. S.; Longo V. M.; Zampieri M.; Espinosa J. W. M.; Pizani P. S.; Sambrano J. R.; Varela J. A.; Longo E.; Simões M. L.; Paskocimas C. A. Experimental and theoretical correlation of very intense visible green photoluminescence in BaZrO3 powders. J. Appl. Phys. 2008, 103, 063527. 10.1063/1.2901176. [DOI] [Google Scholar]
- Liu S.; Tian J.; Wang L.; Zhang Y.; Qin X.; Luo Y.; et al. Hydrothermal Treatment of Grass: A low-Cost, Green Route to Nitrogen-Doped, Carbon-Rich, Photoluminescent Polymer Nanodots as an Effective Fluorescent Sensing Platform for Label-Free Detection of Cu(II) Ions. Adv. Mater. 2012, 24, 2037–2041. 10.1002/adma.201200164. [DOI] [PubMed] [Google Scholar]
- Jaiswar S.; Mandal K. D. Evidence of Enhanced Oxygen Vacancy Defects Inducing Ferromagnetism in Multiferroic CaMn7O12 Manganite with Sintering Time. J. Phys. Chem. C 2017, 121, 19586–19601. 10.1021/acs.jpcc.7b05415. [DOI] [Google Scholar]
- Wagner D.; Muilenberg G. E.. Handbook of X-ray Photoelectron Spectroscopy: A Reference Book of Standard Data for Use in X-ray Photoelectron Spectroscopy; Physical Electronics Division, Perkin-Elmer Corp., 1979. [Google Scholar]
- Sun W.; Shi Z.; Liu M.; Bi L.; Liu W. An Easily Sintered, Chemically Stable, Barium Zirconate-Based Proton Conductor for High-Performance Proton-Conducting Solid Oxide Fuel Cells. Adv. Funct. Mater. 2014, 24, 5695–5702. 10.1002/adfm.201401478. [DOI] [Google Scholar]
- Naldoni A.; Allieta M.; Santangelo S.; Marelli M.; Fabbri F.; Cappelli S.; et al. Effect of Nature and Location of Defects on Bandgap Narrowing in Black TiO2 Nanoparticles. J. Am. Chem. Soc. 2012, 134, 7600–7603. 10.1021/ja3012676. [DOI] [PubMed] [Google Scholar]
- Sanyal K.; Pathak N.; Yadav A. K.; Kanrar B.; Kadam R. M.; Jha S. N.; et al. Investigations on local structures in new Bi2–2xLa2xUO6 (x = 0-0.05) solid solutions: a combined XRD, EXAFS, PL and EPR study. Dalton Trans. 2016, 45, 7650–7664. 10.1039/c6dt00400h. [DOI] [PubMed] [Google Scholar]
- Matta J.; Lamonier J.-F.; Abi-Aad E.; Zhilinskaya E. A.; Aboukaïs A. Transformation of tetragonal zirconia phase to monoclinic phase in the presence of Fe3+ ions as probes: an EPR study. Phys. Chem. Chem. Phys. 1999, 1, 4975–4980. 10.1039/a904828f. [DOI] [Google Scholar]
- Moreira M. L.; Buzolin P. G. C.; Longo V. M.; Nicoleti N. H.; Sambrano J. R.; Li M. S.; et al. Joint Experimental and Theoretical Analysis of Order–Disorder Effects in Cubic BaZrO3 Assembled Nanoparticles under Decaoctahedral Shape. J. Phys. Chem. A 2011, 115, 4482–4490. 10.1021/jp1119124. [DOI] [PubMed] [Google Scholar]
- Zhang Y.; Tang Y.; Liu X.; Dong Z.; Hng H. H.; Chen Z.; et al. Three-Dimensional CdS-Titanate Composite Nanomaterials for Enhanced Visible-Light-Driven Hydrogen Evolution. Small 2013, 9, 996–1002. 10.1002/smll.201202156. [DOI] [PubMed] [Google Scholar]
- Wang X.; Liow C.; Bisht A.; Liu X.; Sum T. C.; Chen X.; et al. Engineering Interfacial Photo-Induced Charge Transfer Based on Nanobamboo Array Architecture for Efficient Solar-to-Chemical Energy Conversion. Adv. Mater. 2015, 27, 2207–2214. 10.1002/adma.201405674. [DOI] [PubMed] [Google Scholar]
- Gogoi G.; Arora S.; Vinothkumar N.; De M.; Qureshi M. Quaternary semiconductor Cu2ZnSnS4 loaded with MoS2 as a co-catalyst for enhanced photo-catalytic activity. RSC Adv. 2015, 5, 40475–40483. 10.1039/c5ra03401a. [DOI] [Google Scholar]
- Bao N.; Shen L.; Takata T.; Domen K. Self-Templated Synthesis of Nanoporous CdS Nanostructures for Highly Efficient Photocatalytic Hydrogen Production under Visible Light. Chem. Mater. 2008, 20, 110–117. 10.1021/cm7029344. [DOI] [Google Scholar]
- Zhang Z.; Lin S.; Li X.; Li H.; Cui W. Metal free and efficient photoelectrocatalytic removal of organic contaminants over g-C3N4 nanosheet films decorated with carbon quantum dots. RSC Adv. 2017, 7, 56335–56343. 10.1039/c7ra11205j. [DOI] [Google Scholar]
Associated Data
This section collects any data citations, data availability statements, or supplementary materials included in this article.