

Abstract
Tremendous reductions (23% since 2010) in hospital-acquired pressure ulcers (HAPUs) are reported from surveillance chart reviews, equated as $1 billion savings. Yet, it remains unclear if similar improvements are seen in the administrative data used to implement 3 Medicare value-based purchasing (VBP) programs targeting HAPUs, and how success varied by HAPU severity. VBP programs measure and penalize only for more severe ulcers (Stage III, IV, unstageable) that are much more costly than less severe cases (Stage I, II). Thus, we assessed HAPU incidence, severity, and trends using 2009–2014 administrative data from 3 states. HAPU incidence was ~1/20th of chart-based surveillance incidence. While HAPUs declined in administrative data, 96% of decline was due to fewer less severe HAPUs. Transitioning from administrative data to surveillance chart review to measure HAPUs (mirroring hospital-acquired infection reporting), accounting for HAPU severity, could improve HAPU measure validity for assessing the clinical and financial impact of interventions.
INTRODUCTION
Efforts to improve quality and reduce cost often focus on reducing complications that patients develop during hospitalization, known as hospital-acquired conditions (HACs). Several “value-based purchasing” (VBP) programs moderating Medicare hospital payment utilize hospital-specific HAC rates with the goal to financially motivate hospitals to prevent HACs. Several metrics derived from different data sources and collection methods have been used to measure HAC rates for Medicare programs. Each data collection strategy has advantages and limitations, and can generate different estimates of HAC incidence as well as assessments of how HAC rates change over time.1–3 These differences in HAC measurement and the subsequent policy and financial implications inspired this study, focused on the hospital-acquired pressure ulcer (HAPU), a common, morbid, and expensive complication.
Pressure ulcers, also known as pressure injuries when renamed by experts in 2016, are injuries4 to skin and underlying tissue that typically occur over a bony prominences due to pressure, or pressure with shear and/or friction. Risk factors include immobility from paralysis by stroke or spinal cord injury, generalized weakness, malnutrition, advanced age, and poor circulation to skin. Strategies to reduce pressure ulcers in hospitalized patients include frequent skin monitoring, improving mobility and repositioning patients in bed, and optimizing nutrition. Pressure ulcers range in severity from early injuries with no open wounds (Stage I) to very advanced wounds that involve breakdown of all skin layers as well as bone, muscle, or tendon (Stage IV). Patient morbidity, as well as the time and costs required to heal the pressure ulcer varies markedly from Early-Stage pressure ulcers (Stages I or II) compared to Advanced-Stage pressure ulcers (Stages III, IV, Unstageable).5–7 Each year, pressure ulcers are reported to affect as many as 2.5 million patients, cost an estimated $9–11 billion, resulting in 60,000 deaths as a direct consequence of developing pressure ulcers.8
Hospital-acquired pressure ulcer (HAPU) rates are used in three Centers for Medicare and Medicaid Services (CMS) VBP programs (Exhibit 1) designed to promote quality by financially incentivizing better hospital care. HAPU rates for Medicare’s VBP program implementation are derived only from administrative discharge data, which is routinely generated for each discharge by hospital coders using Federal criteria.9 The Hospital-Acquired Condition Initiative (HACI),10–12 impacting discharges after October 2008, removed HAPUs and other HACs as diagnoses eligible to yield additional hospital payment, using HAPU diagnoses in all hospital discharges, applying no exclusion or risk-adjustment criteria. The HAC Reduction Program (HACRP),13 impacting discharges after October 2014, financially penalizes hospitals with the highest rates of select HACs including HAPUs, with HAPU rates generated by application of the Patient Safety Index 3 (PSI-3) software,14, 15 which has applied multiple exclusions, removing several high-risk patient populations from measurement, as well as applying risk-adjustment. Using the same administrative-data based HAPU measure called PSI-3 used in the HACRP, the Hospital Value-Based Purchasing program (HVBP) initiated in 2012,16 compares and financially penalizes hospitals based on performance in multiple categories, also including a domain with HAPU rates. Appendix Exhibit A117 details the history of these different HAPU metrics and VBP programs.
Exhibit 1:
Summary of Pressure Ulcer Metrics and Value-Based Policies Source: Authors’ analysis of information from the following sources: (1) Meddings J, McMahon LF, Jr. Web Exclusives. Annals for Hospitalists Inpatient Notes - Legislating Quality to Prevent Infection-A Primer for Hospitalists. Ann Intern Med. 2 017;166(4):HO2-HO3. (2) Centers for Medicare & Medicaid Services. Hospital-Acquired Conditions (Note 4 in text). (3) Centers for Medicare & Medicaid Services. Hospital-Acquired Condition Reduction Program (HACRP) (Note 5 in text). (4) Centers for Medicare & Medicaid Services. CMS-1655-F; CMS-1664-F; CMS-1632-F2; CMS-1655-CN2: Final Rule and Correction Notice (Note 6 in text). (5) Centers for Medicare & Medicaid Services. Hospital Value-Based Purchasing (Note 7 in text). (6) Classen DC, Munier W, Verzier N, et al. Measuring Patient Safety: The Medicare Patient Safety Monitoring System (Past, Present, and Future). J Patient Saf. 2016 Oct 20;[Epub ahead of print]. (3) Lyder CH, Wang Y, Metersky M, et al. Hospital-acquired pressure ulcers: results from the national Medicare Patient Safety Monitoring System study. J Am Geriatr Soc. 2 012;60(9):1603–8.
| VALUE-BASED PROGRAMS: Implemented by CMS using Administrative Data to Change Hospital Payment | NON-VALUE-BASED, Surveillance Chart Review, not used to Implement CMS Policy or Change Hospital Payment | |||
| Program | Hospital-Acquired Conditions Initiative (HACI) | Hospital-Acquired Conditions Reduction Program (HACRP) | Hospital Value-Based Purchasing Program (HVBP) | Medicare Patient Safety Monitoring System (MPSMS) |
| Primary goal | Reduce hospital-acquired conditions by reducing payment by removing HACs as a payable comorbidity | Reduce hospital-acquired conditions through penalties for high rates | Rewards hospitals with incentives for high-quality care | Monitor patient safety events |
| Federal law origin | Deficit Reduction Act of 2005 | ACA | ACA | CMS/HHS Patient Safety Task Force |
| Initial implementation | October 2008 | October 2014 | October 2012 | 2002 (pressure ulcers added in 2004) |
| Data source | Administrative data | Administrative data | Administrative data | Surveillance Chart review |
| Mechanism used to identify pressure ulcers | HACI-defined HAPU measures are simply the ICD-9 diagnosis codes listed in Administrative data, with no | AHRQ PSI-3 software to apply criteria to identify eligible HAPU events for eligible patients | AHRQ PSI-3 software to apply criteria to identify eligible HAPU events for eligible patients | Standardized Chart review exclusion criteria applied |
| Pressure ulcers included/covered | All stages Hospital-acquired and POA | Advanced stage (Stages III, IV and unstageable) Hospital-acquired only | Advanced stage (Stages III, IV and unstageable) Hospital-acquired only | All stages of pressure ulcers are included, but data collection does not categorize by pressure ulcer stage during abstraction. Hospital-acquired only |
| Target patient population | Medicare | Medicare (with PSI-3 exclusions) | Medicare (with PSI-3 exclusions) | Medicare |
| Payment changes | Denies payment for advanced stage HAPUs. Stage 1 and 2 pressure ulcers (hospital-acquired or POA) removed as comorbidities for increasing hospital payment. Loss of extra payment varies by reason for admission. | Hospitals in lowest quartile of performance have Medicare payments reduced by 1% for the hospital’s entire book of business. | Entire program funded by withholding 2% of a hospital’s payments for hospitalizations, known as diagnosis-related group payments. The ability to earn back the withheld payment is an incentive, based on total performance score. | Not applicable, because this surveillance data collection using chart review is not used for implementation of any of the Medicare Value-Based Purchasing Programs |
ACA = Patient Protection and Affordable Care Act of 2010; CMS = Centers for Medicare and Medicaid Services; HHS = Department of Health and Human Services; HAPU = Hospitalacquired pressure ulcer; AHRQ PSI = Agency for Healthcare Research and Quality Patient Safety Index; HACRP = Hospital-Acquired Conditions Reduction Program; POA = Present on
How much have these VBP programs reduced HAPUs? An interim report from the Agency for Healthcare Research and Quality (AHRQ) National Scorecard on Rates of Hospital-Acquired Conditions, tracking national rates of 21 HACs, found a 23% decline in HAPUs from 2010–2014;18 the 2015 interim report describes a smaller 10% decline.19 Even this smaller decline, however, accounts for nearly one-quarter of the estimated 3.1 million fewer HACs observed during this period, which the report indicates accounts for potential savings of more than $1 billion and more than 4,500 fewer deaths if HAPU reductions of 25% are achieved.20 However, it is important to note that these reports from AHRQ rely on HAPU rates generated from a data source that is very different than the administrative data used by Medicare to implement the VBP programs. These AHRQ reports use pressure ulcer rates from the Medicare Patient Safety Monitoring System (MPSMS)21, a standardized chart-based surveillance medical record review by trained abstractors applying the same criteria to a sample of all charts from all hospitals. MPSMS data are currently only used to study trends in complication rates, and not used as outcomes impacting hospital payment.
Important differences in pressure ulcer data collection from chart-based surveillance review and the administrative data used to implement hospital payment change inspired our three research questions. First, we queried whether changes in HAPU incidence in 2009–2014 from administrative data (as defined by the measures used to implement the Medicare VBP programs) would capture similar improvement in HAPU rates that was reported from MPSMS surveillance data. We anticipated HAPU rates would be systematically lower in administrative data compared to chart-based surveillance review based on prior work,1,2,22 particularly for the rarer Advanced-Stage ulcers. However, we were curious whether similar HAPU relative rate reductions would be seen in administrative data when also measuring changes in Early-Stage pressure ulcers. Second, we queried rates and severity of HAPUs among certain patients excluded from measurement in Medicare’s VBP programs, as some of these excluded groups have historically been at increased risk of pressure ulcers (e.g., patients with paralysis). The overall goal of this analysis is to better understand the limitations of current data sources being used to implement and report success for the Medicare VBP programs’ impact on HAPUs, as well as to inform future Medicare program and metric modifications to better capture pressure ulcer incidence and severity, which could be used to better inform estimated cost savings.
METHODS
Study Design and Data Sources
We used 2009–2014 administrative data from the Healthcare Cost and Utilization Project (HCUP) State Inpatient Databases (SID) to identify discharges with a pressure ulcer diagnosis as defined by current VBP programs. HCUP SID administrative data includes the pressure ulcer diagnosis codes, variables identifying present-on-admission versus hospital-acquired status, and hospital identifiers to exclude ineligible hospitals. However not all states with SIDs provide diagnoses’ present-on-admission status or hospital identifiers for 20092014, so these variables are not included in the HCUP National Inpatient Sample. In absence of full, nationally-representative data, we selected three states with large Medicare populations, diverse geography and demographics to proxy for national trends: Florida (FL), New York (NY), and Washington (WA).
Study Population
The study population was all eligible discharges from all hospitals in FL, NY, and WA covered by the three Medicare VBP policies (HACI, HACRP, HVBP in Exhibit 1) as defined by these programs using administrative data. Hospitals not affected by HACI and/or PSI-3 measurement (e.g., rehabilitation and psychiatric facilities, children’s hospitals) were excluded. PSI-3 measures included further patient-specific comorbidity or diagnosis exclusions (Appendix Exhibit A2). Analyses presented here include only those discharges with Medicare named as the primary payer; supplemental analyses were done for all payers and are presented in the Appendix.17
Pressure Ulcer Case Identification
As in prior papers,2, 3 pressure ulcers were identified in administrative data according to diagnoses by International Classification of Diseases Ninth Revision by ulcer location, for all states and all years. Diagnosis codes were further used to specify stage (classified as Early [I, II and No Stage] and Advanced [III, IV and Unstageable]) and status (present-on-admission vs. hospital-acquired). The HACI and PSI-3 measures of pressure ulcers used in Medicare’s VBP programs were defined according to the programs as specified in the Federal Register, with the 2016 version of the PSI-3 software applied across all years analyzed.
Advanced- and Early-Stage classifications were used in lieu of individual stages to account for potential differences in classification across hospitals and clinicians because Stages I and II are clinically similar to each other in appearance and treatment, as are Stages III and IV, so it could be difficult to distinguish between Stage I-II and Stage III-IV unless meticulously documented.
Trends in Statewide Rates Under HACI and PSI-3 Definitions
Annual statewide rates of HACI- and PSI-3-defined pressure ulcers for each year 2009–2014 were calculated as the ratio between pressure ulcers documented under HACI or PSI-3 definition (numerator) and number of HACI or PSI-3-eligible discharges (denominator). HAPU rates were also calculated for 2016-defined PSI-3 exclusion cohorts, both in the aggregate and by cohort. Trends in pressure ulcers incidence were evaluated by calculating change over time in hospital-level pressure ulcer incidence using mixed-effect, negative binomial models with an offset for total discharges and a hospital-level random effect. Over-time trends were examined across all states (controlling for state) and for each state individually to ensure robustness. All analyses were performed using Stata version 15.1 with p<0.05 used throughout to indicate statistical significance.
Limitations
Our methods have important limitations. Prior research has shown administrative data to be problematic for tracking pressure ulcers, notably for having too few diagnosis codes available,23 and for reliable distinctions between present-on-admission and hospital-acquired pressure ulcers.24 However, these limitations apply equally to our analyses and to Medicare’s VBP programs under examination since each uses administrative data. Another limitation is using data from only three states. While these states were selected because they offered both the present-on-admission variable necessary for evaluation of HAPU trends represented in current programs and demographic and geographic diversity, generalizability may be limited, as practice patterns and coding vary across states. With respect to HACI-defined pressure ulcers, given that HACI policy was to stop payment for Early-Stage HAPUs, it is difficult to know whether the decline seen in administrative data Early-Stage HAPUs reflects a true decrease in Early-Stage HAPU incidence or a decline in their administrative documentation. With respect to PSI-3-defined pressure ulcers, a number of changes have been made over time to PSI-3 exclusions. As such, we applied the most up-to-date definition of exclusion criteria (which are more lenient in terms of length of stay and MDC-9 skin condition exclusions) to all years of data. A new PSI-3 measure has also since been released with some updates to Medicare Severity Diagnosis Related Groups Modified Diagnosis Related Groups, and Major Diagnostic Categories.15
RESULTS
Study Population and Overall Rates for FL, NY, and WA, 2009–2014
From a total patient population of 34,817,118 across all states and years, 25,056,419 patients (72%) were HACI-eligible, and 14,036,327 (40% of total) PSI-3 eligible. Of those, 13,147,153 under the HACI and 7,942,449 eligible for PSI-3 listed Medicare as their primary payer. For HACI-eligible discharges, 463,866 pressure ulcers (including all stages and both present-on-admission and hospital-acquired) were recorded in HCUP data, for a rate of 3.5%. Present-on-admission pressure ulcers accounted for the majority of these pressure ulcers, with all-stage present-on-admission rate at 3.31% and all-stage HAPU rate at 0.22%.
For the same period, 3,170 PSI-3 HAPUs were recorded, for a rate of 0.04% amongst PSI-3 eligible admissions (Appendix Exhibit A2). This lower rate relative to HACI-defined HAPUs was driven largely by PSI-3 focus on Advanced-Stage HAPUs. PSI-3 HAPUs include only Advanced-Stage Ulcers (Stage III, IV, or unstageable) so exclude HAPUs Stage 1 or 2 pressure ulcers. PSI-3 also excludes several patients with increased HAPU risk, with hemiplegia/paraplegia/quadriplegia, anoxic brain injury, spina bifida, transfers from outside hospitals and nursing homes, and certain skin conditions. Patients were also excluded from measurement in PSI-3 software with length of stay (LOS) less than 3 days. Altogether these excluded cohorts represent 37.7% of HACI-eligible discharges. HAPU rate for these cohorts in the aggregate was 0.13%, ranging from 0.006% for short-stay patients to 1.32% for patients with anoxic brain injuries. For the all-payer population, exclusions looked similar, and HACI and PSI-3 rates were slightly lower (0.16% and 0.03%, respectively) (Appendix Exhibit A3).17
Trends in Rates of Hospital-Acquired Pressure Ulcers, 2009–2014
Our first objective was to compare the HACI-defined and PSI-3-defined pressure ulcers changes to trends captured by the MPSMS surveillance chart-review data cited by AHRQ18–20, and whether HAPU incidence trends for certain cohorts excluded from PSI-3 also saw similar trends in HAPU incidence over time. Negative binomial model results are summarized in Exhibits 2–4 and presented in full in Appendix Exhibit A4.
Exhibit 2:
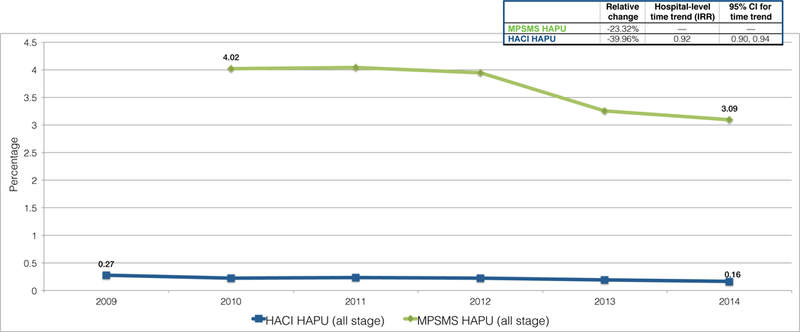
Rates for HAPUs (all stages) for HACI (2009–2014) and MPSMS (2010–2014)
Source: MPSMS rates in this Exhibit are as publicly reported in reports from the Agency for Healthcare Research and Quality.25–28 Authors’ analysis of administrative data from the Healthcare Cost and Utilization Project (HCUP) State Inpatient Databases for Florida (FL), New York (NY), and Washington (WA), 2009–2014.
Notes: MPSMS = Medicare Patient Safety Monitoring System; HACI = Hospital-Acquired Conditions Initiative; HAPU = Hospital-acquired pressure ulcer; PSI = Patient Safety Indicator; Dx = diagnosis; POA = present on admission.
Exhibit 4:
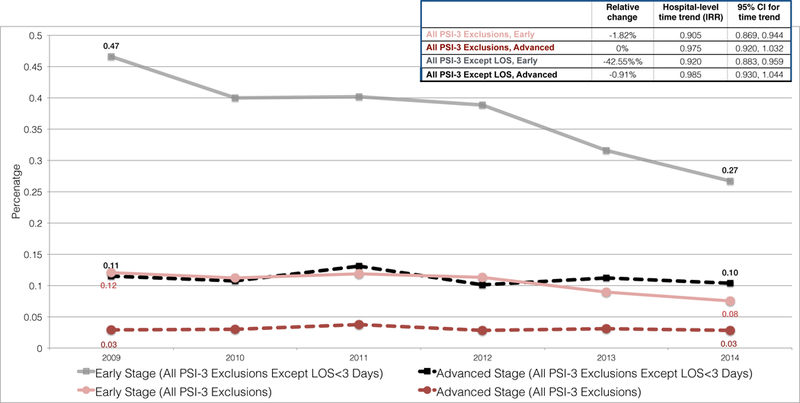
Rates for PSI-3 Exclusion HAPUs, by stage, with and without < 3 day length of stay (LOS) (2009-2014)
Source: Authors’ analysis of administrative data from the Healthcare Cost and Utilization Project (HCUP) State Inpatient Databases for Florida (FL), New York (NY), and Washington (WA), 2009–2014.
Notes: Dashed lines indicate non-significant declines in incidence over time. Significance of time trend assessed using hospital-level negative binomial model including linear indicator for year, controlling for state and with an offset for total number of discharges. LOS=Length of stay.
HACI-defined Hospital-Acquired Pressure Ulcers
Annual data across all three states included at least 2.14 million HACI-eligible adult discharges from at least 465 acute-care hospitals. For all HACI-eligible discharges, incidence rates for all stages HAPUs declined from 0.27% to 0.16%, a relative decline of 40%. While this relative decline was larger than the 23% relative decline in HAPUs recorded in MPSMS data (4.03% to 3.09%), it also obscures the fact that the HACI all-stage HAPU rate in 2014 was approximately 1/20th the MPSMS HAPU rate generated from chart-based surveillance(Exhibit 2) publicly reported in reports from the Agency for Healthcare Research and Quality. 25–28 Medicare population rates were slightly higher than all-payer rates at 0.13%, or 1/25th the MPSMS rate (Appendix Exhibit A5, Panel A).17
Breaking down HACI-defined HAPUs by stage, over 80% of HACI HAPUs were classified as Early-stage HAPUs. The HACI-defined HAPU decline was thus largely driven by declines in Early-Stage HAPUs, from 0.24% to 0.13% between 2009–2014. This amounts to approximately 2,196 fewer Early-Stage HAPUs in 2014 than 2009. Advanced-Stage HAPUs saw a very small decline in absolute incidence, from 0.046% to 0.041%, translating into ~99 fewer Advanced-Stage HAPUs in 2014 than 2009 amongst over 2 million annual HACI-eligible discharges (Exhibit 3). Altogether, we estimate that 2,295 fewer HAPUs were documented in administrative data in 2014 compared to 2009, of which 95.7% were Early-Stage and 4.3% were Advanced-Stage HAPUs. Trends for the all-payer populations were similar to Medicare trends (Appendix Exhibit A5, Panel B) .17
Exhibit 3:
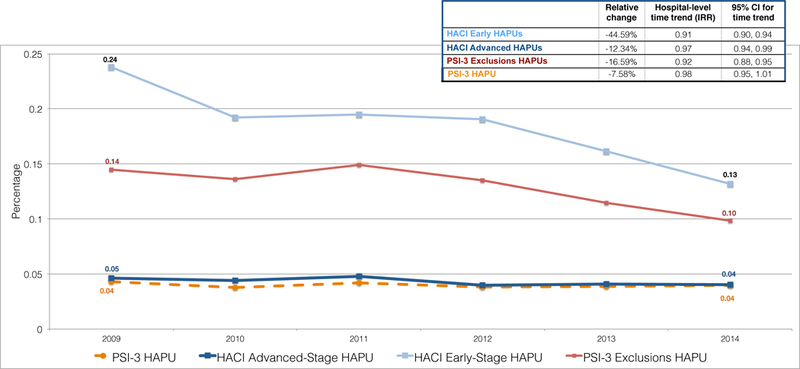
Rates for HACI HAPUs (by stage), PSI-3 HAPUs, and PSI-3 Exclusion HAPUs (2009–2014)
Source: Authors’ analysis of administrative data from the Healthcare Cost and Utilization Project (HCUP) State Inpatient Databases for Florida (FL), New York (NY), and Washington (WA), 2009–2014.
Notes: Dashed lines indicate non-significant declines in incidence over time. Significance of time trend assessed using hospital-level negative binomial model including linear indicator for year, controlling for state and with an offset for total number of discharges. HACI = Hospital-Acquired Conditions Initiative; HAPU = Hospital-acquired pressure ulcer; PSI = Patient Safety Indicator.
PSI-3-defined Hospital-Acquired Pressure Ulcers
In any given year, PSI-3 exclusion criteria eliminated nearly half of HACI-eligible discharges, with annual PSI-3-eligible discharges ranging from 1.32 million in 2009 to 1.33 million in 2014. PSI-3 HAPU rate (which includes only Advanced-Stage HAPUs) largely tracked the HACI-defined Advanced-Stage HAPU rate, declining from 0.043% in 2009 to 0.040% in 2014 (Exhibit 3). This relative 6.9% decline was not statistically significant (p=0.257) and translates into about 40 fewer Advanced-Stage HAPUs in 2014 than 2009 amongst 1.3 million annual PSI-3 eligible discharges. All payer PSI-3 HAPU trends were similar to Medicare trends and also showed a nonsignificant decline (Appendix Exhibit A5, Panel B).17
Rates of HAPUs for Discharge Cohorts Excluded from PSI-3
Rates of overall incidence for discharge cohorts excluded from PSI-3, 2009–2014, saw a small decline from 0.14% in 2009 to 0.10% in 2014. Negative binomial models showed this decline to be significant (p<0.001). This decline was driven by declines in Early-Stage HAPUs, which fell from 0.12% to 0.08% over the period. Rates of Advanced-Stage HAPUs stayed consistent at 0.03% throughout (Exhibit 4). Trends were heterogeneous for different exclusion cohorts (Appendix Exhibit A6), ranging from a low of 0.006% for patients with a LOS less than 3 days, to a high of 1.32% for anoxic brain injury patients. Excluding short LOS discharges, which accounted for nearly 73% of total exclusions, showed a much higher rate of HAPU incidence for the excluded cohorts. Overall HAPU incidence for this group declined from 0.56% in 2009 to 0.35% in 2014, which was a significant reduction (p<0.001). Again, however, this decline was driven by reductions in Early-Stage HAPUs, which decreased in incidence from 0.47% to 0.27%, while Advanced-Stage HAPUs declined from 0.11% to 0.10%. Nearly all cohorts saw some decline in overall HAPU rates. Cohort-specific negative binomial models showed these declines to be significant for four of the six cohorts. All-payer analyses also showed significant declines for excluded cohorts overall, as well as for three condition-specific cohorts(Appendix Exhibit A7).17
DISCUSSION
We examined how changes in pressure ulcer incidence rates and severity compared when generated from the administrative data used by Medicare to implement three value-based purchasing programs, with the very impressive reductions in HAPU rates recently reported by AHRQ from Medicare Patient Safety Monitoring System chart-based surveillance data.18–20
Comparing HAPU Declines in Administrative and Surveillance Data
As anticipated from prior work,1, 2, 22 the absolute rates of HAPUs were much lower (~1/20th) in administrative data compared to MPSMS chart-based surveillance reviews, even when including all HAPU stages without applying any exclusion criteria (i.e., the HACI-defined HAPU measure). Although the lower HAPU rates in administrative data did still decline between 2009–2014, the rate of decline was notably smaller than reported from the MPSMS data. Perhaps most importantly, declines in Early-Stage HAPUs accounted for 96% of the total HAPU decline found in administrative data.
Excluded Patients had Higher HAPU Rates, but Rates Did Decline
Our analyses also confirmed that patients whose discharges were excluded from PSI-3 HAPU measurement by reason of clinical comorbidity or transfer status for the HACRP and HVBP programs did develop HAPUs at much higher rates than those not excluded from measurement in administrative data. Importantly, other than the excluded cohort with baseline major skin condition comorbidities, all 4 categories of patients excluded from HAPU measurement (hemiplegia/paraplegia, anoxic brain injury, spina bifida, admitted as transfer) also saw significant decreases in HAPUs during 2009–2014.
Implications of HAPU Severity on Cost Savings Estimates
More severe (i.e., Stage III, IV or Unstageable) pressure ulcers are consistently reported in the literature to be much more costly than less severe (i.e., Stage I or II) pressure ulcers, with more severe ulcers reported as costing between 2 and 10 times as much as less severe ulcers, though the exact cost amount and definition applied varies by study. 29–34 Thus, there are important implications of our findings regarding potential estimated cost savings from HAPU reductions because the great majority (96%) of reductions seen in HAPUs in administrative data were in the less severe HAPUs. The HAPU rates cited from the MPSMS data, that was used recently to estimate a potential savings of $1 billion dollars from HAPU prevention, 18–20, 25 unfortunately do not differentiate HAPU data collection by HAPU severity. Because the great majority of HAPUs noted in administrative data are less severe (i.e., Early-Stage) HAPUs, we believe that many, and perhaps most, of the HAPUs measured in MPSMS could be Early-Stage HAPUs, which the literature supports are much lower cost than Advanced-Stage HAPUs. Because of this, the cost per pressure ulcer ($14,506 per ulcer for inpatient of any age, and $12,712 per ulcer in the adult inpatient35) used in the recent AHRQ report for estimating HAPU savings from HAPU reductions over time may be a significant overestimate, as the literature cited36–38 informing these estimates did not differentiate cost by pressure ulcer stage Our assessment is consistent with another study22 not supporting the recently reported savings25 from HAPU reductions as shown from trends in Advanced-Stage Pressure ulcers using 2010–2014 Medicare administrative data.
Recommended Program Improvements
These results suggest 3 improvements to improve the metrics used by hospitals and Medicare to assess progress in pressure ulcer incidence and severity, which would be anticipated to also better inform estimated cost savings generated from HAPU incidence data. Given large discrepancies between HAPU rates reported from chart-based surveillance data and administrative data in this study, as well as higher HAPU rates noted in HAPU surveillance by standardized periodic exams2 compared to administrative data, Medicare should initiate a formal surveillance system for pressure ulcers when measured for VBP programs, that is not dependent upon administrative data alone. One option for improved surveillance to consider as a next step is standardized chart-based surveillance by trained abstractors at each hospital, similar to the surveillance for hospital-acquired infections reported to the National Healthcare Safety Network that replaced administrative data as the primary data source for comparing hospitals by HAI rates. Another option, though certainly much more resource intensive, would be requiring hospitals to perform and report periodic in-person prevalence surveillance exams for HAPU, reported on a monthly or quarterly basis, using standardized criteria and training currently provided to hospitals that volunteer to participate in the Collaborative Alliance for Nursing Outcomes or the National Database of National Quality Indicators. Many hospitals already have a team perform periodic prevalence surveillance exams for HAPUs. Second, the new surveillance strategy must recognize and account for the differences in incidence of Early-Stage versus Advanced-Stage HAPUs. All HAPUs are not created equal with respect to preventability, morbidity to the patient, or the cost to heal. Finally, the HAPU measure should still be risk-adjusted when used to compare hospital performance, and we agree with the decision in September 201739 to update the PSI-3 software that is currently applied to administrative data to remove the exclusion of patients from HAPU measurement that had comorbid paralysis/plegias, spina bifida, anoxic brain injury, or major skin conditions. For future HAPU outcome measures, whether collected by chart-based surveillance or prevalence surveillance exams, we recommend these comorbidities that increase HAPU risk instead be accounted for by risk-adjustment when used to compare hospital performance.
CONCLUSION
Value-based purchasing programs that focus primarily on advanced-stage HAPUs using administrative data, particularly with exclusion of higher risk patients from measurement, have likely greatly underestimated HAPU incidence and the impact of Medicare programs on HAPU incidence over time. In contrast, estimates recently publicly reported using data from the Medicare Patient Safety Monitoring System have likely overestimated progress in HAPU prevention by not accounting for differences in incidence in Early-Stage versus Advanced-Stage HAPUs. Modifications in data collection techniques regarding pressure ulcers – including some that mirror changes occurring in recent years for hospital-acquired infection reporting – could improve detection and trending of HAPUs by severity, account for high risk comorbidities by risk-adjustment rather than exclusion from measurement, with potential to improve the validity of HAPU measures both as feedback to hospitals and to assess the clinical and financial impact of interventions upon HAPUs such as Medicare’s VBP programs.
Supplementary Material
References
- 1.Meddings J Using administrative discharge diagnoses to track hospital-acquired pressure ulcer incidence--limitations, links, and leaps. Jt Comm J Qual Patient Saf. 2015;41(6):243–5. [DOI] [PubMed] [Google Scholar]
- 2.Meddings J, Reichert H, Hofer T, McMahon LJ. Hospital report cards for hospital-acquired pressure ulcers: how good are the grades? Ann Intern Med. 2013;159(8):505–13. [DOI] [PMC free article] [PubMed] [Google Scholar]
- 3.Meddings J, Reichert H, Rogers MA, et al. Under Pressure: Financial Effect of the Hospital-Acquired Conditions Initiative-A Statewide Analysis of Pressure Ulcer Development and Payment. Journal of the American Geriatrics Society. 2015;63(7):1407–12. [DOI] [PMC free article] [PubMed] [Google Scholar]
- 4.National Pressure Ulcer Advisory Panel. http://www.npuap.org/national-pressure-ulcer-advisory-panel-npuap-announces-a-change-in-terminology-from-pressure-ulcer-to-pressure-injury-and-updates-the-stages-of-pressure-injury/. 2016. Accessed May 30, 2018.
- 5.Agency for Healthcare Research and Quality. Guide to Patient Safety Indicators (Version 3.0). 2006. https://qualityindicators.ahrq.gov/Downloads/Modules/PSI/V30/psiguidev30.pdf . Accessed June 5, 2017.
- 6.Classen DC, Munier W, Verzier N, et al. Measuring Patient Safety: The Medicare Patient Safety Monitoring System (Past, Present, and Future). Journal of patient safety. 2016. October 20;[Epub ahead of print]. [DOI] [PubMed] [Google Scholar]
- 7.Institute of Medicine. To Err Is Human: Building a Safer Health System. Washington, DC: The National Academies Press; 2000. [PubMed] [Google Scholar]
- 8.Berlowitz D, Lukas CV, Parker V, et al. Preventing pressure ulcers in hospitals: a toolkit for improving quality of care. Rockville, MD: Agency for Healthcare Research and Quality; 2014. https://www.ahrq.gov/professionals/systems/hospital/pressureulcertoolkit/index.html . Accessed June 5, 2017. [Google Scholar]
- 9.Centers for Medicare & Medicaid Services. ICD-10-CM Official Guidelines for Coding and Reporting: FY 2016. https://www.cms.gov/Medicare/Coding/ICD10/Downloads/2016-ICD-10-CM-Guidelines.pdf.2016. Accessed June 1, 2018.
- 10.Patient Protection and Affordable Care Act, S 3008: Payment adjustment for conditions acquired in hospitals. Pub L No. 111–148, 124 Stat 376–377. [Internet]. https://www.gpo.gov/fdsys/pkg/PLAW-111publ148/pdf/PLAW-111publ148.pdf . 2010. Accessed May 30, 2018.
- 11.Centers for Medicare & Medicaid Services. Hospital-Acquired Conditions. https://www.cms.gov/Medicare/Medicare-Fee-for-Service-Payment/HospitalAcqCond/Hospital-AcquiredConditions.html . 2015. Accessed May 30, 2018.
- 12.Centers for Medicare & Medicaid Services. Hospital-Acquired Condition Reduction Program (HACRP). https://www.cms.gov/Medicare/Medicare-Fee-for-Service-Payment/AcuteInpatientPPS/HAC-Reduction-Program.html. 2017. Accessed May 30, 2018. [DOI] [PubMed]
- 13.Centers for Medicare & Medicaid Services. CMS-1655-F; CMS-1664-F; CMS-1632-F2; CMS-1655-CN2: Final Rule and Correction Notice. https://www.cms.gov/Medicare/Medicare-Fee-for-Service-Payment/AcuteInpatientPPS/FY2017-IPPS-Final-Rule-Home-Page-Items/FY2017-IPPS-Final-Rule-Regulations.html?DLPage=1&DLEntries=10&DLSort=0&DLSortDir=ascending. 2017. Accessed May 30, 2018.
- 14.Agency for Healthcare Research and Quality. Patient Safety Indicator 03 (PSI 03) Pressure Ulcer Rate. Rockville, MD; 2017. https://www.qualityindicators.ahrq.gov/Downloads/Modules/PSI/V60-ICD09/TechSpecs/PSI03PressureUlcerRate.pdf . Accessed May 23, 2018.
- 15.Agency for Healthcare Research and Quality. Removal of v6.0 PSI Software Package from QualityIndicators.AHRQ.GOV: Replacement v6.0.2 PSI Software Package - Forthcoming. https://www.qualityindicators.ahrq.gov/News/PSIv6.0SASQIWinQIMemo.pdf . 2017. Accessed May 31, 2018.
- 16.Centers for Medicare & Medicaid Services. Hospital Value-Based Purchasing. https://www.cms.gov/Outreach-and-Education/Medicare-Learning-Network-MLN/MLNProducts/downloads/HospitalVBPurchasingFactSheetICN907664.pdf 2017. Accessed May 30, 2018.
- 17.To access the Appendix, click on the Appendix link in the box to the right of the article online.
- 18.Agency for Healthcare Research and Quality. Saving Lives and Saving Money: Hospital-Acquired Conditions Update. Interim Data from National Efforts to Make Care Safer, 2010–2014. Rockville, MD; 2015. https://www.ahrq.gov/professionals/quality-patient-safety/pfp/interimhacrate2014.html. Accessed January 3, 2017.
- 19.Agency for Healthcare Research and Quality. AHRQ National Scorecard on Rates of Hospital-Acquired Conditions. https://www.ahrq.gov/professionals/quality-patient-safety/pfp/index.html. 2016. Accessed June 5, 2017.
- 20.Agency for Healthcare Research and Quality. National Scorecard on Rates of Hospital-Acquired Conditions 2010 to 2015: Interim Data From National Efforts to Make Health Care Safer. https://www.ahrq.gov/sites/default/files/wysiwyg/professionals/quality-patient-safety/pfp/2015-natl-scorecard-hac-rates.pdf . 2016. Accessed June 5, 2017.
- 21.Hunt DR, Verzier N, Abend SL, et al. Advances in Patient Safety Fundamentals of Medicare Patient Safety Surveillance: Intent, Relevance, and Transparency In: Henriksen K, Battles JB, Marks ES, Lewin DI, editors. Advances in Patient Safety: From Research to Implementation (Volume 2: Concepts and Methodology). Rockville, MD: Agency for Healthcare Research and Quality; 2005. [PubMed] [Google Scholar]
- 22.Averill RF, Hughes JS, Fuller RL, Goldfield NI. Quality Improvement Initiatives Need Rigorous Evaluation: The Case of Pressure Ulcers. American journal of medical quality : the official journal of the American College of Medical Quality. 2017;32(5):552–5. [DOI] [PMC free article] [PubMed] [Google Scholar]
- 23.Coomer NM, McCall NT . Examination of the Accuracy of Coding Hospital-Acquired Pressure Ulcer Stages. Medicare & Medicaid Research Review. 2013;3(4):mmrr.003.04.b03. [DOI] [PMC free article] [PubMed] [Google Scholar]
- 24.Snow CL, Holtzman L, Waters H, et al. Accuracy of Coding in the Hospital Acquired Conditions-Present on Admission Program. Centers for Medicare & Medicaid Services; 2012. [Google Scholar]
- 25.Agency for Healthcare Research and Quality. Saving Lives and Saving Money: Hospital-Acquired Conditions Update. Final Data from National Efforts to Make Care Safer, 2010–2014. https://www.ahrq.gov/professionals/quality-patient-safety/pfp/2014-final.html . 2015. Accessed September 9, 2018.
- 26.Agency for Healthcare Research Quality. Methods To Estimate the Baseline 2010 PFP National Hospital-Acquired Condition Rate. http://www.ahrq.gov/professionals/quality-patient-safety/pfp/methods.html. 2010. Accessed September 9, 2018.
- 27.Agency for Healthcare Research Quality. Updated Information on the Annual Hospital-Acquired Condition Rate: 2011 and 2012. https://www.ahrq.gov/professionals/quality-patient-safety/pfp/hacrate2011-12.html. 2012. Accessed September 9, 2018.
- 28.Agency for Healthcare Research Quality. 2013 Annual Hospital-Acquired Condition Rate and Estimates of Cost Savings and Deaths Averted from 2010 to 2013. https://www.ahrq.gov/professionals/quality-patient-safety/pfp/hacrate2013-appendix.html . 2013. Accessed September 9, 2018.
- 29.Trueman P, Whitehead S. The economics of pressure relieving surfaces: an illustrative case study of the impact of high-specification surfaces on hospital finances. Int Wound J. 2010;7(1):48–54. [DOI] [PMC free article] [PubMed] [Google Scholar]
- 30.Pham B, Stern A, Chen W, et al. Preventing pressure ulcers in long-term care: a cost-effectiveness analysis. Arch Intern Med. 2011;171(20):1839–47. [DOI] [PubMed] [Google Scholar]
- 31.Padula W, Mishra M, Makic M, Sullivan P. Improving the quality of pressure ulcer care with prevention: a cost-effectiveness analysis. Med Care. 2011;49(4):385–92. [DOI] [PubMed] [Google Scholar]
- 32.Braden B Costs of Pressure Ulcer Prevention: Is it really cheaper than treatment? https://www.npuap.org/wp-content/uploads/2 012/01/Braden-NPUAP-cost-vs-prevention-final.pdf . 2012. Accessed May 31, 2018.
- 33.Xakellis G, Frantz R. The cost of healing pressure ulcers across multiple care settings. Adv Wound Care. 1996;9(6):18–22. [PubMed] [Google Scholar]
- 34.Rees R, Bashshur N. The effects of TeleWound management on use of service and financial outcomes. Telemed J E Health. 2007;13(6):633–74. [DOI] [PubMed] [Google Scholar]
- 35.Agency for Healthcare Research and Quality. Estimating the Additional Hospital Inpatient Cost and Mortality Associated With Selected Hospital-Acquired Conditions. https://www.ahrq.gov/professionals/quality-patient-safety/pfp/haccost2017.html. 2017. Accessed May 31, 2018.
- 36.Spector W, Limcangco R, Owens P, Steiner C. Marginal Hospital Cost of Surgery-related Hospital-acquired Pressure Ulcers. Med Care. 2016;54(9):845–51. [DOI] [PubMed] [Google Scholar]
- 37.Bauer K, Rock K, Nazzal M, Jones O, Qu W. Pressure Ulcers in the United States’ Inpatient Population From 2008 to 2012: Results of a Retrospective Nationwide Study. Ostomy Wound Manage. 2016;62(11):30–8. [PubMed] [Google Scholar]
- 38.Zhan C, Miller M. Excess length of stay, charges, and mortality attributable to medical injuries during hospitalization. JAMA. 2003;290(14):1868–74. [DOI] [PubMed] [Google Scholar]
- 39.Agency for Healthcare Research and Quality. Patient Safety Indicators (PSI) Log of ICD-9-CM, ICD-10/CMPC, And DRG Coding Updates And Revisions to PSI Documentation and Software Through Version v2018 ICD10-CM/PCS (Non-Risk Adjusted). https://www.qualityindicators.ahrq.gov/Downloads/Modules/PSI/V2018/ChangeLogPSIv2018.pdf . June 2 018.
Associated Data
This section collects any data citations, data availability statements, or supplementary materials included in this article.