Abstract
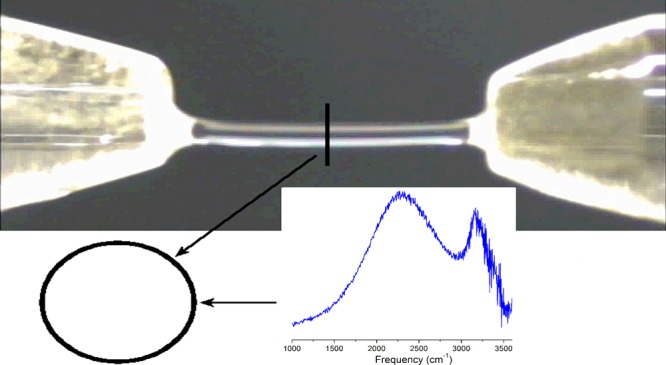
Excess proton structures in water remain unclear. The motion and nature of excess protons in water were probed using a supported water bridge structure in electric field (E) with an intensity of ∼106 V/m. The experimental setup generated protons that exhibit a long lifetime. The effect of excess protons in water induced a ∼3% variation in the pH for a 300 V overvoltage at the cathode. The current versus voltage curves show a current space-charge-limited operation. By measuring the space-charge distribution in both the cathode and anode and by adjusting the Mott–Gurney law to the measured excess hydrated proton current and the voltage drop in the cationic space-charge region, the protonic mobility was determined to be ∼200 × 10–8 m2/(V·s) (E ≈ 4 × 10⁶ V/m). This measured mobility, which is typically five times larger than the reported mobility for protons in water, is in agreement with the mechanism outlined by Grotthuss in 1805. The measured mid-Raman spectrum covering 1000–3800 cm–1 range indicates the species character. The hydrated excess proton spectral response through the mid-Raman at 1760 and 3200 cm–1 was attributed to the Zundel complex and the region at ∼2000 to ∼2600 cm–1 response is attributed to the Eigen complex, indicating a core structure simultaneously with a Eigen-like and Zundel-like character, suggesting a rapid fluctuation between these two structures or a new specie.
Introduction
In aqueous systems, transport of excess hydrated protons plays an important role in many chemical and biochemical processes.1 The large range of the measured vibrational energy of the observed hydrated proton arises from the large polarizability within the cation associated with the attraction of a bare proton to a water molecule. The surrounding water molecules fluctuating electric fields have a large effect on the proton vibrational levels, producing a continuum.2 The structural question related to the mechanism of the anomalously high mobility of protons in water has provided inspiration for various theories.3 The hydrated proton picture was defined in the 1960s by Eigen,4 who suggested a large complex H9O4+ arrangement. There has been a contrasting view that the hydrated proton is in fact H5O2+, the Zundel cation.4 Important pieces of evidence for the presence of these species have been found in the Raman spectra observed in our recent work.5 Experimental results correlating the Raman continuum frequencies to the Eigen and Zundel structures in the liquid phase are missing;6 therefore, we performed Raman spectroscopy to characterize the protonated water species in liquid water. Gas-phase studies of protonated water clusters,7−9 molecular dynamics simulations,10−13 and ab initio calculations14 have been recently performed.
Recent calculations15 using thousands of proton–water clusters were used to obtain a vibrational density of states and the infrared (IR) spectral density. They find that there is a wide distribution of vibrational frequencies within the region of 2000–2600 cm–1 for every local proton configuration mostly associated with the Eigen-like configuration. Local hydrogen-bonding structure and dynamics of aqueous systems have been probed by IR spectroscopy but remains difficult to assign.
Although the formation of a floating water bridge has been known for over 100 years,16−18 it was recently rediscussed by Fuchs et al.,19 in this work another configuration forming a supported water bridge is used to measure the motion of the excess protons. The preferential molecular orientations appear to be quite weak as demonstrated by the two-dimensional neutron diffraction studies of electrohydrodynamic (EHD) liquid bridges20 in the bulk, but the emergence of a proton interfacial layer anchors a collective vibrational mode.21 This behavior has already been observed in the ultrafast energy relaxation mechanism.22,23
Here, we report on the transport of excess protons in high electric fields. The process displays many unique characteristics because of the net positive charge defect that an excess proton creates,18,20,24,25 and the large vibrational Raman spectrum is presented as evidence for the presence of hydrated protons.
Raman spectrum of a floating water bridge covering 1000–3800 cm–1 range was measured. It is then possible in these measurements to clearly isolate the spectrum of the H(aq)+ cation from that of water solvent. In our previous work5 using floating water bridge arrangements where excess protons were present, the interfacial region showed the presence of both Zundel and Eigen species identified using the calculated spectra of Marx.1 The measured Raman spectrum partially matches the addition of the two spectra (Zundel and Eigen). However, recently, Stoyanov et al.26 showed that the structure of H+(H2O)n in liquid water is inconsistent with IR data, which they claim is associated with the O···O bond elongation, indicating ion pairing formed by cations such as Eigen H3O·3H2O+ or Zundel H5O2+ ions.
The space-charge distribution in highly purified water was previously investigated by Zahn and Takada.27 These authors used high-voltage electro-optic mapping that showed a field distortion because of excess charges and claimed that the effect may in part be due to electrodynamic convection, as observed for the parallel planes of ∼3 cm wide and ∼100 cm long electrodes. This convection was not explicitly considered in their analysis. Zahn and Takada27 also defined a temperature-dependent “proton mobility” for pure water by μ = μ0(1 + at), where μ0 is the proton mobility at 0 °C [24.9 × 10⁻⁸ m2/(V·s)], a is an ion-specific constant, equal to 1.83 × 10⁻³/°C, and t is the temperature in °C. Other reports have claimed that when high voltages are applied to liquids, an anomalously high “charge mobility” can be produced by EHD forces.28 Recently, Ostroumov,29 Stuetzer,30 and Felici31 equated the kinetic energy change in an electrohydrodynamically stressed liquid to the electrostatic energy change. More recently, Fuchs et al.32 calculated the mobility using this relation and the measured velocity in the water floating bridge using laser velocimetry.
Experimental Section
Space-Charge Distribution Measurements
Some of the essential features of the present experiment, in which horizontal water bridges were formed under high applied electric fields (∼106 V/m),33 are as follows: the supported bridge apparatus consisted of two beakers with attached capillaries, as shown in Figure 1. A bridge was formed between two glass capillaries with an internal diameter of 2 mm. The beakers were placed to ensure that the capillary tubes were aligned and in contact with one another in a three-dimensional translational stage by applying a high voltage between two platinum wire electrodes, with their lateral surfaces isolated and immersed in the liquid inside each beaker the bridge is formed. Two high-voltage dc power supplies were employed. The first supply produced a positive output voltage (Vmax ≈ 25 kV) depicted as configuration (a) in Figure 1, and the second supply generated a negative high voltage (Vmax ≈ −25 kV) shown as configuration (b). The negative terminal was grounded when using the positive power supply and the positive terminal was grounded when using the negative voltage power supply, as shown in Figure 1. The current source was formed by the power supplies in series with the high internal fluid resistance in the beakers. An analog voltmeter (SK-100, ICEL-KAISE, Brazil) was also used. The temperature was maintained at 25 °C in the two beakers containing Milli-Q water (18 MΩ·cm) by using a low current of ∼50 μA; for operation at 35 °C, a bridge current of ∼100 μA was responsible for the temperature increase.
Figure 1.
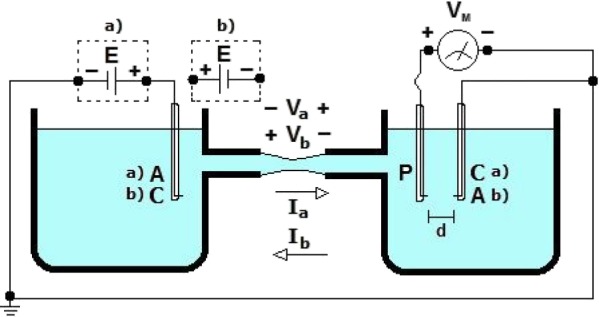
Schematic diagram of the circuit used to measure the space-charge region at the cathode indicated by circuit (a) and at the anode indicated by (b). Two power supplies were used: in configuration (a), the cathode is grounded, and in configuration (b), the anode is grounded.
The “floating water bridge” experiment was designed to better understand the interaction between water and the high electric fields produced by a high-voltage (20 kV) point electrode system. A floating water bridge forms when a high potential difference (kV/cm) is applied between two capillaries forming a free hanging water string through air connecting the two capillaries, Sir William Armstrong first reported this experiment in 1893.16
Vibrational Raman Spectroscopy Measurements
For our measurements of the vibrational Raman lines of water immersed in an electric field, we constructed a special setup consisting of a confocal Raman microscope (CRM), and the arrangement is shown in Figure 2. In this setup, water is submitted to an electric field (E ≈ 106 V/m) using the high-voltage point electrode system. The inhomogeneous electric field was produced using two Pt wire electrodes (Ø = 1 mm) forming a two-point electrode geometry. Milli-Q grade purified water (18.2 MΩ) was filled into a glass beaker (Ø = 18 mm, h = 16 mm), which was then placed in between the electrodes. Two Pt electrodes were embedded in an insulating poly(tetrafluoroethylene) (PTFE) cylindrical block (Ø = 35 mm, h = 18 mm) and connected to the high-voltage output of a dc power supply. A rigid PTFE constructed armature affixed the electrodes. Twenty milliliters of water was used for each measurement; this quantity brought the liquid surface to an ∼1 mm height above the top of the electrode surface, separated by ∼3 mm. The water was subjected to an electric field (E ≈ 106 V/m) using the high-voltage (3 kV) point electrode system, and the vibrational Raman mode spectrum was measured.
Figure 2.
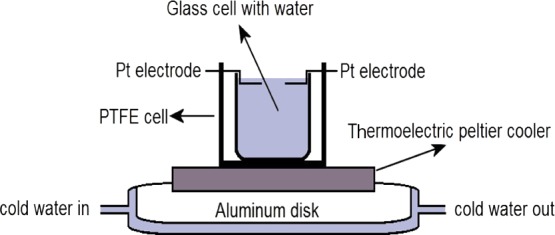
Schematic diagram of the apparatus used to measure the Raman spectra of water for various applied voltages to the Pt wire electrodes. The interfacial water structure was probed at the region between the electrodes.
The vibrational modes of water are Raman-active and can be accessed using a low-power laser. The Raman spectra of the water bridge structure were measured by passing a laser beam vertically down through the water surface and detecting the reflected scattering signal. The Raman spectra were recorded using a commercial CRM (CRM200, WiTec, Germany). A microscope objective Nikon lens (10×/0.25) with a focal length of 7 cm produced a 50 μm spot size radius on the water surface. The radiation spot was focused on the top surface by slowly focusing the microscope up and down and maximizing the detected signal. Excitation was accomplished with an argon-ion laser operating at 514 nm with ∼15 mW of plane-polarized radiation. The output beams were focused down and coupled to a monomode fiber. The output beam of the fiber was unpolarized radiation. Various spectra were recorded by changing the beam focus and the laser intensity.
Results and Discussion
The measured electrical characteristic of the water bridge is determined by mechanisms limiting the current in the bridge. The current versus voltage curves were measured for the supported liquid bridge that was formed when two glass capillaries were in contact; the two capillary tubes were then separated, and the open-circuit potential was measured to be V = VS, with I = 0. In this sequence, the tubes were first placed in contact so that V = 0 and I = IS = VS/R, where R is the total liquid resistance from the cathode to the anode. An increase in the voltage should induce a parallel shift in this line while maintaining the same slope −R. However, for potentials higher than ∼3 kV, the slope R decreases. This effect is illustrated in Figure 3, which compares the slope for an ∼2–3 kV potential (dashed line), which corresponds to the low-voltage case, with the slope for a 13 kV potential (solid line). There is a decrease in the bridge resistance with increasing voltage, from ∼295 × 106 Ω at 3.5 kV to ∼175 × 106 Ω at 13 kV, which is associated with a new dissociation process. The measured resistance at low voltages (<3 kV) is independent of the voltage and corresponds to the resistance of the water volume in the region between the cathode and anode electrodes. The electrodes are understood to be collecting and injecting electrons at the same rate, resulting in a reduction and oxidation balance occurring at the cathode and anode, respectively.
Figure 3.
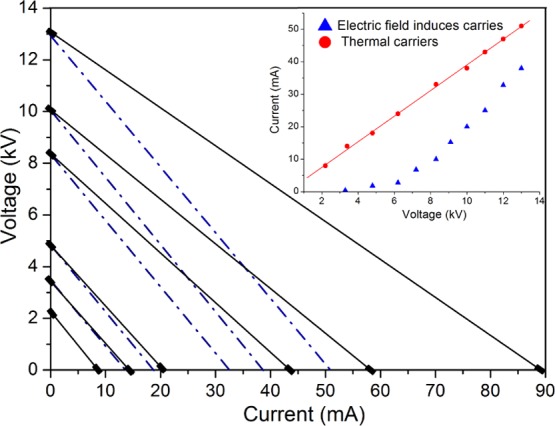
Applied voltage vs current curve measured using a supported bridge arrangement formed by two capillaries in contact. The open voltage is given by the intersection of the straight line with the vertical axis, and the short-circuit current is given by the intersection with the horizontal axis. The slope of the line for the high voltage is less than that for the low voltage. The low-voltage slope, corresponding to Vi = 3.5 kV, is indicated by a dashed line; for higher applied voltages: 5, 8.2, 10, and 13 kV, the slope is indicated by full lines. The measured values are indicated by ■. The inset shows the high-voltage dissociation current vs applied voltage by ▲ and the thermal carriers (OH– and H+) by ●.
In the inset of Figure 3, the high-voltage dissociation current at a given applied voltage was calculated by subtracting from the measured current, given in Figure 3, by the intersection of the solid line at the same applied voltage with the horizontal axis, the value indicated by the intersection of the dashed line, which corresponds to the slope measured for an applied voltage of 3 kV.
This new current component depicted in Figure 4 for various temperatures shows the same behavior as a space-charge-limited current operation, that is, a current proportional to the square of the applied voltage, which is expressed by the Mott–Gurney law derived in connection with current conduction in semiconductors and insulators.34 The space charge then controls the dissociation current amplitude and specifies the maximum current that can be collected at a given voltage.34 Each curve in Figure 4 represents an independent measurement performed at 25 or 35 °C. The curves indicated by ○, ▲, and ■ were adjusted to the Mott–Gurney equation and correspond to a maximum applied voltage of 13 kV measured at 25 °C, whereas the curve indicated by ● was measured at 35 °C with an applied voltage up to 16 kV. The adjusted Mott–Gurney expression is given by I = JA = I0(V – V0)2, where J is the current density, A is the electrode area, and the I0 and V0 values were determined by the fitting of the current expression to the experimental data. The calculated value of I0 is 0.31 ± 0.04 for water bridges operated at 25 °C, and I0 is ∼0.63 for water bridges operated at 35 °C, both with V0 = (3.75 ± 0.05) × 103. The dissociation current then shows a space-charge-limited operation, but because the water resistivity is 18 MΩ·cm, the dominant voltage drop in the bridge is Ohmic. To determine the components along the bridge structure associated with each contribution, that is, the Ohmic voltage and the space-charge potential drop, the voltage versus distance profiles at the electrodes were measured.
Figure 4.
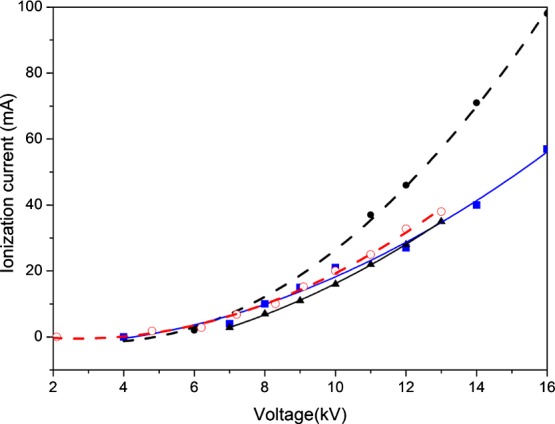
Excess protonic current vs voltage curves for bridges operated at 25 °C indicated by ○, ▲, and ■ and at 35 °C indicated by ●. The solid line is the fit to an expression of the Mott–Gurney law I = JA = I0(V – V0)2, where I is the high-voltage dissociation current, J is the current density, A is the electrode area, and I0 and V0 were determined by the fitting to the experimental data.
Two configurations with three electrodes (anode, cathode, and probe electrode indicated by ▶) were used to measure the potential distribution close to the electrodes, as shown schematically in the insets of Figures 5 and 6. The cathode spatial electrode distribution is shown in the inset of Figure 5. The probe electrode is grounded, so voltages could be measured up to 1000 V using a standard voltmeter. To probe the anode electrode voltage distribution, a negative high-voltage power supply was used and the anode electrode was grounded, as shown in the inset of Figure 6. The measured spatial distribution of the potential in the anode region is shown in Figure 6.
Figure 5.
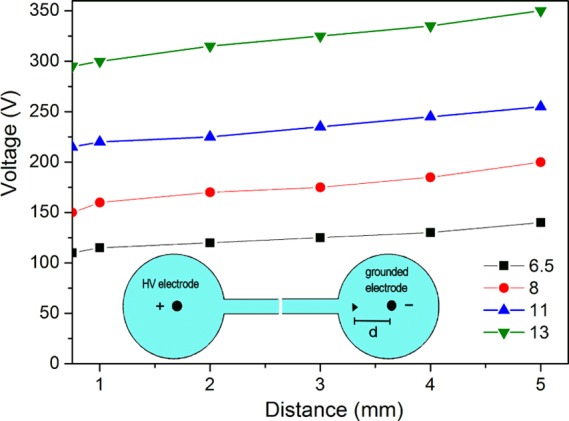
Cathode spatial voltage distribution as a function of the distance (d) to the electrode for various applied voltages (6.5, 8, 11, and 13 kV). A schematic diagram of the three-electrode measurement configuration is indicated in the lower inset; up to a distance of ∼1 mm from the cathode, there is an electric field of ∼4 × 10⁶ V/m, resulting in a voltage drop of ∼300 V (Vappl = 13 kV).
Figure 6.
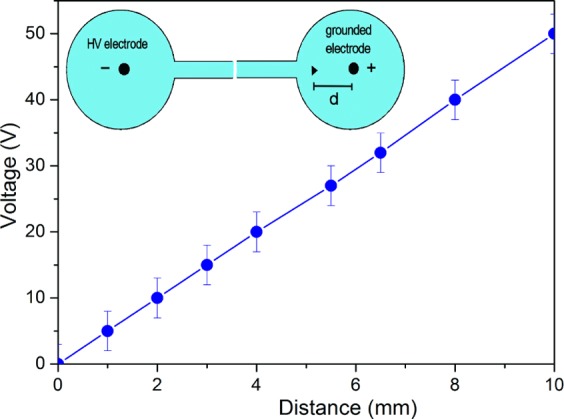
Anode spatial voltage distribution as a function of the distance (d) to the electrode for 13 kV applied voltage. A linear dependence of the voltage vs distance indicates an Ohmic drop component. The top inset shows the schematic diagram of the three-electrode configuration.
The measured spatial distributions of the potential in the cathode region are shown in Figure 5. Four spatial variations in the potential at the cathode surface are shown for various applied voltages (6.5, 8, 11, and 13 kV). There is a steady-state net positive space-charge layer that has a width of ∼0.8 × 10⁻⁴ m at the cathode region for a voltage drop of ∼300 V and an applied voltage of 13 kV. At the anode, there is no measurable space-charge region and the voltage profile only shows an IR component that increases linearly with the distance to the electrode.
The cathode fall region profile in high electric fields in a supported water bridge shows a net positive charge. While passing through the charged sheath, the excess protons show a current that is both mobility-limited and space-charge-limited.27 These measured space-charge arrangements correspond to a steady-state distribution, while Zahn and Takada27 have reported on a time-dependent charge arrangement. These authors showed that there is a space-charge region from excess charges at the anode that propagates into the water volume and forms a positive space-charge region at the cathode. Here, we have measured a low voltage drop at the positive electrode and a high drop at the negative electrode, which indicates a net positive space-charge distribution near the negative electrode (see the measured profile in Figure 5) and a zero space-charge voltage drop at the anode electrode (Figure 6). A unipolar drift of positive charges dominates the excess charge conduction.
By combining Poisson’s equation and Maxwell’s first equation, we obtain an expression for the current density j, where V is the voltage across the space-charge region, l is the space-charge region thickness, μ is the charge carrier mobility, ϵ is the water dielectric constant, and A is the electrode area. This expression corresponds to the Mott–Gurney law34
| 1 |
The protonic mobility given by eq 1 for a space-charge layer thickness of ∼0.8 × 10⁻⁴ m and an electric field strength of 4 × 10⁶ V/m is ∼200 × 10–8 m2/(V·s). This mobility is typically five times larger than the reported mobility for protons in water35 and is larger than the proton mobility of 93 × 10–8 m2/(V·s) measured by Fuchs32 for an average field strength of 3.5 × 10⁵ V/m. This value is in agreement with our previous work32 and others36 that have shown that these excess carriers are protons and protons move very fast in water as they propagate according to a mechanism outlined by De Grotthuss in 1805.37
The inset of Figure 3 shows a comparison of the excess proton current and the current associated with thermally generated ions. The molecular dissociation induced by the electric field current versus applied voltage is indicated by ▲, and the current generated by the thermal carriers is indicated by ●. The current associated with thermally dissociated ions for an applied voltage of 13 kV is ∼50 μA, whereas the current induced by the electric field is ∼35 μA. At 25 °C, the equilibrium constant of water is calculated by the product of the ion concentrations of [H3O+] and [OH–] and is equal to 10–14. The bracketed quantities are the concentrations in moles/liter. At equilibrium, each ion has an equal concentration of ∼10–7 mol/L, and the background charge density of each ion is ∼10 C/m3. The net charge density at the space-charge region was then calculated and compared to the charge density of the thermal carriers. In the previous paragraph, we calculated the excess proton mobility for a 300 V space-charge voltage. Then, using the calculated mobility and the dimensions of the space-charge volume, where I is its thickness and A is the area, we rewrite the expression of the injected current density as ρ = (I·l)/(μ·V·A), where I is the measured current and V is the space-charge voltage. The calculated value for the injected space density is ρ = 0.333 C/m3. This value is an insignificant fraction of the ∼10 C/m3 background thermally generated charges. Using Avogadro’s number (6.023 × 10²³ molecules/mol) and the charge per ion 1.602 × 10⁻¹⁹ C and converting cubic meter to liters, a concentration of 3.3 × 10⁻¹⁹ mol/liter is obtained, and the thermally generated charge concentration is 107 mol/liter. The value in the experimental setup reported by Zahn and Takada25 is ∼2 C/m3, and the value measured by Sammer et al.38 is ΔpH ≈ 0.1. Here, for a 300 V potential measured at the space-charge layer, there is an ∼3% variation in the pH induced by the excess protons.
Hydrated Excess Proton Raman Spectrum Measured in Floating Water Bridges
Sequential hop of an excess proton from one solvating water molecule to the next resulting in a high mobility, as reported in the previous paragraph, is the accepted aqueous proton-transfer mechanism, known as the Grotthuss mechanism.3 However, if the structure resembles the Eigen complex, H9O4+ or the Zundel complex, H5O2+ is still an open question. To help answer this question, an experiment that can identify these configurations in the liquid phase was performed such as measuring Raman vibrational spectrum of the excess hydrated proton species.
IR spectroscopy has proven to be particularly valuable for studying this phenomenon because of its sensitivity to hydrogen bonding. In strong acid solutions, the aqueous proton shows a continuum IR absorption spanning from <1000 to >3000 cm–1.39 Historically, analysis and discussion of the acid IR continuum and proton transport dynamics continue to be centered on two limiting structures: the H5O2+ Zundel ion and the solvated hydronium Eigen complex [H3O + (H2O)3].40,41
Other studies by applying IR techniques to H+(H2O)n in liquid water concluded that the structure of H+(H2O)n in liquid water is inconsistent with new IR and X-ray data26 and indicate a more extensive delocalization of positive charge in liquid water and that neither traditional Eigen nor Zundel structures are consistent with the data. Ion pairing is also more prevalent than previously believed.
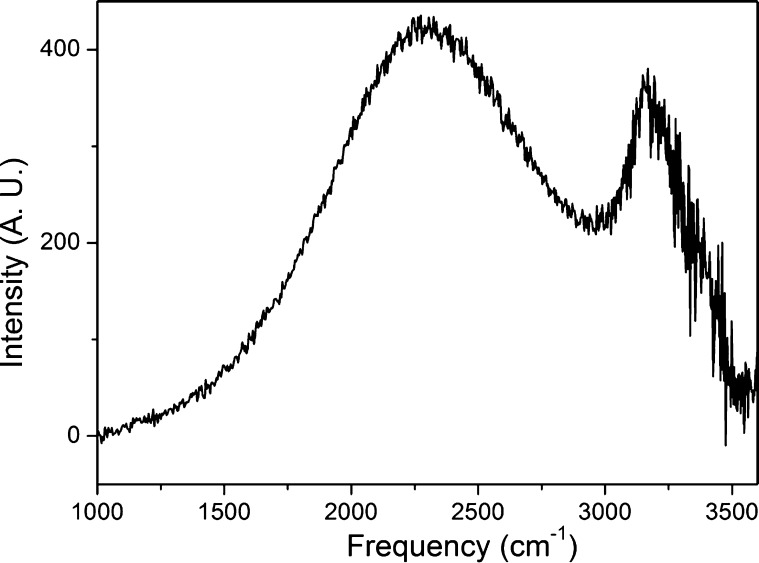
As the mid-Raman spectrum of the bulk aqueous acid is too diffuse6 to establish the roles of the Eigen (H9O4+) and Zundel (H5O2+) ion cores, a water bridge structure was used to measure the vibrational spectrum of the protonated water. Figure 7 shows the Raman spectrum indicated by a dashed line for water when the applied voltage was turned OFF. The spectrum for an applied voltage of 3 kV (E ≈ 106 V/m) is shown by the full line. In Figure 8, the difference between these two spectra is plotted. Following subtraction of the neat water spectrum, two distinct features are observed as an intense and large peak at 2250 cm–1 and a narrow peak at 3200 cm–1. The hydrated excess proton spectral response at 1760 and 3200 cm–1 was attributed to the Zundel complex and the region from 2000 to 2600 cm–1 response to the Eigen-like configuration.15
Figure 7.
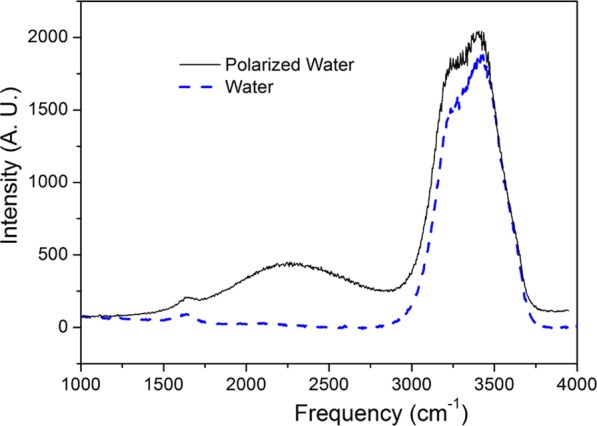
Raman spectra for water in the bridge structure. The full line indicates the spectrum for Vappl = 3 kV, and the dashed line shows the spectrum for Vappl = 0 V. The 3 kV dc voltage applied between the two pointed Pt electrodes (Ø ≈ 1 mm and separated by 3 mm) results in an electric field intensity of ∼106 V/m.
Figure 8.
Difference between the floating water bridge spectrum and the water spectrum shown in Figure 7. The resulting curve reflects the spectral Raman density contributions of hydrated excess protons.
To further clarify the interfacial water protonic conduction nature in the water bridge structure, the physical states of water and ice were compared by using their Raman vibrational spectra. The charge transport and self-dissociation in ice crystals are very incomplete,41 associated with many of the measurement difficulties; consequently, current versus voltage curves could not be obtained with sufficient accuracy. Initially, the temperature of water was decreased below the freezing point, and the ice modes were probed for an applied voltage of 3 kV (E = 106 V/m); then, the temperature was increased to 20 °C and the measurements were repeated. The measured spectral range from 1700 to 2800 cm–l is shown in Figure 9. The curves indicated by a dashed line show spectrum at −4 °C and by full line at −6 °C, observed at the top of the water surface where the electrodes are placed. The probing of the ice/air interface using vibrational Raman spectroscopy shows that the polymorphic ice at −4 and −6 °C does not present the broad vibrational band in the 1700–2800 cm–1 spectral region. The curves indicated by ○ correspond to the spectrum measured at 20 °C, and the curve indicated by △ was measured at 10 °C. The excess hydrated proton spectrum is clearly observed in liquid water. Therefore, apparently when the interfacial water structure changes from liquid water to ice, there is no formation of the structure observed in liquid.
Figure 9.
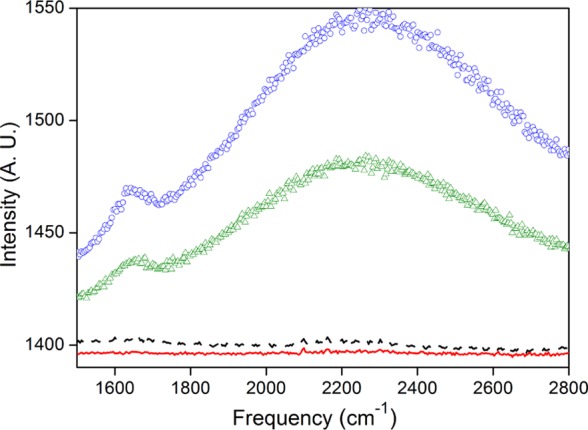
Vibrational Raman spectrum of water from 1700 to 2800 cm–1 measured at 20 °C indicated by ○, at 10 °C by △, at −4 °C by the dashed line, and at −6 °C by the full line.
Our experiments on water offer evidence for the presence of metastable complexes in liquid water. The percentage of the Eigen and Zundel complex in our experiment is determined by comparing the thermally generated current of (I ≈ 50 μA), with the current of the excess hydrated protons (I ≈ 35 μA) shown in Figure 3. In principle, our current assignments indicate three separated entities: the Eigen and Zundel cations and the thermally generated carriers.
Conclusions
The excess charge mobility was determined by measuring the I × V curves and the space-charge region profiles in supported water bridges. The measured space-charge profiles in Milli-Q water are not associated with the thermally ionized species but are associated with the hydrated excess protons. The Mott–Gurney equation was previously derived in connection with the conduction in semiconductors. Here, we have observed a space charge at the cathode electrode in liquid water for excess hydrated protons. For a 300 V potential measured at the space-charge layer, there is only an ∼3% variation in the pH induced by the excess protons. The measured mobility of 200 × 10–8 m2/V·s for these excess protons, which is typically five times larger than the reported mobility for protons in water, is in agreement with the mobility of hydrated protons that move fast in water because they propagate according to a mechanism outlined by De Grotthuss in 1805.37 The measured Raman continuum frequency spectrum indicates that the core structure has Eigen-like and Zundel-like characters, suggesting a rapid fluctuation between these two structures or a new specie.
The authors declare no competing financial interest.
References
- Marx D. Proton transfer 200 years after von Grotthuss: insights from ab initio simulations. ChemPhysChem 2006, 7, 1848–1870. 10.1002/cphc.200600128. [DOI] [PubMed] [Google Scholar]
- Zundel G.The Hydrogen Bond—Recent Developments in Theory and Experiments II; Schuster P., Zundel G., Sandorfy C., Eds.; North Holland: Amsterdam, 1976; pp 683–697. [Google Scholar]
- Agmon N. The Grotthuss Mechanism. Chem. Phys. Lett. 1995, 244, 456–462. 10.1016/0009-2614(95)00905-j. [DOI] [Google Scholar]
- Eigen M.; Kruse W.; Maass G.; De Maeyer L.. Progress in Reaction Kinetics; Porter G., Ed.; Pergamon: New York, 1964; Vol. 2; pp 285–318. [Google Scholar]
- Teschke O.; de Castro J. R.; Valente Filho J. F.; Soares D. M. Protonic charge defect structures in floating water bridges observed as Zundel and Eigen solvation arrangements. Chem. Phys. Lett. 2017, 685, 239–243. 10.1016/j.cplett.2017.07.063. [DOI] [Google Scholar]
- Thamer M.; De Marco L.; Ramasesha K.; Mandal A.; Tokmakoff A. Ultrafast 2D IR spectroscopy of the excess proton in liquid water. Science 2015, 350, 78–82. 10.1126/science.aab3908. [DOI] [PubMed] [Google Scholar]
- Asmis K. R.; Pivonka N. L.; Santambrogio G.; Brummer M.; Kaposta C.; Neumark D. M.; Woste L. Gas-Phase Infrared Spectrum of the Protonated Water Dimer. Science 2003, 299, 1375–1377. 10.1126/science.1081634. [DOI] [PubMed] [Google Scholar]
- Headrick J. M.; Diken E. G.; Walters R. S.; Hammer N. I.; Christie R. A.; Cui J.; Myshakin E.; Duncan M. A.; Johnson M. A.; Jordan K. D. Spectral signatures of hydrated proton vibrations in water clusters. Science 2005, 308, 1765–1769. 10.1126/science.1113094. [DOI] [PubMed] [Google Scholar]
- Guasco T. L.; Johnson M. A.; McCoy A. B. Unraveling Anharmonic Effects in the Vibrational Predissociation Spectra of H5O2+and Its Deuterated Analogues. J. Phys. Chem. A 2011, 115, 5847–5858. 10.1021/jp109999b. [DOI] [PubMed] [Google Scholar]
- Xu J.; Zhang Y.; Voth G. A. Infrared Spectrum of the Hydrated Proton in Water. J. Phys. Chem. Lett. 2011, 2, 81–86. 10.1021/jz101536b. [DOI] [PubMed] [Google Scholar]
- Park M.; Shin I.; Singh N. J.; Kim K. S. Eigen and Zundel forms of small protonated water clusters: structures and infrared spectra. J. Phys. Chem. A 2007, 111, 10692–10702. 10.1021/jp073912x. [DOI] [PubMed] [Google Scholar]
- Kim J.; Schmitt U. W.; Gruetzmacher J. A.; Voth G. A.; Scherer N. E. The vibrational spectrum of the hydrated proton: Comparison of experiment, simulation, and normal mode analysis. J. Chem. Phys. 2002, 116, 737–746. 10.1063/1.1423327. [DOI] [Google Scholar]
- Kulig W.; Agmon N. A ’clusters-in-liquid’ method for calculating infrared spectra identifies the proton-transfer mode in acidic aqueous solutions. Nat. Chem. 2013, 5, 29–35. 10.1038/nchem.1503. [DOI] [PubMed] [Google Scholar]
- Vendrell O.; Gatti F.; Meyer H.-D. Full dimensional (15-dimensional) quantum-dynamical simulation of the protonated water dimer. II. Infrared spectrum and vibrational dynamics. J. Chem. Phys. 2007, 127, 184303. 10.1063/1.2787596. [DOI] [PubMed] [Google Scholar]
- Biswas R.; Carpenter W.; Fournier J. A.; Voth G. A.; Tokmakoff A. IR spectral assignments for the hydrated excess proton in liquid water. J. Chem. Phys. 2017, 146, 154507. 10.1063/1.4980121. [DOI] [PubMed] [Google Scholar]
- Armstrong W. G. Electrical phenomena, The Newcastle Literary and Philosophical Society. The Electrical Engineer 1893, 10, 154–159. [Google Scholar]
- Fuchs E. Can a Century Old Experiment Reveal Hidden Properties of Water?. Water 2010, 2, 381–410. 10.3390/w2030381. [DOI] [Google Scholar]
- Marx D.; Tuckerman M. E.; Hutter J.; Parrinello M. The nature of the hydrated excess proton in water. Nature 1999, 397, 601–604. 10.1038/17579. [DOI] [Google Scholar]
- Fuchs E. C.; Baroni P.; Bitschnau B.; Noirez L. Two-dimensional neutron scattering in a floating heavy water bridge. J. Phys. D: Appl. Phys. 2010, 43, 105502. 10.1088/0022-3727/43/10/105502. [DOI] [Google Scholar]
- Swanson J. M. J.; Maupin C. M.; Chen H.; Petersen M. K.; Xu J.; Wu Y.; Voth G. A. Proton solvation and transport in aqueous and biomolecular systems: insights from computer simulations. J. Phys. Chem. B 2007, 111, 4300–4314. 10.1021/jp070104x. [DOI] [PMC free article] [PubMed] [Google Scholar]
- Timmer R. L. A.; Tielrooij K. J.; Bakker H. J. Vibrational Förster transfer to hydrated protons. J. Chem. Phys. 2010, 132, 194504. 10.1063/1.3432616. [DOI] [PubMed] [Google Scholar]
- Bakker H. J.; Skinner J. L. Vibrational spectroscopy as a probe of structure and dynamics in liquid water. Chem. Rev. 2010, 110, 1498–1517. 10.1021/cr9001879. [DOI] [PubMed] [Google Scholar]
- Ramasesha K.; De Marco L.; Mandal A.; Tokmakoff A. Water vibrations have strongly mixed intra- and intermolecular character. Nat. Chem. 2013, 5, 935–940. 10.1038/nchem.1757. [DOI] [PubMed] [Google Scholar]
- Wraight C. A. Chance and design-Proton transfer in water, channels and bioenergetic proteins. Biochim. Biophys. Acta, Bioenerg. 2006, 1757, 886–912. 10.1016/j.bbabio.2006.06.017. [DOI] [PubMed] [Google Scholar]
- Knight C.; Voth G. A. The curious case of the hydrated proton. Acc. Chem. Res. 2012, 45, 101–109. 10.1021/ar200140h. [DOI] [PubMed] [Google Scholar]
- Stoyanov E. S.; Stoyanova I. V.; Reed C. A. The unique nature of H+in water. Chem. Sci. 2011, 2, 462–472. 10.1039/c0sc00415d. [DOI] [Google Scholar]
- Zahn M.; Takada T. High voltage electric field and space-charge distributions in highly purified water. J. Appl. Phys. 1983, 54, 4762–4775. 10.1063/1.332810. [DOI] [Google Scholar]
- Wang H. T.; Cross J. D.. The interpretation of electrohydrodynamic mobility under unipolar injection in dielectric liquids. In Proceedings of the 3rd International Conference on Properties and Applications of Dielectric Materials, 1991; Vol. 1; pp 264–267.
- Ostroumov G. A. Hydrodynamics of Electrical Discharges. Zh. Tekh. Fiz. 1954, 24, 1915–1919. [Google Scholar]
- Stuetzer O. M. Magnetohydrodynamics and Electrohydrodynamics. Phys. Fluids 1962, 5, 534. 10.1063/1.1706654. [DOI] [Google Scholar]
- Felici N. J. Phenomenes hydro et aerodynamiques dans la conduction des dielectriques fluids. Rev. Gen. Electr. 1969, 78, 717–721. [Google Scholar]
- Fuchs E. C.; Bitschnau B.; Wexler A. D.; Woisetschläger J.; Freund F. T. A Quasi-elastic neutron scattering study of the dynamics of electrically constrained water. J. Phys. Chem. B 2015, 119, 15892–15900. 10.1021/acs.jpcb.5b10751. [DOI] [PubMed] [Google Scholar]
- Teschke O.; Soares D. M.; Filho J. F. V. Floating liquid bridge tensile behavior: Electric-field-induced Young’s modulus measurements. Appl. Phys. Lett. 2013, 103, 251608. 10.1063/1.4853955. [DOI] [Google Scholar]
- Mott N. F.; Gurney R. W.. Electronic Processes in Ionic Crystals, 2nd ed.; Dover Publication: USA, 1964; pp 132–154. [Google Scholar]
- Hamann C. H.; Hamnett A.; Vielstich W.. Electrochemistry, 2nd ed.; Wiley-VCH: Weinheim, 2007; pp 13–77. [Google Scholar]
- Piatkowski L.; Wexler A. D.; Fuchs E. C.; Schoenmaker H.; Bakker H. J. Ultrafast vibrational energy relaxation of the water bridge. Phys. Chem. Chem. Phys. 2012, 14, 6160–6164. 10.1039/c1cp22358e. [DOI] [PubMed] [Google Scholar]
- De Grotthuss C. J. T. Sur la decomposition de leau et des corps quelle tient en dissolution a laide de lelectricite galvanique. Ann. Chim. 1805, 58, 54–73. [Google Scholar]
- Sammer M.; Wexler A. D.; Kuntke P.; Wiltsche H.; Stanulewicz N.; Lankmayr E.; Woisetschläger J.; Fuchs E. C. Proton production, neutralisation and reduction in a floating water bridge. J. Phys. D: Appl. Phys. 2015, 48, 415501. 10.1088/0022-3727/48/41/415501. [DOI] [Google Scholar]
- Fournier J. A.; Carpenter W. B.; Lewis N. H. C.; Tokmakoff A. Broadband 2D IR spectroscopy reveals dominant asymmetric H5O2+ proton hydration structures in acid solutions. Nat. Chem. 2018, 10, 932–937. 10.1038/s41557-018-0091-y. [DOI] [PubMed] [Google Scholar]
- Wicke E.; Eigen M.; Ackermann T. Über den Zustand des Protons (Hydroniumions) in wäßriger Lösung*. Z. Phys. Chem. 1954, 1, 340–364. 10.1524/zpch.1954.1.5_6.340. [DOI] [Google Scholar]
- Eigen M.; de Maeyer L. Self-dissociation and protonic charge transport in water and ice. Proc. R. Soc. London 1958, 247, 505–533. 10.1098/rspa.1958.0208. [DOI] [Google Scholar]


