Abstract
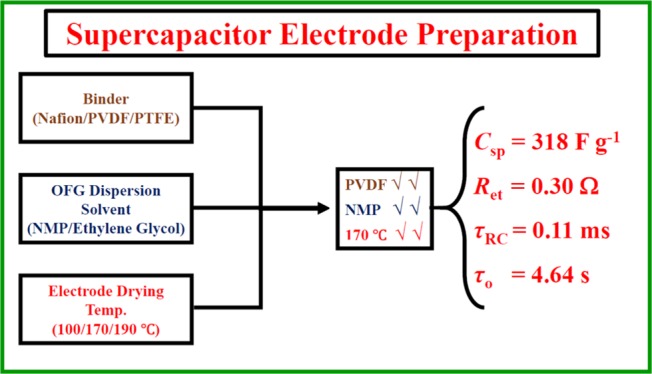
The work reported here aims toward the optimization of electrode preparation methodologies for superior performance of supercapacitors through a rigorous understanding of underlying physical parameters. Oxygen-functionalized few-layer graphene was employed as an active material while binders [Nafion, polyvinylidene fluoride (PVDF), and polytetrafluoroethylene], solvents for active material dispersion [ethylene glycol and N-methyl-2-pyrrolidone (NMP)], and electrode-drying temperatures (100, 170, and 190 °C) were varied. Maximum specific capacitances at different electrode preparation conditions ranged from 240 to 318 F g–1 at 1 mV s–1 scan rate of cyclic voltammetry for the same active material. The study revealed that the electrodes prepared using the PVDF binder, the NMP solvent for active material dispersion, 170 °C electrode-drying temperature (slightly below the boiling temperature of the solvent) provided the best electrochemical performance. Electrochemical impedance spectroscopy revealed that the resistance for electron transfer at the electrode/electrolyte interface can be minimized while mass transport and pseudocapacitive charging can be improved significantly by tuning electrode preparation methodologies which resulted in smaller time constants and hence better capacitor performances. Scanning electron microscopy images revealed that graphene layers were properly stacked much similar to the synthesized nanomaterial wherein better electrochemical performances were achieved, avoiding the agglomeration of nanomaterials on the electrode surface. Low viscosity of the solvent for active material dispersion and better solubility of the binder in the solvent helped to reduce the agglomeration of nanomaterials by minimizing the strong van der Waals interaction which causes agglomeration.
Introduction
Increasing energy demands impelled scientists to design efficient energy storage devices having superior power and energy densities. In this regard, supercapacitors display enticing energy storage properties such as high power density, rapid charging/discharging rates, and longer cyclic life in comparison with conventional batteries.1,2 Energy storage through the physical adsorption/desorption of electrolyte ions renders rapid charge/discharge rate and longer cycle life for supercapacitors.3 Thus, supercapacitors serve as one of the best alternative energy storage devices. They are classified into two categories, which are electrical double-layer capacitors (EDLCs) and pseudocapacitors. EDLCs store energy due to the electrolyte ion accumulation at the nanomaterial interface,4−6 whereas energy storage in pseudocapacitors is due to the faradaic redox reactions which occur at the electrode/electrolyte interface.7,8 Moreover, in the case of pseudocapacitors, only electron transfer takes place at the electrode/electrolyte interface and avoids any chemical reactions. Furthermore, energy storage in EDLCs is an electrostatic interaction in nature, whereas pseudocapacitance can be classified as an electron-transfer phenomenon. Different types of nanomaterials such as covalent organic frameworks,9,10 metal–organic frameworks,11 transition-metal oxides,12−14 conducting polymers,15 activated carbon, and16 graphene17−21 have been shown as electrode materials for supercapacitor applications. In this regard, high surface area, excellent electrical conductivity, superior thermal conductivity, and so forth made graphene an ideal supercapacitor material.18 However, for supercapacitor studies, different research groups employed different electrode preparation protocols and we envisioned that different methodologies could immensely affect the performance of supercapacitors because the morphology of nanomaterials can be altered during electrode preparation which may inhibit achieving the best electrochemical performance of a particular nanomaterial. In general, supercapacitor electrodes are prepared from a mixture of an active material and a polymeric binder which is deposited on the electrode by drop-casting the uniform mixture of an active material and a binder in a solvent, followed by drying in an oven at a particular temperature.
Herein, we report the supercapacitor performance of oxygen-functionalized few-layer graphene (OFG) as an active material at various electrode preparation conditions. Three types of binders [Nafion, polyvinylidene fluoride (PVDF), and polytetrafluoroethylene (PTFE)], two different solvents [ethylene glycol (EG) and N-methyl-2-pyrrolidone (NMP)] for OFG dispersion, and three drying temperatures (100, 170, and 190 °C) were used to optimize the electrode preparation methodology. Electrode preparation methodology for the supercapacitor performance of OFG has been optimized utilizing the results obtained from cyclic voltammetry (CV), galvanostatic charge/discharge, electrochemical impedance spectroscopy (EIS), scanning electron microscopy (SEM) experiments, and a rigorous analysis of physical parameters.
Experimental Section
Chemicals and Electrodes
Nafion, PVDF, PTFE, NMP, and EG were purchased from Sigma-Aldrich. Sulfuric acid (H2SO4) was purchased from Sigma-Aldrich. Platinum (Pt) foil and Pt wire were purchased from Alfa Aesar. A standard calomel electrode (SCE) was purchased from CH Instruments, TX, USA. The chemicals were used without any further purification. Milli-Q water was used throughout the experiments.
Synthesis of OFG
OFG was synthesized in two steps following a reported method.20 Briefly, in the first step, graphite was oxidized to graphite oxide (GO) by a modified Hummers’ method,22,23 and in the second step, GO was reduced by formic acid at 160 °C to synthesize OFG.19,20 The Brunauer–Emmett–Teller surface area of OFG was 240 m2 g–1, having a pore radius of 1.8–2.1 nm.20 Oxygen content in the material was 19% (atomic percentage) wherein hydroxyl, carbonyl, and acid functionalities were 11, 4, and 4%, respectively.20
Electrode Fabrication
In this work, electrodes were fabricated using different methodologies to investigate the physical parameters that influence the performance of supercapacitors. OFGs with a binder coated on Pt foils were used as working electrodes. A series of electrodes were fabricated using different binders (Nafion/PVDF/PTFE) and different solvents (EG/NMP) for OFG dispersion at varied drying temperatures (100, 170, and 190 °C). The active material (6 mg) (OFG) and 1 mg of the binder (Nafion/PVDF/PTFE) were dispersed in 1 mL of solvent (EG or NMP). The solution mixture was stirred vigorously for 6 h to impart homogeneity. After that, 100 μL of an aliquot of the solution mixture was drop-casted on a Pt foil electrode in an area of 1 cm2. Total mass loading on each electrode was 0.6 mg/cm2. Then, the electrodes were dried in an oven for approximately 20 h at a specific drying temperature (100/170/190 °C). The purpose of the binder is to keep the active material attached on the electrode in the electrolyte solution. The dried electrodes were used for electrochemical characterization.
Electrochemical Experiments
All electrochemical characterizations were performed on a biopotentiostat (model CHI 760D) and a potentiostat (model CHI 620E) (CH Instruments, Austin, TX). A regular three-electrode setup comprising saturated calomel electrode (SCE), Pt wire, and OFG coated on Pt foil was used as reference, counter, and working electrodes, respectively. All experiments were carried out at room temperature in ambient condition with aqueous 2 M H2SO4 electrolyte. CV experiments were carried out in a potential window of 1 V at different scan rates (1, 2, 5, 10, 20, 50, and 100 mV s–1). Galvanostatic charge/discharge studies were also performed in a potential window of 1 V at different current densities (0.5, 1, 2, 5, and 10 A g–1). EIS experiments were obtained at a potential of 0.4 V versus SCE with a 10 mV amplitude and a frequency ranging from 10 kHz to 0.01 Hz. It is important to note that 0.4 V is the formal potential for the redox peak observed (vide infra) and the origin of this redox peak is presumably due to the presence of hydroxyl functionalities on the sheet edges of graphene.19,20 Capacitance (C) values from CV curves were calculated using eq 1, wherein C, I, ν, and E denote the capacitance, the current, the scan rate, and the potential range, respectively. The numerator ∫I dE was obtained by calculating the areas obtained from CV curves. Similarly, capacitances from the galvanostatic charge/discharge experiments were calculated from eq 2. In eq 2, t is the time taken for the charge/discharge process. Finally, specific capacitance (Csp) values were obtained by dividing the capacitance values with the mass of the active material deposited on the electrodes.
| 1 |
| 2 |
Scanning Electron Microscopy
For SEM studies, the prepared electrodes were directly placed on a conductive carbon tape and sputter-coated with gold for 2 min. Experiments were done using a Carl Zeiss (ULTRA Plus) FE-SEM at a working voltage of 20 kV. SEM image was also taken for the as-prepared OFG, wherein the dried nanomaterial was spread over a carbon tape and gold-coated for 120 s.
Results and Discussion
SEM Image Comparison for Electrodes Prepared with Different Binders
The SEM image of the as-prepared OFG is shown in Figure 1a which revealed the stacked layered structure of the as-synthesized nanomaterial.20The SEM images of the electrodes prepared using three different binders (Nafion, PVDF, and PTFE) are shown in Figure 1b–d, wherein EG was used as a solvent for OFG dispersion and the electrodes were dried at 170 °C. Figure 1b shows that when Nafion was used as a binder, the distribution of OFG was not uniform on the electrode and significant agglomeration was visible in comparison to the as-synthesized OFG (Figure 1a). On the other hand, the PVDF binder resulted in a better morphology wherein entangled layered stacking was visible (Figure 1c), much similar to the prepared OFG, which may provide better access of electrolyte ions inside the nanomaterial toward the enhancement of specific capacitance. Figure 1d highlights that when PTFE was used as a binder, although sharp edges were detectable, agglomeration of layered stacks was visible which could inhibit the diffusion of electrolyte ions inside the pores in comparison to PVDF. Low-resolution SEM images at the same electrode preparation conditions are shown in Figure S1.
Figure 1.
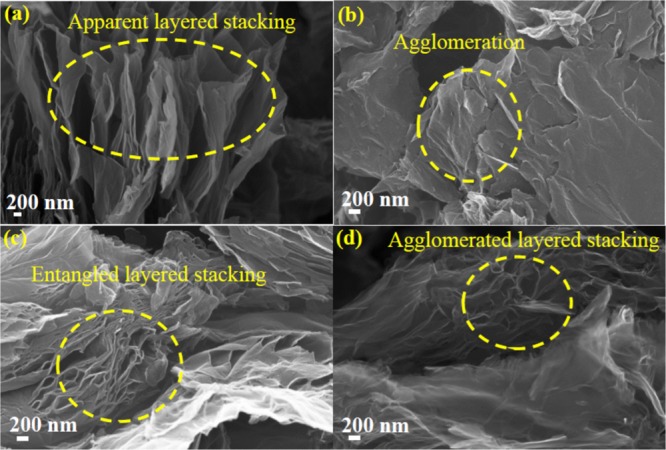
(a) SEM image of the as-synthesized OFG. SEM images of OFG as an active material on Pt electrodes having different binders: (b) Nafion, (c) PVDF, and (d) PTFE. The electrodes were prepared with EG as a solvent for OFG dispersion, and the electrodes were dried at 170 °C.
SEM Image Comparison of Electrodes Prepared in Different Solvents for OFG Dispersion
Electrodes prepared using different binders demonstrated that PVDF provided the most uniform morphology; hence, PVDF was chosen as a default binder while solvents for OFG dispersion were varied and the electrodes were dried at 170 °C. Figure 2a shows that the NMP solvent provided excellent stacked graphene layers which were comparable with the as-synthesized OFG (Figure 1a). Furthermore, prominent sharp edges were also noticeable. Figure 2b shows that the EG solvent also resulted in layered stacking, albeit the layers were entangled, which could restrict the electrolyte ion diffusion inside the pores. Low-resolution SEM images at the same electrode preparation conditions are shown in Figure S2.
Figure 2.
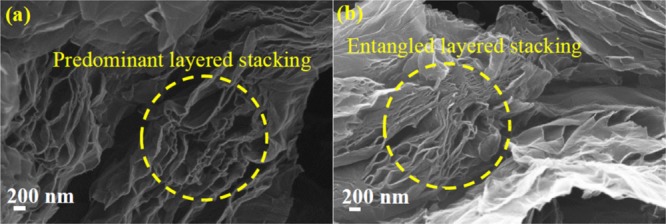
SEM images of OFG as an active material on Pt electrodes prepared using the PVDF binder in different solvents for OFG dispersion: (a) NMP and (b) EG. The electrodes were dried at 170 °C.
SEM Image Comparison of Electrodes Dried at Different Temperatures
The PVDF binder and the NMP solvent for OFG dispersion provided a better morphology on Pt electrodes, and hence these two conditions were chosen while electrode-drying temperatures were varied. At 100 °C drying temperature, slight agglomerations of graphene layers were observed which may inhibit electrolyte accessibility (Figure 3a). However, the electrode dried at 170 °C resulted in an excellent stacking of graphene layers (Figure 3b), whereas the electrode dried at 190 °C resulted in a severe agglomeration which could be due to the rapid evaporation of the solvent (Figure 3c). It is important to mention that the boiling point of NMP is 202 °C, and these results suggest that the electrodes dried at a temperature very close to the boiling point could be detrimental. Low-resolution SEM images at the same electrode preparation conditions are shown in Figure S3.
Figure 3.
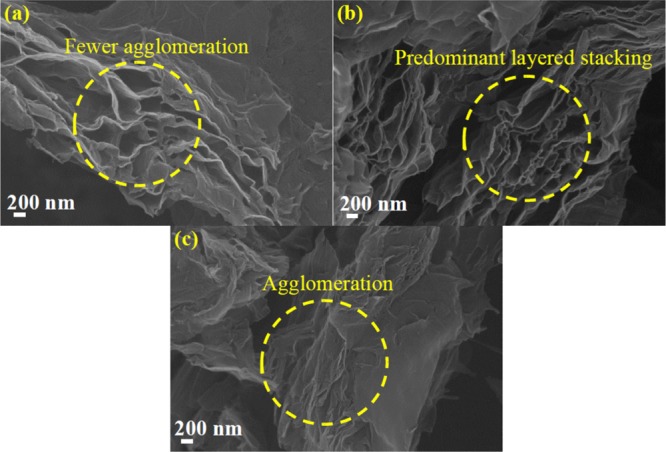
SEM images of OFG as an active material on Pt electrodes prepared at different drying temperatures: (a) 100, (b) 170, and (c) 190 °C. The electrodes were prepared using the PVDF binder and the NMP solvent for OFG dispersion.
In summary, the SEM results indicated that PVDF, NMP, and 170 °C were the best binder, good solvent for OFG dispersion, and best electrode-drying temperature, respectively. In the next few sections, we discuss the electrochemical results and unravel the connectivity between SEM and electrochemistry.
Electrochemical Results
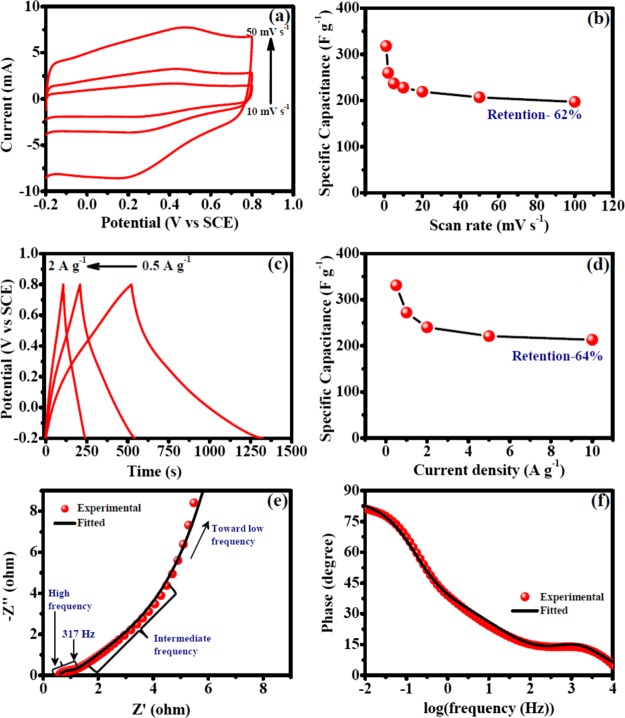
Electrochemical measurements were performed to investigate the supercapacitor performances of different electrodes. As an example, electrodes prepared using the PVDF binder, NMP as a solvent for OFG dispersion, and 170 °C electrode-drying temperature have been discussed rigorously in this section, and this experimental condition also provided the best supercapacitor performance (vide infra). CV experiments furnish relevant information regarding the charge/discharge behavior. An ideal double-layer capacitor shows a rectangular CV curve wherein the current rapidly rises to reach a plateau value within few millivolts of applied potential which indicates a fast charging behavior,24 whereas a faradaic process exhibits peaks in CV due to the electron transfer across the electrode/electrolyte interface.25Figure 4a shows rectangular CV curves for OFG which was due to the fast adsorption/desorption of electrolyte ions and hydroxyl functionalities present on the sheet edges of graphene, resulted in a modest faradaic peak.19,20 Specific capacitances were calculated from the CV curves using eq 1, and the values ranged from 318 to 197 F g–1 (Table 1). The specific capacitance values increased at slower scan rates because more electrolyte ions can percolate inside the pores of the electrode at a longer time scale (Figure 4b and Table 1). To further verify the electrochemical performances, galvanostatic charge/discharge experiments were performed and the obtained results were in agreement with those of CV wherein the specific capacitance values ranged from 331 to 213 F g–1 (Figure 4c and Table 1). The charge/discharge curves were symmetrical, with a good linear relationship behavior, a characteristic of the capacitive behavior (Figure 4c). Similar to CV, the specific capacitance values dropped at a higher current density because of the less diffusion of electrolyte ions at a faster time scale (Table 1). Retentions of specific capacitances with increasing scan rate of voltammetry and current densities were 62 and 64%, respectively (Figure 4b,d and Table 1). In a long-term cyclic test, 100% specific capacitance retention was observed after 5000 cycles, indicating the superior stability of OFG as a supercapacitor (Figure S4).
Figure 4.
Electrochemical performances of OFG as an active material with the PVDF binder and the NMP solvent for OFG dispersion while the electrodes were dried at 170 °C. (a) CV curves at different scan rates (10, 20, and 50 mV s–1). (b) Specific capacitance dependence on the scan rates of voltammetry. (c) Galvanostatic charge/discharge experiments at different current densities (0.5, 1, and 2 A g–1). (d) Specific capacitance dependence on current densities. (e) Nyquist plot of EIS results collected at 0.4 V vs SCE. (f) Bode plot (phase angle vs log frequency) of the EIS experiment.
Table 1. Specific Capacitances of OFG at Different Scan Rates of CV and Current Densities of Galvanostatic Charge/Discharge Experiments Wherein the Electrodes Were Prepared with the PVDF Binder and NMP Was Used for OFG Dispersiona.
| scan rate (mV s–1) | specific capacitance (F g–1) | current density (A g–1) | specific capacitance (F g–1) |
|---|---|---|---|
| 100 | 197 | ||
| 50 | 207 | ||
| 20 | 219 | 10 | 213 |
| 10 | 228 | 5 | 221 |
| 5 | 237 | 2 | 240 |
| 2 | 260 | 1 | 272 |
| 1 | 318 | 0.5 | 331 |
| retention | 62% | retention | 64% |
Electrodes were dried at 170 °C.
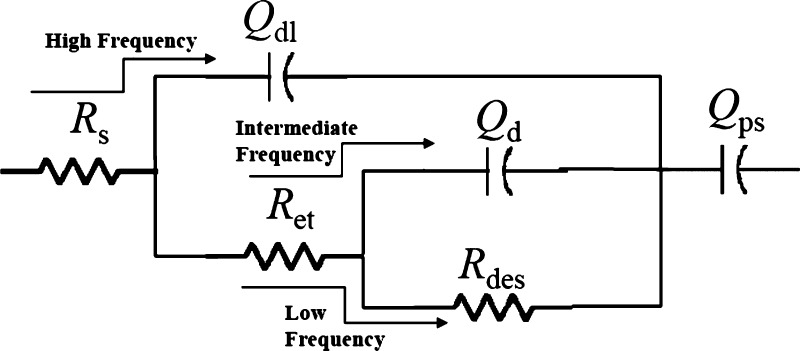
EIS results provide in-depth insights of physical parameters such as diffusion kinetics of the electrolyte inside the nanomaterials, electron-transfer resistance at the electrode/electrolyte interface, and double-layer charging at the electrode/electrolyte interface.26 In a Nyquist plot, imaginary component of impedance (Z″) is plotted against real component of impedance (Z′) (Figure 4e), whereas in a Bode plot, phase angle is plotted against log(frequency) (Figure 4f). The impedance characteristics of a supercapacitor swing in between a pure resistor (phase angle 0°) and a pure capacitor (phase angle 90°). At high frequencies, the electrochemical system behaves like a pure resistor because capacitance is inversely proportional to the frequency which causes a near-zero impedance for a capacitor. Intermediate-frequency regions are affected by physical parameters such as porosity, morphology, thickness of the nanomaterials deposited on the electrode, etc., which affects the diffusion of electrolyte ions from the electrolyte to inside the nanomaterials, and in low frequencies, it behaves like a capacitor.27 A semicircle is usually observed in the high-frequency region of Nyquist plot (Figure 4e), and the diameter of the semicircle on the real axis provides the resistance toward electron transfer at the electrode/electrolyte interface (Ret) which was found to be 0.3 Ω (Table 2). The plot displayed a sharp rise of impedance parallel to the Z″ axis in the intermediate-frequency region, representing an excellent capacitive behavior (Figure 4e). The intersection of the straight line observed in the intermediate-frequency region with the high-frequency regime provides the “knee frequency” which is attributed as the starting frequency at which the diffusion of electrolyte begin because at high frequencies, the time scale is too short for diffusion to occur.16 Beyond the knee frequency, the electrodes predominantly behave like capacitors and contribution toward the specific capacitance is maximum in this time frame.28 The knee frequency in this specific case was found to be 317 Hz, and the high value implies the faster diffusion of electrolyte ions inside the nanomaterials. The highest phase angle value was 81.2° (close to 90°), indicating an excellent capacitive behavior (Figure 4f). EIS results were further analyzed utilizing an equivalent circuit model (Figure 5), and the results are summarized in Table 2. The solution resistance (Rs) has been placed in series with all other circuit elements because the current passes through the electrolyte solution at all frequencies. A constant phase element (CPE, Qdl) was used to represent double-layer charging just at the electrode/electrolyte interface at a very fast time scale (Figure 5). A CPE has been used instead of a capacitor presumably because of the inhomogeneity or roughness of the interface.29 At the high-frequency region, the current flows through Qdl after passing through Rs. As the frequency decreases, the impedance offered by Qdl increases rapidly, and hence at the intermediate-frequency region, the current passes through Ret and diffusion capacitance (Qd) which represents the capacitance obtained due to the diffusion of electrolyte ions inside the pores of the nanomaterials (Figure 5). Rdes represents the resistance for ion desorption from the nanomaterials, and for a good supercapacitor material, a high value of this parameter is desirable. In the low-frequency region, the current passes through Rdes because Qd offers very high impedance. Finally, the current passes through Qps which represents pseudocapacitive charging, that is, the passage of electrons inside the nanomaterial.
Table 2. Equivalent Circuit Parameters of OFG for Electrodes Prepared with the PVDF Binder and the NMP Solvent Used for OFG Dispersiona.
| Rs (Ω) | Qdl × 10–3 (F s(a1–1)) | a1 | Ret (Ω) | Rdes (Ω) | Qd (F s(a2–1)) | a2 | Qps (F s(a3–1)) | a3 | τRC (ms) |
|---|---|---|---|---|---|---|---|---|---|
| 0.59 | 0.3 | 0.95 | 0.30 | 10.9 | 0.11 | 0.45 | 0.12 | 0.97 | 0.11 |
Electrodes were dried at 170 °C.
Figure 5.
Equivalent circuit model used for the analysis of EIS results.
To further analyze EIS results, RC time constants (τRC) were calculated using the following formula: τRC = Rs × Cdl, wherein Cdl represents the double-layer capacitance at the electrode/electrolyte interface at a very fast time scale. Cdl was calculated from the value of Qdl utilizing the following equation: Cdl = Qdl × (ω)(a1–1), wherein the ω value was taken where imaginary component of impedance was maximum in the high-frequency semicircle region.
To gain further insights, complex capacitance calculations were performed. The complex capacitance (C(ω)) is defined by eq 3a, wherein C′(ω) and C″(ω) represent the real and imaginary parts of complex capacitances and are further defined by eqs 3b and 3c, respectively.30
| 3a |
| 3b |
| 3c |
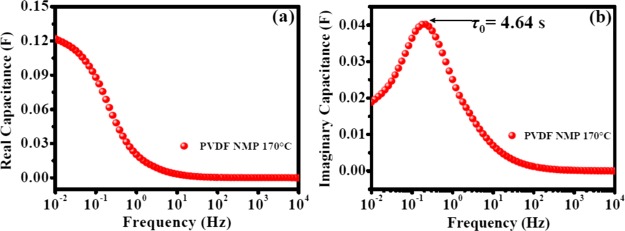
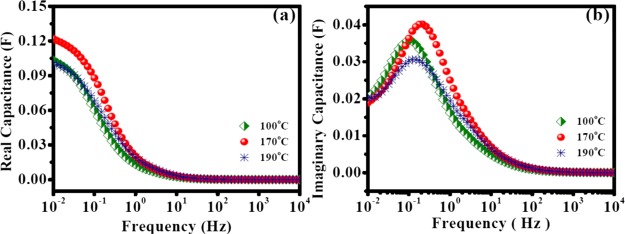
Figure 6a shows the real part of capacitance (C′(ω)) change versus frequency. The variation of capacitance with the frequency portrays electrolyte ion penetration inside the pores of nanomaterials at a particular frequency. At lower frequencies, the electrolyte ions can access the pores deep inside the nanomaterial and hence C′(ω) increases. However, at high frequencies, the electrolyte ions can only access the surface of the pores and hence C′(ω) decreases. At very high frequencies, it behaves like a resistor and C′(ω) becomes independent of frequency. The value of real part of capacitance at low frequencies is a measure of capacitance stored in the system. Figure 6b shows the change in C″(ω) with frequency. C″(ω) attains a maximum at a frequency f0. The inverse of this frequency provides the dielectric relaxation time constant (τo) for the whole system. Nearly half of the low-frequency capacitance for the whole system is attained at τo, and the value was found to be 4.64 s in this study. This parameter is also referred to as the supercapacitor factor of merit.30
Figure 6.
(a) Real part of complex capacitance (C′(ω)) vs frequency and (b) imaginary part of complex capacitance (C″(ω)) vs frequency for OFG wherein the electrodes were prepared with the PVDF binder and NMP as a solvent for OFG dispersion. The electrodes were dried at 170 °C.
Electrochemical Performance Comparison for Electrodes Prepared with Different Binders
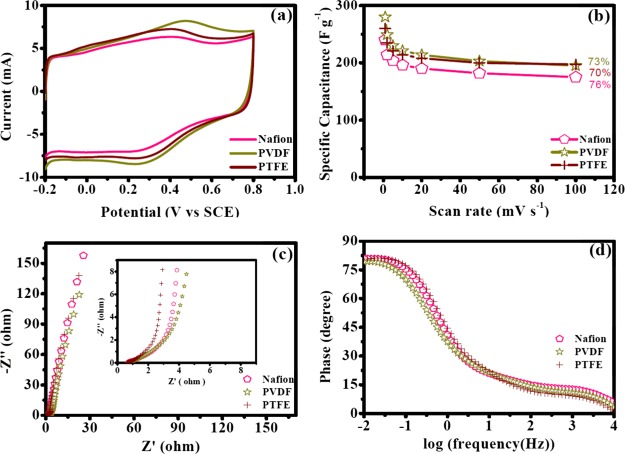
The impact of binders on supercapacitor performance has been discussed in this section. Herein, binders (Nafion, PVDF, and PTFE) for electrode preparation were varied while the solvent for OFG dispersion was EG and the electrodes were dried at 170 °C. Figure 7a shows the representative CV curves at a scan rate of 50 mV s–1 for electrodes having different binders, and they were predominantly rectangular in shape, where faradaic peaks were most pronounced for electrodes prepared with the PVDF binder, followed by PTFE and Nafion. The specific capacitance obtained from the CV curves followed the following trend: PVDF > PTFE > Nafion (Table 3 and Figure 7a,b). Maximum specific capacitances obtained for PVDF, PTFE, and Nafion binders were 280, 260, and 240 F g–1, respectively. Galvanostatic charge/discharge experiments also revealed a similar trend (Figure S5 and Table S1), and the results obtained from these two electrochemical techniques were in agreement with each other (Tables 3 and S1). Retentions of specific capacitances with increasing scan rates of CV were similar for different binders (Figure 7b). Figure 7c shows comparative Nyquist plots for the three binders. The vertical rise in the low-frequency regime was steeper in the case of PVDF compared to PTFE and Nafion, highlighting that PVDF shows a better capacitive behavior. Ret values for PVDF, PTFE, and Nafion were 0.4, 0.45, and 0.6 Ω, respectively, suggesting the ease of electron transfer at the electrode/electrolyte interface trend as PVDF > PTFE > Nafion (Table 4).
Figure 7.
Electrochemical performance of OFG with different binders (Nafion, PVDF, and PTFE) while EG was used as a solvent for OFG dispersion and the electrodes were dried at 170 °C. (a) CV curves at a scan rate of 50 mV s–1. (b) Specific capacitance dependence on the scan rates of voltammetry. (c) Nyquist plots of EIS results collected at 0.4 V vs SCE (inset: high-frequency region). (d) Bode plot (phase angle vs log frequency) of EIS experiments.
Table 3. Specific Capacitance Values (F g–1) of OFG at Different Scan Rates of Voltammetry for Electrodes Prepared Using Different Binders in the EG Solvent and at the Electrode-Drying Temperature of 170 °C.
| scan rate (mV s–1) | Nafion | PVDF | PTFE |
|---|---|---|---|
| 100 | 175 | 195 | 197 |
| 50 | 182 | 203 | 200 |
| 20 | 190 | 214 | 208 |
| 10 | 196 | 221 | 214 |
| 5 | 204 | 230 | 221 |
| 2 | 214 | 249 | 235 |
| 1 | 240 | 280 | 260 |
| retention | 73% | 70% | 76% |
Table 4. Equivalent Circuit Parameters of OFG for Electrodes Prepared Using Different Binders While EG Was Used as a Solvent for OFG Dispersion and the Electrodes Were Dried at 170 °C.
| binder | Rs (Ω) | Qdl × 10–3 (F s(a1–1)) | a1 | Ret (Ω) | Rdes (Ω) | Qd (F s(a2–1)) | a2 | Qps (F s(a3–1)) | a3 | τRC (ms) |
|---|---|---|---|---|---|---|---|---|---|---|
| Nafion | 0.65 | 3.2 | 0.74 | 0.60 | 2.0 | 0.06 | 0.60 | 0.08 | 0.92 | 0.38 |
| PVDF | 0.62 | 1.8 | 0.85 | 0.40 | 5.6 | 0.10 | 0.52 | 0.10 | 0.94 | 0.29 |
| PTFE | 0.63 | 4.0 | 0.80 | 0.45 | 1.5 | 0.09 | 0.70 | 0.09 | 0.93 | 0.49 |
EIS analysis further suggests that pseudocapacitive charging (Qps) which represents electron transfer inside the nanomaterial was faster for PVDF and the trend PVDF > PTFE > Nafion (Table 4). Knee frequencies were 175, 67, and 121 Hz for PVDF, PTFE, and Nafion, respectively. These values also suggest the ease of mass transport inside the nanomaterial for electrodes prepared with the PVDF binder. The Bode plot demonstrates that the slope for transition from a resistor (high-frequency region) to a capacitor (low-frequency region) was shallow for PVDF compared to those of PTFE and Nafion, presumably because of the enhanced faradaic charge storage mechanism (Figure 7d). Furthermore, for the PVDF binder, in the low-frequency region, phase angles continued to enhance toward a higher value which is indicative of a good capacitive behavior (Figure 7d). On the other hand, in the cases of PTFE and Nafion, phase angles slightly decrease after reaching a maximum value in the low-frequency region which could be due to the dissolution of the electrolyte ions or the unfavorable diffusion of ions (Figure 7d).13 This observation is also reflected by a decrease in Rdes for Nafion and PTFE presumably due to the fact that lesser number of ions were adsorbed at the porous interface as the resistance for the desorption of ions was lowered (Table 4). As a consequence, the capacitance values also declined for PTFE and Nafion (Table 3).
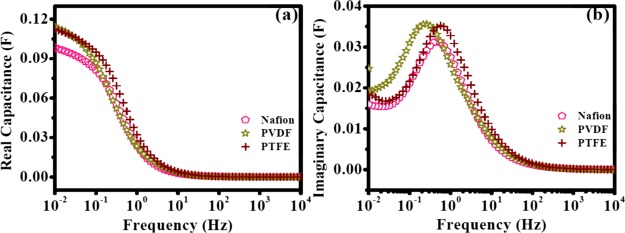
Complex capacitance studies showed that PVDF and PTFE had higher C′(ω) values compared to Nafion and C′(ω) values of PVDF dropped more sharply with increasing frequency in comparison with PTFE (Figure 8a). The highest C′(ω) obtained for the three different binders followed the following order: PVDF > PTFE > Nafion (Figure 8a). These results imply that the electrodes with the PVDF binder were more capacitive in nature than those with PTFE and Nafion. Figure 8b displays C″(ω) versus frequency. τ0 values for Nafion, PVDF, and PTFE were 2.15, 3.84, and 1.77 s, respectively. We speculate that a higher τ0 value for PVDF could be due to the higher faradaic contribution which was observed in the CV curves. Finally, all of these results suggest that the PVDF binder could provide much better electrochemical performance compared to Nafion or PTFE because it provides less resistance for electron transfer at the electrode/electrolyte interface (Ret), higher knee frequency, higher pseudocapacitance (Qps), higher resistance for ion desorption (Rdes), and lower RC time constant (τRC) (Table 4). These results are also in agreement with those of the SEM studies which demonstrated the better stacking of graphene layers with the PVDF binder which will allow the penetration of more electrolyte ions deep inside the pores, improve electron transfer at the electrode/electrolyte interface, and facilitate pseudocapacitive charging. Besides, the agglomeration of graphene layers in the cases of Nafion and PTFE presumably imposed restriction on the percolation of the electrolyte ions inside the pores. Differences in performances with different binders can be rationalized by their properties. Nafion is known to be hydrophilic in nature because of the presence of sulfonic acid groups (Figure S8a), whereas the basal plane of OFG is hydrophobic. Hence, the interaction between OFG and Nafion is weak; that is, binding affinity of Nafion with OFG was inferior. As a consequence, agglomeration within the OFG sheets was severe (vide supra). It has been previously reported that flat or wrinkled graphene sheets tend to agglomerate during electrode preparation because of the strong van der Waals attraction between parallel sheets and to achieve the best performance of synthesized graphene, agglomeration should be minimized.31 On the other hand, PVDF and PTFE are hydrophobic in nature (Figures S8b,c), and hence the binding affinities of these two binders with OFG were much better. Furthermore, these two binders are soluble in NMP which resulted in fine dispersion during electrode preparation which helped to minimize agglomeration. However, the solubility of PVDF in NMP is higher in comparison to that of PTFE, and hence agglomeration with the PVDF binder was less. Moreover, previous report suggests that interfacial interaction between PVDF/PTFE and OFG can enhance because of the hydrogen bonding between the fluorine atoms of the binder and the hydroxyl functionalities of OFG and thus helped to avoid agglomeration.32
Figure 8.
(a) C′(ω) vs frequency and (b) C″(ω) vs frequency of OFG wherein the electrodes were prepared with different binders in the EG solvent for OFG dispersion. The electrodes were dried at 170 °C.
Electrochemical Performance Comparison of Electrodes Prepared from Different Solvents for OFG Dispersion
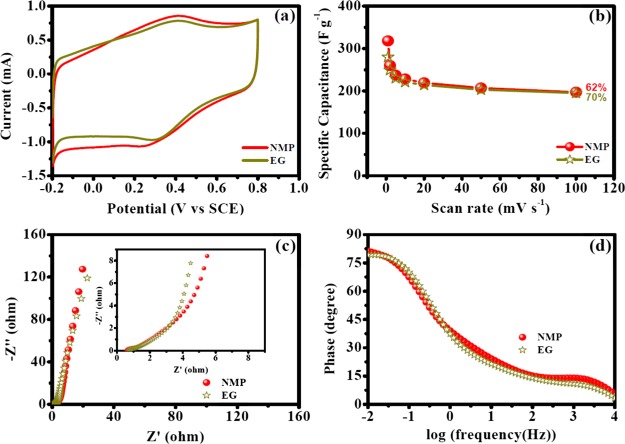
In this section, solvents for OFG dispersion have been varied to understand the role of the solvent in supercapacitor performance while PVDF was chosen as a binder because it was found to be the best binder (vide supra). The electrodes were dried at 170 °C, and two solvents used were EG and NMP. The electrodes prepared from both solvents resulted in rectangular CV curves, indicating fast double-layer charging/discharging, and the hydroxyl functionalities resulted in small faradaic peaks (Figure 9a). However, the faradaic contribution was slightly higher for the electrodes prepared from NMP compared to those prepared from EG. Specific capacitance values obtained were higher for the electrodes prepared from the NMP solvent than those of the electrodes prepared from of EG (Table 5). Maximum specific capacitance was 318 F g–1 for NMP, whereas the value was 280 F g–1 for EG. The results of galvanostatic charge/discharge studies were in agreement with those of CV (Tables 5 and S2 and Figures 9a and S6). Retentions of specific capacitance values with increasing scan rates of voltammetry were 62 and 70% for NMP and EG, respectively (Table 5 and Figure 9b).
Figure 9.
Electrochemical performance of OFG for the electrodes prepared from different solvents (EG and NMP) for OFG dispersion, having PVDF as a binder. The electrodes were dried at 170 °C. (a) CV curves at a scan rate of 5 mV s–1. (b) Specific capacitance dependence on the scan rates of voltammetry. (c) Nyquist plots of EIS results collected at 0.4 V vs SCE (inset: high-frequency region). (f) Bode plot (phase angle vs log frequency) of the EIS experiment.
Table 5. Specific Capacitance Values (F g–1) Obtained for OFG Wherein the Electrodes Were Prepared Using Two Different Solvents for OFG Dispersion at Different Scan Rates of Voltammetry with PVDF as a Bindera.
| scan rate (mV s–1) | NMP | EG |
|---|---|---|
| 100 | 197 | 195 |
| 50 | 207 | 203 |
| 20 | 219 | 214 |
| 10 | 228 | 221 |
| 5 | 237 | 230 |
| 2 | 260 | 249 |
| 1 | 318 | 280 |
| retention | 62% | 70% |
Electrodes were dried at 170 °C
Figure 9c displays the comparison of Nyquist plots for the two solvents. A vertical rise at the low-frequency region parallel to the imaginary axis was higher for the electrodes prepared from NMP, indicating a better capacitive behavior. Ret was also low for NMP (0.3 Ω) compared with that for EG (0.4 Ω) (Table 6). Knee frequencies were 317 and 175 Hz for NMP and EG, respectively, suggesting that diffusion occurred much faster for the electrodes prepared from the NMP solvent. Transition from resistive to capacitive behavior was shallower for the electrodes prepared from NMP, implying a more faradaic-type charge storage phenomenon (Figure 9d). A higher phase angle of 81.2° was obtained in the case of NMP compared with 79.2° in EG, highlighting better capacitive performance for the electrodes prepared from the NMP solvent (Figure 9d). Equivalent circuit fitting results suggested that pseudocapacitive charging (Qps) was faster for the electrodes prepared from NMP while the resistance for the desorption of electrolyte ions (Rdes) was higher for NMP (Table 6). Furthermore, RC time constant (τRC) was also smaller for the electrodes prepared using the NMP solvent compared to that for the electrodes prepared using EG (Table 6).
Table 6. Equivalent Circuit Parameters of OFG Wherein the Electrodes Were Prepared from Two Different Solvents for OFG Dispersion and with PVDF as a Bindera.
| solvents | Rs (Ω) | Qdl × 10–3 (F s(a1–1)) | a1 | Ret (Ω) | Rdes (Ω) | Qd (F s(a2–1)) | a2 | Qps (F s(a3–1)) | a3 | τRC (ms) |
|---|---|---|---|---|---|---|---|---|---|---|
| NMP | 0.59 | 0.3 | 0.95 | 0.30 | 10.9 | 0.11 | 0.45 | 0.12 | 0.97 | 0.11 |
| EG | 0.62 | 1.8 | 0.85 | 0.40 | 5.6 | 0.10 | 0.52 | 0.10 | 0.94 | 0.49 |
Electrodes were dried at 170 °C
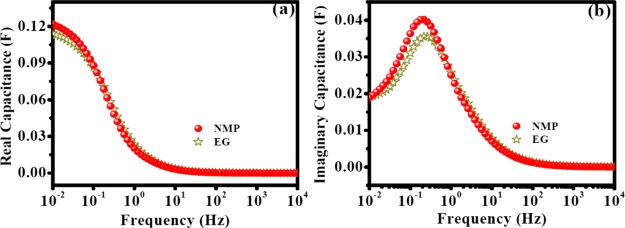
Complex capacitance studies showed that the value of C′(ω) was higher for NMP compared to that for EG (Figure 10a). τ0 values were 3.84 and 4.64 s for EG and NMP, respectively (Figure 10b). A slightly higher time constant for the electrodes prepared from NMP was presumably due to the enhanced faradaic contribution.
Figure 10.
(a) C′(ω) vs frequency and (b) C″(ω) vs frequency of OFG for the electrodes prepared from two different solvents (EG and NMP) for OFG dispersion with PVDF as a binder. The electrodes were dried at 170 °C.
In summary, electrochemical analysis showed that the electrodes prepared from the NMP solvent had higher specific capacitance because of the faster diffusion of electrolyte ions inside the nanomaterial, lower resistance for electron transfer at the electrode/electrolyte interface, smaller RC time constant, higher pseudocapacitive charging, and higher resistance for ion desorption. These results firmly suggest NMP as a better solvent for OFG dispersion compared to EG. SEM studies indicated the better stacking of graphene layers for the electrodes prepared from NMP compared to those prepared from EG (vide supra) which helps more electrolyte ions to percolate inside the pores of nanomaterials, and as a result, more double-layer capacitance and a better faradaic contribution were obtained. A careful look at the properties of these two solvents suggests that 10 times higher viscosity of EG compared to NMP could be the possible reason for the observed difference in electrochemical performances (Table S4) because all other properties of these two solvents are similar. The solvent having lower viscosity helps in the uniform spreading of active materials on the electrode surface which assists in efficient evaporation of the solvent during electrode drying and results in less agglomeration. This observation was supported by the SEM images (vide supra), and the electrochemical results also demonstrated enhanced redox peaks due to the hydroxyl functionalities for the electrodes prepared from the NMP solvent compared to the electrodes prepared from the EG solvent (Figure 9a). Indeed, these results suggest that the solvent for active material dispersion plays a key role in supercapacitor performance.
Electrochemical Performance Comparison of Electrodes Prepared at Different Drying Temperatures.
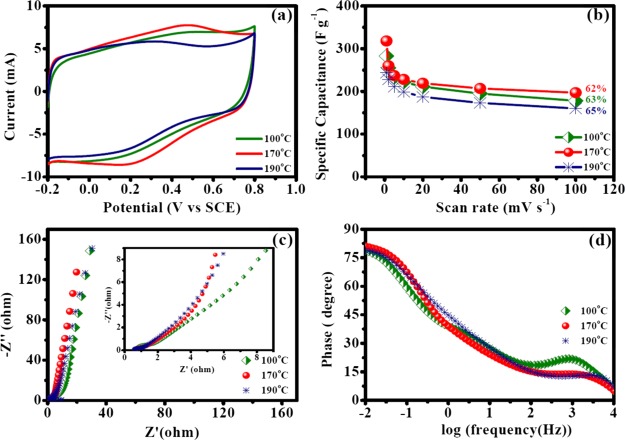
Earlier results suggested PVDF as the best binder while NMP was a better solvent for OFG dispersion. Hence, these two experimental conditions were chosen while the electrode-drying temperatures (100, 170, and 190 °C) were varied because we speculated that the rate of evaporation of solvent may significantly affect the performance of a supercapacitor. Similar to the previous experiments, CV curves were mostly rectangular but faradaic peaks were most prominent wherein the electrodes were dried at 170 °C, followed by 100 and 190 °C (Figure 11a). The highest specific capacitance was maximum when the electrodes were dried at 170 °C (318 F g–1 at 1 mV s–1, Table 7). The specific capacitance values followed the following trend: 170 °C > 100 °C > 190 °C (Table 7). Specific capacitance retentions with increasing scan rates of voltammetry were similar at different experimental conditions (Figure 11b and Table 7). Galvanostatic charge/discharge experiments yielded similar results (Figure S7 and Table S3). The Nyquist plots demonstrated that the vertical line at a low frequency parallel to the imaginary component was steepest when the electrodes were dried at 170 °C, highlighting a high capacitive behavior, and the decrease of slope followed the following order: 170 °C > 100 °C > 190 °C (Figure 11c). Electron-transfer resistance at the electrode/electrolyte interface (Ret) followed the following trend: 170 °C > 190 °C > 100 °C (Table 8). Knee frequencies were 67, 317, and 82 Hz for 100, 170, and 190 °C drying temperatures, respectively, which highlights that the diffusion process occurred fastest when the electrode-drying temperature was 170 °C. The maximum phase angle obtained was highest when the electrodes were dried at 170 °C (81.2°), and the following trend was observed: 170 °C (81.2°) > 100 °C (79°) > 190 °C (78.7°) (Figure 11d). These results suggest that the electrodes dried at 170 °C exhibited the best capacitive behavior in these series of experiments.
Figure 11.
Electrochemical performance of OFG for the electrodes prepared with the PVDF binder in NMP as a solvent for OFG dispersion at different drying temperatures (100, 170, and 190 °C). (a) CV curves at a scan rate of 50 mV s–1. (b) Specific capacitance dependence on the scan rates of voltammetry. (c) Nyquist plots of EIS results collected at 0.4 V vs SCE (inset: high-frequency region). (f) Bode plot (phase angle vs log frequency) in the EIS experiment.
Table 7. Specific Capacitances (F g–1) of OFG Obtained for Electrodes Prepared at Different Drying Temperatures (100, 170, and 190 °C) While NMP Was Used for OFG Dispersion and PVDF Was Used as a Binder.
| scan rate (mV s–1) | 100 °C | 170 °C | 190 °C |
|---|---|---|---|
| 100 | 178 | 197 | 160 |
| 50 | 195 | 207 | 173 |
| 20 | 211 | 219 | 187 |
| 10 | 222 | 228 | 199 |
| 5 | 233 | 237 | 211 |
| 2 | 255 | 260 | 228 |
| 1 | 283 | 318 | 244 |
| retention | 63% | 62% | 65% |
Table 8. Equivalent Circuit Parameters of OFG for Electrodes Prepared at Different Drying Temperatures (100, 170, and 190 °C) While NMP Was Used as a Solvent for OFG Dispersion and PVDF Was Used as a Binder.
| drying temperature (°C) | Rs (Ω) | Qdl × 10–3 (F s(a1–1)) | a1 | Ret (Ω) | Rdes (Ω) | Qd (F s(a2–1)) | a2 | Qps (F s(a3–1)) | a3 | τRC (ms) |
|---|---|---|---|---|---|---|---|---|---|---|
| 100 | 0.62 | 1.4 | 0.81 | 1.20 | 9.1 | 0.04 | 0.64 | 0.09 | 0.91 | 0.15 |
| 170 | 0.59 | 0.3 | 0.95 | 0.30 | 10.9 | 0.11 | 0.45 | 0.12 | 0.97 | 0.11 |
| 190 | 0.57 | 1.4 | 0.78 | 0.54 | 6.1 | 0.07 | 0.58 | 0.08 | 0.89 | 0.12 |
EIS analysis further suggested that the pseudocapacitive charging was highest when the electrodes were dried at 170 °C and the trend was 170 °C > 100 °C > 190 °C (Table 8). Furthermore, the resistance for the desorption of electrolyte ions (Rdes) was also highest and the RC time constant (τRC) was less at 170 °C drying temperature (Table 8). Complex capacitance studies demonstrated that the highest value of C′(ω) followed a similar trend as 170 °C > 100 °C > 190 °C, which indicates that the value of capacitance obtained must be comparatively higher when the electrodes were dried at 170 °C (Figure 12a). The τ0 values were found to be 4.64, 10.0, and 8.25 s for 170, 100, and 190 °C, respectively (Figure 12b). The lowest dielectric relaxation time constant and highest specific capacitance value for the electrodes prepared at 170 °C drying temperature imply that this particular condition has higher energy density as well as high power density which makes it a suitable candidate for supercapacitor studies. In summary, it can be concluded that indeed the electrode-drying temperature affects the supercapacitor performance and herein 170 °C drying temperature provides the best supercapacitor performance of OFG because of the lower electron-transfer resistance at the electrode/electrolyte interface, higher pseudocapacitive charging, higher resistance for the desorption of electrolyte ions, smaller RC time constant, and smaller dielectric relaxation time constant. The SEM studies also indicated that the stacking of graphene layers was best when the electrodes were dried at 170 °C (vide supra). The role of electrode-drying temperature in supercapacitor performance can be rationalized by noting that the viscosity of the solvent decreases with increasing temperature; hence, the electrodes dried at 170 °C will result in uniform spreading of active materials on the electrode surface which assists in the efficient evaporation of the solvent compared to the electrodes prepared at the drying temperature of 100 °C; and hence, less agglomeration was observed for the electrodes dried at 170 °C. This observation was supported by the SEM images (vide supra) and enhanced redox response due to the hydroxyl functionalities (Figure 11a). However, the electrochemical performance significantly declined when the electrode was dried at 190 °C because this temperature was close to the boiling point of NMP (202 °C). At 190 °C, the solvent started to boil, and because of the rapid boiling of the solvent, OFG sheets agglomerated severely because of the strong van der Waals interaction between graphene sheets.31 It is important to mention that boiling and evaporation are significantly different processes. Evaporation is a surface phenomenon and a slow process, whereas boiling is a bulk phenomenon and the process is rapid. Finally, this study clearly shows that the optimization of electrode-drying temperature is a crucial parameter to improve the performance of a supercapacitor.
Figure 12.
(a) C′(ω) vs frequency and (b) C″(ω) vs frequency of OFG for electrodes prepared at different drying temperatures (100, 170, and 190 °C) with NMP as a solvent for OFG dispersion and PVDF as a binder.
Conclusions
A series of experiments for electrodes prepared using different binders, solvents for OFG dispersion, and varying electrode-drying temperatures have shown that all of these parameters affect the performance of a supercapacitor. This study revealed that the best electrode preparation methodology was PVDF as a binder, NMP as a solvent for OFG dispersion, and 170 °C electrode-drying temperature wherein a maximum specific capacitance of 318 F g–1 was achieved. On the other hand, the electrodes prepared with Nafion as a binder, EG as a solvent for OFG dispersion, and electrode-drying temperature of 170 °C provided worst electrochemical performance wherein a maximum specific capacitance of only 240 F g–1 was attained. The SEM studies revealed that the stacking of graphene layers was significantly improved while more edges were also exposed at the best electrode preparation condition and the morphology of OFG on the electrode surface was very similar to that of the as-synthesized material. Low viscosity of the solvent and good solubility of the binder in the solvent helped to achieve uniform dispersion of OFG on the electrode surface, and hence the agglomeration of OFG sheets was avoided. A thorough electrochemical analysis revealed that several physical parameters were impacted at different electrode preparation conditions, attention on these parameters is needed to extract the best performance from nanomaterials, and they are as follows: (a) electron-transfer resistance at the electrode/electrolyte interface can be decreased, (b) pseudocapacitive charging can be improved, (c) knee frequency can be increased which ensures the fast diffusion of electrolyte ions inside the pores of nanomaterials, (d) resistance for ion desorption can be increased, (e) RC time constant can be decreased, and (f) dielectric relaxation time constant can be minimized which represents half of the low-frequency capacitance for the whole system and referred to as the supercapacitor factor of merit. Finally, we hope that this work will bring attention in the scientific community regarding electrode preparation methodology for supercapacitor applications which has been overlooked till date. Furthermore, we speculate that the physical parameters mentioned herein will be even more important wherein pseudocapacitance is the predominant contributor toward the specific capacitance.
Acknowledgments
A.P. acknowledges the financial support from the Department of Science and Technology (DST), India (grant no.: SERB/F/3020/2017-2018), and IISER Bhopal. A.M. acknowledges INSPIRE fellowship, Govt. of India, during his B.S.-M.S. studies. We sincerely thank Chanderpratap Singh for his help during this project.
Supporting Information Available
The Supporting Information is available free of charge on the ACS Publications website at DOI: 10.1021/acsomega.7b01275.
Low-magnification SEM images, long-term cyclic test, galvanostatic charge/discharge results, and physical properties of the solvents (PDF)
The authors declare no competing financial interest.
Supplementary Material
References
- Conway B. E.Electrochemical Supercapacitors: Scientific Fundamentals and Technological Applications; Springer US, 1999. [Google Scholar]
- Zhang L. L.; Zhao X. S. Carbon-based materials as supercapacitor electrodes. Chem. Soc. Rev. 2009, 38, 2520–2531. 10.1039/b813846j. [DOI] [PubMed] [Google Scholar]
- Lu M.; Beguin F.; Frackowiak E.. Supercapacitors: Materials, Systems and Applications; John Wiley & Sons, 2013; pp 75–77. [Google Scholar]
- Dubal D. P.; Ayyad O.; Ruiz V.; Gómez-Romero P. Hybrid energy storage: the merging of battery and supercapacitor chemistries. Chem. Soc. Rev. 2015, 44, 1777–1790. 10.1039/c4cs00266k. [DOI] [PubMed] [Google Scholar]
- Winter M.; Brodd R. J. What Are Batteries, Fuel Cells, and Supercapacitors?. Chem. Rev. 2004, 104, 4245–4270. 10.1021/cr020730k. [DOI] [PubMed] [Google Scholar]
- Zhang F.; Zhang T.; Yang X.; Zhang L.; Leng K.; Huang Y.; Chen Y. A high-performance supercapacitor-battery hybrid energy storage device based on graphene-enhanced electrode materials with ultrahigh energy density. Energy Environ. Sci. 2013, 6, 1623–1632. 10.1039/c3ee40509e. [DOI] [Google Scholar]
- Conway B. E. Transition from “Supercapacitor” to “Battery” Behavior in Electrochemical Energy Storage. J. Electrochem. Soc. 1991, 138, 1539–1548. 10.1149/1.2085829. [DOI] [Google Scholar]
- Simon P.; Gogotsi Y.; Dunn B. Where Do Batteries End and Supercapacitors Begin?. Science 2014, 343, 1210–1211. 10.1126/science.1249625. [DOI] [PubMed] [Google Scholar]
- Chandra S.; Chowdhury D. R.; Addicoat M.; Heine T.; Paul A.; Banerjee R. Molecular Level Control of the Capacitance of Two-Dimensional Covalent Organic Frameworks: Role of Hydrogen Bonding in Energy Storage Materials. Chem. Mater. 2017, 29, 2074–2080. 10.1021/acs.chemmater.6b04178. [DOI] [Google Scholar]
- DeBlase C. R.; Silberstein K. E.; Truong T.-T.; Abruña H. D.; Dichtel W. R. β-Ketoenamine-Linked Covalent Organic Frameworks Capable of Pseudocapacitive Energy Storage. J. Am. Chem. Soc. 2013, 135, 16821–16824. 10.1021/ja409421d. [DOI] [PubMed] [Google Scholar]
- Sheberla D.; Bachman J. C.; Elias J. S.; Sun C.-J.; Shao-Horn Y.; Dincă M. Conductive MOF electrodes for stable supercapacitors with high areal capacitance. Nat. Mater. 2017, 16, 220–224. 10.1038/nmat4766. [DOI] [PubMed] [Google Scholar]
- Jo C.; Hwang I.; Lee J.; Lee C. W.; Yoon S. Investigation of Pseudocapacitive Charge-Storage Behavior in Highly Conductive Ordered Mesoporous Tungsten Oxide Electrodes. J. Phys. Chem. C 2011, 115, 11880–11886. 10.1021/jp2036982. [DOI] [Google Scholar]
- Maqbool Q.; Singh C.; Jash P.; Paul A.; Srivastava A. Nano “Koosh Balls” of Mesoporous MnO2: Improved Supercapacitor Performance through Superior Ion Transport. Chem.—Eur. J. 2017, 23, 4216–4226. 10.1002/chem.201700155. [DOI] [PubMed] [Google Scholar]
- Sugimoto W.; Iwata H.; Yokoshima K.; Murakami Y.; Takasu Y. Proton and Electron Conductivity in Hydrous Ruthenium Oxides Evaluated by Electrochemical Impedance Spectroscopy: The Origin of Large Capacitance. J. Phys. Chem. B 2005, 109, 7330–7338. 10.1021/jp044252o. [DOI] [PubMed] [Google Scholar]
- Ding J.; Zhou D.; Spinks G.; Wallace G.; Forsyth S.; Forsyth M.; MacFarlane D. Use of Ionic Liquids as Electrolytes in Electromechanical Actuator Systems Based on Inherently Conducting Polymers. Chem. Mater. 2003, 15, 2392–2398. 10.1021/cm020918k. [DOI] [Google Scholar]
- Singh C.; Paul A. Physisorbed Hydroquinone on Activated Charcoal as a Supercapacitor: An Application of Proton-Coupled Electron Transfer. J. Phys. Chem. C 2015, 119, 11382–11390. 10.1021/acs.jpcc.5b01322. [DOI] [Google Scholar]
- Biswas S.; Drzal L. T. Multilayered Nanoarchitecture of Graphene Nanosheets and Polypyrrole Nanowires for High Performance Supercapacitor Electrodes. Chem. Mater. 2010, 22, 5667–5671. 10.1021/cm101132g. [DOI] [Google Scholar]
- Liu C.; Yu Z.; Neff D.; Zhamu A.; Jang B. Z. Graphene-Based Supercapacitor with an Ultrahigh Energy Density. Nano Lett. 2010, 10, 4863–4868. 10.1021/nl102661q. [DOI] [PubMed] [Google Scholar]
- Singh C.; Mishra A. K.; Paul A. Highly conducting reduced graphene synthesis via low temperature chemically assisted exfoliation and energy storage application. J. Mater. Chem. A 2015, 3, 18557–18563. 10.1039/c5ta04655f. [DOI] [Google Scholar]
- Singh C.; S. N.; Jana A.; Mishra A. K.; Paul A. Proton conduction through oxygen functionalized few-layer graphene. Chem. Commun. 2016, 52, 12661–12664. 10.1039/c6cc07231c. [DOI] [PubMed] [Google Scholar]
- Yan J.; Fan Z.; Wei T.; Qian W.; Zhang M.; Wei F. Fast and reversible surface redox reaction of graphene–MnO2 composites as supercapacitor electrodes. Carbon 2010, 48, 3825–3833. 10.1016/j.carbon.2010.06.047. [DOI] [Google Scholar]
- Hummers W. S.; Offeman R. E. Preparation of Graphitic Oxide. J. Am. Chem. Soc. 1958, 80, 1339. 10.1021/ja01539a017. [DOI] [Google Scholar]
- Chowdhury D. R.; Singh C.; Paul A. Role of graphite precursor and sodium nitrate in graphite oxide synthesis. RSC Adv. 2014, 4, 15138–15145. 10.1039/c4ra01019a. [DOI] [Google Scholar]
- Frackowiak E.; Béguin F. Carbon materials for the electrochemical storage of energy in capacitors. Carbon 2001, 39, 937–950. 10.1016/s0008-6223(00)00183-4. [DOI] [Google Scholar]
- Conway B. E.; Birss V.; Wojtowicz J. The role and utilization of pseudocapacitance for energy storage by supercapacitors. J. Power Sources 1997, 66, 1–14. 10.1016/s0378-7753(96)02474-3. [DOI] [Google Scholar]
- Macdonald D. D. Reflections on the history of electrochemical impedance spectroscopy. Electrochim. Acta 2006, 51, 1376–1388. 10.1016/j.electacta.2005.02.107. [DOI] [Google Scholar]
- Lvovich V. F.Impedance Spectroscopy: Applications to Electrochemical and Dielectric Phenomena; John Wiley & Sons, 2012; pp 26–30. [Google Scholar]
- Chunsheng D.; Ning P. High power density supercapacitor electrodes of carbon nanotube films by electrophoretic deposition. Nanotechnology 2006, 17, 5314. 10.1088/0957-4484/17/21/005. [DOI] [Google Scholar]
- Jorcin J.-B.; Orazem M. E.; Pébère N.; Tribollet B. CPE analysis by local electrochemical impedance spectroscopy. Electrochim. Acta 2006, 51, 1473–1479. 10.1016/j.electacta.2005.02.128. [DOI] [Google Scholar]
- Taberna P. L.; Simon P.; Fauvarque J. F. Electrochemical Characteristics and Impedance Spectroscopy Studies of Carbon-Carbon Supercapacitors. J. Electrochem. Soc. 2003, 150, A292–A300. 10.1149/1.1543948. [DOI] [Google Scholar]
- Luo J.; Jang H. D.; Huang J. Effect of Sheet Morphology on the Scalability of Graphene-Based Ultracapacitors. ACS Nano 2013, 7, 1464–1471. 10.1021/nn3052378. [DOI] [PubMed] [Google Scholar]
- Wang J. C.; Chen P.; Chen L.; Wang K.; Deng H.; Chen F.; Zhang Q.; Fu Q. Preparation and properties of poly(vinylidene fluoride) nanocomposites blended with graphene oxide coated silica hybrids. eXPRESS Polym. Lett. 2012, 6, 299–307. 10.3144/expresspolymlett.2012.33. [DOI] [Google Scholar]
Associated Data
This section collects any data citations, data availability statements, or supplementary materials included in this article.


