Abstract
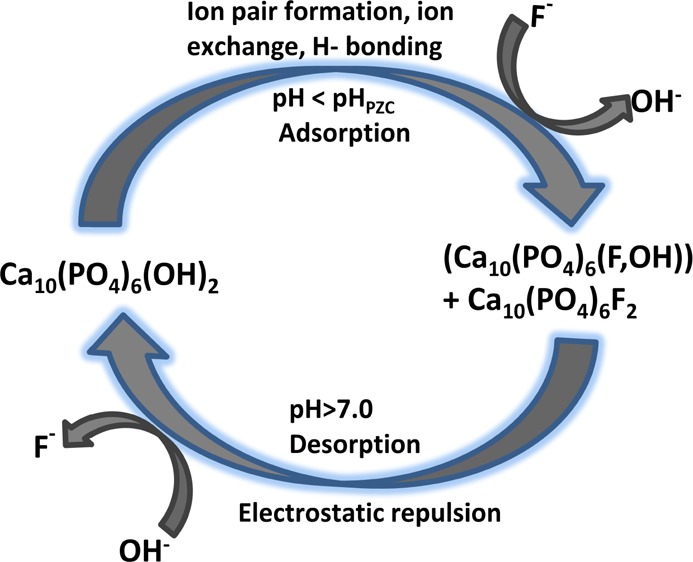
Hydroxyapatite (HAp) was successfully synthesized from egg shells, a low cost and easily available biodegradable waste, by the precipitation method and characterized by X-ray diffraction (XRD), scanning electron microscopy, Fourier transform infrared, and Brunauer–Emmett–Teller (BET) surface area analysis. The surface area of HAp was found to be 144 m2/g with a crystalline size of 9–99 nm from the BET and XRD data. The maximum fluoride removal efficiency within 1 h using 0.3 g of the synthesized adsorbent at pH 6 was 95%. The adsorption of fluoride followed second-order kinetics, indicating that chemisorptions are the rate-limiting step. The experimental data were well fitted with Langmuir and Freundlich isotherms, validating both monolayer and multilayer sorption during the fluoride adsorption onto the porous HAp. The positive adsorption of F– ions at the HAp interface can be attributed to ion exchange/ion pairing and H-bonding below the pHpzc of HAp (pHpzc = 8), and the negative adsorption can be attributed to the electrostatic repulsion between O– and F– ions at alkaline pH. Both physical and chemical adsorption phenomena were also evidenced from the molecular parking area data. The results of a batch experiment show that the HAp synthesized from egg shells can be used as an effective, low-cost adsorbent for fluoride removal from a contaminated aqueous solution as well as groundwater compared to other adsorbents.
1. Introduction
Industrialization and urbanization, leading to the emergence of several industries, construction of buildings, and extensive use of luxury products, adversely affect the essentials of life, that is, air, water, and soil, and hence all life is endangered. As far as water is concerned, the presence of essential heavy metals/nonmetals beyond certain threshold concentrations adversely affects both human beings and aquatic animals in terms of severe health hazards. Among various noxious ions, fluoride, the most electronegative element in the halogen family, is considered as the main nonbiodegradable pollutant because of its higher reactivity and abundance in nature.1 Large amounts of fluoride enter water bodies from domestic and industrial waste, thereby making them toxic. As water is the prime requirement for the sustenance of life, the major intake of fluoride (∼60%) by living organisms is through drinking water from several sources. Excess accumulation of fluorides within the human body causes several problems such as pain in bones and joints, knock knee syndrome, dental decay, and dental and skeletal fluorosis.2 Today, the higher than desirable level of fluoride (0.6–1.5 mg/L) in drinking water is the main problem in many parts of the world.3 Thus, the lack of pure or less polluted drinking water has led to exploring strategies for optimal defluoridation by developing techniques and synthesizing materials that are simple, economically viable, environmentally compatible, and easily transferable. Techniques involving local resources, biodegradable wastes, and applicable to any concentration of contaminants are also preferable.
Until now, among various reported methods used for defluoridation, adsorption has been the most successful and cost-effective method used in the removal of F– ions at low concentrations.4 The viability of adsorption techniques significantly depends on the development of high-quality adsorbent materials with optimum efficiency and the required sorption capability.5 The materials developed for this purpose include hydrated cement,6 alumina containing bauxite,7 activated carbon,8 calcite,9 fly ash,10 red mud,11 synthetic hydrous Fe(III) oxide,12 Zr(IV) oxides,13 lime and Al salts,14,15 and La-impregnated silica gel.16 Apart from these, adsorbents prepared from natural materials such as dry powder of holly oak, neem bark powder, lime stone, clay, concrete, jute, activated carbon, and leaf powder17,18 have also been reported.
The feasibility of hydroxyapatite (HAp) and its nanoparticles for the treatment of waste water and contaminated soils is now well accepted; literature related to the use of this material is adequately available.19,20 Moreover, HAp is also used as an adsorbent for chromatography to separate biomaterials and as a raw material for artificial teeth and bones.21,22 Generally, the tunnels and active sites on the HAp surface are responsible for the significant improvement in adsorption phenomenon.23 The effective interaction between the HAp surface and molecules is related to various surface characteristics such as surface functional groups, acidity and basicity, surface charge, hydrophilicity, and porosity.24 Considering these facts, various innovative methods for the synthesis of HAp have been designed by improving and integrating the existing technologies. At this juncture, natural dead biomass enriched in calcium is a suitable substrate for the synthesis of HAp because of its low cost and abundance in nature, leading to (i) a green technology through the synthesis of nanoadsorbents from biodegradable materials, and (ii) waste utilization through product development using cheaply available waste products generated by human daily activity.25
This article describes the synthesis and characterization of HAp using biodegradable waste egg shells as the starting material and its fluoride removal efficiency from aqueous solutions. The mechanism of fluoride sorption at the HAp interface has been established by experimental studies on the variation of pH, adsorbent dose, time, initial F– ion concentration, and temperature. Different kinetic models have been evaluated to determine the rate-controlling step during the transfer of the adsorbate from the aqueous bulk phase to the adsorbent surface. The adsorption characteristics have been analyzed by fitting the initial F– ion concentration–adsorption data to Langmuir and Freundlich adsorption models. In addition, desorption, molecular parking area of the F– ion, and reusability of the adsorbent have been investigated to determine the effectiveness of the synthesized HAp as an adsorbent.
2. Experimental Section
2.1. Chemicals Used
The required chemicals, HCl (35–38%), HNO3 (65%), NaCl (99%), NH3 (35%), (NH4)2HPO4 (99%), SPADNS (99%) [4,5-dihydroxy-3-(p-sulfophenylazo)-2,7-naphthalene disulfonic acid trisodium salt], and ZrOCl2·8H2O (98%) were obtained from Merck, India. NaOH (98%) and anhydrous NaF (99%) were procured from Qualigens Fine Chemicals, India. All of the chemicals were of analytical reagent grade and used as received without further purification.
2.2. Collection of Raw Materials, Synthesis, and Characterization of HAp
Egg shells of hen (Gallus domesticus) were collected from the local market of Sambalpur town, Odisha, India. They were cleaned in tap water and soaked in 2% NaCl solution at ambient temperature for 24 h. Then, the egg shells were dried, crushed, and digested with 50% NaOH for 72 h to remove the binding materials and organic compounds. During soaking and digestion, a solid/liquid ratio of 1:2 (w/v) was maintained. The digested sample was subsequently treated with HNO3 (2 N) till all of the calcium compounds were converted to calcium nitrate tetrahydrate [Ca(NO3)2·4H2O]. HAp was synthesized from this prepared calcium nitrate tetrahydrate following the precipitation method.26 Each 25 mL of this solution afforded ∼2 g of HAp particles.
Thermal stability of the synthesized HAp sample was determined by subjecting to calcinations at up to 900 °C for 2 h. The mineral phase of the sample was analyzed by powder X-ray diffraction (XRD) using an X-ray diffractometer (PW-1830; Philips, Almelo, Netherlands) equipped with a Cu Kα radiation source (35 kV and 30 mA). Specific surface area was determined using a Brunauer–Emmett–Teller (BET) surface area analyzer (QUANTACHROME model: Autosorb1, Boynton, Beach, FA) at 77 K. The sample was degassed at 100 °C in vacuum. Helium was used as the carrier gas, and the surface area was measured by the nitrogen adsorption–desorption method at liquid nitrogen temperature. The morphology and porosity of granules were analyzed using a JEOL JSM-6480LV scanning electron microscope (SEM, Hitachi, Japan). The functional groups present in the synthesized HAp samples were determined by recording the IR spectra of the sample in the range 4000–400 cm–1 using the KBr pellet technique and an Fourier transform infrared (FTIR) spectrophotometer (Perkin-Elmer S2000 IR spectrophotometer, USA). The spectral resolution of the instrument was 4 cm–1. All pH measurements were carried out using a digital pH meter (Systronics Instruments, India). Fluoride analysis in the solution phase was carried out using a Shimadzu UV-2450 spectrophotometer (Japan).
2.3. Preparation of Standard Solutions and Samples
Two solutions, A and B, were prepared to obtain the Zr-SPADNS solution required for the spectrophotometric analyses of the F– ion. Solution A was prepared by dissolving 0.958 g of SPADNS in 500 mL of Millipore water. Solution B was prepared by dissolving 0.133 g of ZrOCl2·8H2O in 350 mL of conc. HCl and subsequently diluting the resulting solution to 500 mL with Millipore water. Zr-SPADNS solution was obtained by mixing equal volumes of solutions A and B. The reference solution was prepared by mixing 10 mL of reagent A and 7 mL of conc. HCl in a 100 mL standard flask and filling it up to the mark with Millipore water. This reference solution for absorbance measurement was very stable for a month. The fluoride stock solution was prepared by dissolving 0.221 g of anhydrous NaF in 1 L Millipore water (1 mL = 0.1 mg of F–). The standards and fluoride-spiked samples of the required concentrations (3–40 mg) were prepared by the appropriate dilution of the stock solution with Millipore water. Quantitative estimation of the F– ion before and after adsorption was carried out by following the SPANDS methods27 using a Shimadzu UV-2450 Spectrophotometer. Various amounts of 0.1 M HCl or 0.1 M NaOH were added to maintain the pH of the solutions wherever necessary.
2.4. Adsorption and Desorption Experiments
Defluoridation studies were conducted using the synthesized HAp in batch experiments as a function of contact time, initial F– concentration, pH, adsorbent dose, and temperature. For each study, 0.3 g of dry adsorbent was added to a series of reagent bottles containing 100 mL of 10 mg F– solution and shaken in 250 mL polyethylene bottles at 300 rpm using a shaker. The solutions were allowed to settle for 10 min followed by centrifugation at 3000 rpm for 15 min. The containers were tightly stoppered throughout all of the experiments to avoid concentration change due to evaporation. The pH of the solution was adjusted to the desired pH whenever required. The amount of F– adsorbed and adsorption capacities at equilibrium qe (mg/g) were calculated using the following equations
| 1 |
| 2 |
where C0 is the initial concentration of the adsorbate (mg/L), Ce is the concentration of the adsorbate at equilibrium (mg/L), V is the volume of the solution (L), and W is the mass of the adsorbent (g). The kinetic studies of adsorption were carried out using a temperature-controlled mechanical stirrer.
Desorption of fluoride followed by regeneration of synthesized HAp mainly depends on the desorption methods for F– ions from the F–-loaded adsorbent samples. To investigate the desorption, 100 mL of 10 mg fluoride solution was treated with 0.5 g of HAp and stirred for 90 min. The residue was filtered and retreated with 100 mL Millipore water at different pH values (2–10). The samples were stirred at 300 rpm and room temperature (25 ± 2 °C) for 1 h and centrifuged. The residual F– concentration was calculated to determine the amount of desorption.
2.5. Adsorption Density and Molecular Parking Area of F– Ion
Adsorption density plays an important role in investigating the qualitative and quantitative interactions of F– ions on the HAp interface. The packing of F– ions is mainly governed by the number of vacant OH sites at the interface. To understand the types of interactions involved in the adsorption of F– ions on the HAp surface, the adsorption density (Γ)28 and molecular parking area28 of F– ions were calculated using the following equations
| 3 |
| 4 |
where C1 is the initial concentration of the adsorbate in mol·dm–3, C2 is the final concentration of the adsorbate in mol·dm–3 after the adsorption, A is the surface area of the adsorbent in cm2/g, V is the volume of the aliquot in cm3, W is the weight of the adsorbent used in g, and NA is Avogadro’s number.
3. Results and Discussion
3.1. Characterization of Adsorbent
Figure 1a shows the characteristic FTIR bands of the synthesized HAp. The wide band near 3342 cm–1 can be attributed to the stretching mode of O–H and that near 635 cm–1 can be assigned to its bending mode. The presence of the PO43– group was confirmed by the appearance of a peak at 1034 cm–1 (ν3 band) for P–O stretching, a double peak at 562 and 606 cm–1 (ν4 band) for P–O bending, and a single peak at 963 cm–1 (ν1 band) for the HPO42– group. The characteristic absorption bands at 1386 and 1422 cm–1 can be attributed to the ν3 and ν1 bands of C–O stretching for the CO32– group. The sharp peak at 873.6 cm–1 can be attributed to the ν4-type bending vibrations of the C–O group. The presence of these bands is characteristic of a B-type carbonated HAp, wherein the carbonate ions occupy the phosphate ion sites.29,30 The presence of carbonate ions can be attributed to the absorption of CO2 from water.
Figure 1.
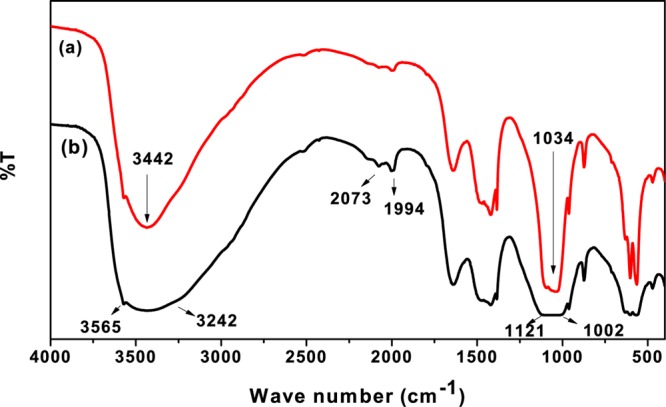
FTIR spectra of (a) synthesized HAp and (b) F–-loaded HAp.
The FTIR spectrum of the F–-loaded HAp sample is shown in Figure 1b. A large broadening in the range of 3242–3565 cm–1 in the FTIR spectrum supported the formation of F-HAp through OH2+···F– linkage. A similar broadening has also been reported during the formation of F-HAp (Ca10 (PO4)6(F, OH)) from fluorine XANES spectra.31 The shifting of peaks from 556 to 632 cm–1 with concurrent decrease in the intensities due to the electrostatic interaction of the F– ion onto the HAp surface after the adsorption supported the presence of apatite-OH, and its replacement with F– ions at the interface.32 The F–OH linkage was also evident from the shifting of the P–O stretching peak at 1002–1121 cm–1. The C–O stretching/bending frequency of the CO32– group at 1383 and 873.6 cm–1 did not shift significantly, confirming the nonparticipation of the CO32– group in F– adsorption. The appearance of two new peaks at 1994 and 2073 cm–1 envisaged the F···H···O bonding at HAp interfaces in the aqueous phase. Because the OH group and F– ion have similar dimensions, they can isomorphously replace each other through ligand exchange.33
The powder XRD pattern of the synthesized HAp shown in Figure 2a was compared to that of the JCPDS card No. 740565. The high-intensity diffraction peaks at 23.12, 25.8, 29.45, 32, 39.4, 46.87, 49.65, 53.2, 64, and 77.5° were indexed to the (111), (002), (210), (211), (130), (222), (213), (004), (323), and (513) crystal planes of HAp, confirming the crystalline nature34 of the synthesized HAp. From the (211) plane, the normal crystallite size of the material was calculated to be 9.08 nm using the Debye Scherrer35 formula (eq 5).
| 5 |
where D is the average crystal size in nm, K is the shape factor/constant and is equal to 0.9, λ is the specific wavelength of the X-ray used (0.154 nm), θ is the diffraction angle, and β2θ is the angular width in radians at intensity equal to full width and half-maximum. The crystal size of HAp was found to be in the range 9–99 nm with the same crystal phase. The smaller crystallite size is consistent with the large surface area manifested by the synthesized HAp in this case.
Figure 2.
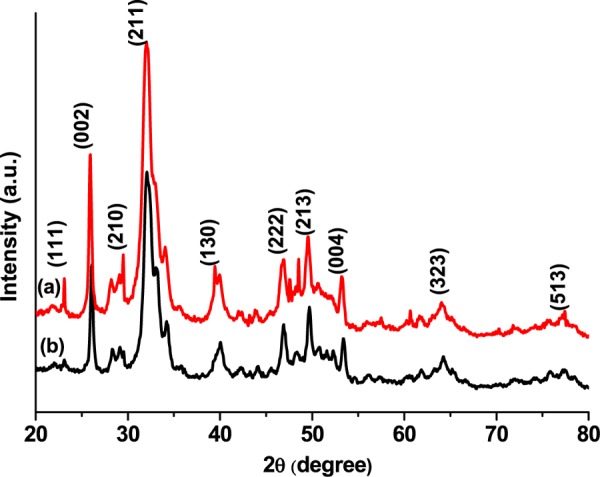
XRD spectra of (a) synthesized HAp and (b) F–-loaded HAp.
After the F– ion adsorption, the major characteristic peak shifted from 25.8 to 26.2°, 39.4 to 40.2°, 53.2 to 53.5°, and 64 to 64.2° with concurrent decrease in the peak intensity and decrease in the crystallite size to 7.8 nm using the same (211) plane (Figure 2b), supporting the incorporation of F– into the HAp lattice. The decrease in crystallite size (7.8–38.5 nm) after the F– adsorption can be attributed to the cooperative dispersion of the F–-adsorbed crystals present in the agglomerated HAp particles. The peak shift can be attributed to the adsorption of F– ions onto the heterogeneous surface of HAp through exchangeable cations.36 The adsorption of F– ions might also occur through either physical or chemical adsorption or both on the HAp surface.
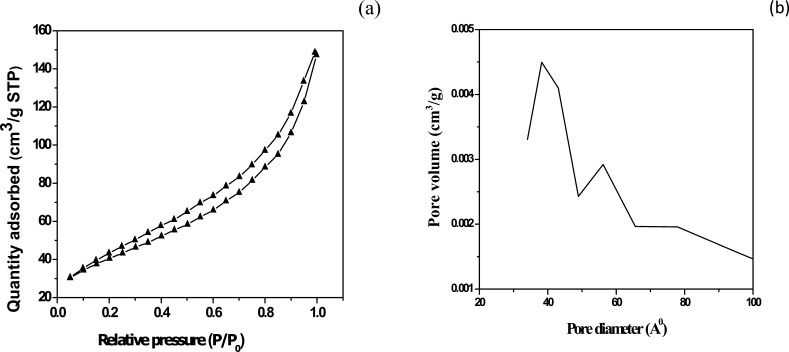
The N2 adsorption–desorption isotherm and pore size distribution of HAp are shown in Figure 3a,b. The isotherm exhibited a type IV curve (Figure 3a) with a hysteresis loop corresponding to a mesoporous material.37 The BET surface area was calculated to be 144.043 m2/g. An abrupt increase in the surface area of the synthesized powder can be attributed to the removal of volatile materials because of calcinations at 900 °C. The distribution of pore diameters was plotted following the BJH nitrogen desorption (Figure 3b). A sharp peak at 38.2 Å showed that most of the pores have diameters of ∼3.8 nm. The high value of the surface area indicates that the synthesized material is a potential adsorbent, and thus the adsorbate could be comfortably adsorbed on the synthesized HAp surface.
Figure 3.
(a) Typical N2 adsorption–desorption isotherms for HAp and (b) BJH plot of pore size distribution of HAp.
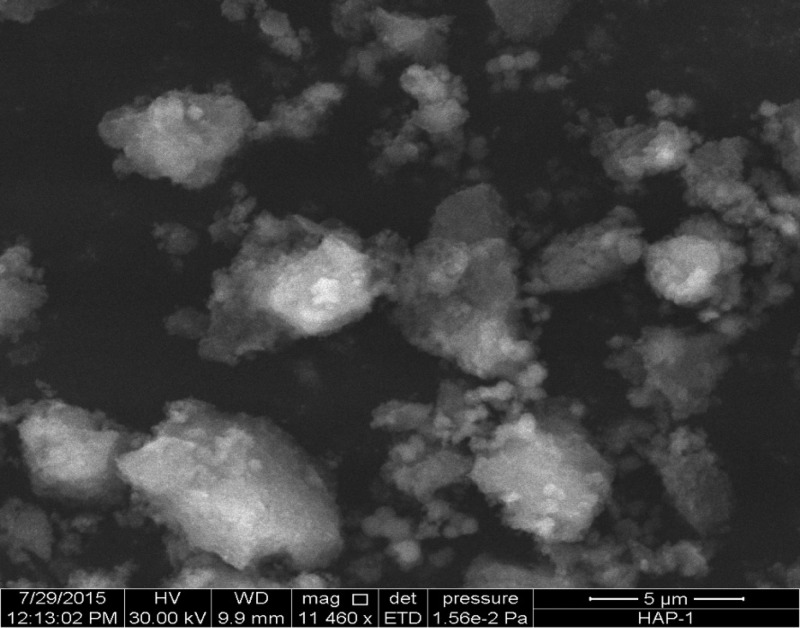
The SEM image of the synthesized HAp clearly indicates the irregular but fragile nature of the granules, indicating that the synthesized minerals for agglomeration have a dense porous surface texture with a maximum size within 5–7 μm (Figure 4).
Figure 4.
SEM image of HAp synthesized from egg shells.
3.2. Adsorption Study of F– Ion by Batch Experiments
3.2.1. Effect of Adsorbent Dose
The amount of F– ions (in mg) adsorbed per unit g (qt) and the percentage of removal efficiency of HAp were calculated as a function of the amount of added HAp to determine the optimum adsorbent dose for further studies. The results are shown in Figure 5. The amount of HAp was varied from 0.2 to 1.2 g with a constant initial F– ion concentration of 10 mg/100 mL and agitation time of 60 min at room temperature (25 ± 2 °C). The percentage removal of the F– ion per unit mass of the adsorbent increased with the increase in the amount of adsorbent till a plateau of ∼87% was achieved. The increase in removal efficiency was attributed to the generation of more active sites for the adsorption of F– ions because of an increase in the surface area with the increase in the adsorbent dose. The appearance of a plateau beyond 3 g/L of HAp indicates that at this dose, the equilibrium between F– ions in a bulk aqueous medium and the adsorbed fluoride on the HAp surface was established when the initial F– ion concentration was 10 mg.
Figure 5.
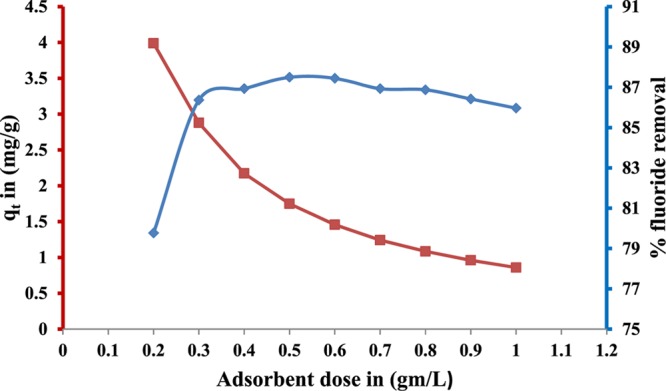
Effect of adsorbent dosage on the adsorption of F– ions onto nanocrystalline HAp. Experimental conditions: pH = 6; initial F– ion concentration, 10 mg; contact time, 60 min; and temperature, 25 ± 2 °C.
However, the amount of F– ions adsorbed per unit g of HAp (qt) decreased with the increase in the amount of adsorbent. This is probably because of the predominance of HAp–HAp interaction over F– ion–HAp interaction at a higher dose of HAp. At a higher dosage, the interaction between HAp–HAp particles became stronger, leading to the conglomeration of exchanger particles.38 Therefore, the active sites would overlap, hindering appreciable increase in the effective surface area with dosage. At the adsorbent dose of 3 g/L, the qt and percentage removal of F– were 3.1 mg/g and 86.3%, respectively. Thus, the 3 g/L dose was maintained in further studies.
3.2.2. Effect of pH and F– Ion Adsorption Mechanism
The point of zero charge (PZC) of virgin HAp was investigated by following the method reported previously.39 The PZC at pH 8 (Figure 6) supported the existence of isolated surface OH groups on the surface of the synthesized HAp.
Figure 6.
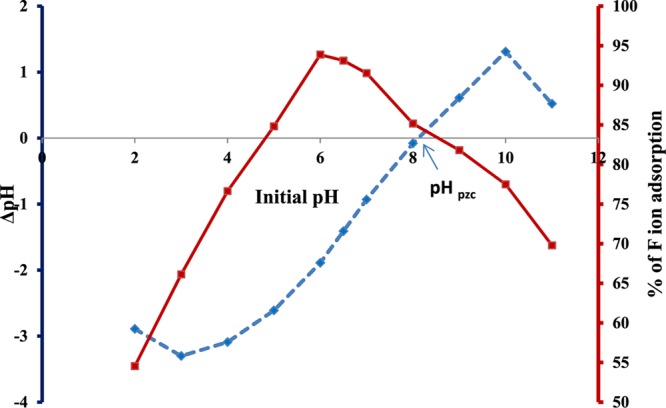
Effect of pH on percentage removal of F– ions (solid line) and on virgin synthesized HAp (dotted line).
The effect of pH on the surface charge of HAp particles can be attributed to the protonation and ionization of the OH functional groups present at the HAp–water interface. The OH group would be protonated below pH 8 and ionized above pH 8. The driving force for the adsorption of a negatively charged F– ion on such a surface would therefore be due to ion pair formation (F–···OH2+), H-bonding (F–···H···O), or ion exchange (F– will exchange OH–). The more the adsorption of the F– ion on the HAp surface, the more is the percentage of removal. The percentage of F– ions adsorbed by HAp powder was determined by varying pH while keeping the rest of the parameters constant. As shown in Figure 6, the removal process was found to be insignificant at a low pH. The removal percentage gradually increased from 54.5% to a maximum of 93.87% at pH 2–6, above which, the removal efficiency decreased with further increase in pH. Had the adsorption been purely electrostatic in nature, the removal efficiency would have increased upto pH 8 because of the facilitation of F–···OH2+ interaction and decreased above pH 8 owing to the electrostatic repulsion between ionized O– and F–. The maximum removal at pH 6 clearly indicated that apart from these interactions, some other mechanisms are also operating. A literature survey showed that below pH 4.8, the formation of Ca(OH)2 and stable dicalcium phosphate is facilitated in an aqueous HAp solution,40 as shown in eq 6. On the other hand, under highly acidic conditions, the high value of the mobile H+ ion concentration favors the formation of weakly ionized HF, subsequently generating HF2– and H2F+ through homoassociation (eq 8), thus decreasing the effective free F– ion concentrations in the solution phase.41 Because of these two phenomena, the maximum removal of the F– ion occurred at pH 6. The adsorption of F– ions on the HAp surface containing isolated OH groups might also occur through ion exchange, forming fluorapatite according to eq 9, as is also evident from the FTIR studies.
| 6 |
| 7 |
| 8 |
| 9 |
Similar behavior has been observed for the adsorption capability of the BSA protein42 and dispersed Blue SBL43 on the HAp interface. Therefore, the pH was maintained at 6 during further studies.
3.2.3. Effect of Contact Time and Adsorption Kinetic Studies
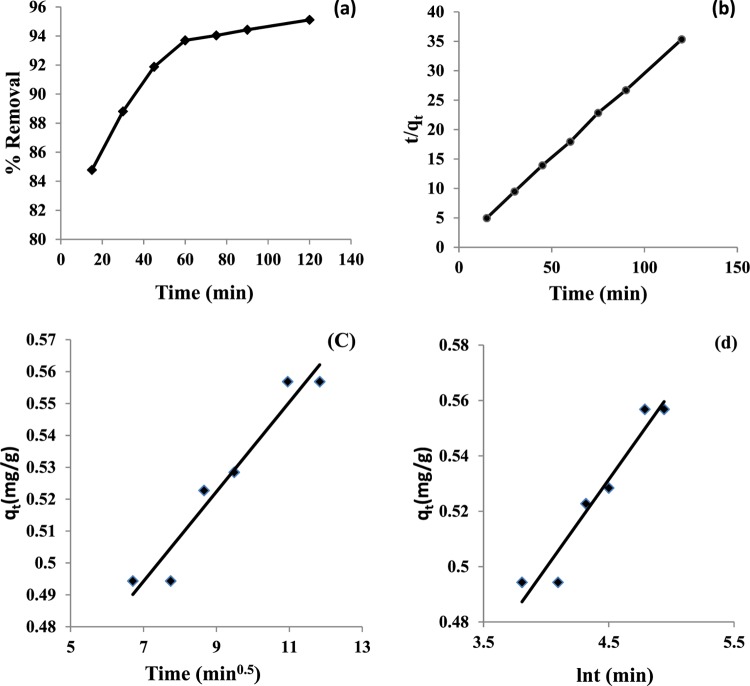
The variation of percentage removal of F– ions by HAp with time was studied by varying time in the range of 15–120 min, keeping the adsorbent dose and pH of the medium at 3 g/L and 6, respectively. The adsorption density of F– ions increased with increase in time until a plateau was attained at 60 min (Figure 7a), possibly owing to the achievement of the equilibrium of F– ions between the bulk aqueous solution and adsorbed layer on the HAp surface. The adsorbed layer could be presumed to be a monolayer after 1 h only if the adsorption occurred through one-to-one interactions exclusively between F– ions and the surface OH group because of electrostatic, exchange, or H-bonding interactions.
Figure 7.
(a) Effect of contact time vs percentage removal of F– ions onto HAp, (b) Lagergren pseudo-second-order kinetics, (c) intraparticle diffusion model, and (d) Elovich model. Experimental conditions: adsorbent dose, 3 g/L; initial F– ion concentration, 10 mg; pH = 6; temperature, 25 ± 2 °C.
To understand the mechanism and kinetics of adsorption of F– ions onto the HAp surface, the experimental data were fitted to different kinetic models, and the data were examined.
3.2.3.1. Pseudo-First-Order Kinetic Model
For simple adsorption processes, the Lagergren pseudo-first-order kinetics is suitable to cause saturation only for the initial 20–30 min of contact time.44 The kinetic model is described in eq 10.
| 10 |
where qe and qt (both in mg/g) are the amounts of F– ions adsorbed at equilibrium and time t. The adsorption rate constant, k1 (min–1), was calculated from the plots of ln(qe – qt) versus time. As described in Figure S1, the correlation coefficient (R2) and k1 were very low, indicating that the sorption kinetics are not of first order in this case. Thus, the sorption process would take a longer time to reach equilibrium.
3.2.3.2. Pseudo-Second-Order Kinetic Model
The Lagergren pseudo-second-order kinetic model45 is based upon the assumption that it is a one-step process, and the rate-limiting step may be chemical adsorption, involving valence forces by sharing or exchanging electrons between the adsorbent and adsorbate.46 The phenomenon is best described by the kinetic eq 11.
| 11 |
The rate constant k2 (g/(mg·min)) and qe (mg/g) for the adsorption of F– ions were evaluated from the intercept and slope of the linear kinetic plots between t/qt and time (Figure 7b). A high correlation coefficient R2 (0.999) and rate constant k2 (0.108 g/(mg·min)) were obtained from the pseudo-second-order kinetics equation, indicating that the rate-limiting step involves chemisorption phenomena. The initial adsorption rate h (mg/(g·min)) was calculated using eq 12 and is shown in Table 1.
| 12 |
Table 1. Kinetic Parameters for Fluoride Adsorption.
| Lagergren pseudo-first-order isotherm |
Lagergren pseudo-second-order isotherm |
Elovich
model |
intraparticle diffusion
model |
|||||||||
|---|---|---|---|---|---|---|---|---|---|---|---|---|
| k1 (min–1) | qe (mg/g) | R2 | k2 (g/(mg·min)) | qe (mg/g) | h (mg/(g·min)) | R2 | α (mg/g·min) | β (g/mg) | R2 | Ci (mg/g) | ki (mg/(g·min)0.5) | R2 |
| 0.095 | 2.20 | 0.875 | 0.108 | 3.46 | 1.29 | 0.999 | 3.029 | 15.87 | 0.945 | 0.395 | 0.014 | 0.941 |
3.2.3.3. Intraparticle Diffusion Model
The intraparticle diffusion model47 (eq 13) was used to determine the occurrence of the intraparticle diffusion mechanism during the rate-controlling step of F– ion adsorption.
| 13 |
As shown in Figure 7c, the plot of qt versus t0.5 produced a straight line (R2 = 0.941) that did not pass through the origin, validating the intraparticle diffusion model in the F– ion adsorption process on the adsorbent surface. However, the low values of the intraparticle diffusion rate constant ki (0.014 mg/(g·min)0.5) and layer thickness Ci (0.395 mg/g) indicated that the step involving intraparticle diffusion might not be the sole rate-limiting step.
3.2.3.4. Elovich Model
The analyses of adsorption rate data using the Elovich equation (eq 14) show the nature of chemisorption kinetics (homogenous or heterogenous) and the number of steps (one step or multiple steps) that contribute to the rate of adsorption. According to Parravano and Boudart,48 several different processes, including bulk and surface diffusion as well as heterogenous chemisorptions of gases on solid surfaces, could be comfortably described by the Elovich equation49
| 14 |
where α is the initial sorption rate and β is the extent of surface coverage during the chemisorptions. The parameters α and β were obtained from the intercept and slope of the linear plot of qt versus ln t (Figure 7d). The high values of α (3.0291 mg/(g·min)) and β (15.873 g/mg) and R2 = 0.945 indicate that the adsorption follows chemisorption. Thus, the physisorption mechanism cannot be the only probable mechanism to account for the adsorption of the F– ion at the HAp/water interface (Table 1).
3.2.4. Thermodynamics of Adsorption
The effect of temperature on the progress of adsorption was studied in the range 15–60 °C with the initial F– ion concentration of 10 mg to ascertain the spontaneity of adsorption, and eqs 15–17 were used to evaluate the different thermodynamic parameters.
| 15 |
| 16 |
| 17 |
where ΔG° corresponds to the Gibb’s free energy change, and ΔS° and ΔH° are the entropy and enthalpy changes, respectively. Ce is the concentration at equilibrium (mg/L), R is the ideal gas constant (8.314 J/(K·mol)), and T is the temperature in Kelvin. The equilibrium constant, Kc, was obtained from the ratio of qe and Ce (in mg/g). The values of ΔH° and ΔS° were calculated from the slope and intercept of the van’t Hoff plot of ln Kc against 1/T in Kelvin (Figure 8). The values of ΔG° at different temperatures were calculated using eq 18.
| 18 |
The values of ΔG° ranged from −4.162 to −8.23 kJ/mol, indicating that the adsorption is both physisorption and spontaneous.50 However, the ΔH° values calculated using eq 15 were positive (18.57 kJ/mol), indicating that the adsorption is endothermic. The endothermic nature of the reaction can be attributed to the fact that at higher temperatures, the free volume of adsorbent pores increases because of the increased movement of the solute,51 thus enhancing the adsorption unlike the usual adsorption phenomena. The value of ΔH° within the range 1–93 kJ/mol indicates that the adsorption is governed by a physical process.52 The positive value of ΔS° (80.93 J/mol) can be attributed to the randomness caused by the release of the solvated water molecules present on the surface of the HAp because of adsorption. Thus, a rigid adsorbed layer was formed because of the increase in the randomness of the surrounding bulk media. The analysis results are shown in Table 2.
Figure 8.
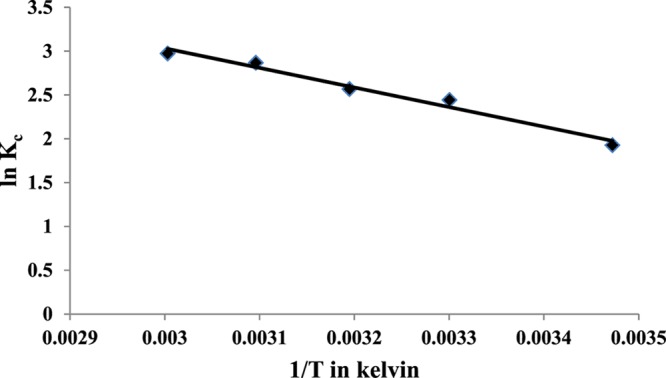
Plot of ln Kc vs 1/T for the adsorption of F– ions onto HAp.
Table 2. Thermodynamic Parameters for the Adsorption of F– Ions on the HAp Surface.
| ΔG (kJ/mol) |
||||||||
|---|---|---|---|---|---|---|---|---|
| initial F– concentration | ΔH0 (kJ/mol) | ΔS0 (J/mol) | 15 °C | 30 °C | 40 °C | 50 °C | 60 °C | R2 |
| 10 ppm | 18.57 | 80.93 | –4.61 | –6.15 | –6.68 | –7.70 | –8.23 | 0.977 |
3.2.5. Effect of Initial F– Ion Concentration and Adsorption Isotherm
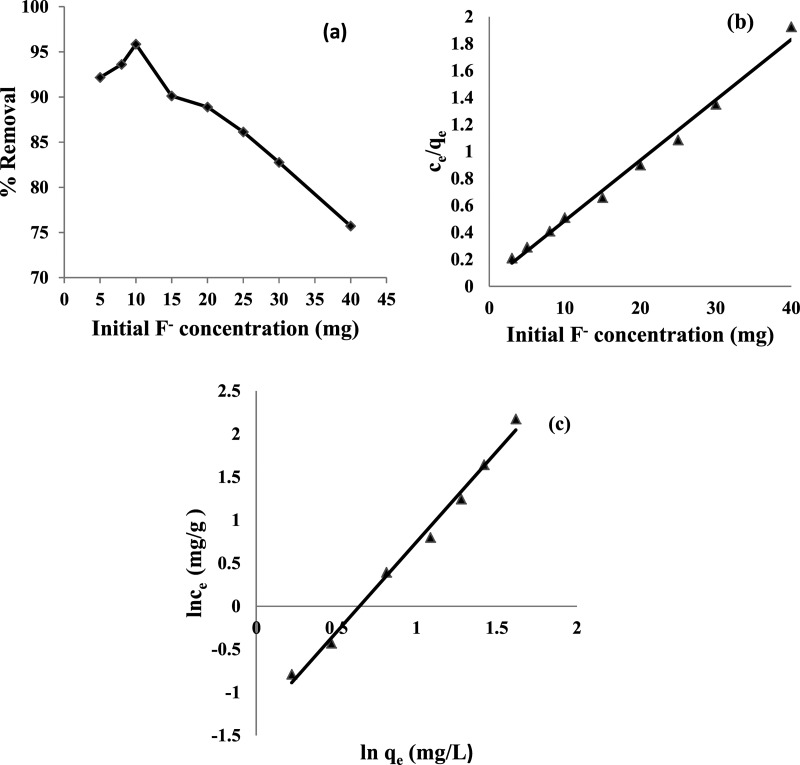
Batch experiments were performed to obtain the adsorption isotherm by determining the percentage of F– ion removal as a function of the initial F– ion concentration (5–40 mg), maintaining the optimum adsorbent dose and temperature. A maximum of 95.85% removal was obtained at the initial F– ion concentration of 10 mg/L; a significant decrease was observed above that (Figure 9a). The higher uptake of F– ion at a low concentration can be attributed to the availability of active sites on the surface of HAp for a limited number of adsorbate species. At a higher concentration, the percentage removal decreased due to the unavailability of vacant sites on the surface of HAp to accommodate excess F– ions.
Figure 9.
(a) Effect of initial F– ion concentration vs % removal of fluoride, (b) Langmuir adsorption plot, and (c) Freundlich adsorption isotherm. Experimental conditions: adsorbent dose, 3 g/L; pH of the solution, 6; temperature, 25 ± 2 °C; and contact time, 60 min.
The relationship between the equilibrium of F– ion adsorbed and solute concentration was verified using various isotherms. A linear Langmuir adsorption isotherm model (Figure 9b and eq 19) valid for monolayer sorption onto a homogenous surface with a definite number of identical sites53 was tested.
| 19 |
where qe is the amount of F– ions adsorbed at equilibrium (mg/g), and Ce is the equilibrium adsorbate concentration (mg/L). The values of the Langmuir constant, b (binding energy constant) and q0 (monolayer adsorption capacity in mg/g) relate to the energy and capacity of adsorption, respectively. To compute the adsorption efficiency, another dimensionless parameter, r, should be calculated from the binding constant, b, obtained using eq 20
| 20 |
where C0 is the initial concentration of F– ions (mg/L), and r is the Langmuir isotherm constant. The feasibility of adsorption can be evaluated from the values of r, that is, r > 1 (unfavorable), r = 1 (linear), 0 < r < 1 (favorable), and r = 0 (irreversible). The calculated value of r for the initial F– ion concentration of 10 mg/L was 0.1. The maximum adsorption capacity was 22.3 mg/g. The larger b value (>0.1) indicated the greater affinity of the adsorbent toward F– ion adsorption.
The Freundlich isotherm supports the effectiveness of multilayer sorption on heterogeneous surfaces. The linear form of the Freundlich model54 is shown in eq 21, where qe is the amount of F– ions adsorbed at equilibrium time (mg/g), Cr is the residual concentration of F– ions in the solution (mg/L), and Kf and n are Freundlich constants.
| 21 |
Depending upon the nature of adsorbate and adsorbent, n represents the extent of adsorption intensity, and Kf represents the adsorption capacity. Figure 9c shows that the values of Kf, n, and R2 are 0.044 mg/g, 0.476, and 0.992, respectively. These values are listed in Table 3. Because both the models provided a good correlation coefficient, it was assumed that both the sorption models fit to explain the sorption mechanism.
Table 3. Parameters of Langmuir and Freundlich Isotherms at pH 6 and 25 ± 2 °C.
| Langmuir isotherm | Freundlich isotherm | ||
|---|---|---|---|
| q0 (mg/g) | 22.3 | 1/n | 2.098 |
| b | 0.849 | Kf (mg/g) | 0.044 |
| r | 0.1 | ||
| R2 | 0.991 | R2 | 0.992 |
3.3. Desorption and Regeneration Studies
Desorption of F– ions followed by regeneration of synthesized HAp mainly depends on the extent of desorption of the F– ions from the loaded HAp surface. To ensure the reproducibility and nature of adsorption, that is, physical or chemical, the pH variation method (pH 2–10) was selected to desorb the F– ions from the resulting fluorapatite due to the adsorption of F– ions. Regeneration (91.59%) could be achieved at pH 7, indicating ease of regeneration in low alkalinity of the medium, and hence HAp can be used for several cycles (Figure S2). Under less alkaline conditions, the F– ion was easily desorbed from the surface of HAp owing to the significant reduction in (i) the complexation of F– with H+, (ii) positively charged surface density over HAp, and (iii) increase in the repulsion of the F– ion with the negatively charged adsorbent surface.
3.4. Reusability Study of Adsorbent
Reusability is an essential part of adsorption studies, indicating the recovery of the adsorbent and hence the cost effectiveness of the process. This study was carried out by carrying out several adsorption/desorption cycles (1–6) with an adsorbent dose of 3 g/L at a temperature of 25 ± 2 °C. The pH of the solution was maintained at 7, that is, the maximum pH obtained from the regeneration study. The maximum % removal of F– ion took place in cycle 1, that is, 94.31% (Figure S3). Thus, the study shows that the regenerated adsorbent could be used for fluoride removal to a reasonable extent (up to 63.63% fluoride removal) for up to the fourth cycle.
3.5. Analysis of Molecular Parking Area
The molecular parking area, that is, the area occupied by F– ions at the interface during the maximum adsorption, shows the qualitative as well as quantitative interactions of F– ion on the HAp surface. If the adsorption exclusively occurs through the direct exchange of OH– with the F– ion, the adsorption would decrease with the increase in pH because of electrostatic repulsion. The calculated maximum molecular parking area was 481.4 Å2 (Figure 10) at a lower concentration, which subsequently decreased to a constant value with the increase in F– ion concentration. This observation is a direct consequence of the fact that a high adsorption capacity of F– ions primarily occurs through H-bonding with the surface OH groups along the channel.55 Again through electrostatic attraction, the fluorapatite is formed after the kinetically controlled supersaturation by F– ions. At a higher concentration of F– ions, besides electrostatic interaction, the adsorption of F– ions also probably occurred through the weak London dispersion forces between the adsorbed F– ions and F– ions in the bulk aqueous phase at the same sites, thereby decreasing the molecular parking area. Therefore, the adsorption is both physisorptive and chemisorptive in nature. The validity of both Langmuir and Freundlich equations also supported our proposition.
Figure 10.
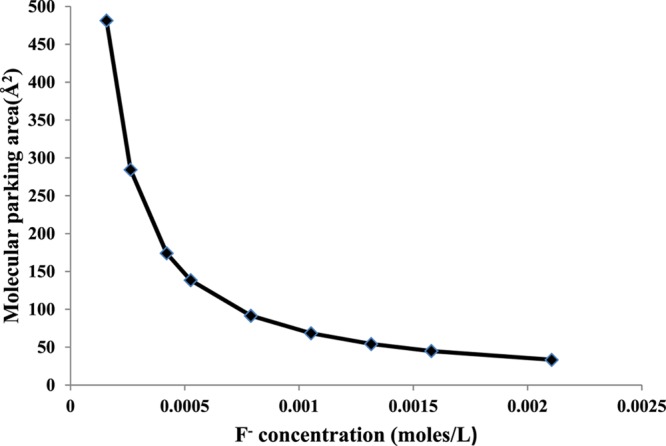
Effect of initial F– ion concentration vs molecular parking area.
4. Conclusions
In this study, HAp was synthesized and its fluoride removal efficiency was investigated. The fluoride removal efficiency of the synthesized HAp was up to 95% at pH 6.0 within a short time (60 min). Therefore, the synthesized HAp is useful for commercial applications. The adsorption of the F– ion followed second-order kinetics, indicating that chemisorptions are the rate-limiting step. As already noted from batch experiments, the interfacial conditions may favor the formation of F–-loaded HAp through either ion pair formation (F–···OH2+), H-bonding (F–···H···O), or ion exchange (F– ions exchange with OH– ions) in the aqueous phase. The temperature has a positive effect on the percentage of fluoride removal, indicating that the adsorption of F– ions onto HAp is endothermic and spontaneous. The adsorption data followed Langmuir and Freundlich isotherms, indicating that the surface of the adsorbent was heterogeneous. The molecular parking area analysis showed that the adsorption of F– ions on the HAp surface is governed by both physical and chemical forces. After desorption, the HAp was easily regenerated and reused up to four cycles for allowed defluoridation. A comparison of the efficiency of F– ion removal with previous results reported so far (Table 4) showed that the synthesized adsorbent is equally effective for fluoride removal.53,56−64 Because egg shells are calcium-enriched materials, and it is easy to procure these materials worldwide as a result of daily human activity, the HAp preparation reported in this study is economical and universally applicable. Furthermore, because this HAp preparation does not require extensive preprocessing and is not time consuming, the fluoride removal process using this HAp is a sustainable and economically viable technology.
Table 4. Comparison of the Efficiency of Synthesized Adsorbent with Previously Reported Adsorbents.
| adsorbent | adsorbent dose (g/L) | fluoride concentration range (mg/L) | adsorbent capacity (mg/g) | pH | ref |
|---|---|---|---|---|---|
| regenerated spent bleaching earth | 10 | 2.5–8 | 0.6 | 7 | (56) |
| quick lime | 5 | 10–100 | 9.7 | (53) | |
| synthetic nano HAp | 4 | 3–80 | 4.575 | 5–6 | (57) |
| HAp | 20 | 3–80 | 1.432 | 5 | (58) |
| nanosized HAp | 0.2 | 50 | 3.44 | 5 | (59) |
| cellulose@hydroxyapatite nanocomposites | 4 | 10 | 4.2 | 6.5 | (60) |
| Al-modified hydroxyapatite (Al-HAP) | 0.5 | 5–50 | 32.57 | 7 | (61) |
| nHAp derived from PG | 1 | 10–50 | 19.74–40.81 | 2–11 | (62) |
| egg shell | 24 | 5 | 1.09 | 6 | (63) |
| commercial HAp | 8 | 2–15 | 1.76 | 6 | (64) |
| hydroxyapatite | 3 | 10 | 22.3 | 6 | the present study |
Acknowledgments
B.N. acknowledges the financial support from Tata Refractories Limited (TRL), Odisha, for providing the J.J. Ghandy Fellowship. The support of UGC (No. F.540/14/DRS/2013 (SAP-I)) and DST (SR/FST/CSII-021/2012(G)) is also gratefully acknowledged.
Supporting Information Available
The Supporting Information is available free of charge on the ACS Publications website at DOI: 10.1021/acsomega.7b00370.
Figures S1–S3 with brief descriptions (PDF)
The authors declare no competing financial interest.
Supplementary Material
References
- Deshmukh W. S.; Attar S. J. Equilibrium analysis for batch studies of adsorption of fluoride in water using activated Alumina R and D 651-X. Int. J. Chem. Sci. 2008, 6, 1900–1912. [Google Scholar]
- Das K. M.; Attar S. J. Comparative study of batch adsorption of fluoride using commercial and natural adsorbent. Res. J. Chem. Sci. 2011, 1, 68–75. [Google Scholar]
- WHO , Chemical Fact Sheets: Fluoride, 3rd ed., Guidelines for Drinking Water Quality (Electronic Resource): Incorporation First Addendum. Recommendations; WHO, Geneva, 2006; Vol. 1, pp 375–377. [Google Scholar]
- Gandhi N.; Sirisha D.; Chandra Shekar K. B.; Asthana S. Removal of fluoride from water and waste water by using low cost adsorbents. Int. J. ChemTech Res. 2012, 4, 1646–1653. [Google Scholar]
- Fan X.; Parker D. J.; Smith M. D. Adsorption of fluoride on low cost materials. Water Res. 2003, 37, 4929–4937. 10.1016/j.watres.2003.08.014. [DOI] [PubMed] [Google Scholar]
- Kagne S.; Jagtap S.; Dhawade P.; Kamble S. P.; Devotta S.; Rayalu S. S. Hydrated cement: a promising adsorbent for the removal of fluoride from aqueous solution. J. Hazard. Mater. 2008, 154, 88–95. 10.1016/j.jhazmat.2007.09.111. [DOI] [PubMed] [Google Scholar]
- Lavecchia R.; Medici F.; Piga L.; Rinaldi G.; Zuorro A. Fluoride Removal from Water by Adsorption on a High Alumina Content Bauxite. Chem. Eng. Trans. 2012, 26, 225–230. 10.3303/CET1226038. [DOI] [Google Scholar]
- Srimurali M.; Pragathi A.; Karthikeyan J. A study on removal of fluoride from drinking water by adsorption onto low cost materials. Environ. Pollut. 1998, 99, 285–289. 10.1016/S0269-7491(97)00129-2. [DOI] [PubMed] [Google Scholar]
- Yang M.; Hashimoto T.; Hoshi N.; Myoga H. Fluoride removal in a fixed bed packed with granular calcite. Water Res. 1999, 33, 3395–3402. 10.1016/S0043-1354(99)00052-4. [DOI] [Google Scholar]
- Piekos R.; Paslawaska S. Fluoride uptake characteristic of fly ash. Fluoride 1999, 32, 14–19. [Google Scholar]
- Çengeloğlu Y.; Kir E.; Ersöz M. Removal of fluoride from aqueous solution by using red mud. Sep. Purif. Technol. 2002, 28, 81–86. 10.1016/S1383-5866(02)00016-3. [DOI] [Google Scholar]
- Dey S.; Goswami S.; Ghosh U. C. Hydrous ferric oxide (HFO) - a scavenger for fluoride from contaminated water. Water, Air, Soil Pollut. 2004, 158, 311–323. 10.1023/B:WATE.0000044854.71497.b6. [DOI] [Google Scholar]
- Goswami S.; Dey S.; Ghosh U. C. Studies on removal of fluoride by hydrated zirconium oxide (HZO). Chem. Environ. Res. 2004, 13, 117–126. [Google Scholar]
- Saha S. Treatment of aqueous effluent for fluoride removal. Water Res. 1993, 27, 1347–1350. 10.1016/0043-1354(93)90222-4. [DOI] [Google Scholar]
- Hichour M.; Persin F.; Sandeaux J.; Gavach C. Fluoride removal from waters by donnan dialysis. Sep. Purif. Technol. 1999, 18, 1–11. 10.1016/S1383-5866(99)00042-8. [DOI] [Google Scholar]
- Wasay A. S.; Haron Md. J.; Tokunaga S. Adsorption of fluoride, phosphate and arsenate ions on lanthanum impregnated silica gel. Water Environ. Res. 1996, 68, 295–300. 10.2175/106143096X127730. [DOI] [Google Scholar]
- Jamode A. V.; Sapkal V. S.; Jamode V. S. Defluoridation of water using inexpenive adsorbents. J. Ind. Inst. Sci. 2004, 84, 163–171. [Google Scholar]
- Jamode A. V.; Sapkal V. S.; Jamode V. S.; et al. Adsorption kinetics of defluoridation using low cost adsorbents. Adsorpt. Sci. Technol. 2004, 22, 65–73. 10.1260/026361704323151006. [DOI] [Google Scholar]
- Gupta V. K.; Carrott P. J. M.; Carrott R.; Suhas M. M. L. Low cost adsorbents: growing approach to wastewater treatment–a review. Crit. Rev. Environ. Sci. Technol. 2009, 39, 783–842. 10.1080/10643380801977610. [DOI] [Google Scholar]
- Dybowska A.; Manning D. A. C.; Collins M. J.; Wess T.; Woodgate S.; Valsami-Jones E. An evaluation of the reactivity of synthetic and natural apatites in the presence of aqueous metals. Sci. Total Environ. 2009, 407, 2953–2965. 10.1016/j.scitotenv.2008.12.053. [DOI] [PubMed] [Google Scholar]
- Heise U.; Osborn J. F.; Duwe F. Hydroxyapatite ceramic as a bone substitute. Int. Orthop. 1990, 14, 329–338. 10.1007/BF00178768. [DOI] [PubMed] [Google Scholar]
- Suchanek W.; Yoshimura M. Processing and properties of hydroxyapatite-based biomaterials for use as hard tissue replacement implants. J. Mater. Res. 1998, 13, 94–117. 10.1557/JMR.1998.0015. [DOI] [Google Scholar]
- Jarlbring M.; Sandstrom D. E.; Antzutkin O. N.; Fosling W. Characterization of active phosphorus surface sites at synthetic carbonate-free fluorapatite using single-pulse 1H, 31P, and 31P CP MAS NMR. Langmuir 2006, 22, 4787–4792. 10.1021/la052837j. [DOI] [PubMed] [Google Scholar]
- Tanaka H.; Yasukawa A.; Kandori K.; Ishikawa T. Surface modification of calcium hydroxyapatite with hexyl and decyl phosphates. Colloids Surf., A 1997, 125, 53–62. 10.1016/S0927-7757(96)03876-9. [DOI] [Google Scholar]
- Eric M.; Rivera M. Hydroxyapatite-based materials: synthesis and characterization. Biomed. Eng.: Front. Challenges 2011, 76–98. 10.5772/19123. [DOI] [Google Scholar]
- Guzḿan V. C.; Pĩna Barba C.; Mungúıa N. Stoichiometric hydroxyapatite obtained by precipitation and sol gel processes. Rev. Mex. Fis. 2005, 51, 284–293. [Google Scholar]
- APHA , AWWA, Standard Methods for the Examination of Water and Wastewater, 19th ed., Washington, DC, 1995.
- Misra P. K.; Mishra B. K.; Somasundaran P. Organization of amphiphiles V. In situ fluorescence probing of the adsorbed layers of polyoxyethylated alkyl phenols at silica–water interfaces. J. Colloid Interface Sci. 2003, 265, 1–8. 10.1016/S0021-9797(03)00234-0. [DOI] [PubMed] [Google Scholar]
- Koutsopoulos S. Synthesis and characterization of hydroxyapatite crystals: a review study on the analytical methods. J. Biomed. Mater. Res. 2002, 62, 600–612. 10.1002/jbm.10280. [DOI] [PubMed] [Google Scholar]
- Landi E.; Celotti G.; Logroscino G.; Tampieri A. Carbonated hydroxyapatite as bone substitute. J. Eur. Ceram. Soc. 2003, 23, 2931–2937. 10.1016/S0955-2219(03)00304-2. [DOI] [Google Scholar]
- Kanno C. M.; Sanders R. L.; Flynn S. M.; Lessard G.; Myneni S. C. B. Novel apatite-based sorbent for defluoridation: synthesis and sorption characteristics of nano-micro-crystalline hydroxyapatite- coated-limestone. Environ. Sci. Technol. 2014, 48, 5798–5807. 10.1021/es405135r. [DOI] [PubMed] [Google Scholar]
- Mourabet M.; El Rhilassi A.; El Boujaady H.; Bennani-Ziatni M.; El Hamri R.; Taitai A. Removal of fluoride from aqueous solution by adsorption on hydroxyapatite (HAp) using response surface methodology. J. Saudi Chem. Soc. 2015, 19, 603–615. 10.1016/j.jscs.2012.03.003. [DOI] [Google Scholar]
- Ayoob S.; Gupta A. K.; Bhakat P. B.; Bhat V. T. Investigations on the kinetics and mechanisms of sorptive removal of fluoride from water using alumina cement granules. Chem. Eng. J. 2008, 140, 6–14. 10.1016/j.cej.2007.08.029. [DOI] [Google Scholar]
- Mondal S.; Mondal B.; Dey A.; Mukhopadhyay S. S. Studies on processing and characterization of hydroxyapatite biomaterials from different bio wastes. J. Miner. Mater. Charact. Eng. 2012, 103, 55–67. 10.4236/jmmce.2012.111005. [DOI] [Google Scholar]
- Tran N. H.; Hartmann A. J.; Lamb R. N. Structural order of nanocrystalline ZnO films. J. Phys. Chem. B 1999, 21, 4264–4268. 10.1021/jp9836426. [DOI] [Google Scholar]
- Chen N.; Zhang Z.; Feng C.; Li M.; Chen R.; Sugiura N. Removal of fluoride from aqueous solution by adsorption onto Kanuma mud. Water Sci. Technol. 2010, 62, 1888–1897. 10.2166/wst.2010.472. [DOI] [PubMed] [Google Scholar]
- Shum H. C.; Bandyopadhyay A.; Bose S.; Weitz D. A. Double emulsion droplets as microreactors for synthesis of mesoporous hydroxyapatite. Chem. Mater. 2009, 21, 5548–5555. 10.1021/cm9028935. [DOI] [Google Scholar]
- Tahir H. Comparative trace metal contents in sediments and the removal of chromium using Zeolite-5A. EJEAFChe, Electron. J. Environ., Agric. Food Chem. 2005, 4, 1021–1032. [Google Scholar]
- Barathi M.; Kumar A. S. K.; Rajesh N. Efficacy of novel Al–Zr impregnated cellulose adsorbent prepared using microwave irradiation for the facile defluoridation of water. J. Environ. Chem. Eng. 2013, 1, 1325–1335. 10.1016/j.jece.2013.09.026. [DOI] [Google Scholar]
- Corbridge D. E. C.Phosphorus: Chemistry, Biochemistry and Technology, 6th ed.; Taylor Francis Group: Boca Raton, Florida, 2013; p 202. [Google Scholar]
- Housecroft C. E.; Sharpe A. G.. Inorganic Chemistry, 2nd ed.; Pearson Education Limited: Gosport, U.K., 2001; pp 1–949. [Google Scholar]
- Yin G.; Liu Z.; Zhan J.; Ding F.; Yuan N. Impacts of the surface charge property on protein adsorption on hydroxyapatite. Chem. Eng. J. 2002, 87, 181–186. 10.1016/S1385-8947(01)00248-0. [DOI] [Google Scholar]
- Noureddine B.; Samir Q.; Ali A.; Abederrahman N.; Yhya A. Adsorption of Disperse Blue SBL dye by synthesized poorly crystalline hydroxyapatite. J. Environ. Sci. 2008, 20, 1268–1272. 10.1016/S1001-0742(08)62220-2. [DOI] [PubMed] [Google Scholar]
- Lagergren S. About the theory of so called adsorption of soluble substances, kungliga svenska vetenskap sakademiens. Handlingar 1898, 24, 1–39. [Google Scholar]
- Ho Y. S.; McKay G. The kinetics of sorption of divalent metal ions onto sphagnum moss peat. Water Res. 2000, 34, 735–742. 10.1016/S0043-1354(99)00232-8. [DOI] [Google Scholar]
- Idris S. A.; Alotaibi K. M.; Peshkur T. A.; Anderson P.; Morris M.; Gibson L. T. Adsorption kinetics: effect of adsorbent pore size distribution on the rate of Cr(VI) uptake. Microporous Mesoporous Mater. 2013, 165, 99–105. 10.1016/j.micromeso.2012.08.001. [DOI] [Google Scholar]
- Weber W. J.; Morris J. C. Kinetics of adsorption on carbon from solution. J. Sanit. Eng. Div., Am. Soc. Civ. Eng. 1963, 89, 31–59. [Google Scholar]
- Parravano G.; Boudart M.. Advances in Catalysis; Frankenburg W. G., Komarewsky V. I., Rideal E. K., Eds.; Academic Press: New York, 1955; Vol. 7, p 47. [Google Scholar]
- Okoye A. I.; Ejikeme P. M.; Onukwuli O. D. Lead removal from wastewater using fluted pumkin seed shell activated carbon: adsorption modeling and kinetics. Int. J. Environ. Sci. Technol. 2010, 7, 793–800. 10.1007/BF03326188. [DOI] [Google Scholar]
- Khan A. A.; Singh R. P. Adsorption thermodynamics of carbofuran on Sn (IV) arsenosilicate in H+, Na+ and Ca2+ forms. Colloids Surf. 1987, 24, 33–42. 10.1016/0166-6622(87)80259-7. [DOI] [Google Scholar]
- Ho Y. S.; McKay G. Sorption of dyes and copper ions onto biosorbents. Process Biochem. 2003, 38, 1047–1061. 10.1016/S0032-9592(02)00239-X. [DOI] [Google Scholar]
- Hema M.; Arivoli S. Adsorption by activated carbon: kinetic and equilibrium studies. Ind. J. Chem. Technol. 2009, 16, 38–45. [Google Scholar]
- Islam M.; Patel R. K. Evaluation of removal efficiency of fluoride from aqueous solution using quick lime. J. Hazard. Mater. 2007, 143, 303–310. 10.1016/j.jhazmat.2006.09.030. [DOI] [PubMed] [Google Scholar]
- Freundlich H. Ueber dye adsorption in loesungen. Z. Phys. Chem. 1907, 57, 385–470. [Google Scholar]
- deLeeuw N. H. Density functional theory calculations of local ordering of hydroxy groups and fluoride ions in hydroxyapatite. Phys. Chem. Chem. Phys. 2002, 4, 3865–3871. 10.1039/b203114k. [DOI] [Google Scholar]
- Malakootian M.; Fatehizadeh A.; Yousefi N.; Ahmadian M.; Moosazadeh M. Fluoride removal using regenerated spent bleaching earth (RSBE) from ground water: Case study on Kuhbonan water. Desalination 2011, 277, 244–249. 10.1016/j.desal.2011.04.033. [DOI] [Google Scholar]
- Gao S.; Cui J.; Wei Z. Study on the fluoride adsorption of various apatite materials in aqueous solution. J. Fluorine Chem. 2009, 130, 1035–1041. 10.1016/j.jfluchem.2009.09.004. [DOI] [Google Scholar]
- Gao S.; Sun R.; Wei Z.; Zhao H.; Li H.; Hu F. Size-dependent defluoridation properties of synthetic hydroxyapatite. J. Fluorine Chem. 2009, 130, 550–556. 10.1016/j.jfluchem.2009.03.007. [DOI] [Google Scholar]
- Wang Y.; Chen N.; Wei W.; Cui J.; Wei Z. Enhanced adsorption of fluoride from aqueous solution onto nanosized hydroxyapatite by low molecular-weight organic acids. Desalination 2011, 276, 161–168. 10.1016/j.desal.2011.03.033. [DOI] [Google Scholar]
- Yu X.; Tong S. M.; Zuo J.; et al. Removal of fluoride from drinking water by cellulose@hydroxyapatite nanocomposites. Carbohydr. Polym. 2013, 92, 269–275. 10.1016/j.carbpol.2012.09.045. [DOI] [PubMed] [Google Scholar]
- Nie Y.; Hu C.; Kong C. Enhanced fluoride adsorption using Al (III) modified calcium hydroxyapatite. J. Hazard. Mater. 2012, 233–234, 194–199. 10.1016/j.jhazmat.2012.07.020. [DOI] [PubMed] [Google Scholar]
- Zhang D.; Luo H.; Zheng L.; Wang K.; Li H.; Wang Y.; Feng H. Utilization of waste phosphogypsum to prepare hydroxyapatite nanoparticles and its application towards removal of fluoride from aqueous solution. J. Hazard. Mater. 2012, 241–242, 418–426. 10.1016/j.jhazmat.2012.09.066. [DOI] [PubMed] [Google Scholar]
- Bhaumik R.; Mondal N. K.; Das B.; Roy P.; Pal K. C.; Das C.; Banerjee A.; Datta J. K. Eggshell powder as an adsorbent for removal of fluoride from aqueous solution: equilibrium, kinetic and thermodynamic studies. E-J. Chem. 2012, 9, 1457–1480. 10.1155/2012/790401. [DOI] [Google Scholar]
- Nayak B.; Samant A.; Naik A. K.; Misra P. K. Analysis of adsorption characteristics of fluoride ion from aqueous solution on hydroxyapatite interface at ambient temperature. Appl. Sci. Adv. Mater. Int. 2015, 1, 215–219. [Google Scholar]
Associated Data
This section collects any data citations, data availability statements, or supplementary materials included in this article.


