

Abstract
Background
How measures of long‐term exposure to elevated blood pressure might add to the performance of “current” blood pressure in predicting future cardiovascular disease is unclear. We compared incident cardiovascular disease risk prediction using past, current, and usual systolic blood pressure alone or in combination.
Methods and Results
Using data from UK primary care linked electronic health records, we applied a landmark cohort study design and identified 80 964 people, aged 50 years (derivation cohort=64 772; validation cohort=16 192), who, at study entry, had recorded blood pressure, no prior cardiovascular disease, and no previous antihypertensive or lipid‐lowering prescriptions. We used systolic blood pressure recorded up to 10 years before baseline to estimate past systolic blood pressure (mean, time‐weighted mean, and variability) and usual systolic blood pressure (correcting current values for past time‐dependent blood pressure fluctuations) and examined their prospective relation with incident cardiovascular disease (first hospitalization for or death from coronary heart disease or stroke/transient ischemic attack). We used Cox regression to estimate hazard ratios and applied Bayesian analysis within a machine learning framework in model development and validation. Predictive performance of models was assessed using discrimination (area under the receiver operating characteristic curve) and calibration metrics. We found that elevated past, current, and usual systolic blood pressure values were separately and independently associated with increased incident cardiovascular disease risk. When used alone, the hazard ratio (95% credible interval) per 20–mm Hg increase in current systolic blood pressure was 1.22 (1.18–1.30), but associations were stronger for past systolic blood pressure (mean and time‐weighted mean) and usual systolic blood pressure (hazard ratio ranging from 1.39–1.45). The area under the receiver operating characteristic curve for a model that included current systolic blood pressure, sex, smoking, deprivation, diabetes mellitus, and lipid profile was 0.747 (95% credible interval, 0.722–0.811). The addition of past systolic blood pressure mean, time‐weighted mean, or variability to this model increased the area under the receiver operating characteristic curve (95% credible interval) to 0.750 (0.727–0.811), 0.750 (0.726–0.811), and 0.748 (0.723–0.811), respectively, with all models showing good calibration. Similar small improvements in area under the receiver operating characteristic curve were observed when testing models on the validation cohort, in sex‐stratified analyses, or by using different landmark ages (40 or 60 years).
Conclusions
Using multiple blood pressure recordings from patients’ electronic health records showed stronger associations with incident cardiovascular disease than a single blood pressure measurement, but their addition to multivariate risk prediction models had negligible effects on model performance.
Keywords: cardiovascular disease, electronic health records, high blood pressure, hypertension, risk prediction
Subject Categories: High Blood Pressure, Cardiovascular Disease, Risk Factors
Short abstract
See Editorial Ahmad and Oparil
Clinical Perspective
What Is New?
Electronic health records capture information about patients’ blood pressure assessed in “usual care” settings, and we used these records to characterize patients’ long‐term blood pressure from multiple, longitudinal measurements taken during their clinic visits over the years.
Using the average of past multiple measurements of systolic blood pressure, as an indicator of long‐term exposure to elevated blood pressure, shows stronger association with incident cardiovascular disease than a single blood pressure measurement.
However, incorporating information on long‐term systolic blood pressure to a multivariable model that included current systolic blood pressure and other risk factors only minimally improved the performance of the model to predict future risk of cardiovascular disease.
What Are the Clinical Implications?
Patients’ previously recorded blood pressure measurements may be used to provide an indication of their “usual” or long‐term blood pressure level, which is useful to help us understand, communicate, and put into context cardiovascular disease risk associated with increased blood pressure.
As information on patient's long‐term blood pressure does not seem to substantially improve cardiovascular disease risk prediction, it has limited clinical utility, such as to aid decisions on initiating pharmacologic treatment to lower blood pressure.
Nevertheless, efforts to prevent long‐term exposure to elevated blood pressure in the population remain important.
Elevated blood pressure is the biggest single contributor to global burden of cardiovascular disease and mortality,1, 2 and its prevention and treatment are central to public health policy and clinical care.3, 4, 5, 6 Commonly used cardiovascular disease risk prediction models use “current” or “baseline” blood pressure level, which is typically measured on a single day, to rank people into different risk categories.7, 8, 9 However, epidemiological studies have shown that current blood pressure values are likely to underestimate risk associations compared with “usual” values that are corrected for expected long‐term fluctuations.10, 11, 12, 13 As studies have shown that the average of repeated blood pressure measurements or their variability is associated with cardiovascular disease risk,14, 15, 16, 17, 18, 19, 20, 21, 22, 23, 24, 25, 26 information about long‐term, cumulative exposure to elevated blood pressure could have potential clinical value. Indeed, some have suggested that the use of all available information about repeated blood pressure measurements that are increasingly becoming available in electronic health records (EHRs) might help improve risk prediction,19, 20, 27 which could be particularly relevant in low absolute risk groups, such as among relatively young adults. However, the clinical utility of models that make use of repeated measures in EHRs remains uncertain. Studies that have investigated risk predictions using long‐term blood pressure have been based on research data sets with repeated blood pressure measurements taken after baseline,18, 19, 20, 21 limiting their application to clinical decision making. Other studies that used historical blood pressure measurements were based on relatively small sample sizes,14, 15, 24, 25, 26 used subclinical condition as a proxy for the disease outcome,16, 17 largely focused on independent risk associations as opposed to the incremental value of measures of cumulative exposure to risk prediction,15, 16, 17, 18, 26 or may have insufficiently adjusted for other cumulative risk exposures, such as age.
In the United Kingdom, a large EHR data set, linking primary care, secondary care, and mortality databases, provides the size, scale, and depth of clinical information that could be used as a resource to assess associations of different indicators of past, long‐term systolic blood pressure exposure with incident cardiovascular disease and measure the incremental change to the performance of established risk prediction models when these indicators of long‐term blood pressure are added.
Methods
Data Source
We conducted this study using EHRs from the UK Clinical Practice Research Datalink (CPRD),28 a database providing primary care clinical information since 1985 for ≈7% of UK general practices and one of the largest primary care databases in the world.29 Patients registered to these practices are largely representative of the UK general population in terms of age, sex, and ethnicity. The CPRD is linked to the UK National Health Service databases on mortality and the Hospital Episode Statistics on hospitalizations.30 The protocol for this study has received scientific and ethical approval from the Independent Scientific Advisory Committee for CPRD studies. The CPRD maintains an audit and determines practices providing clinical data of acceptable quality for research purposes. The database provides information on demographics and other important health‐related information, such as medical history, prescriptions, smoking, body mass index, lipid profile, and deprivation level, based on the Index of Multiple Deprivation, which provides an area‐based indicator of relative deprivation ranked from least to most deprived fifth at the national level.31 In this research, we only considered clinical information from practices providing data that have met research quality standards and linked to hospitalization and mortality databases. Quality and validity of recorded diagnoses, particularly for vascular conditions, in CPRD have been reported previously.32, 33, 34, 35 Requests to access CPRD data are made through the Independent Scientific Advisory Committee ( http://www.cprd.com).
Design
In designing this study, several limitations of previous work and the challenges and opportunities of EHRs were considered. Both systolic blood pressure levels and cardiovascular disease rate increase with age36, 37; to minimize residual confounding by chronological age on the relation of current (or baseline) blood pressure with incident cardiovascular disease, we used a landmark study design38 by defining the landmark point (study baseline) at age 50 years (schematically described in Figure S1). To ensure that the design had a practical value to clinical decision making, we restricted the patient cohort to those who had at least one systolic blood pressure recorded within 1 year of baseline (at age 50 years), had at least 10 years of registration with their general practice clinic before baseline, and had at least 3 systolic blood pressure readings recorded within this 10‐year period. Patients with cardiovascular disease before baseline or those receiving treatment for high blood pressure or dyslipidemia before baseline were excluded.
Exposure Variables
Our main exposure variable was systolic blood pressure as it has been shown to be a stronger predictor of risk than diastolic blood pressure or measures derived from both systolic and diastolic blood pressure.39 Our base model included baseline (or current) systolic blood pressure, which was the reading that was recorded on or within 1 year of study entry. If multiple readings were available on the same day, we took their average. Several indicators of past, long‐term risk exposure were used. In the simplest model, we assumed that no individual‐level repeated measures of blood pressure are available (as might be the case in settings with minimal historical clinical data recorded in EHRs) and used information from published literature that provided correction factors for time‐dependent variation in blood pressure values. These correction factors (“regression dilution ratios”) ranged from 0.5 to 0.7 for repeated measurements within 2 to 10 years of follow‐up,10, 11, 12 and we chose 0.7 in our main analysis. In the next models, we used all repeated measures before baseline to calculate the following measures of long‐term cumulative exposure: (1) actual regression dilution ratio for the study cohort, calculated from systolic blood pressure readings recorded before baseline using published methods (Data S1)40; (2) simple mean systolic blood pressure, defined as mean of all recorded readings up to 10 years before study baseline; (3) time‐weighted mean systolic blood pressure, which is similar to simple mean but takes into account the time between measurements and is calculated as area under the receiver operating characteristic curve (AUC) using a previously reported method41; and (4) systolic blood pressure variability, as indicated by the SD of the mean of all recorded systolic blood pressure up to 10 years before study baseline. We used SD of the mean blood pressure values because it has been shown to have the largest standardized hazard ratio for cardiovascular disease risk compared with other blood pressure variability indicators.23
Outcome
The study outcome was incident cardiovascular disease, defined as the first hospitalization for, or death from, coronary heart disease or stroke (including transient ischemic attack), identified from 3 different sources (general practice records, hospitalization, and mortality databases) using the World Health Organization's International Classification of Diseases, Tenth Revision (ICD‐10),42 and relevant UK Read codes28 (Table S1). Capturing the disease outcomes for the whole patient cohort across these data sources is likely to be more complete than when relying on a single administrative database.35 We defined incident cardiovascular disease as the first occurrence of coronary heart disease or stroke, as recorded in any of these 3 sources of outcomes. We used this composite end point as clinical guidelines for primary prevention of cardiovascular disease have recommended the use of this outcome in risk assessments for the disease.43
Analysis
The study population included 80 964 men and women, aged 50 years at study entry, without prior cardiovascular disease who were not receiving treatment for high blood pressure or dyslipidemia. They were followed up from the date of study entry, when participants turned 50 years old, until January 1, 2014, or the date of developing the outcome, death, or exit from practice, whichever came the earliest. However, as early events could be caused by preexisting disease, we excluded the first 2 years of follow‐up in the analysis. We described the characteristics of patients according to their baseline systolic blood pressure level. We then assessed the prospective relation between our various indicators of blood pressure exposures (current, usual, and past systolic blood pressure) and risk of incident cardiovascular disease by calculating the hazard ratios using Cox regression with follow‐up duration (in years) as the underlying time variable. We examined these risks separately for the various indicators of blood pressure exposure, as well as by examining the independent associations between current and past cumulative systolic blood pressure indicators. The covariates included sex, deprivation index, smoking status, body mass index, diabetes mellitus, total cholesterol, low‐density lipoprotein cholesterol, and high‐density lipoprotein cholesterol. The covariates in the base model were sex, deprivation index, smoking, body mass index, and diabetes mellitus; in the expanded model, we additionally added total, low‐density lipoprotein, and high‐density lipoprotein cholesterol. We only used information on covariates if recorded within the year of study entry and used values closest to the date of study entry. We used multiple imputation techniques based on bagged tree prediction models to impute missing data.44, 45, 46 The combined strategy of the multiple imputation and the prediction method to reduce the variability of predictions will average out the variability present between trees (intraforest variability) and the variability caused by missing data by fitting a forest for each of the imputed data sets (between‐forest variability).46
We assessed the predictive performance of current systolic blood pressure on the disease outcome and evaluated any improvement in the prediction when adding another parameter for past systolic blood pressure in the model. For these analyses, we show results for current blood pressure (and other risk factors) before and after correction for regression dilution, as well as separately for the various indicators of past, long‐term systolic blood pressure. Using current systolic blood pressure as the base model, we compared the predictive performance of adding separately long‐term systolic blood pressure indicators to the base model. We assessed discrimination (the ability to distinguish those with and without the outcome) and calibration (the ability to predict accurately the absolute risk level by assessing agreement between observed and predicted outcomes) to evaluate the predictive performance of the different models by using concordance index and calibration slope as evaluation metrics.47, 48, 49 The concordance index (C statistic) is a discrimination metric identical to the AUC. Values range from 0.5, corresponding to a model with no discrimination ability, to 1, corresponding to perfect discrimination. The calibration slope is calculated by regressing the observed outcome on the predicted probabilities. Unlike the commonly used Hosmer‐Lemeshow test, it does not require grouping patients arbitrarily according to predicted risk and has the advantage of providing a measure of effect size and a CI.47 A value of (or close to) 1 suggests that the prediction model is well calibrated.48 A priori, we decided not to calculate net reclassfication index to evaluate the improvement of predictive models (when adding a variable to baseline predictors) as this approach may produce spurious positive findings.50
To develop and run these models and compare their predictive performance, we followed the framework of comparing multiple classifiers or algorithms in machine learning through a Bayesian model‐comparison analytical approach.51 We randomly divided the cohort into derivation (80%) and validation (20%) cohorts to provide training and testing data sets, respectively, but stratified according to incident cardiovascular disease to maintain the proportion of those who developed the outcome between these data sets (Figure S2). We then used the training data set to perform a Monte Carlo cross‐validation that involved 50 resamples without replacement, and for each resample, 75% of the data were assigned to the analysis set and 25% to the assessment set. We used results from the analysis set to develop models and calculate hazard ratios and from the assessment set to calculate C statistic and calibration slope for all models being compared. These models were then applied and tested for discrimination and calibration to the validation cohort data set, which remained independent from the derivation data set. In sensitivity analyses, we restricted our entry criteria to 2 alternative landmark points, which are ages 40 and 60 years at study entry, as well as conducted sex‐stratified analysis in our 50‐year‐old cohort.
We present risk estimates as hazard ratios and used 95% credible intervals52 as proxy for 95% CIs for the risk and model evaluation metric estimates. We expressed risk estimates per 20–mm Hg difference in systolic blood pressure or per 5–mm Hg difference in variability as these values were ≈1 SD of all blood pressure parameters considered in this study. We performed all data processing and statistical analyses using Python, version 2.7, and R, version 3.3.53
Results
In this cohort of 80 964 patients aged 50 years (70% women), the mean (SD) current systolic blood pressure was 136.6 (17.6) mm Hg at study entry, with 45.3% (N=30 574) having recorded values ≥140 mm Hg. Approximately 25% were smokers, 2.8% had diabetes mellitus, and the mean body mass index was 26.1 kg/m2. For those with a recorded lipid profile, the mean total, low‐density lipoprotein, and high‐density lipoprotein cholesterol levels were 5.6, 3.4, and 1.5 mmol/L, respectively. The Table also shows the characteristics according to categories of baseline systolic blood pressure level. Those with a higher baseline systolic blood pressure tended to have higher values of mean and variability of cumulative blood pressure indicators. After an average follow‐up of 8.2 years and a total of 661 804 person‐years, 3222 patients developed incident cardiovascular disease. When we split the study population into derivation and validation cohorts, the characteristics remained comparable between the 2 cohorts (Table S2).
Table 1.
Baseline Characteristics of Men and Women, Aged 50 Years at Study Entry, by Current Systolic Blood Pressure Levels
| Characteristics at Baseline | Current Systolic Blood Pressure (Mean), mm Hg | All | |||
|---|---|---|---|---|---|
| <120 (109) | 120–129 (123) | 130–139 (133) | ≥140 (150) | ||
| No. of patients | 17 565 | 18 972 | 19 236 | 25 191 | 80 964 |
| Women, % (n) | 82.3 (14 456) | 73.1 (13 875) | 67.3 (12 947) | 61.5 (15 485) | 70.1 (56 763) |
| Men, % (n) | 17.7 (3109) | 26.9 (5097) | 32.7 (6289) | 38.5 (9706) | 29.9 (24 201) |
| Deprivation level, % (n)a | |||||
| Recorded† | 99.6 (17 495) | 99.6 (18 899) | 99.7 (19 178) | 99.7 (25 105) | 99.6 (80 677) |
| Most deprived fifth | 11.2 (1954) | 10.8 (2042) | 11.2 (2157) | 11.7 (2940) | 11.3 (9093) |
| Smoking status, % (n) | |||||
| Recorded† | 67.8 (11 908) | 65.7 (12 462) | 64.1 (12 327) | 61.6 (15 509) | 64.5 (52 206) |
| Smoker | 25.6 (3044) | 24.1 (3003) | 23.8 (2936) | 25.5 (3957) | 24.8 (12 940) |
| Ex‐smoker | 19.3 (2302) | 20.5 (2557) | 21.8 (2690) | 22.2 (3437) | 21.1 (11 006) |
| Nonsmoker | 55.1 (6562) | 55.2 (6882) | 54.4 (6701) | 52.3 (8115) | 54.1 (28 260) |
| With diabetes mellitus, % (n) | 2.3 (408) | 2.6 (495) | 2.9 (557) | 3.3 (833) | 2.8 (2293) |
| Body mass index, kg/m2 | |||||
| Recorded, % (n)† | 59.4 (10 436) | 56.4 (10 696) | 55.7 (10 718) | 55.4 (13 957) | 56.6 (45 807) |
| Mean (SD) | 25.3 (5.0) | 26.7 (5.2) | 27.9 (5.6) | 29.1 (5.9) | 27.0 (5.6) |
| ≥30 kg/m2, % (n) | 13.2 (1380) | 21.3 (2275) | 28.6 (3063) | 37.6 (5246) | 26.1 (11 964) |
| Total cholesterol, mmol/L | |||||
| Recorded, % (n)† | 30.3 (5330) | 31.4 (5955) | 32.6 (6268) | 36.6 (9230) | 33.1 (26 783) |
| Mean (SD) | 5.4 (1.0) | 5.5 (1.0) | 5.6 (1.0) | 5.7 (1.0) | 5.6 (1.0) |
| LDL cholesterol, mmol/L | |||||
| Recorded, % (n)† | 20.2 (3517) | 21.0 (3975) | 21.3 (4096) | 22.4 (5649) | 21.3 (20 513) |
| Mean (SD) | 3.3 (0.9) | 3.4 (0.9) | 3.5 (0.9) | 3.5 (0.9) | 3.4 (0.9) |
| HDL cholesterol, mmol/L | |||||
| Recorded, % (n)† | 23.9 (4194) | 24.5 (4657) | 25.2 (4848) | 27.0 (6814) | 25.3 (21 818) |
| Mean (SD) | 1.6 (0.4) | 1.5 (0.4) | 1.5 (0.4) | 1.4 (0.4) | 1.5 (0.4) |
| Past systolic blood pressure, mean (SD), mm Hg | |||||
| Mean | 116.1 (8.8) | 123.7 (8.8) | 129.7 (9.4) | 139.2 (11.7) | 128.3 (13.2) |
| Time‐weighted mean | 116.4 (9.3) | 123.6 (9.5) | 129.1 (9.9) | 138.0 (12.2) | 127.8 (13.2) |
| Variability | 9.8 (4.8) | 9.7 (4.7) | 10.3 (4.7) | 12.0 (5.4) | 10.6 (5.0) |
Denominators to calculate percentage only include all those with information on the relevant variable. HDL indicates high‐density lipoprotein; LDL, low‐density lipoprotein.
On the basis of the Index of Multiple Deprivation 2015.31
Figure 1 shows the associated risks obtained from Monte‐Carlo cross‐validation using 50 random resamples without replacement, separately for each indicator of blood pressure exposure considered in this study (models 1–6) and combination of current and past systolic blood pressure (models 7–9). The adjusted hazard ratio (average of the 50 risk estimates) associated with each 20–mm Hg increase in current blood pressure was 1.22 (95% credible interval, 1.18–1.30) (model 1); after correction for regression dilution, this risk estimate increased to 1.40 (95% credible interval, 1.33–1.55) (model 2) when using a correction factor based on published data, or to 1.44 (95% credible interval, 1.36–1.62) (model 3) when based on patients’ own past systolic blood pressure data recorded in our database (regression dilution ratios ranged from 0.491–0.500, and we chose 0.5 for our study). All indicators of past systolic blood pressure (models 4–6) were also independently associated with incident cardiovascular disease risk. The magnitude of these hazard ratios were higher than baseline systolic blood pressure but were similar to regression dilution–corrected baseline values. When current and previous systolic blood pressure values were considered concurrently in the model (models 7–9), the risk estimates for both current and past blood pressure values were attenuated but remained associated with the outcome.
Figure 1.
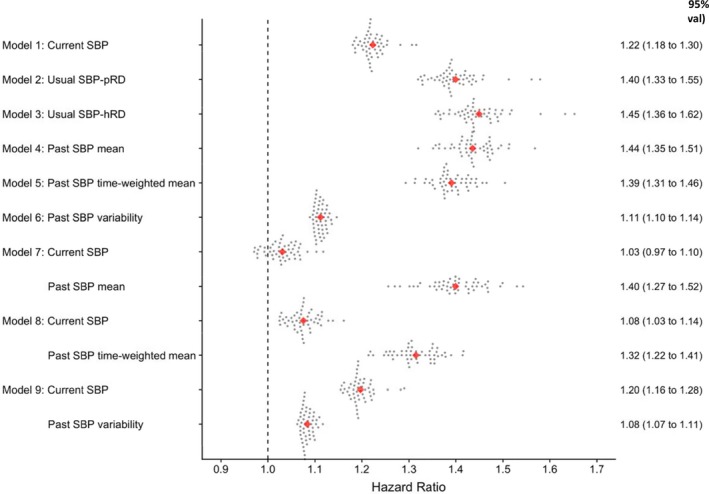
Risk of incident cardiovascular disease associated with past, current, and usual systolic blood pressure (SBP) at the landmark age of 50 years. Estimates were obtained after Monte‐Carlo cross‐validation involving 50 random resampling (represented by each dot) without replacement using data from the derivation cohort; hazard ratios (95% credible intervals) were estimated per 20–mm Hg higher current, usual, or mean of past SBP or per 5–mm Hg higher past SBP variability. Usual SBP refers to current SBP corrected for regression dilution using published correction factor (SBP‐pRD=0.70) or correction factor calculated from historical blood pressure recording (SBP‐hRD=0.50). All models were also adjusted for calendar year of study entry, sex, and other baseline characteristics (smoking, deprivation index, diabetes mellitus, body mass index, total cholesterol, low‐density lipoprotein cholesterol, and high‐density lipoprotein cholesterol). Total number of incident cardiovascular disease=3222.
Figure 2 (and Table S3) shows the discrimination (concordance) of the prediction models, as applied to the assessment data set in the derivation cohort. The AUC (C statistic) for the model that included current systolic blood pressure, as well as sex, smoking, deprivation, and diabetes mellitus, was 0.682 (95% credible interval, 0.666–0.698). The AUC increased to 0.747 (95% credible interval, 0.722–0.811) after adding lipid parameters to the model. There was no further improvement in discrimination after correcting baseline systolic blood pressure for regression dilution, and only marginal improvement was observed after adding any of the indicators of past, long‐term systolic blood pressure to the multivariable models for current systolic blood pressure. Similar patterns were observed when these models were tested using data from the validation cohort, although the AUC values were slightly higher than those obtained from the derivation cohort.
Figure 2.
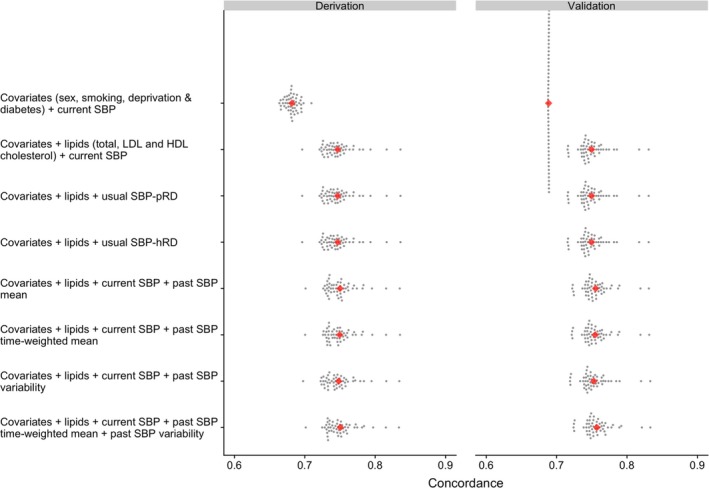
Concordance (C‐statistic) to assess discrimination of incident cardiovascular disease risk prediction models at the landmark age of 50 years (see Table S3 for further details). Risk predictions are based on Cox regression models with estimates obtained after Monte‐Carlo cross‐validation involving 50 random resampling (represented by each dot) without replacement. All models include a parameter for calendar year at study entry. Usual systolic blood pressure (SBP) refers to current SBP corrected for regression dilution using published correction factor (SBP‐pRD=0.70) or correction factor calculated from historical blood pressure recording (SBP‐hRD=0.50). HDL indicates high‐density lipoprotein; LDL, low‐density lipoprotein.
Most models calibrated relatively well in the derivation cohort, with calibration slopes close to 1, and the credible intervals were relatively tight around this value (Figure 3 and Table S3). When the models were tested in the validation cohort data set, the calibration slopes of models that included all risk factors and indicators of various blood pressure exposures tended to be lower than those obtained in the derivation cohort, although all the coefficients were still close to 1.
Figure 3.
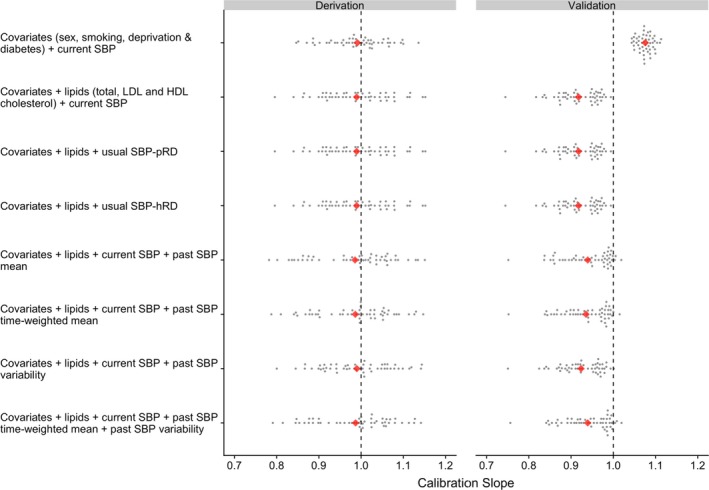
Calibration of incident cardiovascular disease risk prediction models at the landmark age of 50 years (see Table S3 for further details). Risk predictions are based on Cox regression models with estimates obtained after Monte‐Carlo cross‐validation involving 50 random resampling (represented by each dot) without replacement. All models include a parameter for calendar year at study entry. Usual systolic blood pressure (SBP) refers to current SBP corrected for regression dilution using published correction factor (SBP‐pRD=0.70) or correction factor calculated from historical blood pressure recording (SBP‐hRD=0.50). HDL indicates high‐density lipoprotein; LDL, low‐density lipoprotein.
These patterns in the results were largely similar when we replicated analyses for ages 40 and 60 years at study entry (Tables S4 through S6), although the AUC tended to be lower for all models at age 60 years than in other ages (Table S6); models also calibrated less well for ages 40 and 60 years than for age 50 years when tested in the validation cohort (Tables S5 and S6). The impact of past, current, and usual systolic blood pressure values on the outcome were similar in 50‐year‐old men and women, but with higher risk estimates in women than in men (Table S7). The predictive performance of the models was also consistent in both men and women (Tables S8 and S9), although the models performed less well when tested in the validation cohort in both sexes.
Discussion
In this cohort of 50‐year‐old adults without prior cardiovascular disease and whose current and previous systolic blood pressure values were recorded in a primary care setting, increased past, current, and usual systolic blood pressure values were separately associated with increased future risk of cardiovascular disease. Long‐term or usual systolic blood pressure was more strongly associated with the outcome than using current values alone. Although the addition of indicators of past, long‐term systolic blood pressure improved the predictive performance of models that included current systolic blood pressure and other risk factors, the improvements were relatively minor. To our knowledge, this study is the first to compare predictive performance of past, current, and usual systolic blood pressure values on cardiovascular disease risk using routinely collected information extracted from large EHRs.
Our results are consistent with those of other observational studies showing an association between long‐term elevated blood pressure and increased risk of cardiovascular disease.14, 15, 16, 17, 18, 19, 20, 21, 22, 23, 24, 25, 26 These findings are also broadly in line with genetic studies showing stronger associations between blood pressure–associated genetic variants with increased cardiovascular disease risk.54, 55, 56 These results collectively suggest the importance of long‐term exposure to increased blood pressure in the cause of cardiovascular disease, which involves a chronic atherosclerotic process.16 Thus, these findings raise the possibility of using several blood pressure readings, obtained over a period of time, rather than singly measured, to improve cardiovascular disease risk assessment. Yet, many of the earlier studies were based on relatively small sample sizes,14, 15, 16, 17, 24, 25, 26 have not formally assessed predictive performance of models using discrimination and calibration metrics,15, 16, 17, 18, 26 used few repeated blood pressure measurements,14, 19 or used values recorded after baseline reading to predict risk.20, 21 In clinical settings, risk predictions are based on blood pressure values taken at some baseline period without the benefit of any information about future blood pressure readings. Our study differed from those previous studies because we used EHRs of a large population to obtain longitudinal measures of blood pressure; characterized past, current, and usual blood pressure; and examined their performance in predicting future cardiovascular disease.
Furthermore, blood pressure level increases with age, with steeper increases in middle age,36 as do vascular disease rates;37 thus, the calculation of predicted cardiovascular disease risk typically includes age. However, simply adjusting for age may be insufficient to control for age difference when comparing effects of baseline and historical blood pressure, measured at a wide range of ages, on vascular disease outcomes many years later. Our study, therefore, differs from other large studies18, 22, 23 as we restricted our analyses to a single age to minimize confounding by this factor, allowing us to focus on examining differences in blood pressure parameters when comparing different models for their predictive performance. Others have not excluded prevalent cardiovascular disease15 or included users of antihypertensive medications,14, 15, 16, 17, 18, 19, 22, 24, 25 which could affect interindividual variation in blood pressure over time.57 The Lifetime Risk Pooling Project, a study involving >11 000 adults aged 45 to 65 years, has reported that the 10‐year atherosclerotic cardiovascular disease risk was greater for cumulative than for currently and singly measured systolic blood pressure.22 This finding is consistent with our observation, and is not unexpected.10, 11, 12, 13 Indeed, we showed that correction for regression dilution of baseline systolic blood pressure (to estimate usual level) increased risk estimates to magnitudes that were similar to the hazard ratios observed for long‐term, cumulative systolic blood pressure. A recent report, which also used CPRD, has shown the importance of previous systolic blood pressure variability on cardiovascular disease risk in adults across a wide range of ages.23 Our study has expanded on their findings by also investigating and comparing this parameter with other indicators of long‐term systolic blood pressure (cumulative mean and usual levels) and showing that risk estimates associated with blood pressure variability were relatively smaller than those seen for past, long‐term mean blood pressure.
Our study suggests that when estimating risk based on previous readings is not feasible during a clinical encounter, a simple calculator that statistically corrects the risk estimate associated with a single blood pressure reading may be sufficient to provide a valid estimate of risk associated with long‐term or usual blood pressure for the group or population level. Nevertheless, although long‐term blood pressure is relevant in the pathogenesis of cardiovascular disease, none of these long‐term blood pressure indicators substantially improved the predictive performance of commonly used models developed for predicting future cardiovascular disease. These findings suggest that adding this information to commonly used cardiovascular disease risk calculators will only provide minimal improvement in assessing a patient's risk to guide his or her treatment options. For risk assessment tools based on EHRs, methods that harness their size and scale by using substantially more predictors than those widely used by common risk assessment tools and the application of novel approaches, such as machine learning algorithms, may offer a potential alternative to substantially improve cardiovascular disease risk prediction, as it did for a different health outcome.9, 58
There are several considerations in interpreting our data. Routine clinical records have substantial missing data on other risk factors or confounding factors, so we applied imputation methods to account for this missing information. Recorded blood pressure measures were not based on a standardized protocol, which may have contributed to the large variability reflected in the larger regression dilution correction factor (≈0.5) than those reported in studies following standardized procedures (≈0.5–0.7).10, 11, 12 We also relied on recorded diagnostic codes to define our outcomes, which we did not adjudicate. However, previous studies suggest a relatively high validity of vascular disease diagnoses recorded in CPRD.33, 34, 35 These errors in exposure and outcome measurements are commonly seen when using routinely collected data, but we provide quantitative evidence of risk estimates and performance of predictive models that reflect the experience in “usual care” clinical settings. In our analytical approach, we assessed predictive performance within a novel framework of developing, assessing, and testing predictive models.51 However, these metrics may also have limitations as the discrimination metric has been known to be insensitive to detecting small differences in discriminative ability between 2 models.59 An important strength of this study is the scale, volume, and size of EHRs that allowed us to design a study that addressed important confounding factors, particularly age.
In this study, long‐term, cumulative exposure to elevated blood pressure, whether estimated by correcting current systolic blood pressure for regression dilution or averaging several previously taken measurements, was independently associated with risk of incident cardiovascular disease. However, using information on long‐term blood pressure only minimally improved the ability of current or baseline systolic blood pressure in predicting future risk of cardiovascular disease in multivariable models.
Sources of Funding
This study was supported by the Oxford Martin School and the National Institute for Health Research (NIHR) Oxford Biomedical Research Centre. The views expressed are those of the authors and not necessarily those of the UK National Health Service, the NIHR, or the Department of Health and Social Care.
Disclosures
None.
Supporting information
Data S1. Supplemental methods.
Table S1. The ICD‐10 and Read Codes Used to Define Coronary Heart Disease and Stroke/Transient Ischemic Attack
Table S2. Baseline Characteristics of Participants Aged 50 Years at Study Entry Who Were Randomly Assigned to Derivation and Validation Cohorts
Table S3. (Data to Figures 2 and 3). Discrimination (Concordance) and Calibration of Incident Cardiovascular Disease Risk Prediction Models at Age 50 Years
Table S4. Risk of Incident Cardiovascular Disease Associated With Past, Current and Usual Systolic Blood Pressure (SBP), by Landmark Age Cohort
Table S5. Discrimination (Concordance) and Calibration of Incident Cardiovascular Disease Risk Prediction Models at Age 40 Years
Table S6. Discrimination (Concordance) and Calibration for Incident Cardiovascular Disease Risk Prediction Models at Age 60 Years
Table S7. Risk of Incident Cardiovascular Disease Associated With Past, Current and Usual Systolic Blood Pressure (SBP) at Age 50 Years
Table S8. Discrimination (Concordance) and Calibration of Incident Cardiovascular Disease Risk Prediction Models in Men at Age 50 Years
Table S9. Discrimination (Concordance) and Calibration of Incident Cardiovascular Disease Risk Prediction Models in Women at Age 50 Years
Figure S1. Schematic diagram showing landmark approach for each age cohort analysed.
Figure S2. Schematic diagram showing the use of data in model derivation and validation.
Acknowledgments
The authors are grateful to Dr Rema Ramakrishnan for her guidance in describing the methods of regression dilution bias correction. This work uses data provided by patients and collected by the UK National Health Service as part of their care and support and would not have been possible without access to these data. The National Institute for Health Research recognizes and values the role of patient data, securely accessed and stored, both in underpinning and leading to improvements in research and care.
(J Am Heart Assoc. 2019;8:e012129 DOI: 10.1161/JAHA.119.012129.)
References
- 1. Lim SS, Vos T, Flaxman AD, Danaei G, Shibuya K, Adair‐Rohani H, Amann M, Anderson HR, Andrews KG, Aryee M, Atkinson C, Bacchus LJ, Bahalim AN, Balakrishnan K, Balmes J, Barker‐Collo S, Baxter A, Bell ML, Blore JD, Blyth F, Bonner C, Borges G, Bourne R, Boussinesq M, Brauer M, Brooks P, Bruce NG, Brunekreef B, Bryan‐Hancock C, Bucello C, Buchbinder R, Bull F, Burnett RT, Byers TE, Calabria B, Carapetis J, Carnahan E, Chafe Z, Charlson F, Chen H, Chen JS, Cheng AT, Child JC, Cohen A, Colson KE, Cowie BC, Darby S, Darling S, Davis A, Degenhardt L, Dentener F, Des Jarlais DC, Devries K, Dherani M, Ding EL, Dorsey ER, Driscoll T, Edmond K, Ali SE, Engell RE, Erwin PJ, Fahimi S, Falder G, Farzadfar F, Ferrari A, Finucane MM, Flaxman S, Fowkes FG, Freedman G, Freeman MK, Gakidou E, Ghosh S, Giovannucci E, Gmel G, Graham K, Grainger R, Grant B, Gunnell D, Gutierrez HR, Hall W, Hoek HW, Hogan A, Hosgood HD III, Hoy D, Hu H, Hubbell BJ, Hutchings SJ, Ibeanusi SE, Jacklyn GL, Jasrasaria R, Jonas JB, Kan H, Kanis JA, Kassebaum N, Kawakami N, Khang YH, Khatibzadeh S, Khoo JP, Kok C, Laden F, Lalloo R, Lan Q, Lathlean T, Leasher JL, Leigh J, Li Y, Lin JK, Lipshultz SE, London S, Lozano R, Lu Y, Mak J, Malekzadeh R, Mallinger L, Marcenes W, March L, Marks R, Martin R, McGale P, McGrath J, Mehta S, Mensah GA, Merriman TR, Micha R, Michaud C, Mishra V, Mohd Hanafiah K, Mokdad AA, Morawska L, Mozaffarian D, Murphy T, Naghavi M, Neal B, Nelson PK, Nolla JM, Norman R, Olives C, Omer SB, Orchard J, Osborne R, Ostro B, Page A, Pandey KD, Parry CD, Passmore E, Patra J, Pearce N, Pelizzari PM, Petzold M, Phillips MR, Pope D, Pope CA III, Powles J, Rao M, Razavi H, Rehfuess EA, Rehm JT, Ritz B, Rivara FP, Roberts T, Robinson C, Rodriguez‐Portales JA, Romieu I, Room R, Rosenfeld LC, Roy A, Rushton L, Salomon JA, Sampson U, Sanchez‐Riera L, Sanman E, Sapkota A, Seedat S, Shi P, Shield K, Shivakoti R, Singh GM, Sleet DA, Smith E, Smith KR, Stapelberg NJ, Steenland K, Stockl H, Stovner LJ, Straif K, Straney L, Thurston GD, Tran JH, Van Dingenen R, van Donkelaar A, Veerman JL, Vijayakumar L, Weintraub R, Weissman MM, White RA, Whiteford H, Wiersma ST, Wilkinson JD, Williams HC, Williams W, Wilson N, Woolf AD, Yip P, Zielinski JM, Lopez AD, Murray CJ, Ezzati M, AlMazroa MA, Memish ZA. A comparative risk assessment of burden of disease and injury attributable to 67 risk factors and risk factor clusters in 21 regions, 1990–2010: a systematic analysis for the Global Burden of Disease Study 2010. Lancet. 2012;380:2224–2260. [DOI] [PMC free article] [PubMed] [Google Scholar]
- 2. Global Burden of Metabolic Risk Factors for Chronic Diseases Collaboration . Cardiovascular disease, chronic kidney disease, and diabetes mortality burden of cardiometabolic risk factors from 1980 to 2010: a comparative risk assessment. Lancet Diabetes Endocrinol. 2014;2:634–647. [DOI] [PMC free article] [PubMed] [Google Scholar]
- 3. Public Health England . Tackling High Blood Pressure: An Update. London, UK: Crown Copyright; 2018. [Google Scholar]
- 4. National Institute for Health and Care Excellence . Hypertension in adults: diagnosis and management. https://www.nice.org.uk/guidance/cg127. Accessed January 22, 2019. [PubMed]
- 5. Whelton PK, Carey RM, Aronow WS, Casey DE Jr, Collins KJ, Dennison Himmelfarb C, DePalma SM, Gidding S, Jamerson KA, Jones DW, MacLaughlin EJ, Muntner P, Ovbiagele B, Smith SC Jr, Spencer CC, Stafford RS, Taler SJ, Thomas RJ, Williams KA Sr, Williamson JD, Wright JT Jr. 2017 ACC/AHA/AAPA/ABC/ACPM/AGS/APHA/ASH/ASPC/NMA/PCNA guideline for the prevention, detection, evaluation, and management of high blood pressure in adults: a report of the American College of Cardiology/American Heart Association Task Force on Clinical Practice Guidelines. J Am Coll Cardiol. 2018;71:e127–e248. [DOI] [PubMed] [Google Scholar]
- 6. Williams B, Mancia G, Spiering W, Agabiti Rosei E, Azizi M, Burnier M, Clement DL, Coca A, de Simone G, Dominiczak A, Kahan T, Mahfoud F, Redon J, Ruilope L, Zanchetti A, Kerins M, Kjeldsen SE, Kreutz R, Laurent S, Lip GYH, McManus R, Narkiewicz K, Ruschitzka F, Schmieder RE, Shlyakhto E, Tsioufis C, Aboyans V, Desormais I; ESC Scientific Document Group . 2018 ESC/ESH guidelines for the management of arterial hypertension. Eur Heart J. 2018;39:3021–3104. [DOI] [PubMed] [Google Scholar]
- 7. D'Agostino RB Sr, Vasan RS, Pencina MJ, Wolf PA, Cobain M, Massaro JM, Kannel WB. General cardiovascular risk profile for use in primary care: the Framingham Heart Study. Circulation. 2008;117:743–753. [DOI] [PubMed] [Google Scholar]
- 8. Goff DC Jr, Lloyd‐Jones DM, Bennett G, Coady S, D'Agostino RB, Gibbons R, Greenland P, Lackland DT, Levy D, O'Donnell CJ, Robinson JG, Schwartz JS, Shero ST, Smith SC Jr, Sorlie P, Stone NJ, Wilson PW, Jordan HS, Nevo L, Wnek J, Anderson JL, Halperin JL, Albert NM, Bozkurt B, Brindis RG, Curtis LH, DeMets D, Hochman JS, Kovacs RJ, Ohman EM, Pressler SJ, Sellke FW, Shen WK, Smith SC Jr, Tomaselli GF; American College of Cardiology/American Heart Association Task Force on Practice Guidelines . 2013 ACC/AHA guideline on the assessment of cardiovascular risk: a report of the American College of Cardiology/American Heart Association Task Force on Practice Guidelines. Circulation. 2014;129:S49–S73. [DOI] [PubMed] [Google Scholar]
- 9. Hippisley‐Cox J, Coupland C, Brindle P. Development and validation of QRISK3 risk prediction algorithms to estimate future risk of cardiovascular disease: prospective cohort study. BMJ. 2017;357:j2099. [DOI] [PMC free article] [PubMed] [Google Scholar]
- 10. Clarke R, Shipley M, Lewington S, Youngman L, Collins R, Marmot M, Peto R. Underestimation of risk associations due to regression dilution in long‐term follow‐up of prospective studies. Am J Epidemiol. 1999;150:341–353. [DOI] [PubMed] [Google Scholar]
- 11. Lewington S, Clarke R, Qizilbash N, Peto R, Collins R; Prospective Studies Collaboration . Age‐specific relevance of usual blood pressure to vascular mortality: a meta‐analysis of individual data for one million adults in 61 prospective studies. Lancet. 2002;360:1903–1913. [DOI] [PubMed] [Google Scholar]
- 12. MacMahon S, Peto R, Cutler J, Collins R, Sorlie P, Neaton J, Abbott R, Godwin J, Dyer A, Stamler J. Blood pressure, stroke, and coronary heart disease, part 1, prolonged differences in blood pressure: prospective observational studies corrected for the regression dilution bias. Lancet. 1990;335:765–774. [DOI] [PubMed] [Google Scholar]
- 13. Strachan D, Rose G. Strategies of prevention revisited: effects of imprecise measurement of risk factors on the evaluation of “high‐risk” and “population‐based” approaches to prevention of cardiovascular disease. J Clin Epidemiol. 1991;44:1187–1196. [DOI] [PubMed] [Google Scholar]
- 14. Bell K, Hayen A, McGeechan K, Neal B, Irwig L. Effects of additional blood pressure and lipid measurements on the prediction of cardiovascular risk. Eur J Prev Cardiol. 2012;19:1474–1485. [DOI] [PubMed] [Google Scholar]
- 15. Norby FL, Soliman EZ, Chen LY, Bengtson LG, Loehr LR, Agarwal SK, Alonso A. Trajectories of cardiovascular risk factors and incidence of atrial fibrillation over a 25‐year follow‐up: the ARIC study (Atherosclerosis Risk in Communities). Circulation. 2016;134:599–610. [DOI] [PMC free article] [PubMed] [Google Scholar]
- 16. Allen NB, Siddique J, Wilkins JT, Shay C, Lewis CE, Goff DC, Jacobs DR Jr, Liu K, Lloyd‐Jones D. Blood pressure trajectories in early adulthood and subclinical atherosclerosis in middle age. JAMA. 2014;311:490–497. [DOI] [PMC free article] [PubMed] [Google Scholar]
- 17. Kishi S, Teixido‐Tura G, Ning H, Venkatesh BA, Wu C, Almeida A, Choi EY, Gjesdal O, Jacobs DR Jr, Schreiner PJ, Gidding SS, Liu K, Lima JA. Cumulative blood pressure in early adulthood and cardiac dysfunction in middle age: the CARDIA study. J Am Coll Cardiol. 2015;65:2679–2687. [DOI] [PubMed] [Google Scholar]
- 18. Wang YX, Song L, Xing AJ, Gao M, Zhao HY, Li CH, Zhao HL, Chen SH, Lu CZ, Wu SL. Predictive value of cumulative blood pressure for all‐cause mortality and cardiovascular events. Sci Rep. 2017;7:41969. [DOI] [PMC free article] [PubMed] [Google Scholar]
- 19. Paynter NP, Crainiceanu CM, Sharrett AR, Chambless LE, Coresh J. Effect of correcting for long‐term variation in major coronary heart disease risk factors: relative hazard estimation and risk prediction in the Atherosclerosis Risk in Communities study. Ann Epidemiol. 2012;22:191–197. [DOI] [PMC free article] [PubMed] [Google Scholar]
- 20. Paige E, Barrett J, Pennells L, Sweeting M, Willeit P, Di Angelantonio E, Gudnason V, Nordestgaard BG, Psaty BM, Goldbourt U, Best LG, Assmann G, Salonen JT, Nietert PJ, Verschuren WMM, Brunner EJ, Kronmal RA, Salomaa V, Bakker SJL, Dagenais GR, Sato S, Jansson JH, Willeit J, Onat A, de la Camara AG, Roussel R, Volzke H, Dankner R, Tipping RW, Meade TW, Donfrancesco C, Kuller LH, Peters A, Gallacher J, Kromhout D, Iso H, Knuiman M, Casiglia E, Kavousi M, Palmieri L, Sundstrom J, Davis BR, Njolstad I, Couper D, Danesh J, Thompson SG, Wood A. Use of repeated blood pressure and cholesterol measurements to improve cardiovascular disease risk prediction: an individual‐participant‐data meta‐analysis. Am J Epidemiol. 2017;186:899–907. [DOI] [PMC free article] [PubMed] [Google Scholar]
- 21. Sweeting MJ, Barrett JK, Thompson SG, Wood AM. The use of repeated blood pressure measures for cardiovascular risk prediction: a comparison of statistical models in the ARIC study. Stat Med. 2017;36:4514–4528. [DOI] [PMC free article] [PubMed] [Google Scholar]
- 22. Pool LR, Ning H, Wilkins J, Lloyd‐Jones DM, Allen NB. Use of long‐term cumulative blood pressure in cardiovascular risk prediction models. JAMA Cardiol. 2018;3:1096–1100. [DOI] [PMC free article] [PubMed] [Google Scholar]
- 23. Stevens SL, McManus RJ, Stevens RJ. The utility of long‐term blood pressure variability for cardiovascular risk prediction in primary care. J Hypertens. 2019;37:522–529. [DOI] [PubMed] [Google Scholar]
- 24. Bonifonte A, Ayer T, Veledar E, Clark A, Wilson PW. Antecedent blood pressure as a predictor of cardiovascular disease. J Am Soc Hypertens. 2015;9:690–696.e1. [DOI] [PubMed] [Google Scholar]
- 25. Lee DS, Massaro JM, Wang TJ, Kannel WB, Benjamin EJ, Kenchaiah S, Levy D, D'Agostino RB Sr, Vasan RS. Antecedent blood pressure, body mass index, and the risk of incident heart failure in later life. Hypertension. 2007;50:869–876. [DOI] [PubMed] [Google Scholar]
- 26. Vasan RS, Massaro JM, Wilson PW, Seshadri S, Wolf PA, Levy D, D'Agostino RB; Framingham Heart Study . Antecedent blood pressure and risk of cardiovascular disease: the Framingham Heart Study. Circulation. 2002;105:48–53. [DOI] [PubMed] [Google Scholar]
- 27. Moran AE, Liu K. Invited commentary: quantifying the added value of repeated measurements. Am J Epidemiol. 2017;186:908–909. [DOI] [PubMed] [Google Scholar]
- 28. Medicines & Healthcare Products Regulatory Agency . Clinical Practice Research Datalink. http://www.cprd.com. Accessed January 22, 2019.
- 29. Herrett E, Gallagher AM, Bhaskaran K, Forbes H, Mathur R, van Staa T, Smeeth L. Data resource profile: Clinical Practice Research Datalink (CPRD). Int J Epidemiol. 2015;44:827–836. [DOI] [PMC free article] [PubMed] [Google Scholar]
- 30. Health and Social Care Information Centre . Hospital episode statistics. http://www.hscic.gov.uk/hes. Accessed December 20, 2018.
- 31. Smith T, Noble M, Noble S, Wright G, McLennan D, Plunkett E. The English Indices of Deprivation 2015. London, UK: Crown Copyright; 2015. https://assets.publishing.service.gov.uk/government/uploads/system/uploads/attachment_data/file/464597/English_Indices_of_Deprivation_2015_-_Research_Report.pdf. Accessed May 14, 2018. [Google Scholar]
- 32. Khan NF, Harrison SE, Rose PW. Validity of diagnostic coding within the general practice research database: a systematic review. Br J Gen Pract. 2010;60:e128–e136. [DOI] [PMC free article] [PubMed] [Google Scholar]
- 33. Schlienger RG, Jick H, Meier CR. Use of nonsteroidal anti‐inflammatory drugs and the risk of first‐time acute myocardial infarction. Br J Clin Pharmacol. 2002;54:327–332. [DOI] [PMC free article] [PubMed] [Google Scholar]
- 34. Herrett E, Thomas SL, Schoonen WM, Smeeth L, Hall AJ. Validation and validity of diagnoses in the general practice research database: a systematic review. Br J Clin Pharmacol. 2010;69:4–14. [DOI] [PMC free article] [PubMed] [Google Scholar]
- 35. Herrett E, Shah AD, Boggon R, Denaxas S, Smeeth L, van Staa T, Timmis A, Hemingway H. Completeness and diagnostic validity of recording acute myocardial infarction events in primary care, hospital care, disease registry, and national mortality records: cohort study. BMJ. 2013;346:f2350. [DOI] [PMC free article] [PubMed] [Google Scholar]
- 36. Wills AK, Lawlor DA, Muniz‐Terrera G, Matthews F, Cooper R, Ghosh AK, Kuh D, Hardy R; FALCon Study Team . Population heterogeneity in trajectories of midlife blood pressure. Epidemiology. 2012;23:203–211. [DOI] [PMC free article] [PubMed] [Google Scholar]
- 37. World Health Organization . Global health estimates 2014 summary tables: deaths by cause, age and sex, by WHO region, 2000–2012. http://www.who.int/healthinfo/global_burden_disease/en/. Accessed January 22, 2019.
- 38. Paige E, Barrett J, Stevens D, Keogh RH, Sweeting MJ, Nazareth I, Petersen I, Wood AM. Landmark models for optimizing the use of repeated measurements of risk factors in electronic health records to predict future disease risk. Am J Epidemiol. 2018;187:1530–1538. [DOI] [PMC free article] [PubMed] [Google Scholar]
- 39. Strandberg TE, Pitkala K. What is the most important component of blood pressure: systolic, diastolic or pulse pressure? Curr Opin Nephrol Hypertens. 2003;12:293–297. [DOI] [PubMed] [Google Scholar]
- 40. Rosner B, Spiegelman D, Willett WC. Correction of logistic regression relative risk estimates and confidence intervals for measurement error: the case of multiple covariates measured with error. Am J Epidemiol. 1990;132:734–745. [DOI] [PubMed] [Google Scholar]
- 41. Zemaitis P, Liu K, Jacobs DR Jr, Cushman M, Durazo‐Arvizu R, Shoham D, Palmas W, Cooper R, Kramer H. Cumulative systolic BP and changes in urine albumin‐to‐creatinine ratios in nondiabetic participants of the Multi‐Ethnic Study of Atherosclerosis. Clin J Am Soc Nephrol. 2014;9:1922–1929. [DOI] [PMC free article] [PubMed] [Google Scholar]
- 42. World Health Organization . International statistical classification of diseases and related health problems 10th revision. https://apps.who.int/classifications/icd10/. Accessed January 22, 2019.
- 43. National Institute for Health and Care Excellence . Surveillance report 2018—cardiovascular disease: risk assessment and reduction, including lipid modification (2014) NICE guideline CG181. https://www.nice.org.uk/guidance/cg181. Accessed January 22, 2019. [PubMed]
- 44. Kuhn M. Building predictive models in R using the caret package. J Stat Softw. 2008;29:1–26. Available at: https://www.jstatsoft.org/article/view/v028i05. Accessed June 15, 2018. [Google Scholar]
- 45. Kuhn M. The caret package. 2018. https://topepo.github.io/caret/index.html. Accessed June 15, 2018.
- 46. Valdiviezo HC, Van Aelst S. Tree‐based prediction on incomplete data using imputation or surrogate decisions. Inf Sci. 2015;311:163–181. [Google Scholar]
- 47. Crowson CS, Atkinson EJ, Therneau TM. Assessing calibration of prognostic risk scores. Stat Methods Med Res. 2016;25:1692–1706. [DOI] [PMC free article] [PubMed] [Google Scholar]
- 48. Rahman MS, Ambler G, Choodari‐Oskooei B, Omar RZ. Review and evaluation of performance measures for survival prediction models in external validation settings. BMC Med Res Methodol. 2017;17:60. [DOI] [PMC free article] [PubMed] [Google Scholar]
- 49. Steyerberg EW, Vickers AJ, Cook NR, Gerds T, Gonen M, Obuchowski N, Pencina MJ, Kattan MW. Assessing the performance of prediction models: a framework for traditional and novel measures. Epidemiology. 2010;21:128–138. [DOI] [PMC free article] [PubMed] [Google Scholar]
- 50. Pepe MS, Fan J, Feng Z, Gerds T, Hilden J. The Net Reclassification Index (NRI): a misleading measure of prediction improvement even with independent test data sets. Stat Biosci. 2015;7:282–295. [DOI] [PMC free article] [PubMed] [Google Scholar]
- 51. Benavoli A, Corani G, Demšar J, Zaffalon M. Time for a change: a tutorial for comparing multiple classifiers through Bayesian analysis. J Mach Learn Res. 2017;18:1–36. [Google Scholar]
- 52. McElreath R. Sampling the imaginary In: Statistical Rethinking. Boca Raton, FL: CRC Press; 2016:49–70. [Google Scholar]
- 53. R Development Core Team . R: A Language and Environment for Statistical Computing. Vienna, Austria: R Foundation for Statistical Computing; 2016. [Google Scholar]
- 54. Lieb W, Jansen H, Loley C, Pencina MJ, Nelson CP, Newton‐Cheh C, Kathiresan S, Reilly MP, Assimes TL, Boerwinkle E, Hall AS, Hengstenberg C, Laaksonen R, McPherson R, Thorsteinsdottir U, Ziegler A, Peters A, Thompson JR, Konig IR, Erdmann J, Samani NJ, Vasan RS, Schunkert H; CARDIoGRAM . Genetic predisposition to higher blood pressure increases coronary artery disease risk. Hypertension. 2013;61:995–1001. [DOI] [PMC free article] [PubMed] [Google Scholar]
- 55. Warren HR, Evangelou E, Cabrera CP, Gao H, Ren M, Mifsud B, Ntalla I, Surendran P, Liu C, Cook JP, Kraja AT, Drenos F, Loh M, Verweij N, Marten J, Karaman I, Lepe MP, O'Reilly PF, Knight J, Snieder H, Kato N, He J, Tai ES, Said MA, Porteous D, Alver M, Poulter N, Farrall M, Gansevoort RT, Padmanabhan S, Magi R, Stanton A, Connell J, Bakker SJ, Metspalu A, Shields DC, Thom S, Brown M, Sever P, Esko T, Hayward C, van der Harst P, Saleheen D, Chowdhury R, Chambers JC, Chasman DI, Chakravarti A, Newton‐Cheh C, Lindgren CM, Levy D, Kooner JS, Keavney B, Tomaszewski M, Samani NJ, Howson JM, Tobin MD, Munroe PB, Ehret GB, Wain LV; International Consortium of Blood Pressure (ICBP) 1000G Analyses; BIOS Consortium; Lifelines Cohort Study; Understanding Society Scientific group; CHD Exome+ Consortium; ExomeBP Consortium; T2D‐GENES Consortium; GoT2DGenes Consortium; Cohorts for Heart and Ageing Research in Genome Epidemiology (CHARGE) BP Exome Consortium; International Genomics of Blood Pressure (iGEN‐BP) Consortium; UK Biobank CardioMetabolic Consortium BP working group . Genome‐wide association analysis identifies novel blood pressure loci and offers biological insights into cardiovascular risk. Nat Genet. 2017;49:403–415.28135244 [Google Scholar]
- 56. Evangelou E, Warren HR, Mosen‐Ansorena D, Mifsud B, Pazoki R, Gao H, Ntritsos G, Dimou N, Cabrera CP, Karaman I, Ng FL, Evangelou M, Witkowska K, Tzanis E, Hellwege JN, Giri A, Velez Edwards DR, Sun YV, Cho K, Gaziano JM, Wilson PWF, Tsao PS, Kovesdy CP, Esko T, Magi R, Milani L, Almgren P, Boutin T, Debette S, Ding J, Giulianini F, Holliday EG, Jackson AU, Li‐Gao R, Lin WY, Luan J, Mangino M, Oldmeadow C, Prins BP, Qian Y, Sargurupremraj M, Shah N, Surendran P, Theriault S, Verweij N, Willems SM, Zhao JH, Amouyel P, Connell J, de Mutsert R, Doney ASF, Farrall M, Menni C, Morris AD, Noordam R, Pare G, Poulter NR, Shields DC, Stanton A, Thom S, Abecasis G, Amin N, Arking DE, Ayers KL, Barbieri CM, Batini C, Bis JC, Blake T, Bochud M, Boehnke M, Boerwinkle E, Boomsma DI, Bottinger EP, Braund PS, Brumat M, Campbell A, Campbell H, Chakravarti A, Chambers JC, Chauhan G, Ciullo M, Cocca M, Collins F, Cordell HJ, Davies G, de Borst MH, de Geus EJ, Deary IJ, Deelen J, Del Greco MF, Demirkale CY, Dorr M, Ehret GB, Elosua R, Enroth S, Erzurumluoglu AM, Ferreira T, Franberg M, Franco OH, Gandin I, Gasparini P, Giedraitis V, Gieger C, Girotto G, Goel A, Gow AJ, Gudnason V, Guo X, Gyllensten U, Hamsten A, Harris TB, Harris SE, Hartman CA, Havulinna AS, Hicks AA, Hofer E, Hofman A, Hottenga JJ, Huffman JE, Hwang SJ, Ingelsson E, James A, Jansen R, Jarvelin MR, Joehanes R, Johansson A, Johnson AD, Joshi PK, Jousilahti P, Jukema JW, Jula A, Kahonen M, Kathiresan S, Keavney BD, Khaw KT, Knekt P, Knight J, Kolcic I, Kooner JS, Koskinen S, Kristiansson K, Kutalik Z, Laan M, Larson M, Launer LJ, Lehne B, Lehtimaki T, Liewald DCM, Lin L, Lind L, Lindgren CM, Liu Y, Loos RJF, Lopez LM, Lu Y, Lyytikainen LP, Mahajan A, Mamasoula C, Marrugat J, Marten J, Milaneschi Y, Morgan A, Morris AP, Morrison AC, Munson PJ, Nalls MA, Nandakumar P, Nelson CP, Niiranen T, Nolte IM, Nutile T, Oldehinkel AJ, Oostra BA, O'Reilly PF, Org E, Padmanabhan S, Palmas W, Palotie A, Pattie A, Penninx B, Perola M, Peters A, Polasek O, Pramstaller PP, Nguyen QT, Raitakari OT, Ren M, Rettig R, Rice K, Ridker PM, Ried JS, Riese H, Ripatti S, Robino A, Rose LM, Rotter JI, Rudan I, Ruggiero D, Saba Y, Sala CF, Salomaa V, Samani NJ, Sarin AP, Schmidt R, Schmidt H, Shrine N, Siscovick D, Smith AV, Snieder H, Sober S, Sorice R, Starr JM, Stott DJ, Strachan DP, Strawbridge RJ, Sundstrom J, Swertz MA, Taylor KD, Teumer A, Tobin MD, Tomaszewski M, Toniolo D, Traglia M, Trompet S, Tuomilehto J, Tzourio C, Uitterlinden AG, Vaez A, van der Most PJ, van Duijn CM, Vergnaud AC, Verwoert GC, Vitart V, Volker U, Vollenweider P, Vuckovic D, Watkins H, Wild SH, Willemsen G, Wilson JF, Wright AF, Yao J, Zemunik T, Zhang W, Attia JR, Butterworth AS, Chasman DI, Conen D, Cucca F, Danesh J, Hayward C, Howson JMM, Laakso M, Lakatta EG, Langenberg C, Melander O, Mook‐Kanamori DO, Palmer CNA, Risch L, Scott RA, Scott RJ, Sever P, Spector TD, van der Harst P, Wareham NJ, Zeggini E, Levy D, Munroe PB, Newton‐Cheh C, Brown MJ, Metspalu A, Hung AM, O'Donnell CJ, Edwards TL, Psaty BM, Tzoulaki I, Barnes MR, Wain LV, Elliott P, Caulfield MJ; Million Veteran Program . Genetic analysis of over 1 million people identifies 535 new loci associated with blood pressure traits. Nat Genet. 2018;50:1412–1425. [DOI] [PMC free article] [PubMed] [Google Scholar]
- 57. Webb AJ, Fischer U, Mehta Z, Rothwell PM. Effects of antihypertensive‐drug class on interindividual variation in blood pressure and risk of stroke: a systematic review and meta‐analysis. Lancet. 2010;375:906–915. [DOI] [PubMed] [Google Scholar]
- 58. Rahimian F, Salimi‐Khorshidi G, Payberah AH, Tran J, Ayala Solares R, Raimondi F, Nazarzadeh M, Canoy D, Rahimi K. Predicting the risk of emergency admission with machine learning: development and validation using linked electronic health records. PLoS Med. 2018;15:e1002695. [DOI] [PMC free article] [PubMed] [Google Scholar]
- 59. Harrell FE Jr, Lee KL, Mark DB. Multivariable prognostic models: issues in developing models, evaluating assumptions and adequacy, and measuring and reducing errors. Stat Med. 1996;15:361–387. [DOI] [PubMed] [Google Scholar]
Associated Data
This section collects any data citations, data availability statements, or supplementary materials included in this article.
Supplementary Materials
Data S1. Supplemental methods.
Table S1. The ICD‐10 and Read Codes Used to Define Coronary Heart Disease and Stroke/Transient Ischemic Attack
Table S2. Baseline Characteristics of Participants Aged 50 Years at Study Entry Who Were Randomly Assigned to Derivation and Validation Cohorts
Table S3. (Data to Figures 2 and 3). Discrimination (Concordance) and Calibration of Incident Cardiovascular Disease Risk Prediction Models at Age 50 Years
Table S4. Risk of Incident Cardiovascular Disease Associated With Past, Current and Usual Systolic Blood Pressure (SBP), by Landmark Age Cohort
Table S5. Discrimination (Concordance) and Calibration of Incident Cardiovascular Disease Risk Prediction Models at Age 40 Years
Table S6. Discrimination (Concordance) and Calibration for Incident Cardiovascular Disease Risk Prediction Models at Age 60 Years
Table S7. Risk of Incident Cardiovascular Disease Associated With Past, Current and Usual Systolic Blood Pressure (SBP) at Age 50 Years
Table S8. Discrimination (Concordance) and Calibration of Incident Cardiovascular Disease Risk Prediction Models in Men at Age 50 Years
Table S9. Discrimination (Concordance) and Calibration of Incident Cardiovascular Disease Risk Prediction Models in Women at Age 50 Years
Figure S1. Schematic diagram showing landmark approach for each age cohort analysed.
Figure S2. Schematic diagram showing the use of data in model derivation and validation.