

Abstract
Most natural sounds, including speech, exhibit temporal amplitude fluctuations. This information is encoded as amplitude modulations (AM)—essential for auditory and speech perception. The neural representation of AM has been studied at various stages of the ascending auditory system from the auditory nerve to the cortex. In contrast, research on neural coding of AM in the efferent pathway has been extremely limited. The objective of this study was to investigate the encoding of AM signals in the medial olivocochlear system by measuring the modulation transfer functions of the efferent response in humans. A secondary goal was to replicate the controversial findings from the literature that efferent stimulation produces larger effects for the AM elicitor with 100 Hz modulation frequency in comparison with the unmodulated elicitor. The efferent response was quantified by measuring changes in stimulus-frequency otoacoustic emission magnitude due to various modulated and unmodulated elicitors. Unmodulated, broadband noise elicitors yielded either slightly larger or similar efferent responses relative to modulated elicitors depending on the modulation frequency. Efferent responses to the unmodulated and modulated elicitors with 100 Hz modulation frequency were not significantly different. The efferent system encoding of AM sounds—modulation transfer functions—can be modeled with a first-order Butterworth low-pass filter with different cutoff frequencies for ipsilateral and contralateral elicitors. The ipsilateral efferent pathway showed a greater sensitivity to AM information comparted to the contralateral pathway. Efferent modulation transfer functions suggest that the ability of the system to follow AM decreases with increasing modulation frequency and that efferents may not be fully operating on the envelope of the speech.
Keywords: amplitude modulation, medial olivocochlear efferent, modulation transfer function, neural encoding, otoacoustic emissions
INTRODUCTION
Human speech and music have prominent temporal amplitude fluctuations. Amplitude modulations (AM) carry information about acoustic and prosodic features, speech rate, and intonation information essential for speech perception (Houtgast and Steeneken 1985; Rosen 1992; Drullman et al. 1996; Giraud and Poeppel 2012). The neural representation of amplitude modulated signals has been studied extensively at various levels of the afferent auditory pathway from the brainstem to the cortex (Joris et al. 2004, for review). Likewise, responses to AM have been investigated in humans using a variety of methods, such as evoked potentials, imaging, and psychophysics (Viemeister 1979; Picton et al. 1987; Giraud et al. 2000). Compared with the afferent auditory pathway, literature concerning the neural processing of amplitude modulated signals in the efferent system in both human and non-human species is limited. To date, only one animal study conducted in guinea pigs suggests that medial olivocochlear efferents (hereafter referred to as efferents) respond to and closely follow temporal fluctuations and found that most single efferent neurons have a peak around 100 Hz in their modulation transfer functions (MTFs) (Gummer et al. 1988).
In humans, efferent effects are assayed by measuring changes in otoacoustic emissions (OAEs) produced by ipsilateral or contralateral acoustic elicitors. OAEs provide a non-invasive index of outer hair cells functioning. Steady-state elicitors, such as tones and noises, commonly used in efferent studies do not represent the rapid temporal amplitude fluctuations, and thus cannot reveal the dynamic properties of the efferent system. Although few studies examined efferent effects using elicitors with AM, the efferent system’s ability to process temporal features of modulated signals remains to be characterized in humans. An earlier study reported that contralateral broadband noise (BBN) elicitor with a modulation frequency of 100 Hz and 100 % modulation depth produced larger efferent effects, i.e., a greater reduction in tone-pip evoked OAE magnitudes for the modulated elicitor relative to the unmodulated elicitor (Maison et al. 1999). Other combinations of modulation frequencies (50–800 Hz in half-octave steps) and modulation depths (0–100 % by 25 % steps) did not elicit larger efferent effects compared with the unmodulated condition. Maison and colleagues reported similar results with slightly different measurement protocols (Maison et al. 1997; Maison et al. 2001). However, these findings could not be replicated by two recent studies using OAEs evoked by clicks, tone-bursts, and tones (Boothalingam et al. 2014; Mertes 2018). They found that unmodulated and modulated noise elicitors produce similar efferent effects. Findings from a few other reports have potential caveats related to middle ear muscle reflexes (MEMRs) and/or OAE protocol that preclude a clearer interpretation (Timpe-Syverson and Decker 1999; Kalaiah et al. 2017). The presence of MEMRs in OAE measurements may bias the estimation of efferent effects. Taken together, the few available studies cannot confirm the extent to which the efferent system influences the neural coding of responses to AM signals. Knowledge of efferent sensitivity to temporal fluctuations has important implications for auditory processing and speech perception. For example, medial olivocochlear efferents control the gain of cochlear amplification for transient signals in noisy backgrounds (Lopez-Poveda 2018 for review).
The primary objective of the current study was to examine the dynamic properties of the human medial olivocochlear system by measuring the MTFs of the efferent response. The MTF characterizes how faithfully the temporal modulations can be carried through the efferent system. A previous study characterized MTFs of the efferent system to contralateral stimulation in four subjects (Backus 2005). The present study measured MTFs of both ipsilateral and contralateral medial efferent pathways in a larger sample to describe the AM following the ability of the efferent system. A related aim was to determine whether the efferent response is specifically sensitive to the AM elicitor with 100 Hz modulation frequency, as observed in an animal study (Gummer et al. 1988) and initial human studies (Maison et al. 1997; Maison et al. 1999; Maison et al. 2001). Stimulus-frequency OAEs (SFOAEs) were used for measuring efferent inhibition of cochlear responses. SFOAEs measured at a low probe level represent a single generation mechanism (coherent reflections; Shera and Guinan 1999) thereby avoid interactions from short-delay components (Moleti and Sisto 2016), provide frequency-specific measures and eliminate OAE-probe elicited efferent activity and MEMRs (Guinan et al. 2003). Changes in SFOAEs to various rates of AM in the elicitor were measured for constructing efferent MTFs.
METHODS
Subjects
Thirteen normal-hearing, young adults (mean age = 21.9 years; range = 19 to 28 years; males = 5; females = 8) who had no history of hearing or balance problems participated in this study. They had hearing thresholds of 15 dB HL or better at octave frequencies from 250 through 8000 Hz and normal middle ear function, defined as a type A tympanogram with a peak compensated static acoustic admittance between 0.35 and 1.75 mmho and the tympanometric peak pressure between − 50 to 100 daPa. Additionally, all subjects had measurable SFOAEs (Mishra and Talmadge 2018). All screening and experimental procedures were conducted inside a double-walled sound booth. Only the better ear, i.e., the ear with a lower hearing threshold at 1000 Hz, was selected for recording SFOAEs (right ears = 9). The subjects were instructed to stay as calm and quiet as they can be during the experimental procedures.
Stimulus-Frequency Otoacoustic Emissions
SFOAEs were measured using the equipment previously described in Mishra and Talmadge (2018). Briefly, stimulus generation and recording of ear canal signals were performed using the ER-10B+ microphone (with two ER-2 insert phones) probe (Etymotic Research, Elk Grove Village, IL) and were controlled via custom-built programs implemented in the RecordAppX software (developed by C. Talmadge) using a Macintosh computer. A MOTU 828x audio interface (MOTU, Cambridge, MA) was used for making analog-to-digital (44,100 Hz, 24 bits) and digital-to-analog conversions.
For evoking SFOAEs, a 40-dB SPL probe tone with a 60-dB suppressor tone was played into the subject’s ear canal (number of averages = 32). The frequency of the probe tone within 10 % of the nominal frequency of 1000 Hz in each subject was strategically selected corresponding to the nearest SFOAE spectral peak from an initial multi-frequency (700–1400 Hz), swept-tone SFOAE recording. This strategic selection of peak frequency for the probe tone ensures high signal-to-noise ratio (SNR) in the SFOAE recordings and robust efferent effects (Abdala et al. 2009; Henin et al. 2011; Mishra and Abdala 2015). In addition, the probe frequency was at least 50 Hz apart from any spontaneous emissions. The suppressor frequency was 1.1 times higher than the probe frequency (Johnson and Beshaler 2013). A standard, iso-voltage stimulus-calibration method that presents and maintains a constant voltage to the transducer was used (Souza et al. 2014). Calibrations were performed in a 2-cc coupler for OAE stimuli and efferent elicitors. Stimulus levels were monitored during the measurement using a spectral view in the recording software. When a significant deviation (> 5 %) in levels was observed in the spectral view, the recording was paused, and the run was repeated. Occasionally, the probe was refitted if the pausing of a given run did not solve the problem.
Efferent Response Measurements
The elicitor was either an unmodulated BBN (100 to 10,000 Hz) or an amplitude modulated BBN presented contralaterally and ipsilaterally at 60 dB SPL in the ear canal using an ER-2 transducer. The BBN had a 2.1-octave spectral notch centered at the probe tone frequency for both ipsilateral and contralateral conditions (Backus and Guinan 2006). For generating elicitors with AM (hereafter, AM elicitors), the notched BBN was amplitude modulated with a sine wave for seven different modulation frequencies—0.5, 1, 2, 4, 8, 16, and 100 Hz. The modulation frequencies (1–16 Hz) were selected based on their importance for speech recognition (Greenberg et al. 1996; Kanedera et al. 1997; Elliott and Theunissen 2009). The lowest (0.5 Hz) and highest (100 Hz) modulation frequencies were used as an additional buffer condition and for replicating previous studies, respectively. The modulated noise () is expressed as:
where is the wideband noise elicitor, n is the index of time samples, fm is the modulation frequency, μ is the modulation depth (μ = 1, implies 100 % modulation), and k is the correction factor () applied for keeping the energy constant between the unmodulated and modulated noises. All elicitor onsets and offsets were ramped by 5-ms long raised cosine ramps.
Figure 1 shows a visual analogy of the experimental protocol. Each measurement set contained two blocks: probe + suppressor (top panel) and probe + elicitor (middle panel). The time interval between two consecutive blocks was 2 s, and the presentation of these measurement blocks was interleaved and randomized. In both blocks, a probe tone was played ipsilaterally for 6 s. A suppressor or elicitor was added for 3 s, starting 1 s after the probe tone. The elicitor polarity was reversed with each presentation for canceling out the elicitor-induced artifacts, particularly for the ipsilateral stimulation. One insert phone of the ER-10B+ delivered the probe tone, whereas the other was used for the suppressor or elicitor presentation for minimizing potential distortions. The presentation of ipsilateral and contralateral elicitors was randomized across subjects.
Fig. 1.
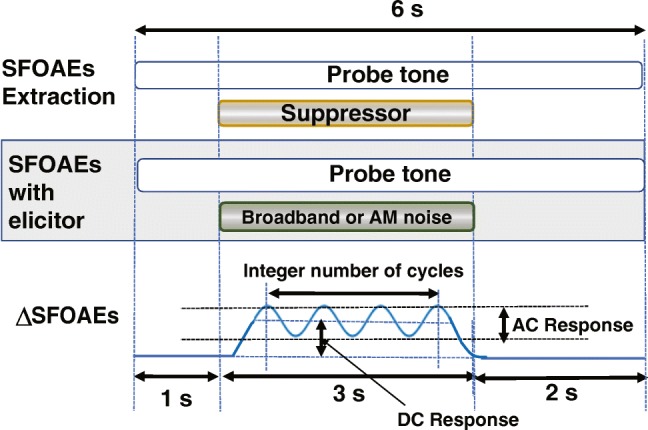
Schematic diagram of the measurement protocol. The top panel shows the SFOAE estimation by two-tone suppression paradigm. The shaded portion or the middle panel shows the paradigm for measuring the change in SFOAEs due to elicitor. The bottom panel shows an illustration of the change in SFOAEs due to the elicitor and alternating (AC) and direct current (DC) components
Analysis and Quantification of Efferent Responses
The recorded waveforms were processed via an offline artifact rejection for removing artifacts in the recording due to measurement noise and other artifacts. The artifact rejection algorithm computed the median of the waveform over a fixed time window of 500 ms and preserved the data points that were within 1.5 times the interquartile range (Mishra and Talmadge 2018).
The efferent response quantification was performed similar to a previous study (Backus and Guinan 2006). The analytic equivalent of the recorded waveform was observed as a complex-valued tone, C(n). The complex valued SFOAE was estimated as a function of time from C(n) using a digital heterodyne technique (Kim et al. 2001). The digital heterodyne works by shifting the center frequency of C(n), i.e., the probe frequency, to zero frequency and performing a low-pass filtering. A recursive exponential low-pass filter of the order 20 was used as the heterodyne filter for extracting the response to the probe tone from the recorded waveform (Shera and Zweig 1993). The bandwidth of the filter was chosen as 100 Hz for all modulated elicitors, except for 100 Hz-AM. For the 100 Hz-AM elicitor, the filter bandwidth was 400 Hz for capturing all signal components. The smaller bandwidth, sharper cutoff frequency, and zero phase delay of the recursive exponential filter effectively segregate the probe tone response from suppressor or elicitor. Changes in the filtered complex compound tone Cf(n) resulting from heterodyning can be attributed to elicitor-induced variations in SFOAEs, if the MEMR is absent. For computing the changes in the ear canal pressure due to the elicitor, the vector mean of Cf(n) over the pre-elicitor window of 500 ms, spanning from 550 to 50 ms before the onset of elicitor, was obtained and denoted as . Changes in SFOAEs (ΔSFOAEs)—efferent response expressed as a percentage change—were obtained by vector subtraction of from each sample of the compound waveform Cf(n) and were normalized by the individual baseline SFOAE.
The normalization by the baseline SFOAE of each subject ensures that there is no bias due to the difference in SFOAE levels, and only the relative changes induced by the efferents are considered. In order to examine the effect of amplitude modulation on efferent responses, ΔSFOAEs were decomposed into the alternating current (AC) and direct current (DC) responses (Backus 2005). Figure 1 (bottom panel) illustrates the AC and DC components of the efferent response. ΔSFOAEs were trimmed for the duration for which the elicitor was present (1 to 4 s). The samples corresponding to the first and last 100 ms duration segments were dropped from the analysis to exclude the potential effects of efferent build-up and decay. This ensured that only the steady-state portion of the response is considered for analysis. The waveform was further trimmed at the first and last zero-crossing points so that there was no abrupt transition (or, associated spectral splatter) and contained the maximum possible integer number of modulation frequency cycles. This resulted in a subset of ΔSFOAE time-series, denoted as ΔSFOAETrim.
Alternating Current Response
The AC response signifies the fraction of the AM signal that is carried through the efferent pathway for a given modulation frequency and was used to construct the MTF. The AC response was derived by extracting the AM profile from ΔSFOAETrim. For each modulation frequency, the peak-to-peak magnitude of the AM profile was estimated using a least squares fit (LSF) algorithm (Long et al. 2008). In addition, the peak-to-peak magnitude of the harmonic components, up to the order of 4, of the AM profile was estimated by LSF. The sum of the estimated magnitudes of the AM profile and its harmonic components represent the amount of AM that passes through the efferent pathway. This sum for each modulation frequency was normalized with respect to the magnitude of the DC component for the unmodulated elicitor.
Direct Current Response
The DC response is the steady-state portion of the efferent response, representing the baseline shifts in the entire duration of the response. It quantifies shifts in the overall steady-state response for different modulation frequencies. The DC response was calculated by taking the complex averages of ΔSFOAETrim over the entire elicitor duration:
Middle Ear Muscle Reflex
To ensure that there was no MEMR, the phase slope of the change in the compound tone due to the unmodulated elicitor was examined (Backus and Guinan 2006). Values lower than 4 ms were considered as MEMR effects. In addition, an SNR test over the phase values of Cf(n) was performed. The criterion for acceptable SNR was chosen as 95 % phase coherence. Phase coherence is an indicator of signal strength and was defined by the vector strength expressed as . Here, N is the number of data points in a given window (100 ms). Briefly, lower phase slope values (< 4 ms) in the presence of acceptable phase coherence can be interpreted as the dominance of MEMRs, whereas larger phase slope values with acceptable phase coherence is indicative of true efferent effects.
RESULTS
The measurement session for each subject lasted for 2 to 2.5 h. Typically, subjects did not take any breaks during the measurements. Out of 13 subjects, contralateral measurements for all modulated conditions were made in 11 subjects, whereas both ipsilateral contralateral measurements for all modulated conditions could be performed in 8 subjects. In two subjects, measurements could be completed only for the unmodulated condition. Measurements in some subjects needed more time, therefore, the availability of subjects affected completion of the protocol in every subject. The cumulative SNR across measurement conditions and subjects ranged from 17 to 33 dB (mean = 22.18 dB; SD = 5.28) potentially due to the selection of strategic peak frequencies within ± 10 % of 1000 Hz. The mean probe frequency was 1009.46 Hz (range 955 to 1099 Hz). None of the subjects had MEMRs for the 60 dB unmodulated elicitor tested similar to Backus and Guinan (2006). The phase slope values ranged from 8 to 14 ms, implying clear efferent effects.
Figure 2 shows the magnitude and phase of the ΔSFOAE vector (efferent response) for the unmodulated elicitor for one representative subject. Although the elicitor affected both magnitude and phase of SFOAEs, the analysis reported in the current study focused on the magnitude of the complex SFOAE vector that reveals important aspects of the efferent response to AM sounds. Figure 3 shows representative examples of the normalized efferent response magnitude for all modulated and unmodulated conditions. All subjects yielded qualitatively similar responses.
Fig. 2.
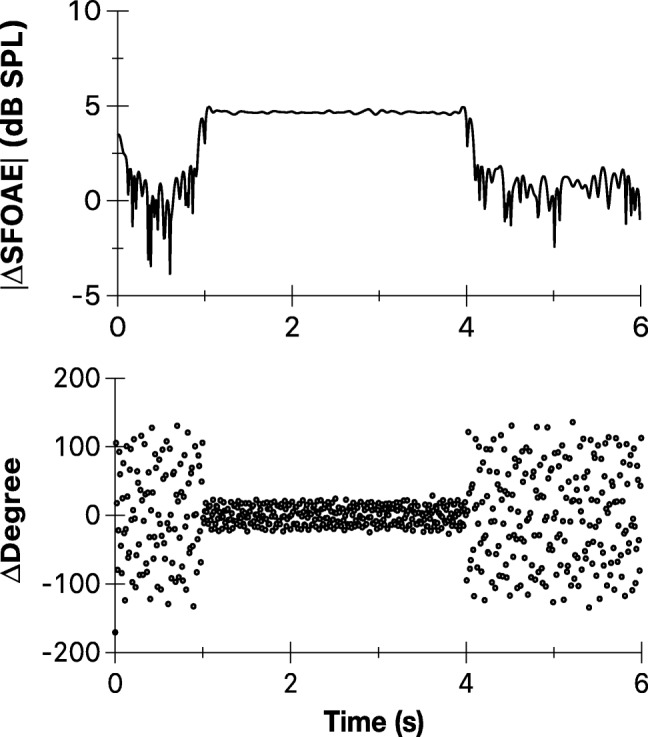
Representative examples of changes in SFOAEs for the unmodulated elicitor. Contralateral unmodulated elicitor (60 dB SPL) produced changes in SFOAE magnitude and phase
Fig. 3.

Representative examples of efferent responses for modulated and unmodulated elicitors. SFOAE magnitude changes plotted for various unmodulated and modulated ipsilateral elicitors. Raw data (dots) were smoothed by a moving average filter with a span of 20 samples. The y-axis is arbitrarily scaled for illustration
The efferent response (ΔSFOAEs) as a function of modulation frequency is plotted in Fig. 4. The DC response appears to decrease with modulation frequency up to 4 Hz and then increase with modulation frequency up to 16 Hz. Overall, unmodulated elicitors produced higher ΔSFOAEs compared with modulated elicitors. A trend for higher ΔSFOAEs was observed for ipsilateral compared with contralateral elicitors. A repeated measures analysis of variance (two elicitor laterality: ipsilateral and contralateral × 8 AM conditions: modulation frequencies 0.5 to 100 Hz, including the unmodulated elicitor), with Greenhouse-Geisser correction for sphericity violation, showed no significant main effect for elicitor laterality (F1, 6 = 0.80; P = 0.41). A significant main effect for modulation frequency (F3.20, 19.20 = 3.79; P = 0.03) was observed. The interaction between elicitor laterality and modulation frequency was not significant (F2.87, 17.20 = 0.82; P = 0.50). The shape of the relationship between modulation frequency and ΔSFOAEs showed a significant quadratic trend (F1, 6 = 9.69; P = 0.02). This is visible in Fig. 4 as the initial decrease and then increase in ΔSFOAEs with modulation frequency. To specifically answer whether AM elicitor with 100 Hz modulation frequency produces greater ΔSFOAEs, a separate RM-ANOVA (two elicitor laterality: ipsilateral and contralateral × two modulation conditions: modulation frequency 100 Hz and unmodulated elicitor) was conducted. There was no significant effect of elicitor laterality (F1, 8 = 0.62; P = 0.46), modulation condition (F1, 8 = 1.28; P = 0.29), or an interaction between them (F1, 8 = 0.09; P = 0.78).
Fig. 4.
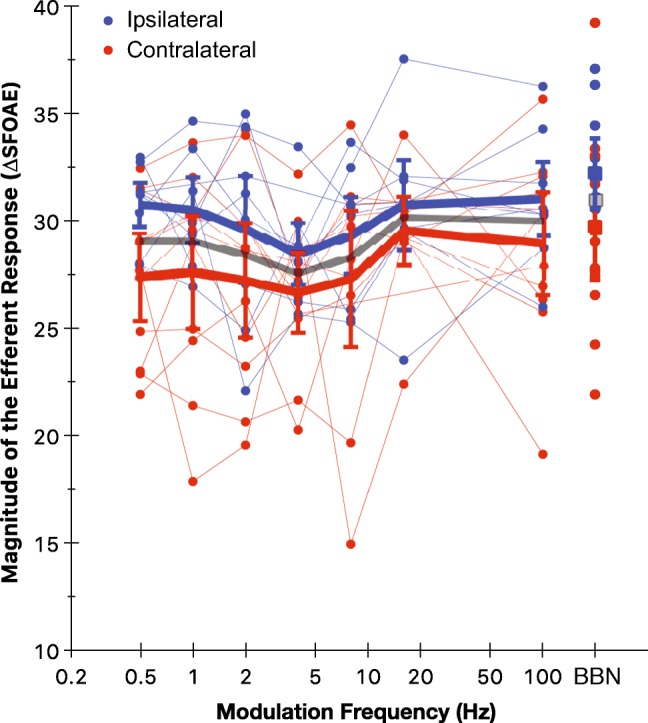
Efferent response as a function of modulation frequency. The magnitude of ΔSFOAEs or the DC response for individual subjects for ipsilateral (blue) and contralateral (red) elicitors. Mean values for the unmodulated (BBN) elicitor are shown as filled squares (■). Error bars show 95 % confidence intervals of the mean. Thin and thick lines, respectively, connect individual and mean values for various modulation frequencies. Gray line (and gray symbol) corresponds to grand mean for combined ipsilateral and contralateral elicitors. The x-axis is logarithmically scaled
The MTF of the efferent response for ipsilateral and contralateral stimulation is shown in Fig. 5. The estimated modulation depth was computed from the normalized AC responses. In other words, Fig. 5 shows the amount of modulation (estimated from the AC response; see Fig. 1 bottom panel) present in the efferent response for an elicitor with 100 % modulation. The amount of AM that the efferent system carries decreases with increasing modulation frequency with less than 20 % AM conducted at modulation frequencies above 4 Hz. Nearly, 10 to 20 % greater modulations are carried for the ipsilateral compared with contralateral elicitors depending on the modulation frequency. A mixed-effects model with logit link function and beta distribution for the residuals was used for examining significant trends and the effect of elicitor laterality (Ferrari and Cribari-Neto 2004). A logit link was applied because the dependent variable (normalized AC component of the efferent response) varied between 0 and 1, representing 0 and 100 % modulation depth, respectively. This function created a map of probability values from [0, 1] to [−∞, +∞]. The beta distribution for residuals was selected for the same purpose. The mixed-effects regression analysis revealed that the amount of AM decreases significantly with modulation frequency (estimate = − 1.52; SE = 0.07; P < 0.001) and is lower for contralateral relative to ipsilateral elicitors (estimate = − 0.69; SE = 0.23; P = 0.003). With the assumption that the MTF in Fig. 5 as a probability of response, the odds of response decrease by a factor of 1.52 (slope) for every unit increase in the modulation frequency (in log scale). The odds of response to contralateral relative to ipsilateral stimulation decrease greater by a factor of 0.69 for any given value of the modulation frequency.
Fig. 5.
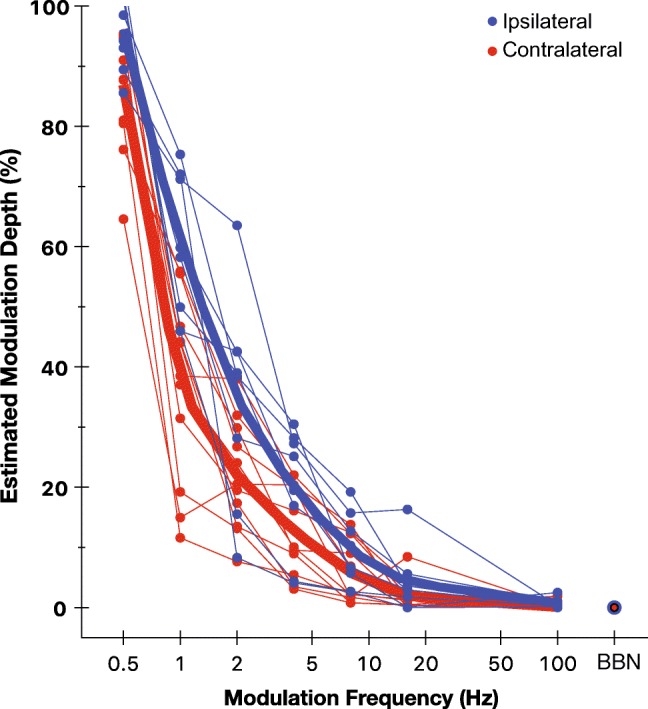
Modulation transfer function of the efferent response. The estimated modulation depth computed from the normalized AC component of the efferent response for individual subjects for ipsilateral (blue) and contralateral (red) elicitors. Thin lines connect individual values as a function of the modulation frequency. Thick lines show spline functions for mean values. The BBN represents no-AM condition. The x-axis is logarithmically scaled
Efferent MTFs could be modeled using a Butterworth low-pass filter. The correlation coefficient between the Butterworth filter and the MTF was + 0.99 and + 0.98 for ipsilateral and contralateral elicitors, respectively (P < 0.001). The magnitude response of a Butterworth filter with an order of 1 (roll-off = 6 dB/octave) and cutoff frequencies 4.73 Hz for ipsilateral elicitors and 3.34 Hz for contralateral elicitors accurately modeled the characteristic MTF.
DISCUSSION
The dynamic properties of the medial olivocochlear efferent system in humans were measured by examining changes in SFOAEs due to modulated and unmodulated elicitors presented ipsilaterally and contralaterally. Efferent effects characterized in the present study are based on SFOAEs with excellent SNRs and free from MEMR effects. However, attention was not controlled during OAE measurements. The attentional focus can vary in a given subject over the test duration and between subjects. This variation is expected to be random and may cancel out when examining the group data.
Acoustic stimulation of the efferent system using modulated and unmodulated elicitors produced changes in SFOAE magnitude and phase; however, the magnitude was used for quantifying important features of the efferent neural processing of AM sounds. The magnitude of the efferent response decreased with increasing modulation frequency from 0.5 to 4 Hz and then increased to saturate at 20 Hz (Fig. 4). The unmodulated elicitor yielded slightly larger efferent responses relative to modulated elicitors for modulation frequencies 2 to 8 Hz; however, responses to unmodulated and modulated elicitors were similar for other modulation frequencies. Of particular interest, the efferent responses to the unmodulated and modulated elicitor with 100 Hz modulation frequency were not significantly different. The MTF of the efferent response suggests that the ability of the efferent system to follow AM decreases with increasing modulation frequency.
Modulation Transfer Functions
Ipsilateral and contralateral BBN elicitors with 100 % modulation depth at various modulation frequencies were used to construct the MTF of the efferent response. The efferent response to AM sounds behaves as a Butterworth low-pass filter with an order of 1. The efferent pathway carries 90 to 100 % of AM information depending on ipsilateral or contralateral stimulation for 0.5 Hz modulation frequency. The percentage of AM information carried through the efferent system drops below 20 % for modulation frequencies greater than 4 Hz and reaches below 5 % for 16 Hz modulation frequency. At 100 Hz modulation frequency, the efferent system attenuates all AM information. In general, the ipsilateral efferent pathway showed a greater sensitivity to AM information compared with the contralateral pathway. The efferent response does not reveal any peak in the MTFs for the modulation frequencies tested.
The only other study on efferent MTFs conducted in guinea pigs showed that most single efferent neurons have a peak at ~ 100 Hz modulation frequency (Fig. 2 of Gummer et al. 1988). In addition, Gummer et al. (1988) found that four efferent neurons had MTFs which differed significantly from the majority of neurons. Of these four, two ipsilateral neurons with characteristic frequencies 2.2 and 6.1 kHz and one contralateral neuron with characteristic frequency 1.3 kHz responded to a broad range of modulation frequencies and showed a peak around 10 Hz modulation frequency. The fourth neuron—an ipsilateral neuron with a characteristic frequency of 9 kHz—showed a peak at 25 Hz modulation frequency. Besides species differences in efferent anatomy and physiology (e.g., Lopez-Poveda 2018 for review), there are important parameter differences that prevent a direct comparison of the MTF characteristics found in the present study with that of the Gummer et al. (1988). First, Gummer et al. (1988) measured individual neuronal responses, but without quantifying the summed or average response of the efferent neurons. Second, the carrier frequency of the AM sound varied from 0.7 to 19 kHz, depending on the individual characteristic frequency of a given efferent neuron. In the current study, a BBN elicitor (100 to 10,000 Hz) was used for generating AM sounds and the probe tone for SFOAE measurements was 1000 Hz.
100 Hz Modulation Frequency Is Not Special
Using robust SFOAE-based methods with both ipsilateral and contralateral elicitors, findings from the current study demonstrate that efferent processing is not uniquely sensitive to AM sounds with 100 Hz modulation frequency in humans, contrary to initial reports (Maison et al. 1997; Micheyl et al. 1999; Maison et al. 1999; Maison et al. 2001). However, present findings are consistent with the recent literature that does not support a greater response for the 100 Hz-AM elicitor (Boothalingam et al. 2014; Mertes 2018). Neither the magnitude of the efferent response (Fig. 4) nor the amount of AM (Fig. 5) carried through the efferent pathway was different for the unmodulated and the 100 Hz-AM elicitors.
In humans, the initial findings of increased efferent responses for 100 Hz-AM relative to unmodulated elicitors (Maison et al. 1997; Micheyl et al. 1999; Maison et al. 1999; Maison et al. 2001) were attributed to the peak in MTFs at ~ 100 Hz modulation frequency observed in guinea pigs (Gummer et al. 1988). However, an increase in the AC component of the efferent response at a given modulation frequency (100 Hz) does not necessarily lead to an increase in the magnitude of the efferent response. The initial findings could not be replicated in recent studies using similar and different approaches (Boothalingam et al. 2014; Mertes 2018). Although the reasons for larger efferent responses for 100 Hz-AM elicitors reported in initial human studies is not clear, the elicitor bandwidth difference between AM and pure tones could explain a relatively greater efferent response to AM tones found in one study (Maison et al. 1997). Amplitude modulation of a pure-tone inherently adds additional frequencies to the modulated tone. The efferent response is known to be larger for elicitors with wider bandwidths (Lilaonitkul and Guinan 2009b). This explanation is not applicable to BBN elicitors used in other studies (Maison et al. 1999; Maison et al. 2001). Nevertheless, a related question is if there is a biological need for human efferents to be sensitive to 100 Hz-AM? In fact, the evidence does not support the need for such a temporal sensitivity. If acoustic environments determine the evolution of efferent responses (Kirk and Smith 2003), there is no obvious reason to expect a greater efferent sensitivity to 100 Hz-AM sounds because most of the useful linguistic information for human speech is in modulation frequencies between 1 and 16 Hz (Greenberg et al. 1996; Kanedera et al. 1997).
Elicitor Laterality Effects: Ipsilateral Versus Contralateral Elicitors
Some interesting aspects of current findings are the similarities and differences between efferent responses produced by ipsilateral and contralateral elicitors. The pattern of variation in AM information and the magnitude of the efferent response with modulation frequency was similar for ipsilateral and contralateral elicitors. For both elicitor literalities, the AM information conducted by the efferent pathway decreased with increasing modulation frequencies. Likewise, both ipsilateral and contralateral elicitors do not reveal an enhanced efferent response to modulated relative to unmodulated sounds. Regardless of the elicitor laterality, compared with unmodulated elicitors, efferent responses to modulated elicitors were either slightly lower (for modulation frequencies 2 to 8 Hz), or similar in magnitude. The lowest efferent response magnitude was observed for 4 Hz modulation frequency for both ipsilateral and contralateral elicitors. The complex interaction between sluggish temporal behavior of the efferent response (onset delay = 25 ms, overall onset = 275 ms, and overall decay = 160 ms; Backus and Guinan 2006) and the brief no-energy periods in modulated elicitors (due to 100 % modulation depth) makes it difficult to predict the magnitude of efferent responses for various modulation frequencies. However, when the modulation frequency is high, the no-energy periods in the AM elicitors are extremely brief and may not let the efferent system turn off at all (Boothalingam et al. 2014; Backus 2005). Such an operation is expected to produce similar efferent response magnitudes for modulated and unmodulated elicitors; perhaps this is evident as the similarity in responses to 16 Hz- and 100 Hz-AM and unmodulated elicitors (Figs. 4 and 5).
It is important to consider intrinsic cochlear mechanisms such as two-tone suppression prior to comparing the differences produced by ipsilateral contralateral elicitors. Efferent effects can be measured ipsilaterally using a forward-masking paradigm (Berlin et al. 1995). However, for comparing measurements in the same elicitor window, i.e., during the elicitor presentation, ipsilateral measurement of the efferent response requires a simultaneous presentation of the SFOAE probe tone and the elicitor. Such presentation may reduce SFOAE magnitudes, thereby impacting efferent responses. This was minimized by using an elicitor with a spectral notch centered at the probe tone frequency. Backus and Guinan (2006) showed that a 2.1-octave spectral notch removes all energy that produces measurable two-tone suppression effects based on measurements in three subjects. The 2.1-octave bandwidth appears to be a relatively stringent criterion for avoiding intracochlear suppression effects for 1000 Hz probe. It is argued that the observed differences between ipsilateral and contralateral elicitors can be interpreted as true differences in efferent mechanisms. However, it must be cautioned that the contribution of intracochlear effects cannot be entirely ruled out because the same notch width may not be transferable to the current sample. In general, trends for larger efferent response magnitudes were observed for ipsilateral relative to contralateral elicitors for all modulated and unmodulated noises. This is not surprising because ipsilateral and contralateral differences are reported only for specific conditions in the literature. Nearly equal efferent effects have been reported for ipsilateral and contralateral BBN elicitors (Guinan et al. 2003; Lilaonitkul and Guinan 2009b; Boothalingam et al. 2016). There is also no systematic difference in the time course of efferent reflex between ipsilateral and contralateral elicitors (Backus and Guinan 2006). This, however, does not mean that there are no differences between the ipsilateral and contralateral efferent loops. For narrow-band noise (NBN) elicitors, SFOAEs measured in the post-elicitor window showed greater efferent effects for ipsilateral than contralateral elicitors at 500 and 1000 Hz, but no clear difference was observed at 4000 Hz (Fig. 1 of Lilaonitkul and Guinan 2009b). In contrast, SFOAEs measured during contralateral stimulation showed larger efferent effects than did ipsilateral elicitors for the BBN elicitor and most NBN bandwidths, except for the half-octave band. In another study, Lilaonitkul and Guinan (2009a) showed that ipsilateral and contralateral elicitors produce different efferent effect vs. elicitor frequency plots.
Efferent MTFs demonstrate that the ipsilateral efferent pathway can encode 10–20 % greater AM information compared with the contralateral pathway (Fig. 5). Although both ipsilateral and contralateral MTFs can be modeled using a Butterworth low-pass filter, they have different cutoff frequencies. The contralateral pathway acts as a relatively stronger low-pass filter for processing AM information. These findings inform regarding the ipsilateral and contralateral differences in a new way beyond the standard efferent response magnitude differences. This may imply that the contralateral effects, which are routinely measured in efferent studies, may not accurately represent the ipsilateral properties and that ipsilateral and contralateral fibers could have different actions in the cochlea leading to different functions.
Functional Implications
Recent experiments suggest that efferents may be involved in supra-threshold hearing (Yeend et al. 2017; Boero et al. 2018; Carney 2018). Of particular importance, findings from genetically-modified animal models render support for the involvement of efferents in supra-threshold perceptual deficits as well (Boero et al. 2018). For understanding the potential role of efferents in supra-threshold sound processing, it is instructive to consider the neural encoding of AM information by the efferents.
In response to speech, the output of cochlear filters yields signals which carry information in the slow fluctuations in amplitude over time (the envelope) and the rapid fluctuations termed as temporal fine structure (Rosen 1992). Efferent MTFs can inform whether efferents operate on the information bearing part of the speech envelope. Modulation frequency components below 8 Hz are critical for speech comprehension (Drullman et al. 1994). This critical modulation corresponds to the rate of syllables from 2 to 5 Hz (Pickett 1999). Current findings suggest that efferents carry less than 50 % of AM information for modulation frequencies above 2 Hz, important for speech recognition. In addition, the MTFs have a high-frequency cutoff (< 5 Hz) implying that efferents are unlikely to fully act on the important modulations for speech. This may, in fact, be advantageous for speech perception considering the sluggish onset time constants (Backus and Guinan 2006). For instance, if the efferents closely followed the modulations in speech, it could inhibit cochlear responses at an instant when it was probably not needed. In addition, the speech envelope in real-life listening situations likely varies with time. Due to the sluggish nature of the efferents, this will probably smoothen the potential dips or the AC components of the efferent response over time. Therefore, the DC components of the efferent response likely play a greater role in improving signal detection in noise by controlling the cochlear amplifier gain. It is important to note that these predictions are grounded in the sluggish nature of the efferent response that was based on measurements using broadband elicitors at a single probe frequency (Backus and Guinan 2006).
Another aspect of current findings that may have some relevance to speech recognition is that the dip in the efferent response magnitude at 4 Hz modulation frequency (Fig. 4). Interestingly, this dip corresponds to the peak in the temporal modulation spectrum power that lies between 4 and 6 Hz for speech (Greenberg and Arai 2001). Thus, it is possible that efferents attenuate the least the cochlear amplifier gain for modulations for speech that have high power. However, how this is useful for speech recognition remains to be understood. One speculation is that higher power in the stimulus may require less focused attention for processing of the information by the auditory system. Converging evidence suggests that the lack of auditory attention produces a lower efferent response in humans (de Boer and Thornton 2007; Mishra 2014). The predictions regarding the functional significance of novel efferent mechanisms found in the current study can be tested using computational modeling approaches (Clark et al. 2012). In addition, the measurement of the effects of frequency, modulation depth, and bilateral efferent stimulation can provide further insights into the functioning of the efferents.
Acknowledgments
The authors thank Samantha Zambrano for assistance with data collection and Anup Amatya for statistical consultation. A preliminary study, including portions of the data, was presented at the 46th Annual Scientific and Technology Conference of the American Auditory Society in Scottsdale, February 28–March 2, 2019.
Funding Information
This work was supported by a grant from the National Institutes of Health, National Institute on Deafness and other Communication Disorders (R03DC014573 to SKM).
Footnotes
Publisher’s Note
Springer Nature remains neutral with regard to jurisdictional claims in published maps and institutional affiliations.
References
- Abdala C, Mishra SK, Williams TL. Considering distortion product otoacoustic emission fine structure in measurements of the medial olivocochlear reflex. J Acoust Soc Am. 2009;125:1584–1594. doi: 10.1121/1.3068442. [DOI] [PMC free article] [PubMed] [Google Scholar]
- Backus BC (2005) Using stimulus frequency otoacoustic emissions to study basic properties of the human medial olivocochlear reflex. Thesis, Massachusetts Institute of Technology
- Backus BC, Guinan JJ. Time-course of the human medial olivocochlear reflex. J Acoust Soc Am. 2006;119:2889–2904. doi: 10.1121/1.2169918. [DOI] [PubMed] [Google Scholar]
- Berlin CI, Hood LJ, Hurley AE, Wen H, Kemp DT. Binaural noise suppresses linear click-evoked otoacoustic emissions more than ipsilateral or contralateral noise. Hear Res. 1995;87:96–103. doi: 10.1016/0378-5955(95)00082-F. [DOI] [PubMed] [Google Scholar]
- de Boer J, Thornton ARD. Effect of subject task on contralateral suppression of click evoked otoacoustic emissions. Hear Res. 2007;233:117–123. doi: 10.1016/j.heares.2007.08.002. [DOI] [PubMed] [Google Scholar]
- Boero LE, Castagna VC, Di Guilmi MN, et al. Enhancement of the medial olivocochlear system prevents hidden hearing loss. J Neurosci. 2018;38:7440–7451. doi: 10.1523/JNEUROSCI.0363-18.2018. [DOI] [PMC free article] [PubMed] [Google Scholar]
- Boothalingam S, Purcell D, Scollie S. Influence of 100Hz amplitude modulation on the human medial olivocochlear reflex. Neurosci Lett. 2014;580:56–61. doi: 10.1016/j.neulet.2014.07.048. [DOI] [PubMed] [Google Scholar]
- Boothalingam S, Macpherson E, Allan C, Allen P, Purcell D. Localization-in-noise and binaural medial olivocochlear functioning in children and young adults. J Acoust Soc Am. 2016;139:247–262. doi: 10.1121/1.4939708. [DOI] [PubMed] [Google Scholar]
- Carney LH. Supra-threshold hearing and fluctuation profiles: implications for sensorineural and hidden hearing loss. J Assoc Res Otolaryngol. 2018;19:331–352. doi: 10.1007/s10162-018-0669-5. [DOI] [PMC free article] [PubMed] [Google Scholar]
- Clark NR, Brown GJ, Jürgens T, Meddis R. A frequency-selective feedback model of auditory efferent suppression and its implications for the recognition of speech in noise. J Acoust Soc Am. 2012;132:1535–1541. doi: 10.1121/1.4742745. [DOI] [PubMed] [Google Scholar]
- Drullman R, Festen JM, Plomp R. Effect of temporal envelope smearing on speech reception. J Acoust Soc Am. 1994;95:1053–1064. doi: 10.1121/1.408467. [DOI] [PubMed] [Google Scholar]
- Drullman R, Festen JM, Houtgast T. Effect of temporal modulation reduction on spectral contrasts in speech. J Acoust Soc Am. 1996;99:2358–2364. doi: 10.1121/1.415423. [DOI] [PubMed] [Google Scholar]
- Elliott TM, Theunissen FE. The modulation transfer function for speech intelligibility. PLoS Comput Biol. 2009;5:e1000302. doi: 10.1371/journal.pcbi.1000302. [DOI] [PMC free article] [PubMed] [Google Scholar]
- Ferrari SLP, Cribari-Neto F. Beta regression for modelling rates and proportions. J Appl Stat. 2004;35:799–815. doi: 10.1080/0266476042000214501. [DOI] [Google Scholar]
- Giraud AL, Poeppel D. Cortical oscillations and speech processing: emerging computational principles and operations. Nat Neurosci. 2012;15:511–517. doi: 10.1038/nn.3063. [DOI] [PMC free article] [PubMed] [Google Scholar]
- Giraud A, Lorenzi C, Ashburner J, et al. Representation of the temporal envelope of sounds in the human brain. J Neurophysiol. 2000;84:1588–1598. doi: 10.1152/jn.2000.84.3.1588. [DOI] [PubMed] [Google Scholar]
- Greenberg S, Arai T (2001) The relation between speech intelligibility and the complex modulation spectrum. Proc Eur Conf Speech Commun Technol:473–476
- Greenberg S, Hollenback J, Ellis D (1996) Insights into spoken language gleaned from phonetic transcription of the switchboard corpus. Int Conf Spok Lang Process:S32–S35
- Guinan JJ, Backus BC, Lilaonitkul W, Aharonson V. Medial olivocochlear efferent reflex in humans: otoacoustic emission (OAE) measurement issues and the advantages of stimulus frequency OAEs. J Assoc Res Otolaryngol. 2003;4:521–540. doi: 10.1007/s10162-002-3037-3. [DOI] [PMC free article] [PubMed] [Google Scholar]
- Gummer M, Yates GK, Johnstone BM. Modulation transfer function of efferent neurones in the guinea pig cochlea. Hear Res. 1988;36:41–52. doi: 10.1016/0378-5955(88)90136-0. [DOI] [PubMed] [Google Scholar]
- Henin S, Thompson S, Abdelrazeq S, Long GR. Changes in amplitude and phase of distortion-product otoacoustic emission fine-structure and separated components during efferent activation. J Acoust Soc Am. 2011;129:2068–2079. doi: 10.1121/1.3543945. [DOI] [PubMed] [Google Scholar]
- Houtgast T, Steeneken HJM. A review of the MTF concept in room acoustics and its use for estimating speech intelligibility in auditoria. J Acoust Soc Am. 1985;77:1069–1077. doi: 10.1121/1.392224. [DOI] [Google Scholar]
- Johnson TA, Beshaler L. Influence of stimulus parameters on amplitude-modulated stimulus frequency otoacoustic emissions. J Acoust Soc Am. 2013;134:1121–1133. doi: 10.1121/1.4812766. [DOI] [PMC free article] [PubMed] [Google Scholar]
- Joris PX, Schreiner CE, Rees A. Neural processing of amplitude-modulated sounds. Physiol Rev. 2004;84:541–577. doi: 10.1152/physrev.00029.2003. [DOI] [PubMed] [Google Scholar]
- Timpe-Syverson GK, Decker TN (1999) Attention effects on distortion- product otoacoustic emissions with contralateral speech stimuli. J Am Acad Audiol 10:371–378 [PubMed]
- Kalaiah MK, Nanchirakal JF, Kharmawphlang L, Noronah SC. Contralateral suppression of transient evoked otoacoustic emissions for various noise signals. Hear Balanc Commun. 2017;15:84–90. doi: 10.1080/21695717.2017.1311504. [DOI] [Google Scholar]
- Kanedera N, Arai T, Hermansky H, Pavel M (1997) On the importance of various modulation frequencies for speech recognition. Proc Eurospeech:1079–1082
- Kim DO, Dorn PA, Neely ST, Gorga MP. Adaptation of distortion product otoacoustic emission in humans. J Assoc Res Otolaryngol. 2001;2:31–40. doi: 10.1007/s101620010066. [DOI] [PMC free article] [PubMed] [Google Scholar]
- Kirk EC, Smith DW. Protection from acoustic trauma is not a primary function of the medial olivocochlear efferent system. J Assoc Res Otolaryngol. 2003;4:445–465. doi: 10.1007/s10162-002-3013-y. [DOI] [PMC free article] [PubMed] [Google Scholar]
- Lilaonitkul W, Guinan JJ. Reflex control of the human inner ear : a half-octave offset in medial efferent feedback that is consistent with an efferent role in the control of masking. J Neurophysiol. 2009;101:1394–1406. doi: 10.1152/jn.90925.2008. [DOI] [PMC free article] [PubMed] [Google Scholar]
- Lilaonitkul W, Guinan JJ. Human medial olivocochlear reflex: effects as functions of contralateral, ipsilateral, and bilateral elicitor bandwidths. J Assoc Res Otolaryngol. 2009;10:459–470. doi: 10.1007/s10162-009-0163-1. [DOI] [PMC free article] [PubMed] [Google Scholar]
- Long GR, Talmadge CL, Lee J. Measuring distortion product otoacoustic emissions using continuously sweeping primaries. J Acoust Soc Am. 2008;124:1613–1626. doi: 10.1121/1.2949505. [DOI] [PMC free article] [PubMed] [Google Scholar]
- Lopez-Poveda EA. Olivocochlear efferents in animals and humans: from anatomy to clinical relevance. Front Neurol. 2018;9:1–18. doi: 10.3389/fneur.2018.00197. [DOI] [PMC free article] [PubMed] [Google Scholar]
- Maison S, Micheyl C, Collet L. Medial olivocochlear efferent system in humans studied with amplitude-modulated tones. J Neurophysiol. 1997;77:1759–1768. doi: 10.1152/jn.1997.77.4.1759. [DOI] [PubMed] [Google Scholar]
- Maison S, Micheyl C, Collet L. Sinusoidal amplitude modulation alters contralateral noise suppression of evoked otoacoustic emissions in humans. Neuroscience. 1999;91:133–138. doi: 10.1016/S0306-4522(98)00608-3. [DOI] [PubMed] [Google Scholar]
- Maison S, Durrant J, Gallineau C, et al. Delay and temporal integration in medial olivocochlear bundle activation in humans. Ear Hear. 2001;22:65–74. doi: 10.1097/00003446-200102000-00007. [DOI] [PubMed] [Google Scholar]
- Mertes IB. Human medial efferent activity elicited by dynamic versus static contralateral noises. Hear Res. 2018;365:100–109. doi: 10.1016/j.heares.2018.05.007. [DOI] [PubMed] [Google Scholar]
- Micheyl C, Maison S, Carlyon RP, Andéol G, Collet L. Contralateral suppression of transiently evoked otoacoustic emissions by harmonic complex tones in humans. J Acoust Soc Am. 1999;105:293–305. doi: 10.1121/1.424525. [DOI] [PubMed] [Google Scholar]
- Mishra SK. Attentional modulation of medial olivocochlear inhibition: evidence for immaturity in children. Hear Res. 2014;318:31–36. doi: 10.1016/j.heares.2014.10.009. [DOI] [PubMed] [Google Scholar]
- Mishra SK, Abdala C. Stability of the medial olivocochlear reflex as measured by distortion product otoacoustic emissions. J Speech, Lang Hear Res. 2015;58:122–134. doi: 10.1044/2014_JSLHR-H-14-0013. [DOI] [PMC free article] [PubMed] [Google Scholar]
- Mishra SK, Talmadge CL. Sweep-tone evoked stimulus frequency otoacoustic emissions in humans : development of a noise-rejection algorithm and normative features. Hear Res. 2018;358:42–49. doi: 10.1016/j.heares.2017.11.006. [DOI] [PubMed] [Google Scholar]
- Moleti A, Sisto R. Localization of the reflection sources of stimulus-frequency otoacoustic emissions. J Assoc Res Otolaryngol. 2016;17:393–401. doi: 10.1007/s10162-016-0580-x. [DOI] [PMC free article] [PubMed] [Google Scholar]
- Pickett JM (1999) The acoustics of speech communication: fundamentals, speech perception theory, and technology. Allyn and Bacon, Boston, MA
- Picton TW, Skinner CR, Champagne SC, Kellett AJC, Maiste AC. Potentials evoked by the sinusoidal modulation of the amplitude or frequency of a tone. J Acoust Soc Am. 1987;82:165–178. doi: 10.1121/1.395560. [DOI] [PubMed] [Google Scholar]
- Rosen S. Temporal information in speech: acoustic, auditory and linguistic aspects. Philos Trans R Soc Lond Ser B Biol Sci. 1992;336:367–373. doi: 10.1098/rstb.1992.0070. [DOI] [PubMed] [Google Scholar]
- Shera CA, Guinan JJ. Evoked otoacoustic emissions arise by two fundamentally different mechanisms: a taxonomy for mammalian OAEs. J Acoust Soc Am. 1999;105:782–798. doi: 10.1121/1.426948. [DOI] [PubMed] [Google Scholar]
- Shera CA, Zweig G. Noninvasive measurement of the cochlear traveling-wave ratio. J Acoust Soc Am. 1993;93:3333–3352. doi: 10.1121/1.405717. [DOI] [PubMed] [Google Scholar]
- Souza NN, Dhar S, Neely ST, Siegel JH. Comparison of nine methods to estimate ear-canal stimulus levels. J Acoust Soc Am. 2014;136:1768–1787. doi: 10.1121/1.4894787. [DOI] [PMC free article] [PubMed] [Google Scholar]
- Viemeister NF. Temporal modulation transfer functions based upon modulation thresholds. J Acoust Soc Am. 1979;66:1364–1380. doi: 10.1121/1.383531. [DOI] [PubMed] [Google Scholar]
- Yeend I, Beach EF, Sharma M, Dillon H. The effects of noise exposure and musical training on suprathreshold auditory processing and speech perception in noise. Hear Res. 2017;353:224–236. doi: 10.1016/j.heares.2017.07.006. [DOI] [PubMed] [Google Scholar]