

Abstract
The craniofacial area is prone to trauma or pathologies often resulting in large bone damages. One potential treatment option is the grafting of a tissue‐engineered construct seeded with adult mesenchymal stem cells (MSCs). The dental pulp appears as a relevant source of MSCs, as dental pulp stem cells display strong osteogenic properties and are efficient at bone formation and repair. Fibroblast growth factor‐2 (FGF‐2) and/or hypoxia primings were shown to boost the angiogenesis potential of dental pulp stem cells from human exfoliated deciduous teeth (SHED). Based on these findings, we hypothesized here that these primings would also improve bone formation in the context of craniofacial bone repair. We found that both hypoxic and FGF‐2 primings enhanced SHED proliferation and osteogenic differentiation into plastically compressed collagen hydrogels, with a much stronger effect observed with the FGF‐2 priming. After implantation in immunodeficient mice, the tissue‐engineered constructs seeded with FGF‐2 primed SHED mediated faster intramembranous bone formation into critical size calvarial defects than the other groups (no priming and hypoxia priming). The results of this study highlight the interest of FGF‐2 priming in tissue engineering for craniofacial bone repair. stem cells translational medicine 2019;8:844&857
Keywords: Bone engineering, Mesenchymal stem cells, Hypoxia, Intramembranous ossification, Calvaria
Significance Statement.
This study reveals that FGF‐2 priming of tissue engineered constructs formed by dental pulp stem cells from human exfoliated deciduous teeth seeded within plastically compressed collagen scaffolds strongly enhances craniofacial bone regeneration.
Introduction
The craniofacial area is often prone to trauma but also to numerous pathologies including rare disorders or cancer. These conditions often result in large bone damages that have important functional and aesthetic consequences. Autologous bone grafting is the current “gold standard” procedure to treat large bone defects 1, but it requires a sufficient amount of bone in the donor site with risk of failure and uncontrolled resorption at both sites (donors and grafted) 2. Other options have been tested such as allografts and xenografts, which present risk of immunoreaction and contamination, and synthetic grafts, which are osteoconductive but lack osteoinductive properties 3, 4.
The grafting of a tissue‐engineered construct seeded with adult mesenchymal stem cells (MSCs) into injured and ischemic tissues has emerged in the past decade as a potential therapeutic option for bone repair and regeneration 5. The success of such an approach is directly conditioned by the establishment of a fully functional vascular network within the grafted tissue construct to allow its survival. Identifying stem or progenitor cell populations able to participate in tissue regeneration and promote angiogenesis is therefore essential for developing such novel tissue engineering strategies 6. Dental pulp mesenchymal stem cells (DPSC) have been introduced as a potential source for tissue engineering because of their easy access and less invasive approach for harvest as well as their extended potential for proliferation, differentiation, and their paracrine properties 7, 8, 9, 10. Many studies have shown that DPSC display a strong angiogenic potential 11, 12, 13, with the ability to interact with endothelial cells 14, 15, 16, or directly differentiate into endothelial cells 17, 18. In the context of craniofacial bone regeneration, the dental pulp appears as a promising source of MSCs as DPSC present similar embryonic origins than most of the anterior skull bones 9, 19, display strong osteogenic properties 20, and are efficient at in vivo bone formation and repair 19, 21, 22, 23. in vitro and preclinical studies have further revealed that, among DPSC, those derived from deciduous teeth (SHED for “stem cells from human exfoliated deciduous teeth” 24) were particularly suitable for orofacial bone regeneration 25, 26, 27, 28, 29.
A large panel of biomaterials has been used as support for bone tissue engineering approaches, including three‐dimensional (3D) collagen‐based biomimetic hydrogel scaffolds 30, 31. These hydrogel scaffolds are biocompatible, biodegradable with low antigenicity, which provide a favorable environment to support osteoblast attachment, proliferation, and differentiation 32, 33. However, the high rate of fluid (95%) confers bad mechanical properties for bone tissue replacement application 34. To bypass this downside, plastic compression of the scaffold was introduced to increase collagen fibrillar density by removing the excess of fluid 35. Plastic compression creates a collagen matrix with a fibrillar density similar to the osteoid tissue 36, which places the cells in an osteogenic environment while keeping intact their proliferation and differentiation potentials. Supporting the interest of this approach for bone regeneration, our team recently demonstrated the osteogenic potential of dense collagen gel scaffolds seeded with DPSC implanted in a rat critical‐size calvarial defect model 21.
Some studies have reported either the positive or negative effect of fibroblast growth factor‐2 (FGF‐2) on bone formation depending on the cell type, the state of differentiation, the growth factor concentration, and its treatment duration 37, 38, 39, 40, 41. It was also shown that FGF‐2 can stimulate cell growth and osteogenic differentiation by supporting the recruitment of osteoprogenitor cells, their proliferation and differentiation into mature osteoblasts 38. We have previously demonstrated that (a) FGF‐2 and/or hypoxia primings notably enhanced the proportion of SHED expressing stemness‐related markers including STRO‐1 and CD146; (b) FGF‐2 enhanced the proangiogenic effect of SHED in a 3D tubulogenesis model; and (c) FGF‐2 priming of SHED had a stronger impact on angiogenesis than hypoxic priming within tissue‐engineered pulp constructs implanted subcutaneously in SCID mice 39. Based on these findings and on the previous studies mentioned above, we hypothesized that FGF‐2 priming of MSCs derived from the dental pulp would also improve bone formation in the context of craniofacial bone repair in immunodeficient (nude) mice to avoid transplant rejection. We found that FGF‐2 priming boosted SHED proliferation and osteogenic differentiation into plastically compressed collagen hydrogels. After implantation, the tissue‐engineered constructs seeded with FGF‐2 primed SHED mediated faster intramembranous bone formation into critical size calvarial defects in nude mice, when compared with either of the two groups (no priming and hypoxia priming) that produced smaller amounts of new bone. The results of this study show the interest of FGF‐2 priming for craniofacial bone repair.
Materials and Methods
Cell Culture
Healthy exfoliated human deciduous teeth were collected from children aged 3 to 7 years with the informed consent of the patients and their parents, according to ethical guidelines set by French bioethics law and with a dedicated authorization for our team (n° DC‐2009‐927). Dental pulp stem cells derived from deciduous teeth (SHED) were isolated and expanded following an established protocol 9, 24. For all experiments, SHED were used between passages 3 and 4.
Scaffold Preparation and In Vitro Osteogenic Differentiation
Plastically compressed collagen gels were used as 3D scaffolds and were prepared as previously described 31, 35, 42. Briefly, 3.2 ml of sterile rat‐tail collagen type I (First Link Ltd., Wolverhampton, U.K.) at a protein concentration of 2.0 mg/ml in 0.1% acetic acid was mixed with 0.4 ml of 10× Dulbecco's Modified Eagle Medium (DMEM) and neutralized by 0.4 ml of 10× HCO3‐ and dropwise addition of 0.1 N NaOH to pH ∼7.4. After neutralization, SHED were incorporated into the collagen solution at a cell density of 150,000 cells per milliliter of collagen and then a quantity of 0.9 ml per well was pipetted into a four‐well plate, followed by 30 minutes of incubation at 37°C. After gelling, highly hydrated hydrogels (with <0.5 wt% fibrillar collagen density) were placed on a stack of blotting paper, nylon, and stainless mesh, and dense collagen scaffolds (with >10 wt% fibrillar collagen density) were produced by the application of an unconfined compressive stress of 1 kPa for 5 minutes to remove excess casting fluid, and after the scaffolds were kept at 37°C under 5% CO2 43. Twenty‐four hours after compression, scaffolds were exposed to (a) 24 hours hypoxic priming (1% O2); (b) 72 hours FGF‐2 priming (10 ng/ml) 39; or (c) regular culture conditions (control). For osteogenic differentiation, scaffolds were cultured for 21 days in 12‐well plates with osteogenic medium (DMEM media supplemented with 50 μM l‐ascorbic acid sodium salt, 10−8 nM dexamethasone, 10 mM β‐glycerophosphate, 10% fetal bovine serum, and 1% penicillin/streptomycin). For all the following in vitro experiments, at least three biological replicates were performed in triplicate for each group and for each time‐point. Each experiment was repeated at least three times.
Cell Viability and Collagen Titration
To examine cell growth and division, scaffolds were evaluated in the complete medium. At days 1, 4, 7, 11, and 14, dense collagen scaffolds were incubated in the medium containing 10% AlamarBlue for 4 hours at 37°C and 5% CO2. The culture medium was removed from each scaffold, and centrifuged. Subsequently, 100 μl of the cultured medium supernatant was placed on 96‐well plates and detected by measuring absorbance. Readings were carried out at absorbance 570 nm and 595 nm using microplate reader (Model EL800; Bio‐Instruments, Winooski, VT). Reduction of AlamarBlue mediated by cells was generated by plating SHED at the same density in standard cell culture dishes. Acellular scaffolds were used as negative control. After assaying the medium of wells containing AlamarBlue, the scaffolds were washed in MEM before the fresh medium was added, allowing monitoring to continue. The concentration of type I collagen solution was estimated by hydroxyproline titration at days 7 and 14 of each group using the Bergman and Loxley procedure.
Micro‐Computed Tomography
Dense collagen scaffolds cultured under osteogenic conditions were imaged using an x‐ray micro‐CT device (Quantum FX Caliper, Life Sciences, Perkin Elmer, Waltham, MA) hosted by the PIV Platform, EA2496, Montrouge, France. The x‐ray source was set at 70 kV and 200 μA. Tridimensional images were acquired with an isotropic voxel size of 10 μm. Full 3D high‐resolution raw data were obtained by rotating both the x‐ray source and the flat panel detector 360° around the sample (scanning time: 3 minutes). Views are reconstructed in stack of images contained 512 × 512 × 512 voxels. Internal calibration system was used in Hounsfield unit (HU) where the vacuum value is −1,000 and the water is 0. Quantification of calcifications inside the samples was done using Analyze 11.0 (Biomedical Imaging Resource, Mayo Clinic, Rochester, MN). First stack data was filtered with a low‐pass 3 × 3 × 1. A global threshold (−400 HU to the maximum) was done to obtain the total volume of the sample. A second threshold was applied (800 HU to the maximum) to obtain the percentage of calcification per samples volume. Measurements were performed at day 21 on 10 scaffolds in each group (control, hypoxia priming, and FGF‐2 priming), and were expressed as percentage ratio mineralized volume over tissue volume (Mv/Tv%) as previously described 44.
Histology
Samples were fixed in 4% paraformaldehyde and embedded in paraffin for sectioning (n = 6 per group). Seven micrometer thick serial sections were dewaxed, rehydrated and stained with von Kossa staining, Sirius Red, processed for alkaline phosphatase (ALP) activity used as a marker of osteogenic cell differentiation. Histology sections were incubated with naphthol ASTR phosphate (Sigma–Aldrich, St. Louis, MO) and diazonium fast blue RR salt (Sigma–Aldrich) for 30 minutes at 37°C (pH 9) in the presence of MgCl2. Alizarin Red was used as a mineralization marker, showing specifically calcium ions. The slides were rinsed, dehydrated and mounted for observation with an optical microscope (Nikon E600 POL) or an epifluorescence microscope (AXIO 100 Zeiss). Marked cells (ALP) and calcium deposits (Alizarin Red) were quantified using ImageJ software (six sections were counted for each sample).
Immunohistochemistry
Sections (n = 3 per group) were dewaxed, and after rehydration, sections were blocked using 5% bovine serum albumin/phosphate‐buffered saline (PBS), and treated with 0.25 U/ml chondoinitase (Sigma–Aldrich) for 20 minutes at 37°C for DMP1 detection. Sections were incubated for 12 hours at 4°C with rabbit antihuman osteopontin (OPN) antibody (LF‐166) or rabbit antihuman dentin matrix protein 1 (DMP1) antibody (LF148, both kindly provided by Larry W. Fisher) diluted 1:100 in 5% bovine serum albumin/PBS. Sections were washed and then incubated with peroxidase‐conjugated anti‐IgG diluted 1:100 in the same buffer. Peroxidase activity was detected using a diamino‐benzadine substrate kit from (Sigma–Aldrich) following the manufacturer's instructions. Nonspecific staining was assessed by replacing the primary antibody by nonimmune serum. Each slice was observed by microscope as described below.
Western Blotting
Protein homogenates (20 μg) were subjected to SDS‐PAGE on 4%–20% precast gels (Mini‐PROTEAN TGX Precast Gels, Bio‐Rad, Hercules, CA) and transferred onto a nitrocellulose membrane (Bio‐Rad). Membranes were incubated with anti‐DMP1 (1/2,000, LF‐148) and anti‐OPN (1/2,000, LF‐166) antibodies overnight at 4°C. The membranes were incubated with a 1/10,000 dilution of a peroxidase‐linked anti‐rabbit IgG secondary antibody for 1 hour at room temperature and developed by means of BM Chemiluminescence Western Blotting Kit (FORTE, Millipore, Billerica, MA). As a control for protein loading, the membranes were carefully washed and stripped with stripping buffer (Pierce Chemical, Rockford, IL) and processed with a rabbit monoclonal anti‐GAPDH antibody (Santa Cruz Biotechnology Inc., Santa Cruz, CA). The relative intensity of bands was digitalized and quantified using image J software (n = 3 per group and per time point, experiment repeated three times).
Ethical Approval and Animal Management
All experiments in this study were design according to ARRIVE guidelines, and performed with a protocol approved by the Animal Care Committee of the University Paris Descartes (project agreement 15‐009, APAFIS #6173 N°2015112518204933). Animals were maintained according to the guidelines for ethical conduct developed by the European Communities Council Directive (animal breeding agreement D92‐049‐01). All efforts were made to minimize their pain or discomfort. Athymic nude “NMRI‐Foxn1 nu/nu” male mice (6‐week‐old, ≈30 g) were purchased from Janvier Labs (Le Genest Saint Isle, France). They were housed at sterile stable conditions (22°C ± 2°C) with a 12 hours dark/light cycle, and with ad libitum access to sterilized water and food.
Surgical Implantation, Experimental Procedure, and Sampling
During the entire surgery procedure, the animals were contained in a sterile environment using a laminar flow hood Esolis 1,200 Noroit. Athymic nude “NMRI‐Foxn1 nu/nu” mice (6‐week‐old, ∼30 g, n = 15 mice per group) were anesthetized (80 mg/kg b.wt. of ketamine and 10 mg/kg b.wt. of xylazine hydrochloride, both from Centravet Alfort, Maisons‐Alfort, France). In each specimen, scalp skin was incised to visualize the skull. A 3.5‐mm diameter calvarial critical‐sized defect was created on each side of the parietal bone using a dental bur attached to a slow‐speed hand piece operating at 1,500 rpm, under irrigation with sterile saline solution. Special care was taken for the sagittal suture preservation, and minimal invasion of the dura mater. After gently removing the circular bone plug, SHED‐seeded dense scaffolds prepared as previously described and then circularly cut (4 mm diameter), and kept in serum‐free medium are implanted in the bone defect (n = 30 scaffolds for each of the 3 conditions, control [no priming], hypoxia priming, and FGF‐2 priming). Each animal was randomly allocated per cage and per group and received the same treatment on both side. Wound closure was achieved by suturing the skin using absorbable suture (Vicryl Rapid 4.0, Ethicon, Johnson & Jonhson). Immediate postoperative care included analgesia with buprenorphine (0.02 mg/kg b.wt.). Wound healing progressed without any sign of infection, material exposure or other complication.
At day 14, and 2 and 3 months postsurgery, mice were imaged using micro‐CT as described below. Mice were euthanized at each point and the calvaria was excised. Samples were fixed in 70% vol/vol ethanol (24 hours at 4°C), dehydrated in graded ethanol solutions, and embedded at −20°C in methacrylate resin (Merck & Co., Whitehouse Station, NY) without decalcification 37. Resin embedded bone samples were cut (5 μm thickness) using Jung Polycut E microtome (Leica, Heerbrugg, Switzerland) with hard tissue blades (Leica). After immersion in a drop of 50% vol/vol ethanol, sections were stretched to a fold‐free state on polysine glass slides (Menzel‐Gläser, Brunswick, Germany), covered with a polyethylene sheet, and tightly pressed on the glass slides, followed by overnight drying at RT. Deplastification was carried out in 2‐methoxyethyl acetate (Carlo Erba, Val‐de‐Reuil, France) three times for 20 minutes. Rehydration of the sections was performed in graded ethanol solutions for subsequent procedures.
In Vivo Micro‐Computed Tomography
For bone regeneration exploration, nude mice were anesthetized (isoflurane, induction at 3%–4% under airflow of 0.8–1.5 l/minute 1.5%–2% under 400–800 ml/minute thereafter). They were imaged using x‐ray micro‐CT device (Quantum FX Caliper, Life Sciences, Perkin Elmer, Waltham, MA). The x‐ray source was set at 90 kV and 160 μA. Tridimensional images were acquired with an isotropic voxel size of 20 μm. An internal density phantom, calibrated in mg of hydroxyapatite, was used to scale bone density. Full 3D high‐resolution raw data were obtained by rotating both the x‐ray source and the flat panel detector 360° around the sample (scanning time: 3 minutes). Tridimensional renderings were subsequently extracted from Dicom data frames using the open‐source OsiriX imaging software (v5.7.1, distributed under LGPL license, Dr A. Rosset, Geneva, Switzerland). Firstly, image stacks were reoriented using DataViewer (Skyscan, release 1.5.2.4, Kontich, Belgium) to the center of the defect. Secondly, quantification of the regenerated bone was performed, with a cylindrical shape volume of interest of 3.5 mm of diameter and 1 mm height, using CTscan Analyzer software (Skyscan, release 1.13.5.1, Kontich, Belgium). An adaptative thresholding was performed with a radius of 3, between 296.42 and 335.71 mgHA/cm3. To reduce background, open/close morphological operations (radius = 1) were performed on the segmented bone. The following parameters were analyzed—bone volume fraction BV/TV (%), trabecular thickness Tb.Th (mm), trabecular number Tb.N (1 per milliliter), and trabecular separation Tb.Sp (mm), as previously described 45.
Histology Examination of Samples and Histomorphometry
Five‐micrometer‐thick deplastified calvaria bone sample sections were sequentially cleared in water and stained with toluidine blue (pH 3.8), von Kossa staining (n = 6 defects per group and per time point), or processed for ALP enzyme‐histochemistry and for tartrate‐resistant acid phosphatase (TRAP) revelation. Toluidine blue staining was used to visualize connective bone matrix. Von kossa staining was used to visualize mineralized bone. TRAP was detected by using hexazotized pararosanilin (Sigma, St. Louis, MO) and naphthol ASTR phosphate (Sigma) to reveal osteoclasts; nonosteoclastic acid phosphatase was inhibited by adding 100 mMol/l l(+)‐tartaric acid (Sigma) to the substrate solution. Image acquisition was performed using a DMLB Leica microscope, equipped with imaging camera DFC425 Leica connected to the Leica application (LAS version 4.4). The reconstruction of each field was made using Microsoft Image Composite Editor software (Microsoft, Redmond, WA, http://www.research.microsoft.com), and image analysis was performed using ImageJ.
Scanning Electron Microscopy Analysis of Calvarial Defects
Scanning electron microscopy (SEM) was performed to analyze scaffold microstructure implanted in the calvarial defect at 3 months after implantation. Samples (n = 3 per condition) were fixed in 4% paraformaldehyde and then in a cacodylate buffer 0.1 M, pH 7.4 containing 2.5% Glutaraldehyde for 24 hours at 4°C then stored in 1% Glutaraldehyde until further processing. Secondary fixation was performed using 1% OsO4 in 0.1 M cacodylate buffer and samples were dehydrated in an ascending series of Ethanol, washed in HexaMethylDiSilazane and air‐dried before being sputtered with gold/palladium. Images were taken in a Jeol LV6510 scanning electron microscope (JEOL Europe SAS, Croissy‐sur‐Seine, France).
Transmission Electron Microscopy Analysis of Calvarial Defects
Skulls of grafted mice were analyzed by conventional transmission electron microscopy (TEM) to see the ultrastructure morphology. Samples (n = 3 per condition) were fixed in 4% paraformaldehyde and then demineralized in a sodium cacodylate buffer 0.06 M, pH 7.4 containing 1.9% Glutaraldehyde and 0.15 M EDTA at 4°C until complete decalcification, then stored in 1% Glutaraldehyde until further processing. After postfixation in 2% OsO4 for 1 hour and dehydration in graded ethanol series at 4°C, samples were embedded in Epon 812 (Fluka, Honeywell, Seelze, Germany). Ultrathin sections of decalcified skulls were stained with uranyl acetate and lead citrate and were examined with a JEOL 1011 electron microscope.
Statistical Analysis
Numerical variables are expressed as the mean ± SEM. The statistical analyses were performed using Prism software version 7.04 (GraphPad software, Paris Descartes). The normality of the distribution was tested with the Kolmogorov–Smirnov test and the homogeneity of variance was tested with the Fisher F test. When the distribution of the data for each group respected the normality law and the variance of the group was homogeneous, the t test for independent measures was used to compare two group means. When the distribution of at least one of the group did not follow the normality law, comparison between groups were performed with the nonparametric Kruskal–Wallis test, followed by group comparison with the Mann–Whitney U test. To compare the 3 groups at each time‐point a two‐way analysis of variance was performed followed by a Tukey test. For animal experiments, the calvarial defect was considered as the statistical unit. Differences were considered significant at p < .05.
Results
In Vitro Mineralization in SHED‐Seeded Scaffolds
To study the effect of FGF‐2 and hypoxic primings on the mineralization process, we first used an in vitro culture model of human cell‐mediated biomineralization, consisting of seeding SHEDs into plastically compressed collagen hydrogels and placing these dense matrices under osteogenic culture conditions 44, 46. Micro‐CT analyzes showed higher mineral formation in matrices seeded with hypoxic or FGF‐2‐primed cells when compared with control (no priming) SHED‐seeded matrices at day 21 (p < .05; Fig. 1A). To further analyze the mineralization process within the scaffolds, von Kossa staining was performed on scaffold sections, revealing positive nodules in all the conditions at day 14 (Fig. 1B). Alizarin red staining confirmed mineral formation in all the conditions at both days 7 and 14 (Fig. 1C) and staining quantification showed significantly higher mineralization in hypoxic primed matrices when compared with control matrices at both time points (p < .0001) and to FGF‐2 primed matrices at day 7 (p < .0001). In contrast, at day 14, FGF‐2 priming was associated with a significant increase in mineralization compared with both hypoxic primed and control scaffolds (p < .01 and p < .0001, respectively; Fig. 1D).
Figure 1.
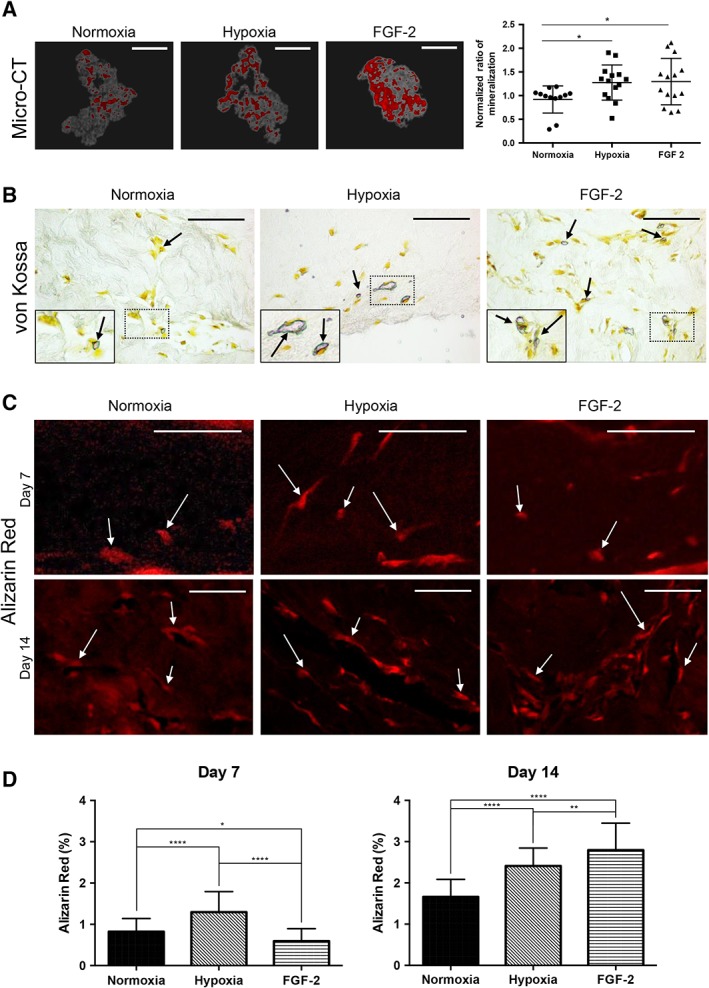
Effect of hypoxia and FGF‐2 primings on mineralization within tissue‐engineered scaffolds cultured under osteogenic conditions. (A): Micro‐computed tomography three‐dimensional reconstructions of stem cells from human exfoliated deciduous teeth‐seeded scaffolds for the 3 conditions (normoxia, hypoxia priming, and FGF‐2 priming) at day 21. Mineralized areas, which appear in red, were found throughout the collagen scaffolds in gray. Scale bars: 1 mm. Normalized quantitative analysis of the mineralization within each matrix revealing higher mineral formation in hypoxia‐ and FGF‐2‐primed scaffolds than in the normoxia ones. (B): Representative images of von Kossa stained scaffold sections showing mineralized nodules (arrows) in all the conditions at day 14. Scale bar: 50 μm. Inset detail for each condition showing the area of interest at higher magnification. (C): Alizarin red (AR) staining observed under fluorescent microscopy allows detecting mineral formation (white arrows) at days 7 and 14. Scale bar: day 7, 100 μm; day 14, 50 μm. (D): At day 7, quantification of the AR staining shows significantly higher mineral formation in the hypoxia‐primed and control groups when compared with the FGF‐2‐primed group. At day 14, this group shows significantly higher formation when compared with the other conditions. *, p < .05; **, p < .01; ****, p < .0001.
Cell Activity in SHED‐Seeded Scaffolds
To assess the effect of FGF‐2 and hypoxic priming on cell proliferation, the reduction of AlamarBlue, which reflects the metabolic activity of proliferating cells 43, was measured in the culture medium of the SHED‐seeded scaffolds. Intense cell proliferation was observed in FGF‐2 primed matrices at day 4 (×1.7 compared with baseline) when compared with matrices seeded with control or hypoxic primed cells (p < .05) where a 50% drop was observed. For these 2 conditions, cell proliferation was observed between day 4 and day 7 and at later time points, similar stable metabolic activities were detected for all the conditions (Fig. 2A). We then measured hydroxyproline in the scaffolds, which reflects their collagen content (Fig. 2B) 47. At day 7, lower collagen content was found in FGF‐2 primed matrices when compared with the other conditions (p < .0001 hypoxia vs. FGF2 and nonsignificant difference for control vs. FGF‐2), whereas it was increased in hypoxic primed matrices when compared with control (p < .05). A similar pattern was observed at day 14 but the difference between FGF‐2 and hypoxic primed scaffolds was less pronounced (p < .05). Collagen fibers were visualized under polarized light after Sirius red staining at day 14 for all the conditions (Fig. 2C), whereas no polarized fiber was detected at day 7 (data not shown), indicating an increase in the extracellular matrix density in all the conditions between day 7 and day 14.
Figure 2.
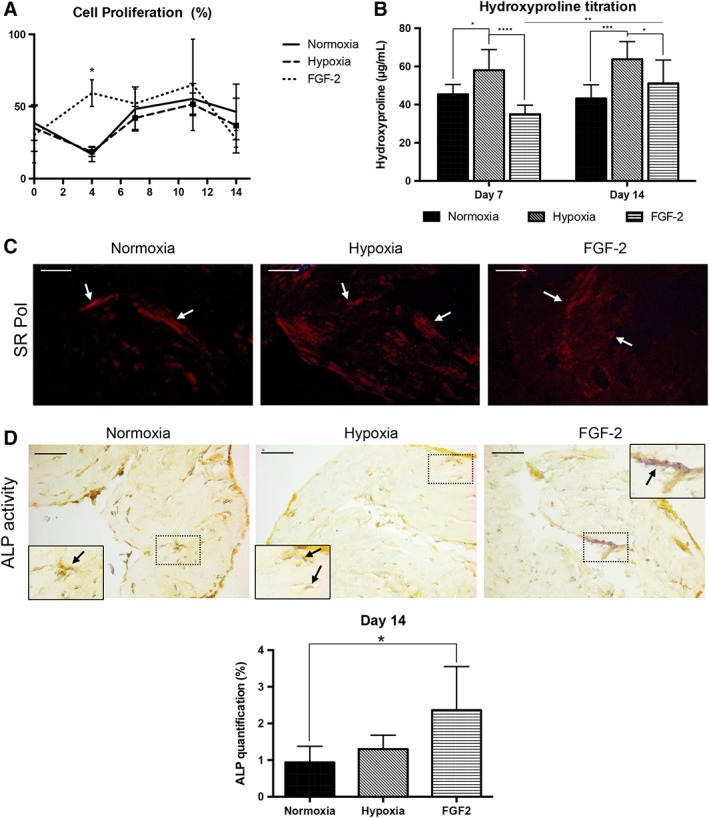
Effect of hypoxia and FGF‐2 primings on stem cells from human exfoliated deciduous teeth in tissue‐engineered scaffolds. (A): Cell proliferation was calculated using the AlamarBlue reaction. All the conditions were metabolically active throughout the experiment. At day 4, the FGF‐2‐primed group showed a significant higher metabolic activity (×3) compared with the other conditions. (B): Hydroxyproline titration measured at days 7 and 14 showing that the concentration of collagen is significantly increased in hypoxia‐primed scaffolds compared with the other conditions. The FGF‐2‐primed group showed a significant increase in collagen at day 14 compared with day 7. (C): Representative sections of Sirius red staining to visualize the collagen fibers (arrows), which appear in red under polarized light (pol) at day 14. Scale bars: 25 μm. (D): Detection of alkaline phosphatase (ALP) activity (arrows) within the scaffolds at day 14 showing magenta staining associated to cells adjacent to the mineralized nodules, especially in FGF‐2 primed constructs. Scale bars: 50 μm. Inset detail for each condition showing the area of interest at higher magnification. Quantification of staining showed significantly higher ALP activity in FGF‐2 primed constructs (×2.5) compared with the control group. *, p < .05; **, p < .01; ***, p < .001; ****, p < .0001.
Osteogenic Differentiation in SHED‐Seeded Scaffolds
We then sought to investigate the expression of markers involved in the mineralization process within the SHED‐seeded dense matrices. Increased ALP activity was observed at day 14 in FGF‐2 primed matrices compared with control (p < .05) and hypoxic primed scaffolds as evidenced by the increased number of ALP‐positive cells in these scaffolds (Fig. 2D). At day 7, no ALP activity was detected in all the conditions (data not shown). OPN, an early marker of the mineralization process 48, was detected in the mineralization nodules at day 7 in all the conditions but its expression appeared much fainter in the FGF‐2 primed matrices (Fig. 3A). At day 14, nodules, in all conditions, were OPN‐ and DMP1‐positive (Fig. 3A, 3B, respectively), but the number of positive nodules appeared higher in the primed conditions, consistently with the number of alizarin red positive nodules reported in Figure 1C, 1D. These data were confirmed by Western blot analyses showing stronger expression of both matrix proteins and their active fragments at day 14 in FGF‐2 primed matrices (Fig. 3C).
Figure 3.
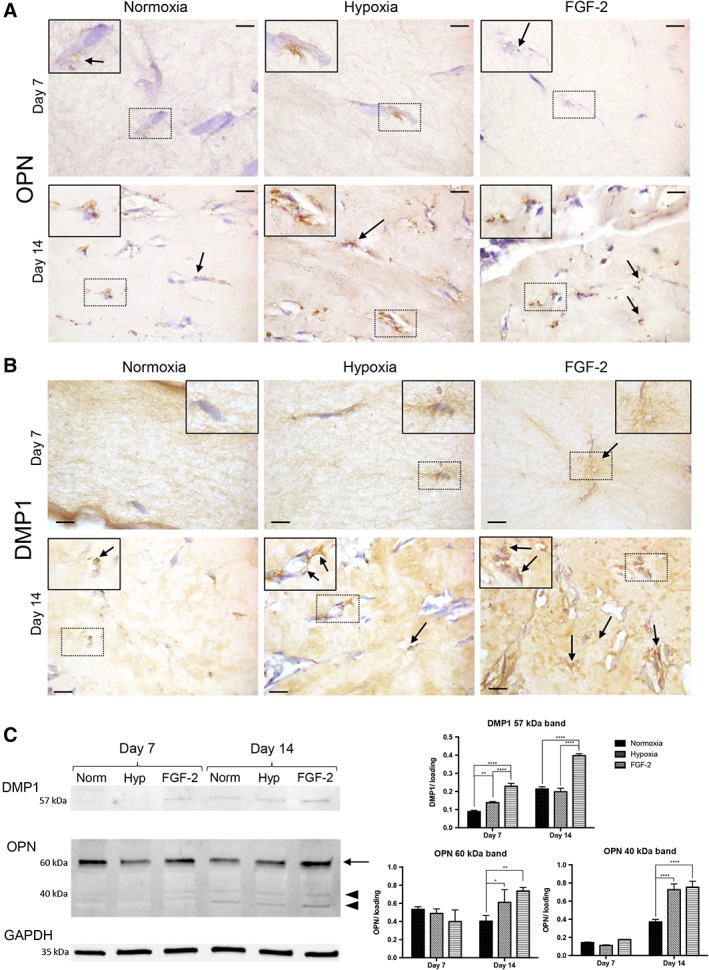
Osteogenic differentiation of stem cells from human exfoliated deciduous teeth in tissue‐engineered scaffolds. (A, B): Representative images of osteopontin (OPN; A) and dentin matrix protein 1 (DMP1; B) immunohistochemistry showing, for all the conditions, positive immunolabeling (arrows) adjacent to the cells at day 7 and day 14. Scale bars: 10 μm. Inset detail showing the area of interest at higher magnification. (C): Western blotting of DMP1 and OPN with a normalized quantitative analysis. DMP1 expression showed an increased abundance of the 57 kDa fragment in the FGF‐2 condition (×2.5 and ×1.8 at days 7 and 14, respectively) compared with the hypoxia and control groups. At day 14, OPN showed an increased abundance of 40 kDa (arrowhead) and 60 kDa (arrow) forms in the primed groups, especially FGF‐2 group (×1.9) compared with the control group. No significant difference was observed at day 7 for both OPN forms. Each band was normalized using GAPDH band as housekeeping protein (n = 3 per group). *, p < .05; **, p < .01; ****, p < .0001.
In Vivo Bone Formation and Regeneration
To evaluate the effect of the priming on the bone healing process, dense collagen matrices seeded with SHED primed or not with FGF‐2 or hypoxia were implanted in critical bone defects performed in the calvaria of nude mice. Bone repair within tissue constructs was longitudinally followed‐up by micro‐CT during 3 months (Fig. 4A), and further analyzed by histology and immunohistochemistry. At 2 months, micro‐CT analysis showed bone formation in all the conditions with no or slight significant difference between the groups (Fig. 4B, Supporting Information Fig. S1A, S1C, S1E). However, at 3 months, higher bone formation and improved bone microarchitecture parameters were reported in the FGF‐2 primed group when compared with the control and to the hypoxic primed groups (p < .0001; Fig. 4B, Supporting Information Fig. S1B, S1D, S1F). Furthermore, the bone accumulation rate was increased in the FGF‐2‐primed group, indicating faster bone formation in this group when compared with the other groups (Supporting Information Fig. S2).
Figure 4.
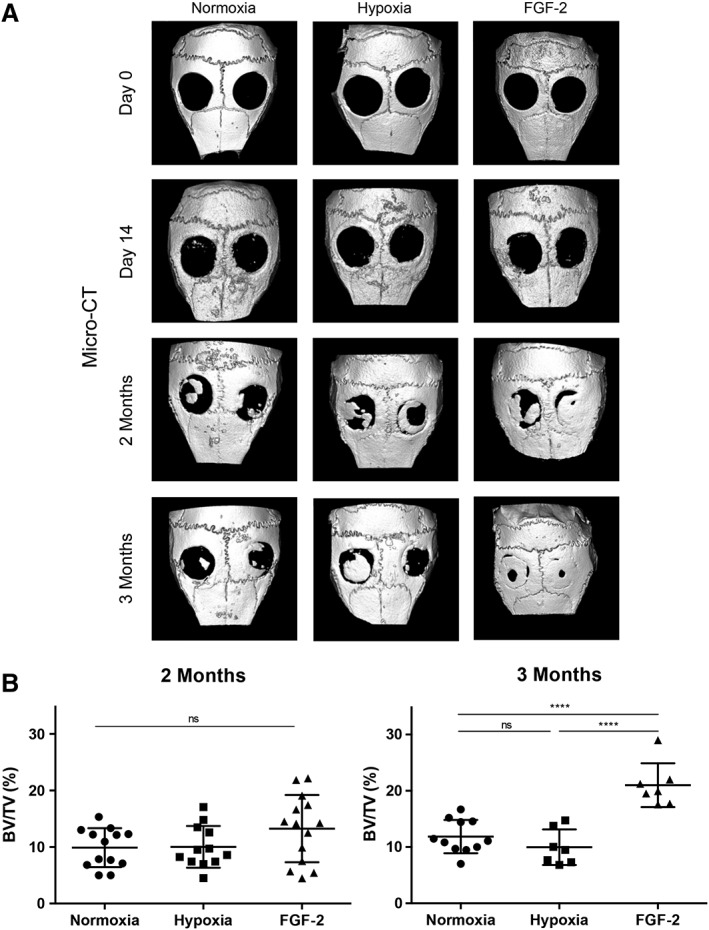
Longitudinal follow up of bone formation in calvarial defects by micro‐computed tomography. (A): Representative images of mouse skull three‐dimensional rendering at baseline, day 14, and 2 and 3 months. (B): Newly formed bone volumetric fraction expressed as a percentage of volume (BV/TV) on the total area of the defect. At 2 months, bone formation was slightly increased in the defects filled with hypoxia or FGF‐2 primed constructs when compared with the control constructs, although there was no significant difference. At 3 months, the defects appeared almost fully repaired in the FGF‐2 primed group with a statistically higher bone formation when compared with the other groups. ns, not significant; ****, p < .0001.
Mineralization was further investigated by von Kossa staining revealing, for all the conditions, positive nodules located at the edges and at the center of the defect as soon as day 14, and increasing mineral formation within the defects from 2 to 3 months (Fig. 5A). However, in the FGF‐2 primed samples, the mineralized nodules appeared more numerous at day 14 (Fig. 5Ac) and the defects appeared almost fully repaired at 3 months. These observations were confirmed by von Kossa staining quantification showing significant higher mineral formation in FGF‐2 primed samples at all‐time points when compared with control or hypoxic primed samples (p < .0001; Fig. 5B). At 2 and 3 months, bone formation was also significantly increased in the defects filled with hypoxic primed constructs when compared with the control group (p < .0001).
Figure 5.
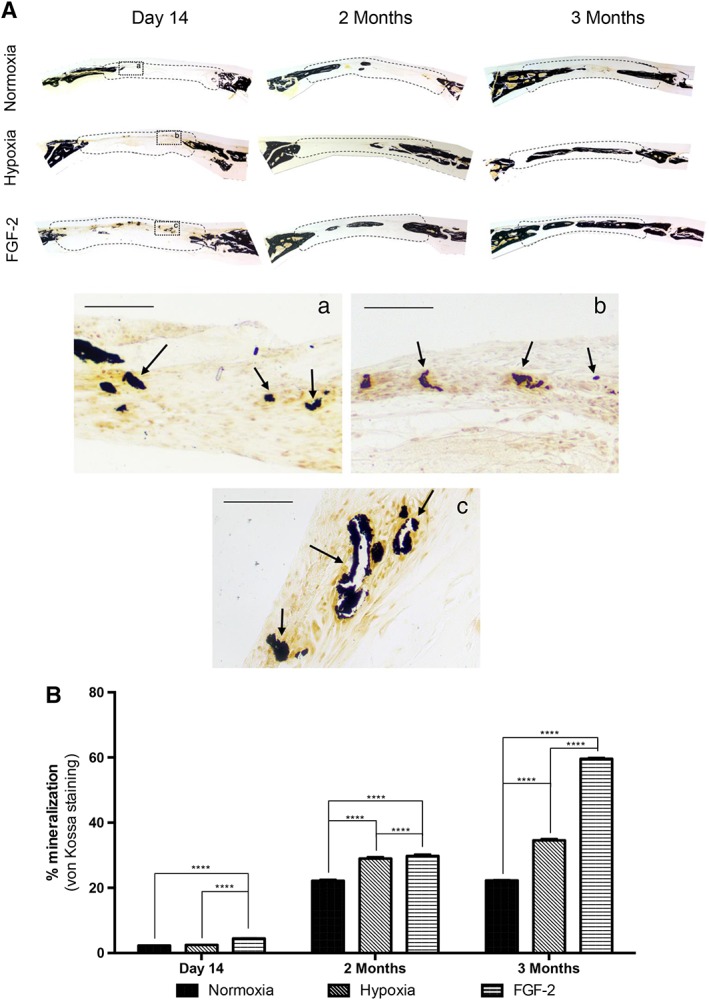
Mineral formation in calvarial bone defects. (A): von Kossa staining revealing bone formation (arrows) in all the conditions within the defects (delineated by a dotted line), at day 14, and 2 and 3 months. Inset detail at day 14: normoxia (Aa), hypoxic priming (Ab), and FGF‐2 priming (Ac). Scale bars: 50 μm. (B): Quantitative analysis of von Kossa staining showing that mineral formation was significantly increased in FGF‐2 primed samples at all‐time points when compared with control (stem cells from human exfoliated deciduous teeth with no priming) or hypoxic primed samples. At 2 and 3 months, bone formation was also increased in the defects filled with hypoxia primed constructs when compared with control constructs. ****, p < .0001.
When focusing on day 14, cell proliferation (PCNA immunolabeling) was observed within the healing defects for all the conditions but appeared more pronounced in the defects filled with FGF‐2 primed matrices (Supporting Information Fig. S3A). Apoptosis was also detected within the defects but no difference was seen between the groups (Supporting Information Fig. S3B). Furthermore, the toluidine blue stained mineralization nodules detected within the defects were OPN positive and surrounded by an osteoid matrix secreted by well‐aligned ALP positive osteoblasts in all the conditions (Fig. 6A, 6C). In addition, TRAP activity was detected within the nodules (Fig. 6D). These findings thus indicate active bone formation and remodeling in the healing defects. At longer time points, well‐formed bone was observed within the defects in all the conditions (Supporting Information Figs. S4 and S5).
Figure 6.
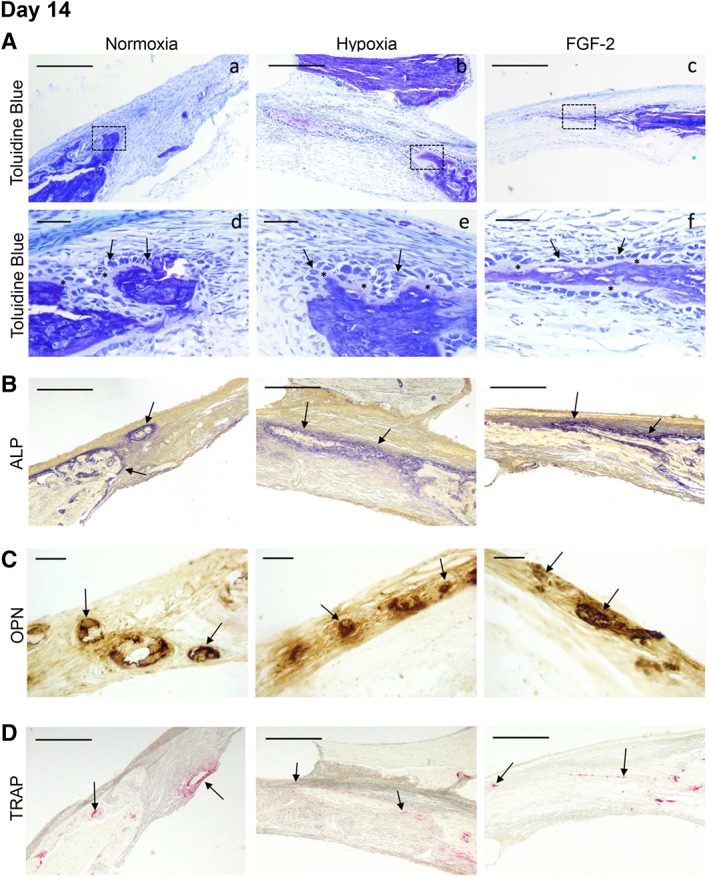
Characterization of the bone healing process at day 14. (A): Representative images of resin embedded calcified sections stained with toluidine blue revealing, for all the conditions, new bone formation (in purple) at both the edge and the center of the defects (Aa–Ac). Scale bar: 200 μm. Inset detail for each condition (Ad–Af) showing, at higher magnification, osteoblast‐like cells (arrows). These cells were well‐aligned and separated from the mineralized tissue by an osteoid‐like tissue stained in pink (asterisk). Scale bar: 25 μm. (B): Representative images of alkaline phosphatase activity showing, for each condition, mineral formation within the healing defects (arrows). Scale bars: 200 μm. (C): Representative images of osteopontin immunohistochemistry showing positive labeling of the mineralized nodules within the healing defects in the three conditions. Scale bars: 25 μm. (D): Representative images of tartrate‐resistant acid phosphatase staining revealing osteoclast remodeling activity (arrows) within newly forming bone. Scale bar: 200 μm.
Collagen Matrix Organization within Engineered Tissue Constructs Implanted in the Calvaria
We then investigated the extracellular matrix within the implanted scaffolds by SEM and TEM to analyze the ultrastructure of the constructs in each group at 3 months postimplantation compared with the native bone (Fig. 7). In control samples, the collagen fibers appeared heterogeneous and disorganized (Fig. 7C, 7D) when compared with those of the adjacent bone (Fig. 7A, 7B). In contrast, in the primed samples (Fig. 7E, 7H), the fibers were much more packed, especially in the FGF‐2‐primed group, which exhibited a dense matrix organization very similar to the adjacent bone, with well‐distinguishable osteocytes (Fig. 7G, 7H). These data suggest that the primings, and especially FGF‐2 priming, favored a compact extracellular matrix arrangement known to enhance bone formation 43.
Figure 7.
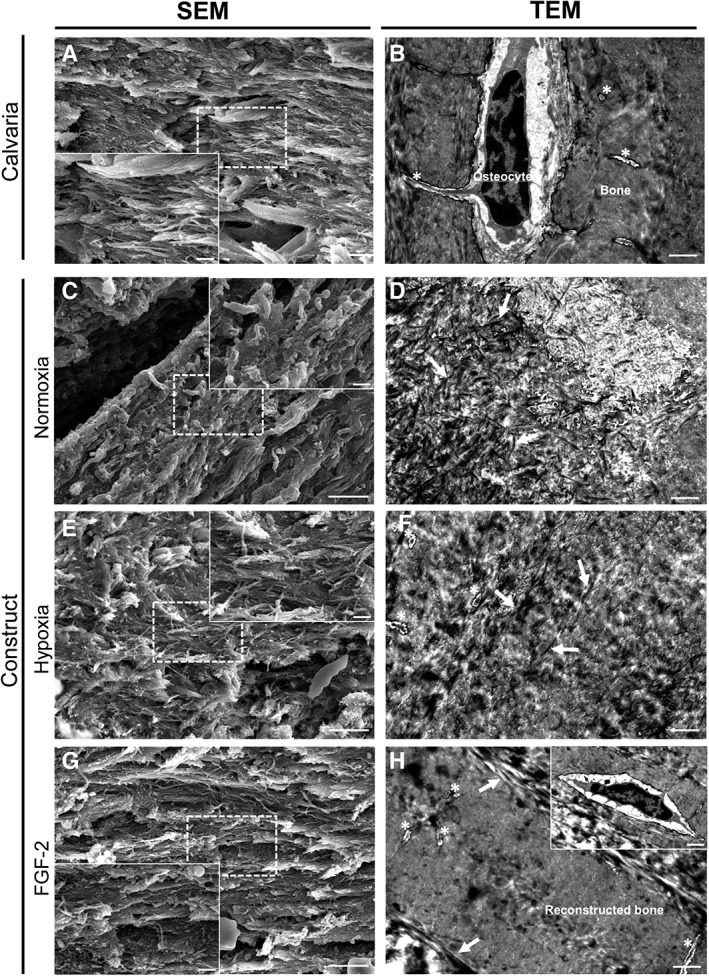
Ultrastructural analysis of the grafted calvaria at 3 months postimplantation. (A, C, E, G): Representative SEM image for each condition revealing the different areas of the calvaria: grafted and original part (scale bar: 5 μm). Inset detail showing collagen fibers organization within the defect and the calvaria at higher magnification (scale bar: 1 μm). (B, D, F, H): Representative transmission electron microscopy image for each condition revealing the ultrastructural difference for each area and conditions (scale bar: 1 μm). (A, B): Representative image of the native mouse calvarial bone showing well‐organized collagen fibers with similar same orientation. Osteocytes were observed in their lacuna associated with their delicate network of canaliculi (asterisks). (C, D): Heterogeneous matrix and poorly organized collagen fibers (white arrows) were observed in the control (normoxia) constructs at both magnifications. (E, F): In hypoxia primed constructs, the collagen fibers (white arrows) were more packed and better organized. Lacuno‐canalicular system (asterisks) was observed in the constructs. (H, I): In FGF‐2 primed constructs, the fibers (white arrows) were well‐aligned and showed a dense organization very similar to the adjacent bone. Of note, well‐distinguishable osteocytes (inset) with their lacuno‐canalicular system (asterisks) were observed associated with dense regenerated bone matrix in the construct.
Discussion
Bone healing is a major concern especially for large bone damages. In this context, a tissue engineering approach consisting in a scaffold engineered with MSCs endowed with a strong capacity to provide fast mineralization appears as a promising therapeutic option. In the present study, we demonstrate that the priming of SHED with FGF‐2 or hypoxia, prior to their grafting via a tissue‐engineered dense collagen construct within the injured calvaria, boosted the bone healing process, with a much stronger effect observed with the FGF‐2 priming.
The interest of priming SHED with FGF‐2 was revealed here by a longitudinal follow‐up of the injured bone with in vivo micro‐CT in combination with more sensitive histomorphometric analyses. Interestingly, we have previously reported that the subcutaneous implantation of tissue‐engineered constructs, consisting in a noncompressed collagen hydrogel (1 mg/ml) seeded with SHED primed with hypoxia or FGF‐2, greatly enhanced vascularization within the constructs 39. This effect was attributed to the capacity of SHED to release high levels of VEGF and HGF, 2 potent stimulators of angiogenesis 49, 50. In addition, we demonstrated that FGF‐2 was instrumental in promoting both VEGF and HGF secretion by SHED and that only VEGF expression was further increased by hypoxia 39.
Hypoxic culture conditions were reported to enhance MSC proliferation as well as their capacity of osteogenic differentiation 51, 52. In the present study, we show that a 24 hours hypoxic priming (1% O2) was sufficient to boost in vitro osteogenic differentiation of SHED and their capacity to induce in vivo bone repair. This finding is consistent with recent data revealing that hypoxic priming enhanced the survival rate, recruitment, and osteogenic differentiation potential of intravenously injected DPSC for treating infection‐caused alveolar bone destruction 53.
Quite remarkably here, the bone healing potential of DPSC was even stronger when the cells were primed with FGF‐2. FGF‐2 has been shown to be an osteoblast mitogen and a potent enhancer of bone formation 54, 55. Along this line, several studies reported the positive effect of local delivery of FGF‐2 on bone healing by stimulating cell proliferation and osteoblastic differentiation 56, 57, 58. In contrast, FGF‐2 has also been reported to inhibit mineralization induced by MSCs derived from the periodontal ligament in vitro 40, 41. Here, our in vitro approaches revealed that FGF‐2 priming induced an early proliferation of SHED within the compressed collagen matrix whereas, in the other conditions, proliferation started at later time points after an important drop of the number of cells within the constructs as classically reported in 3D collagen models 59. Furthermore, we reported increased mineralization induced by FGF‐2 primed SHED both in vitro and in vivo. These observations are consistent with a recent study reporting that the addition of FGF‐2 to BMSC increased their proliferation rate whereas enhancing their bone regenerative potential in an in vivo ectopic model 60.
The critical‐sized defect in the mouse calvaria requires a considerable amount of bone regeneration, and all three experimental groups demonstrated new bone formation through intramembranous ossification, which is classically observed in this model of bone regeneration 58. The primings boosted bone formation, collagen extracellular matrix arrangement and, quite remarkably, numerous mineralization nodules were rapidly observed in the FGF‐2 primed defects. These findings are consistent with the previous in vitro study of Cowan et al. reporting that juvenile osteoblasts (derived from 2‐day‐old rat calvaria) stimulated by FGF‐2 produced high quantity of extracellular matrix and mineralization nodules, which was not the case of osteoblasts sampled in the calvaria of adult rats 54. Accordingly, both in vitro and in vivo data presented here indicated that primed SHED expressed higher amount of osteogenic markers including ALP, DMP1, and OPN. This study clearly supports the interest of SHED for bone repair. However, SHED accessibility and mode of banking remain to be determined for clinical practice as this source of cells is sparse and time‐limited. Future studies are needed to determine whether these cells are limited to autologous therapies 61 or may be grafted between a child and parent or used as an allogenic material 29.
Consistently with our present data, MSCs implanted in the calvaria, a flat bone exposed to weak mechanical loading, were shown to induce intramembranous bone healing 58, except when being induced toward a chondrogenic phenotype prior to implantation 62. In contrast, under the influence of mechanical stimuli, MSCs can differentiate both into osteoblasts and chondrocytes 63. Future studies conducted in bones exposed to stronger mechanical stimuli such as the mandible 64, will determine whether the primed tissue engineered constructs introduced here might also allow endochondral ossification.
Conclusion
Priming SHED with FGF‐2 greatly enhanced regeneration in critical‐size calvarial bone defects compared with hypoxic priming. Indeed, FGF‐2 priming allowed a rapid compact extracellular matrix reorganization known to favor bone formation. Furthermore, intense cell proliferation was detected within FGF‐2 primed constructs, indicating the importance of this stage, which occurs before differentiation, on the bone repair process. The use of such mouse model indicates the feasibility and interest of the graft of tissue‐engineered constructs seeded with primed‐pulp cells to regenerate bone. Because the healing calvaria is exposed to weak mechanical stimuli, these experiments need to be repeated in craniofacial bones submitted to stronger constraints and large animal studies are certainly needed before translation to human trials; however, the positive effect of FGF‐2 priming for rapid calvarial bone formation warrants further studies in craniofacial bone repair.
Author Contributions
A.N., J.L., J.S., B.B., B.S., A.S., C.H., G.Y.R., C.G.: collection and assembly of data; A.N., L.S., S.V., A.P., C.H., C.C., C.G.: data analysis and interpretation; A.P., C.C., C.G.: conception and design; A.N.: participation in writing; C.C., C.G.: manuscript writing; A.N., J.L., J.S., L.S., B.B., B.S., A.S., S.V., A.P., C.H., G.Y.R.: final approval of manuscript.
Disclosure of Potential Conflicts of Interest
The authors indicated no potential conflicts of interest.
Supporting information
Supplemental Fig. 1 Micro‐CT analysis: micro‐architectural parameters. Quantitative micro—CT analysis of trabecular number (Tb.N), trabecular thickness (Tb.Th), and trabecular separation (Tb.Sp) in the calvarial defects. (A‐C‐E) At 2 months, no difference in trabecular thickness was found between groups, although FGF‐2 group had a significantly decrease in the trabecular spacing, and increase in trabecular number, when compared to hypoxic group. (B‐D‐F) At 3 months, the same profile was observed in trabecular thickness with no difference, and a significant decrease in FGF‐2 group in trabecular spacing compared to hypoxic and control groups, while the trabecular number was significantly higher in FGF‐2 group compared to the other groups. These data suggest that the formed bone in the FGF‐2 group has a better structured trabecular microarchitecture than in control and hypoxia groups, at both 2 and 3 months.
ns, not significant; *, p < .05; **, p < .01; ***, p < .001.
Supplemental Fig. 2 Micro‐CT analysis: Bone volume accumulation. Bone volume accumulation rate is presented between 0 and 2 months, and 2 and 3 months, with the slope calculation for each condition (N: control; H: hypoxia priming; F: FGF‐2 priming).
****, p < .0001.
Supplemental Fig. 3 Cell proliferation and apoptosis in the 3 conditions at 14 days post‐implantation within the calvarial bone defect. (A) Briefly section were prepared as described in section immunohistochemistry and were incubated with mouse anti‐proliferating cell nuclear antigen (PCNA) antibody (NAO3) diluted 1:75, and then incubated with peroxidase—conjugated anti‐lgG diluted 1:100 in 5% bovine serumalbumin/PBS. Representative images of PCNA immunohistochemistry revealing, for all conditions, positive immunolabeling (arrows) adjacent to calvarial bone inside the healing defect. Dotted line: edge of the defect, *: Calvarial bone. Scale bar: 50 μm and 25 μm (B) Briefly sections were prepared as described in section immunohistochemistry, and apoptosis detection was performed using In Situ Cell Death Detection kit, Fluorescein (Roche, Mannheim, Germany) according to the manufacturers instructions. Detection of apoptosis within the scaffolds at Day 14 showing green staining in positive—cells. Scale bar: 25 μm.
Supplemental Fig. 4 Bone formation observed in the 3 conditions at 2 months post‐implantation within the calvarial bone defect. (A, B) Representative images of resin embedded calcified stained sections with Toluidine Blue and von Kossa revealing well‐mineralized bone within the defects (delineated area). Scale bar: 200 μm (C) TRAP activity is detected within the newly formed bone tissue. Scale bars: 200 μm.
Supplemental Fig.5 Bone formation observed in the 3 conditions at 3 months post‐implantation within the calvarial bone defect. (A, B) Representative images of resin embedded calcified stained sections with Toluidine Blue and von Kossa revealing well‐mineralized bone within the defects. Scale bar: 200 μm (C) TRAP activity is detected in within newly mineralized bone tissue. Scale bars: 200 μm.
Acknowledgments
This work was supported by grants from University Paris Descartes, Fondation des Gueules Cassées and the National French Agency for research (ANR PulpCell 2014‐2018) for EA2496, and the Fondation de la Recherche Médicale (FRM DGE20111123012). We thank Annie Llorens (EA 2496 laboratory University Paris Descartes, France) for her technical assistance in histology and Philippe Chaffey (3P5 Plateforme Protéomique de l'Université Paris Descartes, Sorbonne Paris Cité, Paris, France) for his assistance with the Western blot technique. We also thank Dr. Jérémie Silvent (Tescan, Fuveau, France) for helpful discussion regarding microscope observations.
References
- 1. Barone A, Covani U. Maxillary alveolar ridge reconstruction with nonvascularized autogenous block bone: Clinical results. J Oral Maxillofac Surg 2007;65:2039–2046. [DOI] [PubMed] [Google Scholar]
- 2. Nkenke E, Neukam FW. Autogenous bone harvesting and grafting in advanced jaw resorption: Morbidity, resorption and implant survival. Eur J Oral Implantol 2014;7:S203–S217. [PubMed] [Google Scholar]
- 3. Docquier PL, Paul L, Mousny M et al. The use of allografts in paediatric orthopaedic surgery. Acta Orthop Belg 2007;73:551–557. [PubMed] [Google Scholar]
- 4. Bauer TW, Muschler GF. Bone graft materials. An overview of the basic science. Clin Orthop Relat Res 2000;371:10–27. [PubMed] [Google Scholar]
- 5. Yorukoglu AC, Kiter AE, Akkaya S et al. A concise review on the use of mesenchymal stem cells in cell sheet‐based tissue engineering with special emphasis on bone tissue regeneration. Stem Cells Int 2017;2017:2374161. [DOI] [PMC free article] [PubMed] [Google Scholar]
- 6. Novosel EC, Kleinhans C, Kluger PJ. Vascularization is the key challenge in tissue engineering. Adv Drug Deliv Rev 2011;63:300–311. [DOI] [PubMed] [Google Scholar]
- 7. La Noce M, Paino F, Spina A et al. Dental pulp stem cells: State of the art and suggestions for a true translation of research into therapy. J Dent 2014;42:761–768. [DOI] [PubMed] [Google Scholar]
- 8. Hilkens P, Meschi N, Lambrechts P et al. Dental stem cells in pulp regeneration: Near future or long road ahead? Stem Cells Dev 2015;24:1610–1622. [DOI] [PubMed] [Google Scholar]
- 9. Gronthos S, Mankani M, Brahim J et al. Postnatal human dental pulp stem cells (DPSCs) in vitro and in vivo. Proc Natl Acad Sci USA 2000;97:13625–13630. [DOI] [PMC free article] [PubMed] [Google Scholar]
- 10. Tatullo M, Marrelli M, Shakesheff KM et al. Dental pulp stem cells: Function, isolation and applications in regenerative medicine. J Tissue Eng Regen Med 2015;9:1205–1216. [DOI] [PubMed] [Google Scholar]
- 11. Ishizaka R, Hayashi Y, Iohara K et al. Stimulation of angiogenesis, neurogenesis and regeneration by side population cells from dental pulp. Biomaterials 2013;34:1888–1897. [DOI] [PubMed] [Google Scholar]
- 12. Bronckaers A, Hilkens P, Fanton Y et al. Angiogenic properties of human dental pulp stem cells. PLoS One 2013;8:e71104. [DOI] [PMC free article] [PubMed] [Google Scholar]
- 13. Rombouts C, Giraud T, Jeanneau C et al. Pulp vascularization during tooth development, regeneration, and therapy. J Dent Res 2017;96:137–144. [DOI] [PubMed] [Google Scholar]
- 14. Dissanayaka WL, Zhan X, Zhang C et al. Coculture of dental pulp stem cells with endothelial cells enhances osteo−/odontogenic and angiogenic potential in vitro. J Endod 2012;38:454–463. [DOI] [PubMed] [Google Scholar]
- 15. Iohara K, Zheng L, Wake H et al. A novel stem cell source for vasculogenesis in ischemia: Subfraction of side population cells from dental pulp. Stem Cells 2008;26:2408–2418. [DOI] [PubMed] [Google Scholar]
- 16. Janebodin K, Zeng Y, Buranaphatthana W et al. VEGFR2‐dependent angiogenic capacity of pericyte‐like dental pulp stem cells. J Dent Res 2013;92:524–531. [DOI] [PubMed] [Google Scholar]
- 17. Bento LW, Zhang Z, Imai A et al. Endothelial differentiation of SHED requires MEK1/ERK signaling. J Dent Res 2013;92:51–57. [DOI] [PMC free article] [PubMed] [Google Scholar]
- 18. d'Aquino R, Graziano A, Sampaolesi M et al. Human postnatal dental pulp cells co‐differentiate into osteoblasts and endotheliocytes: A pivotal synergy leading to adult bone tissue formation. Cell Death Differ 2007;14:1162–1171. [DOI] [PubMed] [Google Scholar]
- 19. Le Douarin NM, Calloni GW, Dupin E. The stem cells of the neural crest. Cell Cycle 2008;7:1013–1019. [DOI] [PubMed] [Google Scholar]
- 20. Ramamoorthi M, Bakkar M, Jordan J et al. Osteogenic potential of dental mesenchymal stem cells in preclinical studies: A systematic review using modified ARRIVE and CONSORT guidelines. Stem Cells Int 2015;2015:378368. [DOI] [PMC free article] [PubMed] [Google Scholar]
- 21. Chamieh F, Collignon AM, Coyac BR et al. Accelerated craniofacial bone regeneration through dense collagen gel scaffolds seeded with dental pulp stem cells. Sci Rep 2016;6:38814. [DOI] [PMC free article] [PubMed] [Google Scholar]
- 22. Behnia A, Haghighat A, Talebi A et al. Transplantation of stem cells from human exfoliated deciduous teeth for bone regeneration in the dog mandibular defect. World J Stem Cells 2014;6:505–510. [DOI] [PMC free article] [PubMed] [Google Scholar]
- 23. Leyendecker Junior A, Gomes Pinheiro CC, Lazzaretti Fernandes T et al. The use of human dental pulp stem cells for in vivo bone tissue engineering: A systematic review. J Tissue Eng 2018;9:2041731417752766. [DOI] [PMC free article] [PubMed] [Google Scholar]
- 24. Miura M, Gronthos S, Zhao M et al. SHED: Stem cells from human exfoliated deciduous teeth. Proc Natl Acad Sci USA 2003;100:5807–5812. [DOI] [PMC free article] [PubMed] [Google Scholar]
- 25. Kerkis I, Caplan AI. Stem cells in dental pulp of deciduous teeth. Tissue Eng Part B Rev 2012;18:129–138. [DOI] [PMC free article] [PubMed] [Google Scholar]
- 26. Seo BM, Sonoyama W, Yamaza T et al. SHED repair critical‐size calvarial defects in mice. Oral Dis 2008;14:428–434. [DOI] [PMC free article] [PubMed] [Google Scholar]
- 27. Zheng Y, Liu Y, Zhang CM et al. Stem cells from deciduous tooth repair mandibular defect in swine. J Dent Res 2009;88:249–254. [DOI] [PMC free article] [PubMed] [Google Scholar]
- 28. Hara K, Yamada Y, Nakamura S et al. Potential characteristics of stem cells from human exfoliated deciduous teeth compared with bone marrow‐derived mesenchymal stem cells for mineralized tissue‐forming cell biology. J Endod 2011;37:1647–1652. [DOI] [PubMed] [Google Scholar]
- 29. Yamada Y, Ito K, Nakamura S et al. Promising cell‐based therapy for bone regeneration using stem cells from deciduous teeth, dental pulp, and bone marrow. Cell Transplant 2011;20:1003–1013. [DOI] [PubMed] [Google Scholar]
- 30. Annibali S, Bellavia D, Ottolenghi L et al. Micro‐CT and PET analysis of bone regeneration induced by biodegradable scaffolds as carriers for dental pulp stem cells in a rat model of calvarial “critical size” defect: Preliminary data. J Biomed Mater Res B Appl Biomater 2014;102:815–825. [DOI] [PubMed] [Google Scholar]
- 31. De Kok IJ, Jere D, Padilla RJ et al. Evaluation of a collagen scaffold for cell‐based bone repair. Int J Oral Maxillofac Implants 2014;29:e122–e129. [DOI] [PubMed] [Google Scholar]
- 32. Abou Neel EA, Bozec L, Knowles JC et al. Collagen—Emerging collagen based therapies hit the patient. Adv Drug Deliv Rev 2013;65:429–456. [DOI] [PubMed] [Google Scholar]
- 33. Mravic M, Peault B, James AW. Current trends in bone tissue engineering. Biomed Res Int 2014;2014:865270. [DOI] [PMC free article] [PubMed] [Google Scholar]
- 34. Cheema U, Brown RA, Alp B et al. Spatially defined oxygen gradients and vascular endothelial growth factor expression in an engineered 3D cell model. Cell Mol Life Sci 2008;65:177–186. [DOI] [PMC free article] [PubMed] [Google Scholar]
- 35. Brown RA, Wiseman M, Chuo C‐B et al. Ultrarapid engineering of biomimetic materials and tissues: Fabrication of nano‐ and microstructures by plastic compression. Adv Funct Mater 2005;15:1762–1770. [Google Scholar]
- 36. Chicatun F, Pedraza CE, Ghezzi CE et al. Osteoid‐mimicking dense collagen/chitosan hybrid gels. Biomacromolecules 2011;12:2946–2956. [DOI] [PubMed] [Google Scholar]
- 37. Mansukhani A, Bellosta P, Sahni M et al. Signaling by fibroblast growth factors (FGF) and fibroblast growth factor receptor 2 (FGFR2)‐activating mutations blocks mineralization and induces apoptosis in osteoblasts. J Cell Biol 2000;149:1297–1308. [DOI] [PMC free article] [PubMed] [Google Scholar]
- 38. Chaudhary LR, Hofmeister AM, Hruska KA. Differential growth factor control of bone formation through osteoprogenitor differentiation. Bone 2004;34:402–411. [DOI] [PubMed] [Google Scholar]
- 39. Gorin C, Rochefort GY, Bascetin R et al. Priming dental pulp stem cells with fibroblast growth factor‐2 increases angiogenesis of implanted tissue‐engineered constructs through hepatocyte growth factor and vascular endothelial growth factor secretion. Stem Cells Translational Medicine 2016;5:392–404. [DOI] [PMC free article] [PubMed] [Google Scholar]
- 40. Dangaria SJ, Ito Y, Walker C et al. Extracellular matrix‐mediated differentiation of periodontal progenitor cells. Differentiation 2009;78:79–90. [DOI] [PMC free article] [PubMed] [Google Scholar]
- 41. Hakki SS, Hakki EE, Nohutcu RM. Regulation of matrix metalloproteinases and tissue inhibitors of matrix metalloproteinases by basic fibroblast growth factor and dexamethasone in periodontal ligament cells. J Periodontal Res 2009;44:794–802. [DOI] [PubMed] [Google Scholar]
- 42. Abou Neel EA, Cheema U, Knowles JC et al. Use of multiple unconfined compression for control of collagen gel scaffold density and mechanical properties. Soft Matter 2006;2:986–992. [DOI] [PubMed] [Google Scholar]
- 43. Pedraza CE, Marelli B, Chicatun F et al. An in vitro assessment of a cell‐containing collagenous extracellular matrix‐like scaffold for bone tissue engineering. Tissue Eng Part A 2010;16:781–793. [DOI] [PubMed] [Google Scholar]
- 44. Coyac BR, Chicatun F, Hoac B et al. Mineralization of dense collagen hydrogel scaffolds by human pulp cells. J Dent Res 2013;92:648–654. [DOI] [PubMed] [Google Scholar]
- 45. Bouxsein ML, Boyd SK, Christiansen BA et al. Guidelines for assessment of bone microstructure in rodents using micro‐computed tomography. J Bone Miner Res 2010;25:1468–1486. [DOI] [PubMed] [Google Scholar]
- 46. Coyac BR, Hoac B, Chafey P et al. Defective mineralization in x‐linked hypophosphatemia dental pulp cell cultures. J Dent Res 2018;97:184–191. [DOI] [PMC free article] [PubMed] [Google Scholar]
- 47. Helary C, Abed A, Mosser G et al. Evaluation of dense collagen matrices as medicated wound dressing for the treatment of cutaneous chronic wounds. Biomater Sci 2015;3:373–382. [DOI] [PubMed] [Google Scholar]
- 48. McKee MD, Farach‐Carson MC, Butler WT et al. Ultrastructural immunolocalization of noncollagenous (osteopontin and osteocalcin) and plasma (albumin and alpha 2HS‐glycoprotein) proteins in rat bone. J Bone Miner Res 1993;8:485–496. [DOI] [PubMed] [Google Scholar]
- 49. Potente M, Gerhardt H, Carmeliet P. Basic and therapeutic aspects of angiogenesis. Cell 2011;146:873–887. [DOI] [PubMed] [Google Scholar]
- 50. You WK, McDonald DM. The hepatocyte growth factor/c‐Met signaling pathway as a therapeutic target to inhibit angiogenesis. BMB Rep 2008;41:833–839. [DOI] [PMC free article] [PubMed] [Google Scholar]
- 51. Collignon AM, Lesieur J, Anizan N et al. Early angiogenesis detected by PET imaging with (64)Cu‐NODAGA‐RGD is predictive of bone critical defect repair. Acta Biomater 2018;82:111–121. [DOI] [PubMed] [Google Scholar]
- 52. Hung SP, Ho JH, Shih YR et al. Hypoxia promotes proliferation and osteogenic differentiation potentials of human mesenchymal stem cells. J Orthop Res 2012;30:260–266. [DOI] [PubMed] [Google Scholar]
- 53. Yan W, Fang H, Xin Z et al. Hypoxic preconditioning enhances dental pulp stem cell therapy for infection‐caused bone destruction. Tissue Eng Part A 2016;22:1191–1203. [DOI] [PubMed] [Google Scholar]
- 54. Cowan CM, Quarto N, Warren SM et al. Age‐related changes in the biomolecular mechanisms of calvarial osteoblast biology affect fibroblast growth factor‐2 signaling and osteogenesis. J Biol Chem 2003;278:32005–32013. [DOI] [PubMed] [Google Scholar]
- 55. Montero A, Okada Y, Tomita M et al. Disruption of the fibroblast growth factor‐2 gene results in decreased bone mass and bone formation. J Clin Invest 2000;105:1085–1093. [DOI] [PMC free article] [PubMed] [Google Scholar]
- 56. Santana RB, Trackman PC. Controlled release of fibroblast growth factor 2 stimulates bone healing in an animal model of diabetes mellitus. Int J Oral Maxillofac Implants 2006;21:711–718. [PubMed] [Google Scholar]
- 57. Kodama N, Nagata M, Tabata Y et al. A local bone anabolic effect of rhFGF2‐impregnated gelatin hydrogel by promoting cell proliferation and coordinating osteoblastic differentiation. Bone 2009;44:699–707. [DOI] [PubMed] [Google Scholar]
- 58. Murphy MP, Irizarry D, Lopez M et al. The role of skeletal stem cells in the reconstruction of bone defects. J Craniofac Surg 2017;28:1136–1141. [DOI] [PMC free article] [PubMed] [Google Scholar]
- 59. Bell E, Ivarsson B, Merrill C. Production of a tissue‐like structure by contraction of collagen lattices by human fibroblasts of different proliferative potential in vitro. Proc Natl Acad Sci USA 1979;76:1274–1278. [DOI] [PMC free article] [PubMed] [Google Scholar]
- 60. Li T, Liu ZL, Xiao M et al. Impact of bone marrow mesenchymal stem cell immunomodulation on the osteogenic effects of laponite. Stem Cell Res Ther 2018;9:100. [DOI] [PMC free article] [PubMed] [Google Scholar]
- 61. Xuan K, Li B, Guo H et al. Deciduous autologous tooth stem cells regenerate dental pulp after implantation into injured teeth. Sci Transl Med 2018;10:eaaf3227. [DOI] [PubMed] [Google Scholar]
- 62. Thompson EM, Matsiko A, Kelly DJ et al. An endochondral ossification‐based approach to bone repair: Chondrogenically primed mesenchymal stem cell‐laden scaffolds support greater repair of critical‐sized cranial defects than osteogenically stimulated constructs in vivo. Tissue Eng Part A 2016;22:556–567. [DOI] [PubMed] [Google Scholar]
- 63. Thompson Z, Miclau T, Hu D et al. A model for intramembranous ossification during fracture healing. J Orthop Res 2002;20:1091–1098. [DOI] [PubMed] [Google Scholar]
- 64. Yu YY, Lieu S, Hu D et al. Site specific effects of zoledronic acid during tibial and mandibular fracture repair. PLoS One 2012;7:e31771. [DOI] [PMC free article] [PubMed] [Google Scholar]
Associated Data
This section collects any data citations, data availability statements, or supplementary materials included in this article.
Supplementary Materials
Supplemental Fig. 1 Micro‐CT analysis: micro‐architectural parameters. Quantitative micro—CT analysis of trabecular number (Tb.N), trabecular thickness (Tb.Th), and trabecular separation (Tb.Sp) in the calvarial defects. (A‐C‐E) At 2 months, no difference in trabecular thickness was found between groups, although FGF‐2 group had a significantly decrease in the trabecular spacing, and increase in trabecular number, when compared to hypoxic group. (B‐D‐F) At 3 months, the same profile was observed in trabecular thickness with no difference, and a significant decrease in FGF‐2 group in trabecular spacing compared to hypoxic and control groups, while the trabecular number was significantly higher in FGF‐2 group compared to the other groups. These data suggest that the formed bone in the FGF‐2 group has a better structured trabecular microarchitecture than in control and hypoxia groups, at both 2 and 3 months.
ns, not significant; *, p < .05; **, p < .01; ***, p < .001.
Supplemental Fig. 2 Micro‐CT analysis: Bone volume accumulation. Bone volume accumulation rate is presented between 0 and 2 months, and 2 and 3 months, with the slope calculation for each condition (N: control; H: hypoxia priming; F: FGF‐2 priming).
****, p < .0001.
Supplemental Fig. 3 Cell proliferation and apoptosis in the 3 conditions at 14 days post‐implantation within the calvarial bone defect. (A) Briefly section were prepared as described in section immunohistochemistry and were incubated with mouse anti‐proliferating cell nuclear antigen (PCNA) antibody (NAO3) diluted 1:75, and then incubated with peroxidase—conjugated anti‐lgG diluted 1:100 in 5% bovine serumalbumin/PBS. Representative images of PCNA immunohistochemistry revealing, for all conditions, positive immunolabeling (arrows) adjacent to calvarial bone inside the healing defect. Dotted line: edge of the defect, *: Calvarial bone. Scale bar: 50 μm and 25 μm (B) Briefly sections were prepared as described in section immunohistochemistry, and apoptosis detection was performed using In Situ Cell Death Detection kit, Fluorescein (Roche, Mannheim, Germany) according to the manufacturers instructions. Detection of apoptosis within the scaffolds at Day 14 showing green staining in positive—cells. Scale bar: 25 μm.
Supplemental Fig. 4 Bone formation observed in the 3 conditions at 2 months post‐implantation within the calvarial bone defect. (A, B) Representative images of resin embedded calcified stained sections with Toluidine Blue and von Kossa revealing well‐mineralized bone within the defects (delineated area). Scale bar: 200 μm (C) TRAP activity is detected within the newly formed bone tissue. Scale bars: 200 μm.
Supplemental Fig.5 Bone formation observed in the 3 conditions at 3 months post‐implantation within the calvarial bone defect. (A, B) Representative images of resin embedded calcified stained sections with Toluidine Blue and von Kossa revealing well‐mineralized bone within the defects. Scale bar: 200 μm (C) TRAP activity is detected in within newly mineralized bone tissue. Scale bars: 200 μm.