Abstract
Purpose
For rapid spatial mapping of gamma‐aminobutyric acid (GABA) at the increased sensitivity and spectral separation for ultra‐high magnetic field strength (7 tesla [T]), an accelerated edited magnetic resonance spectroscopic imaging technique was developed and optimized for the human brain at 7 T.
Methods
A MEGA‐sLASER sequence was used for GABA editing and volume selection to maximize editing efficiency and minimize chemical shift displacement errors. To accommodate the high bandwidth requirements at 7 T, a single‐shot echo planar readout was used for rapid simultaneous encoding of the temporal dimension and 1 spatial. B 0 and B 1 field aspects specific for 7 T were studied together with correction procedures, and feasibility of the EPSI MEGA‐sLASER technique was tested in vivo in 5 healthy subjects.
Results
Localized edited spectra could be measured in all subjects giving spatial GABA signal distributions over a central brain region, having 45‐ to 50‐Hz spatial intervoxel B 0 field variations and up to 30% B 1 field deviations. MEGA editing was found unaffected by the B 0 inhomogeneities for the optimized sequence. The correction procedures reduced effects of intervoxel B0 inhomogeneities, corrected for spatial editing efficiency variations, and compensated for GABA resonance phase and frequency shifts from subtle motion and acquisition instabilities. The optimized oscillating echo‐planar gradient scheme permitted full spectral acquisition at 7 T and exhibited minimal spectral‐spatial ghosting effects for the selected brain region.
Conclusion
The EPSI MEGA‐sLASER technique was shown to provide time‐efficient mapping of regional variations in cerebral GABA in a central volume of interest with spatial B 1 and B 0 field variations typical for 7 T.
Keywords: 7T, edited MRSI, EPSI, GABA
1. INTRODUCTION
Gamma‐aminobutyric acid (GABA) is the major inhibitory neurotransmitter in the central nervous system and is suggested to be involved in psychiatric and neurological conditions, such as schizophrenia,1 depression,2 epilepsy,3 and Parkinson’s disease4 as well as healthy brain aging.5 Proton magnetic resonance spectroscopy (1H‐MRS) can be used to noninvasively assess concentrations of neurometabolites in vivo. Spectra from different metabolites can be separated because each metabolite has its characteristic resonance frequency pattern attributed to the specific chemical environment. Assessment of less‐abundant neurochemicals, such as GABA, is hampered by the overlap of spectra from more‐abundant metabolites together with limitations in peak linewidths and peak frequency separations.
The J‐coupling between the spins of the three CH2‐groups of GABA can, however, be utilized to separate the GABA signal. With the Mescher‐Garwood (MEGA) J‐difference editing technique,6 the J‐coupling between the 1.89‐ and the 3.01‐ppm (parts per million) GABA resonances is utilized by a selective pulse applied at the 1.89‐ppm resonance to refocus the J‐coupling evolution at the 3.01‐ppm resonance (ON experiment). The J‐evolution is left undisturbed in a second (OFF) experiment, and the 3.01‐ppm GABA resonance is isolated after spectrum subtraction.
Further facilitation of the assessment of low‐concentration GABA from the 1H‐MRS spectrum can be achieved by an increase in magnetic field strength, giving both an increased frequency separation between resonances and an increased sensitivity. Although there is still complete overlap of the GABA resonance with other resonances at 7 tesla (T), cerebral concentrations of GABA have been reported without editing in humans at improved precision compared to lower field strengths using short echo time single‐voxel localization techniques.7 The accuracy of unedited measurement of GABA at short echo time is, however, sensitive to experimental conditions.8
The increases in sensitivity and chemical shift dispersion are both favorable for GABA editing, but higher field strengths also imply hampered signal localization from increased chemical shift displacement (CSD) errors. GABA editing using MEGA and semilocalization by adiabatic selective refocusing (MEGA‐sLASER) was demonstrated to give efficient spectral editing of the 3.01‐ppm resonance with minimal CSD errors at 7 T.9
Studies of regional variations in GABA will benefit greatly from spatial mapping of concentrations using magnetic resonance spectroscopic imaging (MRSI) techniques. MRSI at 7 T requires additional considerations associated with the increased spatial variations in the transmitted radio frequency field (B 1) and the permanent magnetic field (B 0) that need to be taken into account during data acquisition and postprocessing. Also, the increased radio frequency (RF) power deposition at high field, in combination with high‐bandwidth adiabatic pulses, leads to an increased minimum repetition time (TR) as compared to 3 T. However, MRSI can be significantly accelerated by simultaneous encoding of the temporal and spatial dimensions using oscillating readout gradients, as exemplified by, for example, spiral gradient sampling10 and the echo planar spectroscopic imaging (EPSI) technique.11 Utilizing such techniques at 7 T is challenging with respect to gradient performance because of the increased bandwidth required to sample all metabolite signals critically.
The aim of our study was to develop, optimize, and test an accelerated edited MRSI technique for spatial mapping of GABA in the human brain at 7 T. The MEGA‐sLASER technique was applied for GABA editing and localization, in combination with a fast noninterleaved EPSI readout to accommodate the high‐bandwidth requirements at 7 T. The B 0 and B 1 field aspects specific for 7 T were studied together with correction procedures, and the feasibility of the EPSI MEGA‐sLASER technique was demonstrated in vivo.
2. METHODS
Measurements were performed on a whole‐body 7 T MR scanner (Achieva; Philips, Cleveland, OH) interfaced to a 2‐channel volume transmit head coil and 32‐channel receiver array (Nova Medical, Inc, Burlington, MA). All measurements were performed in accord with local ethical protocols.
2.1. Sequence design
A volume‐selective MEGA‐sLASER sequence9 was combined with an echo‐planar gradient waveform during signal readout (Figure 1). Frequency offset corrected inversion FOCI refocusing pulses12, 13 (duration = 5 ms, HSn = 2, FOCI factor = 5, B 1max = 18 uT) were used in the volume selection giving a CSD error of 2.5% between 1.89 and 3.01 ppm in the refocusing directions. The CSD error along the excitation direction from the asymmetric excitation pulse was 5%. MEGA editing was performed as described elsewhere.9 A crusher gradient configuration minimizing stimulated echo contributions was used. To minimize the effects from spatial B 0 variations on the editing performance across the volume selection region (volume of interest; VOI), Gaussian RF pulses of 5‐ms duration (full width of 95% maximum of 100 Hz) were used to cover the frequency range of the spatial B 0 variation over the VOI. The offset frequency was set to 1.9 ppm in the edit ON acquisitions, and to 7.5 ppm in the edit OFF acquisitions.
Figure 1.
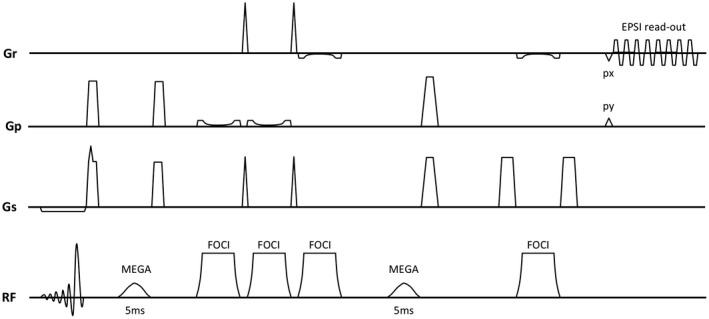
Sequence diagram for the echo‐planar MEGA‐sLASER sequence with adiabatic refocusing (FOCI) and 5‐ms Gaussian pulses for the spectral editing (MEGA) followed by prephase (px) and phase‐encoding (py) gradients before the spatial and temporal encoding echo‐planar readout (EPSI)
An oscillating echo‐planar (EP) gradient with plateau sampling was used for simultaneous readout of the temporal dimension and 1 spatial. The optimized gradient waveform had a spectrum bandwidth of 2662 Hz and 62% sampling efficiency (slew rate = 133 T/m/s, gradient amplitude = 9.4 mT/m, ramp time = 70 us, plateau = 230 us, pixel bandwidth = 4.3 kHz, train duration = 192 ms, sample points = 512).
Phase encoding was used to cover the second spatial dimension. The edit ON/OFF alternation was placed in the innermost loop of the scan execution followed by a phase‐encoding loop and finally an outer averaging loop. This minimizes subtraction errors between the ON and OFF spectra.
2.2. Reconstruction, data processing, and analysis
The reconstruction and analysis software was developed in‐house using Matlab (The MathWorks, Inc, Natick, MA). The calculation steps were applied in the following order: (1) flipping of odd‐numbered echoes (readout along kx) and correction for temporal odd‐even echo shifts; (2) spatial domain fast Fourier transforms; (3) voxel location‐dependent coil weight assessment; (4) coil phase angle assessment and correction; (5) voxel location weighted time‐domain signal addition over coils; and (6) voxel location phase angle assessment and alignment. Steps 1 through 6 were first applied to the water reference scan and next to the water‐suppressed scan while reapplying the coil weights and phase angles determined from the water reference scan. This was, in turn, followed by: (1) eddy current compensation (ECC)14, 15; (2) regridding of the data acquired on the non‐Cartesian kx‐time‐domain trajectory to a Cartesian grid; (3) k‐space Hamming filtering; and (4) 27‐ and 13‐Hz spectral broadening, pre‐ and post choline frequency, and phase alignment (FPA), respectively.
For enhanced separation of edited GABA signals in regions with remaining frequency and phase shifts, spectral FPA of the choline peak9, 16 was applied as a final processing step before subtracting the edit ON and OFF sets to generate the final GABA and metabolite spectra. The choline peak FPA was performed by comparing to the average spectrum for the ON and OFF measurement, separately, followed by an alignment of the summed ON and OFF spectra using the choline resonance. B 1‐mapping17 was included in the scanning protocol to enable correction of varying editing efficiency (EE). A quantum mechanical simulation (result in Figure 2) of the effect of the B 1 field variation on only the MEGA editing pulse and on the EE was performed in VESPA.18, 19 A third‐order polynomial was fitted to the simulated signal amplitudes in the normalized B 1 field strength range 60% to 140%, and the resulting EE function was applied to correct the edited spectra normalized to the total creatine signal of the OFF‐pulse spectra. The Lorentzian line shape was fitted to the creatine signals (fit error threshold = 20%). The Gaussian line shape (30‐Hz fixed linewidth) was fitted to the GABA+ (GABA plus co‐edited macromolecules) signals, using a fit error threshold of 30%, to allow fitting of not fully separated GABA+ signals. The fit error is the percentage root mean square difference between data and line‐shape model.
Figure 2.
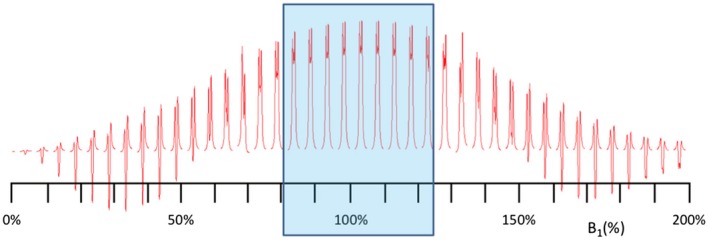
Simulated B 1 field strength dependence of the signal amplitude of the MEGA edited GABA spin system at 3.01 ppm (sampling bandwidth = 2 kHz, 2048 sampling points). The typical normalized B 1 field strength range 80% to 125% over the VOI is indicated (blue rectangle)
2.3. Sequence tests
The performance of the EPSI MEGA‐sLASER sequence was tested in vivo in 5 healthy subjects (2 female, 3 male) of 25 to 45 years of age. The scanning protocol included 2 EPSI MEGA‐sLASER sets, a T1‐weighted 3D magnetization‐prepared rapid gradient echo, and a 3D gradient echo dual TR B 1 map.17 The EPSI MEGA‐sLASER imaging plane was a transversal midbrain slice above the ventricles (field of view = 160 × 160 mm2, slice thickness = 22 mm, VOI = 80 × 80 × 22 mm3, matrix size = 16 × 16, B 1max = 18 uT, pencil beam second‐order shimming, in‐plane voxel size = 10 × 10 mm2 [effective voxel size = 3.7 mL], TR = 4281 ms, echo time = 74 ms).
The protocol further consisted of 1 water‐suppressed scan (VAPOR [variable pulse power and optimized relaxation delays],20 window = 200 Hz) of 9 min duration with 4 signal averages (number of signals averaged; NSA) and a water reference scan (duration 2 minutes) with NSA = 1 and with the editing pulses turned off.
3. RESULTS
Spatially localized ON and OFF spectra were measured in all subjects. VOI average and ranges for the spatial distributions (Figure 3, row A) of the creatine signal‐to‐noise ratio (SNR) of the OFF‐pulse measurement are shown in Supporting Information Tables S2, together with the errors in the fit to the creatine and corrected GABA+ signals. Corresponding spatial distributions of the fit errors are shown in Supporting Information Figure 9. VOI ranges for the spatial distributions of the normalized B 1 field strength deviations (Supporting Information Figure 8) are shown in Supporting Information Table S1, together with the maximum of the corresponding spatial distributions of the EE correction factors (Supporting Information Figure 8). The intravoxel B 0 field inhomogeneities, assessed from the linewidth of the 3.01‐ppm creatine resonance from the OFF measurements, varied as shown in Supporting Information Table S1, corresponding to the distributions in Figure 4 and Supporting Information Figure 7. Intervoxel B 0 field variations, assessed from the creatine resonance frequency shifts (Figure 4E), were significantly reduced by the ECC and varied in ranges from minimum ± 3 Hz to maximum ± 11 Hz (Supporting Information Table S1).
Figure 3.
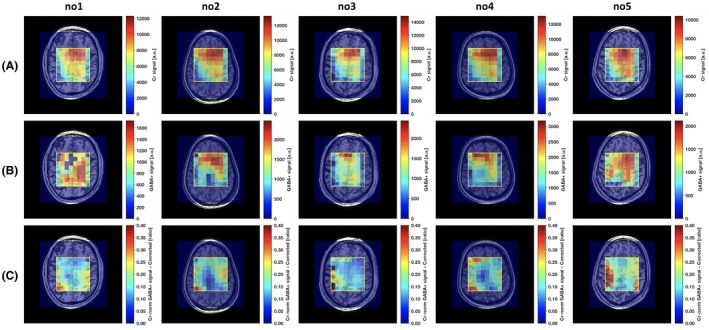
Spatial distributions for the healthy volunteer test scans (no. 1‐no. 5) of the OFF‐pulse measurement creatine (Cr) signal (row A), uncorrected GABA+ signal (row B), and Cr‐normalized GABA+ signal after editing efficiency correction and choline peak frequency and phase alignment (row C)
Figure 4.
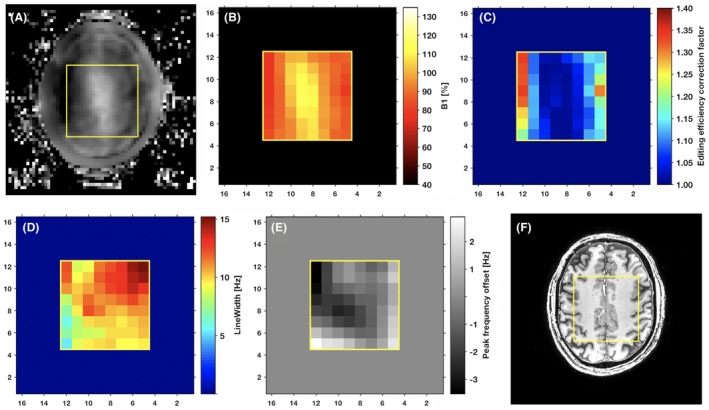
Spatial distribution for a healthy volunteer test scan (no. 1) of the normalized B 1 field strength as measured over the entire image plane (A); as resampled to the spatial resolution of the EPSI MEGA‐sLASER sequence, used in calculation of the EE correction (B); and the corresponding spatial distribution of the EE correction factor (C). The corresponding spatial distribution of the intravoxel B 0 inhomogeneity by creatine peak linewidth (D) and the intervoxel B 0 inhomogeneity by creatine peak frequency offset (E) are displayed together with the structural scan (F)
The impact on the spatial distribution of the measured GABA+ signal from the spectral correction procedures was demonstrated for 1 subject (Figure 5 showing the impact of creatine normalization, EE correction, and choline peak FPA separately). Creatine‐normalized GABA+ levels of 0.22 were close to uniformly distributed in a central region of the VOI, corresponding to white matter, with an elevation toward the left and right VOI edges (Figure 5C). This elevation was further enhanced by the EE correction (Figure 5D). The choline FPA gave an increased fraction of voxels with fitting error below the chosen threshold (Figure 5E and Supporting Information Figure S1D).
Figure 5.
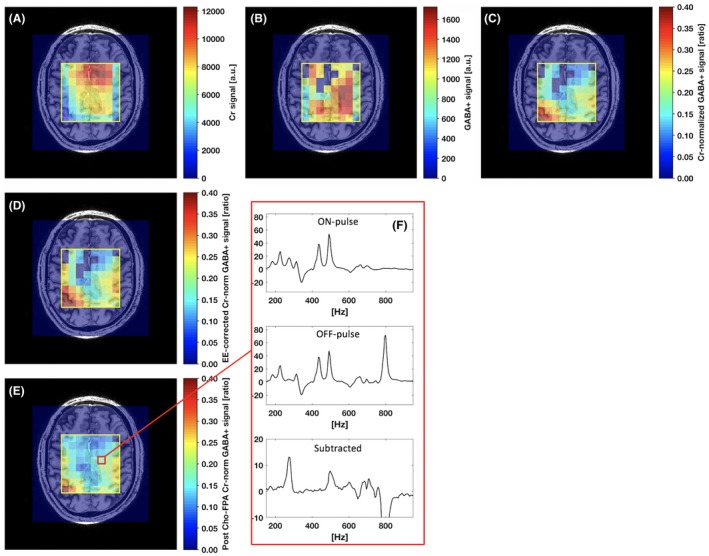
Spatial distribution for a healthy volunteer test scan (no. 1) of the creatine (Cr) signal (A), GABA+ signal (B), Cr normalized GABA+ signal (C), EE corrected Cr normalized GABA+ signal (D), and GABA+ signal after choline peak frequency and phase alignment (E). A selected central region spectra set (ON‐pulse, OFF‐pulse, Subtracted) of the final spectral‐spatial data is shown for location7, 9 (F)
Uncorrected GABA+ signal distributions are shown in Figure 3, row B, for all the 5 scans on healthy subjects. The more pronounced choline peak residuals, disabling a fit to the uncorrected GABA+ signals in central voxels, was present for 1 of the 5 healthy subject scans (Figure 3, row B, no. 1). An increase in GABA+ signal toward the left and right VOI edges were a general characteristic across subjects after Cr normalization (Figure 3, row C). A lower spectral quality was observed in some voxels on the VOI edge columns (Supporting Information Figure S1D). A corrected low GABA+ signal centrally in the VOI was further apparent for 2 subjects (Figure 3, row C, no. 2 and no. 4).
4. DISCUSSION
An accelerated edited MRSI technique for spatial mapping of GABA+ signal in the human brain at 7 T was developed. The EPSI MEGA‐sLASER technique was tested in 5 healthy subjects and studied with respect to effects from spatial variations in B 0 and B 1 fields specific to 7 T.
4.1. B1 field strength considerations
Simulation of the edited 3.01‐ppm GABA signal shows that with increased deviation from the normalized B 1 field, the line shapes deteriorate along with the signal amplitude (Figure 2). The maximum observed deviations from the nominal B 1 field strength was –31% and –29% (Supporting Information Table S1), occurring at the VOI edge (Figure 3, row C, no. 3 and no. 5), corresponding to EE correction factors of 1.66 and 1.58, respectively (Supporting Information Table S1). The correction can also be performed for this substantial B 1 field strength deviation of –30%, but the GABA signal line shapes (Figure 2) suggest that corrections may no longer be possible for B 1 field strength deviations beyond –50%. In order to approach full brain coverage, other B 1 compensation techniques will be required.
4.2. B0 field strength considerations
For the 5 subjects, the typical intervoxel B 0 inhomogeneities were spanning ranges of typically 45 to 50 Hz and 6 to 11 Hz before and following (Supporting Information Table S1, Supporting Information Figure 7) the ECC, respectively, with a maximum range of 22 Hz following ECC for subject no. 3. The corresponding intravoxel linewidths were in the range of 5–32 Hz, with a maximum of 46 Hz for subject no. 3 (Supporting Information Table S1, Supporting Information Figure S2). All B 0 inhomogeneities were thereby well within the 200‐ and 100‐Hz bandwidths of the water suppression (VAPOR) and MEGA editing pulses, respectively. Water suppression and MEGA editing were therefore considered unaffected by B 0 inhomogeneities across the image plane in all subjects.
4.3. GABA+ signal and spatial distributions
The voxels on the outermost VOI edge columns with less well separated corrected GABA+ signal were typically associated with a low SNR. The volume selection transition region of the FOCI refocusing pulses could, to some extent, have affected the signal on the outermost VOI edges. A major part of the outermost VOI edge voxels were, however, having a well separated GABA+ signal with a quality comparable to the inner VOI voxels. The central regions where corrected low GABA+ signal were observed for 2 subjects (Figure 3, row C, no. 2 and no. 4) could not be identified as to have insufficient spectrum quality from, for example, B 0 and B 1 field effects or from subject motion, suggesting that they are true reflections of regional variations in GABA+.
4.4. Motion considerations
In the subtracted spectra, subtle motion during scanning is most likely the main source of degradation in terms of frequency and phase shifts around the 3.01‐ppm GABA+ signal (Figure 5D and Supporting Information Figure S1C). Motion artifacts were, to a large extent, corrected by the choline peak FPA (Figure 5E and Supporting Information Figure S1D). Minimization of larger motion artifacts would likely require the technique to be combined with prospective motion correction.10, 21, 22
4.5. Temporal‐spatial gradient readout considerations
The oscillating EP gradient was optimized to allow for full spectral acquisition in a single shot at a spatial resolution permitted by the sensitivity at 7 T, and to minimize the influence of motion on the ON/OFF subtraction pairs. Only the central k‐space is critically sampled, and spectral‐spatial ghosting is thus expected at positions where the signal from off‐resonance metabolites varies abruptly, that is, at the border between cerebrospinal fluid (CSF) and gray matter.23 This was not observed to be problematic in the volunteer measurements for the selected slice, but should be more pronounced near more CSF‐containing regions. Negligible deviations were observed between the spatiotemporal encoding performed by the optimized EP gradient, compared to a corresponding fully phase encoded version of the sequence (chemical shift imaging [CSI] MEGA‐sLASER) in separate phantom verification measurements (data not shown). No significant scanner drift was observed with the optimized EP gradient, although this could lead to significant issues if not accounted for.24
Other oscillating gradient readout acceleration strategies, such as spiral readouts with high acceleration factors, have been shown feasible at lower field strength.10 The higher bandwidth requirements for 7 T may, however, be less straightforward to fulfill with spiral gradient trajectories.
4.6. Total acquisition time and specific absorption rate
The EPSI acceleration factor was 16 compared to a fully phase encoded acquisition (CSI), giving a total acquisition time of 9 min with 4 signal averages for acquiring the GABA+ signal on a 16 × 16 grid. The specific absorption rate (SAR) of the RF pulses was the predominant limiting factor determining the minimum TR for the EPSI MEGA‐sLASER. Shortening of the TR may be possible if less SAR‐restrictive localization schemes are realized. Gradient offset independent adiabaticity pulses exhibit lower power deposition and have successfully been applied at 3 T field strength.10 At 7 T, however, these pulses have a less optimal bandwidth and a compromised spectral transition region as compared to the FOCI pulse shapes, which could have a more pronounced effect on the outermost VOI edges. A novel alternative to the VOI selection technique for avoiding lipid signals could be to use specialized hardware in terms of a separate lipid suppression coil25 in combination with the EP readout, following the MEGA pulse set, while excluding the SAR intense refocusing part of the sequence. This would lead to a further significant reduction of the acquisition time.
5. CONCLUSION
A MEGA‐sLASER sequence was combined with an optimized EP readout for accelerated MRSI while utilizing the high sensitivity at 7 T (EPSI MEGA‐sLASER). The technique was fulfilling the high‐bandwidth demands for 7 T brain spectroscopy and was demonstrated in 5 healthy subjects to provide time‐efficient mapping of regional variations in cerebral GABA+ in a large central VOI with typical spatial B 1 and B 0 field variations. Effects of motion and acquisition instability were considered and could, to a large extent, be retrospectively corrected. Combining the technique with prospective motion correction techniques may lead to further improvements in cases of pronounced motion. The technique is expected to ultimately benefit studies of neurological and psychiatric disorders and healthy brain maturation and aging.
Supporting information
FIGURE S1 Mosaic spectra view of the spatial distributions of the signals for a healthy volunteer test scan (no1), corresponding to Fig. 4, of the ON‐pulse measurement (A), the OFF‐pulse measurement (B), subtracted GABA signal (C), and GABA signal after creatine normalization, EE correction and choline peak frequency and phase alignment (D). Example VOI sub‐region with correctable (D, orange region) remaining choline and creatine residuals in subtracted spectra (C, orange region) is indicated
FIGURE S2 Spatial distributions for the healthy volunteer measurements of the intra‐voxel (creatine peak linewidth) and inter‐voxel (creatine peak frequency offset) B0 inhomogeneity, corresponding to the values in Supporting Information Table S1.
FIGURE S3 Spatial distributions for the healthy volunteer measurements of the editing efficiency (EE) correction factor and the normalized B1 field strength, corresponding to the values in Supporting Information Table S1.
FIGURE S4 Spatial distributions for the healthy volunteer measurements of the errors in the fit to the creatine and corrected GABA+ signals, corresponding to the values in Supporting Information Table S2
ACKNOWLEDGMENTS
This research is supported by the Danish Council for Independent Research grant no. 6111‐00349A, the Danish Agency for Science, Technology and Innovation grant no. 0601‐01370B, and The John and Birthe Meyer Foundation.
Magnusson PO, Boer VO, Marsman A, Paulson OB, Hanson LG, Petersen ET. Gamma‐aminobutyric acid edited echo‐planar spectroscopic imaging (EPSI) with MEGA‐sLASER at 7T. Magn Reson Med. 2019;81:773–780. 10.1002/mrm.27450
Correction added after 15 December 2018. Due to a publisher's error, references to supporting figures were incorrectly changed. Reference to Supporting Information Figure 7 should be Supporting Information Figure S2, Supporting Information Figure 8 should be Supporting Information Figure S3, Supporting Information Figure S9 should be Supporting Information Figure S4. The Supporting Information Table captions have also been added to the list of Supporting Information captions.
REFERENCES
- 1. de Jonge JC, Vinkers CH, Hulshoff Pol HE, Marsman A. GABAergic mechanisms in schizophrenia: linking postmortem and in vivo studies. Front Psych. 2017;8:118. [DOI] [PMC free article] [PubMed] [Google Scholar]
- 2. Pehrson AL, Sanchez C. Altered gamma‐aminobutyric acid neurotransmission in major depressive disorder: a critical review of the supporting evidence and the influence of serotonergic antidepressants. Drug Des Devel Ther. 2015;9:603‐624. [DOI] [PMC free article] [PubMed] [Google Scholar]
- 3. Kaila K, Ruusuvuori E, Seja P, Voipio J, Puskarjov M. GABA actions and ionic plasticity in epilepsy. Curr Opin Neurobiol. 2014;26:34‐41. [DOI] [PubMed] [Google Scholar]
- 4. Helmich RC, Toni I, Deuschl G, Bloem BR. The pathophysiology of essential tremor and Parkinson’s tremor. Curr Neurol Neurosci Rep. 2013;13:378. [DOI] [PubMed] [Google Scholar]
- 5. Gao F, Edden RA, Li M, et al. Edited magnetic resonance spectroscopy detects an age‐related decline in brain GABA levels. NeuroImage. 2013;78:75‐82. [DOI] [PMC free article] [PubMed] [Google Scholar]
- 6. Mescher M, Merkle H, Kirsch J, Garwood M, Gruetter R. Simultaneous in vivo spectral editing and water suppression. NMR Biomed. 1998;11:266‐272. [DOI] [PubMed] [Google Scholar]
- 7. Stephenson MC, Gunner F, Napolitano A, et al. Applications of multi‐nuclear magnetic resonance spectroscopy at 7T. World J Radiol. 2011;3:105‐113. [DOI] [PMC free article] [PubMed] [Google Scholar]
- 8. Near J, Andersson J, Maron E, et al. Unedited in vivo detection and quantification of gamma‐aminobutyric acid in the occipital cortex using short‐TE MRS at 3 T. NMR Biomed. 2013;26:1353‐1362. [DOI] [PubMed] [Google Scholar]
- 9. Andreychenko A, Boer VO, Arteaga de Castro CS, Luijten PR, Klomp DW. Efficient spectral editing at 7 T: GABA detection with MEGA‐sLASER. Magn Reson Med. 2012;68:1018‐1025. [DOI] [PubMed] [Google Scholar]
- 10. Bogner W, Gagoski B, Hess AT, et al. 3D GABA imaging with real‐time motion correction, shim update and reacquisition of adiabatic spiral MRSI. NeuroImage. 2014;103:290‐302. [DOI] [PMC free article] [PubMed] [Google Scholar]
- 11. Posse S, Tedeschi G, Risinger R, Ogg R, Le Bihan D. High speed 1H spectroscopic imaging in human brain by echo planar spatial‐spectral encoding. Magn Reson Med. 1995;33:34‐40. [DOI] [PubMed] [Google Scholar]
- 12. Ordidge RJ, Wylezinska M, Hugg JW, Butterworth E, Franconi F. Frequency offset corrected inversion (FOCI) pulses for use in localized spectroscopy. Magn Reson Med. 1996;36:562‐566. [DOI] [PubMed] [Google Scholar]
- 13. Arteaga de Castro CS, Boer VO, Andreychenko A, et al. Improved efficiency on editing MRS of lactate and gamma‐aminobutyric acid by inclusion of frequency offset corrected inversion pulses at high fields. NMR Biomed. 2013;26:1213‐1219. [DOI] [PubMed] [Google Scholar]
- 14. Klose U. In vivo proton spectroscopy in presence of eddy currents. Magn Reson Med. 1990;14:26‐30. [DOI] [PubMed] [Google Scholar]
- 15. Riddle WR, Gibbs SJ, Willcott MR. Removing effects of eddy currents in proton MR spectroscopy. Med Phys. 1992;19:501‐509. [DOI] [PubMed] [Google Scholar]
- 16. Waddell KW, Avison MJ, Joers JM, Gore JC. A practical guide to robust detection of GABA in human brain by J‐difference spectroscopy at 3 T using a standard volume coil. Magn Reson Imaging. 2007;25:1032‐1038. [DOI] [PMC free article] [PubMed] [Google Scholar]
- 17. Yarnykh VL. Actual flip‐angle imaging in the pulsed steady state: a method for rapid three‐dimensional mapping of the transmitted radiofrequency field. Magn Reson Med. 2007;57:192‐200. [DOI] [PubMed] [Google Scholar]
- 18. Soher BJ, Semanchuk P, Todd D, Steinberg J, Vespa YK. integrated applications for RF pulse design, spectral simulation and MRS data analysis. In Proceedings of 19th Annual Meeting of ISMRM; Montréal; 2011:1410. [Google Scholar]
- 19. Soher BJ, Semanchuk P, Todd D, Young K. Vespa: versatile simulation, pulses and analysis for MR spectroscopy. https://scion.duhs.duke.edu/vespa/project.
- 20. Tkác I, Starcuk Z, Choi IY, Gruetter R. In vivo 1H NMR spectroscopy of rat brain at 1 ms echo time. Magn Reson Med. 1999;41:649‐656. [DOI] [PubMed] [Google Scholar]
- 21. Andersen M, Boer VO, Marsman A, Petersen ET. A generalized prospective motion correction framework for improved spectroscopy, structural and angiographic imaging. In Proceedings of 25th Annual Meeting of ISMRM; Honolulu, Hawaii; 2017:3924. [Google Scholar]
- 22. Marsman A, Boer VO, Andersen M, Petersen ET. Real‐Time Frequency and Motion Corrected Hadamard Encoded Spectral Editing (CHASE). In Proceedings of 25th Annual Meeting of ISMRM; Honolulu, Hawaii; 2017:5493. [Google Scholar]
- 23. Hanson LG, Schaumburg K, Paulson OB. Reconstruction strategy for echo planar spectroscopy and its application to partially undersampled imaging. Magn Reson Med. 2000;44:412‐417. [DOI] [PubMed] [Google Scholar]
- 24. An Z, Tiwari V, Ganji SK, et al. Echo‐planar spectroscopic imaging with dual‐readout alternated gradients (DRAG‐EPSI) at 7 T: application for 2‐hydroxyglutarate imaging in glioma patients. Magn Reson Med. 2018;79:1851‐1861. [DOI] [PMC free article] [PubMed] [Google Scholar]
- 25. Boer VO, van de Lindt T, Luijten PR, Klomp DW. Lipid suppression for brain MRI and MRSI by means of a dedicated crusher coil. Magn Reson Med. 2015;73:2062‐2068. [DOI] [PubMed] [Google Scholar]
Associated Data
This section collects any data citations, data availability statements, or supplementary materials included in this article.
Supplementary Materials
FIGURE S1 Mosaic spectra view of the spatial distributions of the signals for a healthy volunteer test scan (no1), corresponding to Fig. 4, of the ON‐pulse measurement (A), the OFF‐pulse measurement (B), subtracted GABA signal (C), and GABA signal after creatine normalization, EE correction and choline peak frequency and phase alignment (D). Example VOI sub‐region with correctable (D, orange region) remaining choline and creatine residuals in subtracted spectra (C, orange region) is indicated
FIGURE S2 Spatial distributions for the healthy volunteer measurements of the intra‐voxel (creatine peak linewidth) and inter‐voxel (creatine peak frequency offset) B0 inhomogeneity, corresponding to the values in Supporting Information Table S1.
FIGURE S3 Spatial distributions for the healthy volunteer measurements of the editing efficiency (EE) correction factor and the normalized B1 field strength, corresponding to the values in Supporting Information Table S1.
FIGURE S4 Spatial distributions for the healthy volunteer measurements of the errors in the fit to the creatine and corrected GABA+ signals, corresponding to the values in Supporting Information Table S2


