

Abstract
Compositional analyses were performed on samples of rice grain, straw, and derived bran obtained from golden rice event GR2E and near-isogenic control PSBRc82 rice grown at four locations in the Philippines during 2015 and 2016. Grain samples were analyzed for key nutritional components, including proximates, fiber, polysaccharides, fatty acids, amino acids, minerals, vitamins, and antinutrients. Samples of straw and bran were analyzed for proximates and minerals. The only biologically meaningful difference between GR2E and control rice was in levels of β-carotene and other provitamin A carotenoids in the grain. Except for β-carotene and related carotenoids, the compositional parameters of GR2E rice were within the range of natural variability of those components in conventional rice varieties with a history of safe consumption. Mean provitamin A concentrations in milled rice of GR2E can contribute up to 89–113% and 57–99% of the estimated average requirement for vitamin A for preschool children in Bangladesh and the Philippines, respectively.
Keywords: compositional analysis, golden rice, genetically engineered, provitamin A, β-carotene
1. Introduction
Vitamin A refers to a group of fat-soluble retinoids,1 including retinol, retinal, and retinyl esters, that help regulate immune function, reduce morbidity of infectious diseases, and are required for normal functioning of the visual system, maintenance of cell function for growth, epithelial integrity, production of red blood cells, immunity, and reproduction.2 Humans must obtain vitamin A in the diet, either as preformed vitamin A in animal products, such as meat, eggs, and dairy, or as provitamin A carotenoids, mainly β-carotene, in plant products, such as green leafy and many types of yellow-colored vegetables and orange-colored fruit. In Southeast Asian countries, the average per capita rice consumption is 130 kg/year, providing nearly two-thirds of caloric intake.3 The high consumption of rice implies a lack of dietary diversity that in combination with the poor micronutrient content of polished rice in general, and lack of any provitamin A specifically, is a risk factor for vitamin A deficiency (VAD). Prolonged or severe deficiency can lead to disorders such as childhood blindness, anemia, and weakened host resistance to infection, which can increase the severity of infectious diseases and risk of death.4,5
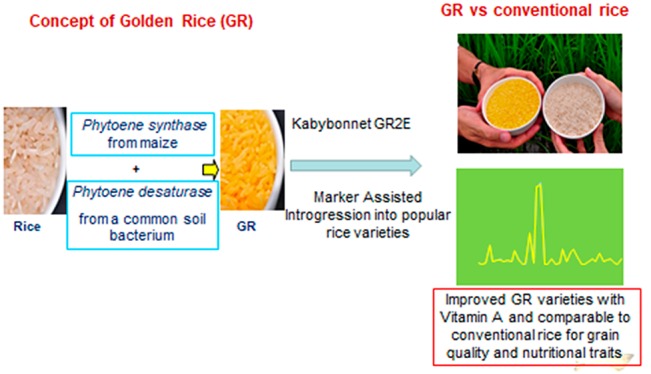
Rice leaves, and indeed the photosynthetic tissues of all plants, produce and accumulate β-carotene. However, rice in its milled form, as it is usually consumed, is characterized by the complete absence of provitamin A carotenoids. The carotenoid biosynthetic pathway in immature rice endosperm functions up to the synthesis of geranylgeranyl diphosphate. While this compound is not solely devoted to carotenogenesis, it can be used as a substrate to produce the uncolored carotenoid phytoene by expressing the heterologous enzyme phytoene synthase (psy) in rice endosperm.6 Completion of the pathway leading to the synthesis of all-trans-lycopene via expression of the phytoene desaturase (crti) gene from Pantoea ananatis was described by Ye et al.7 Initial proof of concept work utilized the psy gene from Narcissus pseudonarcissus (daffodil), which was later found to be rate-limiting for the accumulation of β-carotene. Paine et al.8 described improved constructs incorporating the Zea mays phytoene synthase gene (Zmpsy1) that yielded transformants, including event GR2E, subsequently designated as IR-ØØGR2E-5 based on the unique identification scheme developed by the OECD.9 The GR2E transformation event in the Japonica cultivar Kaybonnet expressed 11.4 μg/g total carotenoids in T2 generation seed, of which ca. 81% were mixed isomers of β-carotene.8
For new varieties without purposefully altered nutritional properties, which include the vast majority of currently authorized genetically engineered crops, the compositional assessment is part of the weight of evidence approach for evaluating whether there were any unanticipated consequences of the genetic modification.10,11 The experience over the past two decades with genetically engineered crop plants with introduced traits conferring insect resistance and/or herbicide tolerance has indicated that the incorporation of these traits has little biologically meaningful effect on the composition of key nutrients and antinutrients.12 As with products of conventional plant breeding, most compositional variation is due to environmental and agronomic factors and the base genetics of the plant variety.13,14
The compositional evaluation of genetically modified crops is to determine any significant changes in nutrient composition in comparison to its traditional counterpart and to assess the safety of the intended or unintended changes.11,15 In order to determine whether the genetic modification resulting in provitamin A biofortified GR2E rice resulted in any additional biologically meaningful changes in key nutrients or antinutrients, comprehensive compositional analyses were performed on samples of paddy rice, straw, and bran derived from GR2E and nontransgenic, near-isogenic, control rice cultivated over two growing seasons in the Philippines during 2015 and 2016 at four locations representing typical rice-growing conditions.
2. Materials and Methods
2.1. Experimental Design
The field phase was conducted over two growing seasons (2015 wet season and 2016 dry season) at four sites in the Philippines: PhilRice-Batac Station, Batac City, Ilocos Norte; Robert S. Zeigler Experimental Station, Los Banos, Laguna; PhilRice Central Experimental Station, Munoz, Nueva Ecija; PhilRice Isabela Station, San Mateo, Isabela. Planting and plot maintenance practices, including pest and disease control measures, were done according to local agronomic practices for rice production. Three blocks (replicates) of each entry (event GR2E in PSBRc82 background and near-isogenic, nontransgenic control PSBRc82) were established at each test site in a randomized complete block design. Each entry was planted in 10-row plots of 5 m in length (20 cm × 20 cm spacing) for a total plot area of 10 m2. There were 25 plants per row, totalling 250 plants per entry per plot.
2.2. Rice (Oryza sativa) Samples
Grain and straw samples were collected from matured rice plants, the stage when typical grain harvest would occur. Grain was collected from at least 150 plants per plot, excluding the outer rows, and pooled into a single sample per plot, totalling three samples per treatment at each location. Straw was collected from at least eight plants per plot, randomly selected and excluding the outer rows, and pooled into a single sample per replicated block. Following collection, samples were shipped frozen to EPL Bio-Analytical Services (Niantic, IL) for processing and analysis.
2.3. Compositional Parameters
Consistent with guidance contained within the OECD consensus document on compositional considerations for new rice varieties,16 the nutrients and antinutrients were analyzed in replicate samples of paddy rice, straw, and bran (Table 1).
Table 1. Compositional Parameters Analyzed in the Paddy Rice, Rice Straw, and Bran of GR2E and Control Rice.
| compound | paddy rice |
|---|---|
| proximates and fiber | moisture, crude protein, crude fat, ash, acid detergent fiber (ADF), neutral detergent fiber fire (NDF), crude fiber fiber, total dietary fiber (TDF), and carbohydrate. |
| minerals | calcium, phosphorus, magnesium, potassium, zinc, manganese, copper, iron, and sodium |
| vitamins | thiamine (B1), riboflavin (B2), niacin (B3), pantothenic acid (B5), pyridoxine (B6), folic acid (B9), and α-tocopherol (E) |
| polysaccharides | total starch and amylose |
| fatty acids | caprylic (C8:0), capric (C10:0), lauric (C12:0), myristic (C14:0), pentadecanoic (C15:0), palmitic (C16:0), palmitoleic (C16:1 Δ9), heptadecanoic (C17:0), stearic (C18:0), oleic (C18:1 Δ9), linoleic (C18:2 Δ9,12), α-linolenic (C18:3 Δ9,12,15), arachidic (C20:0), eicosenoic (C20:1), eicosadienoic (C20:2Δ11,14), eicosatrienoic (C20:3 Δ11,14,17), arachidonic (C20:4 Δ5,8,11,14), behenic (C22:0), erucic (C22:1 Δ13), lignoceric (C24:0), and nervonic (C24:1 Δ15) |
| amino acids | lysine, arginine, glycine, histidine, isoleucine, leucine, phenylalanine, threonine, valine, alanine, aspartic acid, glutamic acid, proline, serine, tyrosine, cysteine, methionine, and tryptophan |
| carotenoids | β-cryptoxanthin, all-trans-α-carotene, all-trans-β-carotene, 9′-cis-β-carotene, and total carotenoids |
| bioactive compounds | phytic acid and trypsin inhibitor |
| compound | rice straw and bran |
|---|---|
| proximates and fiber | moisture, crude protein, crude fat, ash, ADF, NDF, crude fiber, and carbohydrate |
| minerals | calcium and phosphorus |
2.4. Compositional Analyses
With the exception of carotenoids, all compositional analyses were performed by EPL Bio-Analytical Services (Niantic, IL) using methods published by the Association of Official Analytical Chemists (AOAC), the American Oil Chemists’ Society (AOCS), or the American Association of Cereal Chemists (AACC).
2.4.1. Proximate and Mineral Analyses
Samples were analyzed to determine the percentage of moisture by gravimetric measurement of weight loss after drying in a forced air oven. The ash content was determined by gravimetric measurement of the weight loss after ignition in a muffle furnace.17 The analytical procedure for crude protein determination in rice straw, bran, and paddy rice grain utilized an automated Kjeldahl technique based on a method provided by the manufacturer.18 For the determination of crude fat, samples were hydrolyzed with 3 N HCl at 90 °C for 60 or 80 min, respectively, for rice grain or straw and bran. The hydrolysates were extracted with a petroleum ether/ethyl ether/ethyl alcohol solution at 90 °C for 60 min. After extraction, the samples were oven-dried and the crude fat content was determined gravimetrically.19,20 Crude fiber determination in rice grain, straw, and bran was based on methods provided by the manufacturer of the extraction apparatus.21 Samples were analyzed to determine the percentage of neutral detergent fiber (NDF) by digesting with a neutral detergent solution, sodium sulfite, and α-amylase. After the sample was rinsed with water, the remaining residue was dried and weighed to determine the NDF content.22 Acid detergent fiber (ADF) was determined following digestion with an acid detergent solution.23 For the determination of total dietary fiber (TDF) in rice grain, duplicate samples were gelatinized with heat-stable α-amylase and then enzymatically digested with protease and with amyloglucosidase to remove protein and starch, respectively. Soluble dietary fiber was precipitated with ethanol, and the dried residue was quantified gravimetrically. Protein analysis was performed on one of the duplicate samples, while the other duplicate sample was analyzed for ash. The weight of the protein and ash was subtracted from the weight of the residue to yield the weight of TDF.18,24 The carbohydrate (CHO) content of rice straw, bran, and paddy rice grain was calculated using the formula25
Minerals were analyzed by inductively coupled plasma optical emission spectroscopy.26,27
2.4.2. Total Starch and Amylose
The analytical procedure for total starch determination in paddy rice grain was based on a method provided by the AOAC (2000i).28 Nonresistant starch was extracted and converted to d-glucose by using pancreatic α-amylase and amyloglucosidase. Resistant starch was dissolved in 2 M KOH with vigorous stirring, neutralized, and hydrolyzed to d-glucose with amyloglucosidase. The d-glucose in nonresistant and resistant starch was measured with glucose oxidase/peroxidase reagent (GOPOD), and the absorbance was measured on a spectrophotometer at 510 nm. Amylose determination was based on a Megazyme test kit.29 The samples were defatted using ethanol and were treated with Concanavalin-A to precipitate and remove the amylopectin. The amylose was enzymatically hydrolyzed to d-glucose by using α-amylase and amyloglucosidase. The total starch, in a separate aliquot, was similarly hydrolyzed to d-glucose. Both aliquots were measured calorimetrically using GOPOD. The concentration of amylose was estimated as the ratio of GOPOD absorbance at 510 nm for the amylose versus that of starch.
2.4.3. Amino Acids
Along with tryptophan, cysteine, and methionine, 15 additional amino acids were determined. The analytical procedure for amino acid analysis of paddy rice grain samples was based on internationally adopted methods.30,31 Following acid hydrolysis, free acids were converted to their 6-aminoquinolyl-N-hydroxysuccinimidyl carbamate derivatives, which were analyzed by reverse-phase ultrahigh-performance liquid chromatography (UPLC) with UV detection.32m-Tryptophan was determined on the basis of an established LiOH hydrolysis procedure with reverse-phase UPLC with UV detection. Following acid oxidation and hydrolysis, cysteine and methionine were converted to cysteic acid and methionine sulfone, respectively, as above and analyzed by reverse-phase UPLC with UV detection.
2.4.4. Fatty Acids
Following ether extraction and saponification with 0.5 N sodium hydroxide in methanol, free fatty acids were converted to their fatty acid methyl ester (FAME) derivatives and analyzed by GC-FID.33 Fatty acids are reported as percent total fatty acids.
2.4.5. B Vitamins and α-Tocopherol
Thiamine (B1) and riboflavin (B2) were analyzed by reverse-phase HPLC tandem mass spectrometry (MS/MS) following extraction with 10% HOAc/4.3% TCA solution.34 Niacin (B3), pantothenic acid (B5), pyridoxine (B6), and folic acid (B9) were determined using microbiological assays as previously described.35−38 α-Tocopherol was extracted with hot hexane, and the extracts were analyzed by normal-phase UPLC with fluorescence detection.39
2.4.6. Carotenoids
Carotenoids were determined according to Gemmecker et al.40 All work was performed under low-light conditions. Dehulled and polished rice grains were ground to a fine powder, and weighed amounts (target weight 500 mg) were suspended by sonication in 2 mL of distilled water in 15 mL Falcon tubes and incubated for 10 min at 60 °C. Cooled samples were centrifuged (3000g, 5 min) and the pellets extracted with 2 mL of acetone containing 100 μL of a 20 μg/mL stock solution of the lipophilic metalloorganic dye VIS682A (QCR Solutions Corporation) as an internal standard. Following centrifugation, pellets were re-extracted twice with 2 mL of acetone and the resulting supernatant fractions were combined. A 2 mL portion of petroleum ether (PE)/diethyl ether (DE) (2/1 v/v) was added to each combined supernatant fraction (ca. 8 mL), and volumes were adjusted to 14 mL with distilled water. After vortexing, phase separation was achieved by centrifugation (3000g, 5 min). The organic phase was recovered and the aqueous phase re-extracted with another 2 mL of PE/DE (2/1 v/v), followed by centrifugation (3000g, 5 min). The combined organic phases were dried using a vacuum concentrator (Eppendorf Concentrator 5301) and redissolved in 100 μL of chloroform, 5 μL aliquots of which were analyzed by HPLC using a 5 μm (particle size) C30-RP YMC reversed-phase column (150 × 3 mm, i.d.). The separation of carotenoids was achieved with a linear gradient from 57% A to 95% A using the solvent system A, MeOH/methyl tert-butyl ether (MTBE) (1/1), and B, MeOH/MTBE/H2O (5/1/1). Carotenoids were detected at 450 nm and the VIS682A internal standard at 680 nm using a photodiode array detector. Peak areas were converted into amounts using a response curve with β-carotene (Sigma) and normalized to the VIS682A internal standard recovery to account for unspecific losses during sample processing.
2.4.7. Antinutrients
Concentrations of phytic acid and trypsin inhibitor were determined in samples of paddy rice grain using methods published by the AOAC (2000g)41 and AOCS (1997),42 respectively.
2.5. Statistical Analysis
All statistical analyses were conducted43 using the “lmerTest” package. For a given compositional analyte, data were analyzed using the linear mixed model44
where μi denotes the mean of the ith entry (fixed effect), lj denotes the effect of the jth site (random effect), sk denotes the effect of the sth season (random effect), (μL)ij denotes the interaction between the entries and sites (random effect), (μs)ik denotes the interaction between the entries and growing seasons (random effect), (ls)jk denotes the interaction between sites and growing seasons (random effect), (μLs)i denotes the interaction between entries, locations, and growing seasons (random effect), and εijk denotes the residual error (random effect).
The linear mixed effect models “lmer” procedure from the “lmerTest” package was used to fit the linear mixed model and to generate estimates of variance components and p values. For each compositional analyte, the least-squares (LS)-mean value across years and sites was estimated from the corresponding statistical model for GR2E rice and the control PSBRc82 rice using the “lsmeans” package.
2.5.1. Statistical Comparisons and Interpretations
The first step in the evaluation was to test for differences in LS-mean values between GR2E rice and the control PSBRc82 rice. Where a statistically significant difference (p value <0.05) was identified in the multiyear combined-site analysis, further context for interpreting the possible biological significance of the difference was gathered through comparisons with the range of values for each analyte reported in the published literature or available from the ILSI Crop Composition Database.45 Analyte values for GR2E rice that fell within the combined literature range for that analyte were considered to be within the range of normal variability of conventional rice.
3. Results and Discussion
3.1. Proximates, Fiber, and Minerals
Fiber is the predominant form of carbohydrate present in rice straw, with measured fractions comprising neutral detergent fiber (NDF; insoluble lignin, cellulose, and hemicellulose), acid detergent fiber (ADF; cellulose and lignin), and total dietary fiber (TDF) consisting of insoluble and soluble fiber (pectin). The macro minerals include calcium, phosphorus, and potassium. The micronutrient minerals, iron, copper, sodium, and zinc are incorporated in plant tissues in only trace amounts.
In the multiyear combined-site analysis, comparisons of proximates, fiber, and minerals in grain (paddy), straw, and bran samples derived from GR2E and control PSBRc82 rice resulted in no statistically significant differences in any of the measured parameters (Table 2).
Table 2. Proximate, Fiber, and Mineral Composition of Grain, Straw, and Bran Samples Derived from GR2E and Control Rice.
| GR2E |
control
PSBRc82 |
|||||
|---|---|---|---|---|---|---|
| component | meana | range | mean | range | p valueb | lit. rangec |
| Grain Samples | ||||||
| ash (%DB) | 5.89 | (4.95–7.17) | 6.02 | (5.00–7.06) | 0.374 | 3.61–8.6 |
| crude fat (%DB) | 1.42 | (0.84–2.16) | 1.34 | (0.56–1.98) | 0.711 | 0.56–3.47 |
| crude protein (%DB) | 8.1 | (6.07–11.2) | 8.26 | (6.03–11.40) | 0.545 | 5.9–11.8 |
| CHOd(%DB) | 84.6 | (81.0–86.9) | 84.4 | (81.1–86.40) | 0.560 | 80.0–86.4 |
| moisture (%FW) | 12.3 | (11.1–13.8) | 12.3 | (10.9–13.60) | 0.802 | 7.6–28.4 |
| ADF (%DB) | 18.5 | (15.7–21.7) | 17.7 | (15.6–18.80) | 0.352 | 10.8–18.8 |
| NDF (%DB) | 22.1 | (17.5–35.5) | 20.6 | (16.2–32.80) | 0.477 | 15–32.8 |
| crude fiber (%DB) | 12.0 | (10.1–14.6) | 11.1 | (10.1–12.30) | 0.213 | 8.6–18.13 |
| TDF (%DB) | 17.0 | (12.8–20.3) | 16.9 | (11.4–21.40) | 0.955 | 11.4–23.0 |
| amylose (%DB) | 12.9 | (7.31–18.6) | 12.8 | (6.76–18.60) | 0.955 | 6.76–18.6 |
| starch (%DB) | 59.5 | (32.8–71.5) | 61.1 | (28.1–73.90) | 0.689 | 28.1–73.9 |
| Ca (mg/100 g DB) | 22.5 | (14.2–35.0) | 21.4 | (15.3–29.8) | 0.554 | 10–150 |
| Cu (mg/100 g DB) | 0.39 | (0.18–0.68) | 0.37 | (0.22–0.51) | 0.544 | 0.2–1.3 |
| Fe (mg/100 g DB) | 3.96 | (2.37–10.6) | 4.57 | (2.58–9.08) | 0.514 | 1.6–9.08 |
| Mg (mg/100 g DB) | 131 | (87.5–185) | 133 | (102–157) | 0.631 | 30–170 |
| Mn (mg/100 g DB) | 6.61 | (4.33–8.39) | 6.47 | (4.85–7.78) | 0.674 | 2–11.7 |
| P (mg/100 g DB) | 327 | (211–461) | 329 | (241–383) | 0.870 | 190–470 |
| K (mg/100 g DB) | 346 | (236–597) | 339 | (222–472) | 0.666 | 170–472 |
| Na (mg/100 g DB) | 1.5 | (0.56–3.81) | 1.3 | (0.54–3.07) | 0.467 | 0–100 |
| Zn (mg/100 g DB) | 2.31 | (1.63–3.21) | 2.19 | (1.73–2.78) | 0.569 | 0.2–3.6 |
| Straw Samples | ||||||
| ash (%DB) | 25.7 | (21.1–30.4) | 25.3 | (20.6–30.2) | 0.463 | 10.8–24 |
| crude fat (%DB) | 2.58 | (1.31–4.8) | 2.72 | (1.0–6.15) | 0.767 | 0.9–6.15 |
| crude protein (%DB) | 6.13 | (3.16–11.3) | 6.12 | (2.85–10.2) | 0.974 | 2.4–10.2 |
| CHO (%DB) | 66.1 | (60.5–69.2) | 66.4 | (62.1–70.5) | 0.735 | 62.1–81.6 |
| Moisture (%FW) | 12 | (9.24–14) | 12.6 | (8.12–22.1) | 0.593 | 3.5–73.7 |
| ADF (%DB) | 52.6 | (46.1–58.0) | 51.6 | (44.7–59.3) | 0.522 | 36.1–59.3 |
| NDF (%DB) | 62.5 | (56.3–68.9) | 62.2 | (50.2–69.7) | 0.818 | 50.2–78.6 |
| crude fiber (%DB) | 30.1 | (26.9–35.8) | 29.7 | (26.0–34.9) | 0.659 | 26.0–41.5 |
| Ca (g/kg DB) | 3.77 | (1.75–7.06) | 3.64 | (1.79–5.43) | 0.703 | 1.7–5.43 |
| P (g/kg DB) | 1.52 | (0.82–3.61) | 1.47 | (0.81–3.47) | 0.617 | 0.5–3.47 |
| Bran Samples | ||||||
| ash (%DB) | 10.3 | (10.0–10.6) | 11.4 | (10.7–12.0) | 0.281 | 6.5–14 |
| crude fat (%DB) | 24.1 | (23.8–24.4) | 25.3 | (24.6–26.0) | 0.272 | 11.3–26.0 |
| crude protein (%DB) | 15.1 | (14.7–15.6) | 14.6 | (14.1–15.2) | 0.543 | 11.5–18.3 |
| CHO (%DB) | 50.4 | (49.4–51.4) | 48.6 | (47.7–49.5) | 0.315 | 33–63.8 |
| moisture (%FW) | 11.5 | (10.8–12.2) | 11.9 | (10.9–12.9) | 0.782 | 6.9–12.9 |
| ADF (%DB) | 16.0 | (11.6–20.4) | 18.0 | (13.8–22.1) | 0.774 | 6.6–22.1 |
| NDF (%DB) | 23.7 | (23.7–23.8) | 25.8 | (24.0–27.6) | 0.366 | 16.1–29.6 |
| crude fiber (%DB) | 8.97 | (8.31–9.63) | 9.05 | (9.01–9.08) | 0.923 | 5.6–12.2 |
| Ca (g/kg DB) | 0.62 | (0.46–0.77) | 0.59 | (0.55–0.63) | 0.873 | 0.2–2.9 |
| P (g/kg DB) | 25.9 | (25.8–26.0) | 26.7 | (25.5–27.8) | 0.564 | 8.6–27.8 |
Except for bran, values represent the least-squares mean of three replicate samples collected over two growing seasons from each of four locations in the Philippines (n = 24 for each entry). For each analyte, the lowest and highest individual values across years and locations are shown in parentheses. All values are expressed on a dry basis (DB) except for moisture, which is expressed on a fresh weight (FW) basis. Bran samples were produced from composite grain samples pooled across all trial site locations, one each for GR2E and PSBRc82 per year, and means are arithmatic means.
Statistical significance was assigned at p < 0.05. Data from bran samples were analyzed using Student’s t test.
The combined literature range and ILSI crop composition database.45
Abbreviations: CHO = carbohydrate by calculation; ADF = acid detergent fiber; NDF = neutral detergent fiber; TDF = total dietary fiber; DW = dry weight; FW = fresh weight.
3.2. Amino Acids
A comparison of the amino acid composition of event GR2E and control PSBRc82 rice grain is shown in Table 3. Across locations and growing seasons, there were no statistically significant differences in the concentrations of any amino acids between samples of GR2E and control PSBRc82 rice.
Table 3. Amino Acid Composition of Grain Samples Derived from GR2E and Control Rice.
| GR2E |
control
PSBRc82 |
|||||
|---|---|---|---|---|---|---|
| component | meana | range | mean | range | p valueb | lit. rangec |
| Essential Amino Acids (mg/100 g DB) | ||||||
| histidine | 212 | (162–276) | 215 | (157–281) | 0.659 | 140–281 |
| isoleucine | 329 | (241–446) | 332 | (237–464) | 0.787 | 240–460 |
| leucine | 644 | (464–886) | 651 | (462–921) | 0.743 | 460–920 |
| lysine | 299 | (216–443) | 294 | (211–434) | 0.711 | 210–430 |
| methionine | 169 | (124–228) | 166 | (127–215) | 0.602 | 130–310 |
| phenylalanine | 440 | (324–593) | 444 | (317–622) | 0.799 | 280–620 |
| threonine | 309 | (235–400) | 308 | (217–409) | 0.942 | 220–410 |
| tryptophan | 73.4 | (44.2–107) | 74.9 | (50.9–101) | 0.795 | 50–180 |
| valine | 468 | (341–627) | 474 | (338–653) | 0.699 | 340–650 |
| Nonessential Amino Acids (mg/100 g DB) | ||||||
| alanine | 455 | (329–625) | 460 | (331–628) | 0.74 | 330–630 |
| arginine | 564 | (409–737) | 564 | (408–782) | 0.988 | 410–850 |
| aspartic acid | 708 | (493–1010) | 710 | (497–994) | 0.960 | 500–990 |
| cystine | 156 | (117–214) | 155 | (113–198) | 0.767 | 100–260 |
| glutamic acid | 1354 | (942–1980) | 1360 | (890–1990) | 0.898 | 890–1990 |
| glycine | 389 | (293–495) | 393 | (292–511) | 0.716 | 290–510 |
| proline | 376 | (276–510) | 381 | (278–521) | 0.678 | 280–540 |
| serine | 401 | (296–540) | 401 | (231–556) | 0.998 | 230–560 |
| tyrosine | 214 | (158–282) | 207 | (133–291) | 0.531 | 130–480 |
Values represent the least-squares mean of three replicate samples collected over two growing seasons from each of four locations in the Philippines (n = 24 for each entry). For each analyte, the lowest and highest individual values across years and locations are shown in parentheses. All values are expressed on a dry basis (DB).
Statistical significance was assigned at p < 0.05.
The combined literature range was derived from the literature and ILSI crop composition database.45
3.3. Fatty Acids
The complete fatty acid profile of grain from GR2E and control rice was determined, and the results are summarized in Table 4. The concentrations of a number of fatty acids occurring in trace amounts in both GR2E and PSBRc82 control rice grain samples were below the limit of quantification and are not reported (these are itemized in the footnotes to Table 4). In the combined-site analysis over both growing seasons, the only statistically significant difference observed between GR2E and control PSBRc82 rice samples was in the concentration of stearic (C18:0) acid, which was approximately 6.5% higher for GR2E rice but was still within the combined literature range for this parameter.
Table 4. Fatty Acid Composition of Grain Samples Derived from GR2E and Control Rice.
| GR2E |
control
PSBRc82 |
|||||
|---|---|---|---|---|---|---|
| component | meana | range | mean | range | p valueb | lit. rangec |
| Saturated Fatty Acids (% Total Fatty Acids) | ||||||
| myristic (C14:0) | 0.44 | (0.35–0.52) | 0.39 | (0.25–0.49) | 0.198 | 0.25–1.10 |
| palmitic (C16:0) | 19.50 | (18.80–20.40) | 18.5 | (15.8–19.1) | 0.222 | 14.90–31.20 |
| stearic (C18:0) | 2.25 | (1.95–2.78) | 2.11 | (1.71–2.68) | 0.049 | 1.50–2.80 |
| arachidic (C20:0) | 0.86 | (0.74–0.99) | 0.89 | (0.74–1.02) | 0.197 | 0.40–1.02 |
| behenic (C22:0) | 0.51 | (0.41–0.59) | 0.54 | (0.48–0.61) | 0.142 | 0.20–0.82 |
| lignoceric (C24:0) | 0.93 | (0.69–1.25) | 1.00 | (0.81–1.19) | 0.116 | 0.40–1.34 |
| Unsaturated Fatty Acids (% Total Fatty Acids) | ||||||
| palmitoleic (C16:1) | 0.19 | (0.16–0.22) | 0.19 | (0.15–0.22) | 0.361 | 0.10–0.93 |
| oleic (C18:1) | 39.70 | (38.40–41.30) | 40.20 | (38.4–45.9) | 0.487 | 30.90–45.90 |
| linoleic (C18:2) | 33.5 | (32.40–34.40) | 34.00 | (30.1–35.4) | 0.394 | 26.10–39.00 |
| α-linolenic (C18:3) | 1.63 | (1.34–2.31) | 1.64 | (1.27–2.7) | 0.887 | 0.90–2.70 |
| eicosenoic (C20:1) | 0.48 | (0.41–0.54) | 0.52 | (0.44–0.77) | 0.286 | 0.40–0.77 |
Values represent the least-squares mean of three replicate samples collected over two growing seasons from each of four locations in the Philippines (n = 24 for each entry). For each analyte, the lowest and highest individual values across years and locations are shown in parentheses. The concentrations of the following fatty acids were below the lower limit of quantification and are not reported: caprylic (C8:0); capric (C10:0); lauric (C12:0); pentadecanoic (C15:0); heptadecanoic (C17:0); eicosadienoic (C20:2); eicosatrienoic (C20:3); arachidonic (C20:4); erucic (C22:1); nervonic (C24:1).
Statistical significance was assigned at p < 0.05.
The combined literature range ILSI crop composition database.45
3.4. Vitamins, Carotenoids, and Antinutrients
Samples of event GR2E and control PSBRc82 rice grain were analyzed for concentrations of the water-soluble B vitamins (thiamine, riboflavin, niacin, pantothenic acid, pyridoxine, and folic acid) and α-tocopherol (vitamin E). With the exception of riboflavin, where concentrations were below the limit of quantification (LOQ) for all samples, there were no statistically significant differences noted in concentrations of B vitamins and vitamin E between GR2E and control PSBRc82 rice (Table 5). Samples of milled rice prepared from grain (paddy) samples were also analyzed at IRRI for β-carotene and other provitamin A carotenoids. In these analyses, the concentrations of all-trans-β-carotene ranged between 1.96 and 7.31 μg/g across locations and years (Table 5) and on average comprised ca. 59% of the total carotenoids as determined by HPLC. Concentrations of provitamin A carotenoids in samples derived from control PSBRc82 rice were below the LOQ in each case.
Table 5. Concentrations of Vitamins, Carotenoids, and Antinutrients in Grain Samples Derived from GR2E and Control Rice.
| GR2E |
control |
|||||
|---|---|---|---|---|---|---|
| component | meana | range | mean | range | p valueb | lit. rangec |
| Vitamins (mg/kg DB) | ||||||
| thiamine (B1) | 3.13 | (2.33–3.77) | 3.08 | (2.35–3.81) | 0.634 | 2.35–6.25 |
| niacin (B3) | 36.9 | (23.4–58.3) | 32.6 | (20.2–48.8) | 0.417 | 20.2–65 |
| pantothenic acid (B5) | 9.15 | (7.31–11.9) | 9.13 | (7.22–11.4) | 0.929 | 7.22–14.0 |
| pyridoxine (B6) | 2.72 | (2.22–3.3) | 2.75 | (2.1–5.42) | 0.919 | 2.1–8.0 |
| folic acid (B9) | 0.91 | (0.56–2.56) | 0.88 | (0.39–1.54) | 0.881 | 0.39–1.54 |
| α-tocopherol | 2.98 | (2.47–3.87) | 2.75 | (2.1–3.5) | 0.336 | 2.1–23 |
| Carotenoids (mg/kg DB) | ||||||
| β-cryptoxanthin | 0.31 | (0.23–0.46) | <LOQd | |||
| all-trans-α-carotene | 0.71 | (0.35–1.32) | <LOQ | |||
| all-trans-β-carotene | 3.57 | (1.96–7.31) | <LOQ | |||
| 9′-cis-β-carotene | 0.76 | (0.5–1.32) | <LOQ | |||
| total carotenoids | 5.88 | (3.5–10.9) | <LOQ | |||
| Antinutrients | ||||||
| phytic acid (%DB) | 0.86 | (0.58–1.1) | 0.88 | (0.61–1.23) | 0.622 | 0.6–1.23 |
| trypsin inhibitor (TIU/mg) | 0.92 | (0.28–1.71) | 1.0 | (0.03–4.17) | 0.828 | 0.03–4.17 |
Values represent the least-squares mean of three replicate samples collected over two growing seasons from each of four locations in the Philippines (n = 24 for each entry). For each analyte, the lowest and highest individual values across years and locations are shown in parentheses. Values for riboflavin (vitamin B2) were below the LOQ of 0.9 mg/kg dry weight for all samples tested and are not included in this table.
Statistical significance was assigned at p < 0.05.
The combined literature range and ILSI crop composition database.45
LOQ = limit of quantification.
Rice contains few compounds that are not favorable for human or animal nutrition, and these are generally not present at concentrations that would raise any safety concerns.16 Both phytic acid and trypsin inhibitors are considered antinutritional factors present in a range of food crops, including rice.
Phytic acid (inositol hexakisphosphate; phytate when in salt form) is the main storage form of phosphorus in plant tissues, which is not in a bioavailable form for monogastric animals that lack the digestive enzyme phytase. Phytic acid also has strong binding affinity to important minerals such as calcium, magnesium, iron, and zinc, thus reducing the absorption of these minerals.
Trypsin inhibitors are proteins known to interfere with digestion and ultimately absorption of food material and are typical antinutritional components in soybeans, cereals, and potatoes.16 In rice, both phytic acid and trypsin inhibitors are mainly concentrated in the bran, which is a component of rice grain (paddy).
Grain samples from GR2E and control PSBRc82 rice were analyzed for phytic acid and trypsin inhibitor activity. There were no statistically significant differences in the concentrations of phytic acid or in the levels of trypsin inhibitor between samples of GR2E and PSBRc82 control rice (Table 5).
3.5. Nutritional Effect of Elevated β-Carotene in GR2E Rice
β-Carotene is the major carotenoid present in the human diet and is an effective source of vitamin A in both conventional foods and vitamin supplements. It is generally considered virtually nontoxic because humans tolerate high dietary dosages without apparent harm46 and there are no reports of adverse effects arising from the consumption of naturally occurring β-carotene in food. There is similarly no evidence that conversion of β-carotene to vitamin A contributes to vitamin A toxicity, even when β-carotene is ingested in large amounts. Standard toxicological tests, including teratogenic, mutagenic, and carcinogenic assays, have been performed on β-carotene without any evidence of harmful effects, as reviewed in ref (47).
On the basis of a pooled analysis of 10 prospective cohort studies in North America and Europe that included more than 500000 women, the mean daily intake of β-carotene is in the range of 2.7–6.4 mg.48 Other data from the National Health and Nutrition Examination Survey (NHANES) published by the US Department of Agriculture indicate that average daily intake of β-carotene from food sources by adult men and women living in the United States is ca. 2.5 mg.
The conversion efficiency of dietary β-carotene to retinol is in the range of (3.6–28):1 by weight49 and is greatly influenced by the type of study, the vitamin A status, disease and genetic background of the individuals under study, and the food matrix. Rice has a simple and easily digestible food matrix, which allows for a high bioavailability and bioconversion of β-carotene to vitamin A. The bioconversion efficiency of β-carotene in golden rice was found to be 3.8:1 for healthy adults50 and 2.3:1 for children in China.51 A bioconversion efficiency of 4.4:1 was reported for β-carotene biofortified cassava52 and 3.2:1 for yellow maize with high β-carotene.53 A vitamin A equivalency for β-carotene of approximately 4:1 is applicable for biofortified cassava, yellow maize, and golden rice.54
Using mean concentrations of all-trans-β-carotene (3.57 mg/kg) measured in samples of milled rice, it was estimated that substitution of total daily rice consumption with rice containing event GR2E could potentially contribute 89–113% and 57–99% of the estimated average requirement (EAR) for vitamin A for children in Bangladesh and the Philippines, respectively (Table 6). Expressed another way, a 100 g (uncooked weight) portion of GR2E rice could supply 30–40% of the recommended daily intake (RDI) of vitamin A for children and 11–13% of the RDI for nonpregnant or pregnant adult women.
Table 6. Potential Contribution of Rice Containing Event GR2E to Meeting Vitamin A Needs in Bangladesh and the Philippines.
| mean daily rice consumption (g, raw)a | EARb (μg/day RAEc) | RDId (μg/day RAE) | β-carotene equive from GR2E Rice (μg/day) | % of EARf | % of RDI | |
|---|---|---|---|---|---|---|
| Bangladesh | ||||||
| preschool-aged children | 157 | 210 | 300 | 561 | 89 | 62 |
| school-aged children (6–14 years) | 261 | 275 | 400 | 932 | 113 | 78 |
| nonpregnant, nonlactating women (15–49 years) | 360 | 500 | 700 | 1285 | 64 | 46 |
| Philippines | ||||||
| preschool-aged children (6 months–5 years) | 100 | 210 | 300 | 357 | 57 | 40 |
| school-aged children (6–12 years) | 229 | 275 | 400 | 818 | 99 | 68 |
| adult (19–59 years) | 332 | 500 | 700 | 1186 | 59 | 42 |
| pregnant women | 287 | 550 | 800 | 1025 | 47 | 32 |
| lactating women | 342 | 800 | 1100 | 1221 | 38 | 28 |
Mean daily rice consumption data for Bangladesh and the Philippines were from Leyvraz et al.55 and the seventh National Nutrition Survey published by the Food and Nutrition Research Institute of the Philippines (http://www.fnri.dost.gov.ph/index.php/19-nutrition-statistic/108-seventh-national-nutrition-survey), respectively .
The EAR (estimated average requirement) is the median daily intake value that is estimated to meet the requirement of half the healthy individuals in a life-stage and gender group. At this level of intake, the other half of the individuals in the specified group would not have their needs met. The EAR is used to calculate the RDI. It is also used to assess the adequacy of nutrient intakes and can be used to plan the intake of groups. Values for EAR and RDI were taken from the nutrient reference values for Australia and New Zealand (https://www.nrv.gov.au/nutrients/vitamin-a).
RAE = retinol activity equivalent.
The RDI (recommended daily intake) is the average daily dietary intake level that is sufficient to meet the nutrient requirement of nearly all (97–98%) healthy individuals in a particular life-stage and gender group. The RDI is the goal for usual intake by an individual.
β-Carotene equivalent units were calculated by summing the mean concentration of all-trans-β-carotene and half the mean concentrations of other provitamin A carotenoids (e.g., all-trans-α-carotene, β-cryptoxanthin, and other isomers of β-carotene) measured in samples of milled GR2E rice (Table 5). This was to take into account that the conversion efficiency of these latter carotenoids is approximately 50% of all-trans-β-carotene (i.e.: 3.57 + (0.5 × (0.31 + 0.71 + 0.76)) = 4.46 μg/g). The values for β-carotene equivalents were further adjusted to reflect ca. 20% loss during cooking (unpublished data, IRRI).
Practically, nutritional effects will be significantly influenced by substitution rates of conventional rice with rice containing event GR2E, varietal (background germplasm) effects on provitamin A expression, actual bioconversion efficiency in target populations, and the known loss of β-carotene over time due to storage, processing, and cooking methods. Assessment of the realistically achievable contribution of rice varieties containing event GR2E to improving vitamin A status in at-risk populations will require additional bioefficacy testing that can only be accomplished following the regulatory authorization of event GR2E for food use in the target geographies.
Over all, among the 62 compositional parameters quantified in samples derived from GR2E rice grain, and components that were measured in samples of straw and derived bran, there were no meaningful differences between GR2E and control rice, except for the intended production of provitamin A carotenoids measured in milled GR2E rice. With the exception of provitamin A carotenoids, the compositional parameters measured in samples of GR2E rice were within or similar to ranges reported in the literature for conventional rice varieties with a history of safe consumption. In those instances where the analyte concentrations measured for GR2E rice were slightly outside the combined literature range for that parameter, there were no significant differences between GR2E rice and the control rice. Overall, no consistent patterns emerged to suggest that biologically meaningful changes in composition or nutritive value of the grain, straw, or bran had occurred as an unexpected, unintended, consequence of the genetic modification. Other than the intended production of β-carotene and related provitamin A carotenoids in the endosperm, GR2E rice was found to be compositionally equivalent to conventional rice.
Acknowledgments
This research was supported by the Bill & Melinda Gates Foundation, Seattle, WA (Global Development Grant Number OPPGD1383) and by the United States Agency for International Development.
The authors declare no competing financial interest.
References
- Bates C. (1995). Vitamin A. Lancet 1995, 345, 31–35. 10.1016/S0140-6736(95)91157-X. [DOI] [PubMed] [Google Scholar]
- Sommer A.; West K. P.. Vitamin A Deficiency: Health, Survival, and Vision; Oxford University Press: New York. 1996. [Google Scholar]
- De Pee S. Proposing nutrients and nutrient levels for rice fortification. Ann. N. Y. Acad. Sci. 2014, 1324, 55–66. 10.1111/nyas.12478. [DOI] [PubMed] [Google Scholar]
- Scrimshaw N. S.; SanGiovanni J. P. Synergism of nutrition, infection, and immunity: an overview. Am. J. Clin. Nutr. 1997, 66, 464S–477S. 10.1093/ajcn/66.2.464S. [DOI] [PubMed] [Google Scholar]
- Christian P.; Schulze K.; Stoltzfus R. J.; West K. P. Hyporetinolemia, illness symptoms, and acute phase protein response in pregnant women with and without night blindness. Am. J. Clin. Nutr. 1998, 67, 1237–43. 10.1093/ajcn/67.6.1237. [DOI] [PubMed] [Google Scholar]
- Burkhardt P. K.; Beyer P.; Wünn J.; Kloti A.; Armstrong G. A.; Schledz M.; Von Lintig J. Transgenic rice (Oryza sativa) endosperm expressing daffodil (Narcissus pseudonarcissus) phytoene synthase accumulates phytoene, a key intermediate of provitamin A biosynthesis. Plant Journal 1997, 11, 1071–1078. 10.1046/j.1365-313X.1997.11051071.x. [DOI] [PubMed] [Google Scholar]
- Ye X.; Al-Babili S.; Kloti A.; Zhang J.; Lucca P.; Beyer P.; Potrykus I. Engineering the provitamin A (beta-carotene) biosynthetic pathway into (carotenoid-free) rice endosperm. Science (New York, N.Y.) 2000, 287, 303–305. 10.1126/science.287.5451.303. [DOI] [PubMed] [Google Scholar]
- Paine J.; Shipton C.; Chaggar S.; Howells R. M.; Kennedy M. J.; Vernon G.; Wright S. Y.; Hinchliffe E.; Adams J. L.; Silverstone A. L.; Drake R. Improving the nutritional value of Golden Rice through increased pro-vitamin A content. Nat. Biotechnol. 2005, 23, 482–487. 10.1038/nbt1082. [DOI] [PubMed] [Google Scholar]
- OECD . Guidance for the designation of a unique identifier for transgenic plants. Technical Report ENV/JM/MONO (2002)7; Organization for Economic Cooperation and Development: Paris, France, 2002.
- OECD . Safety evaluation of foods derived by modern biotechnology: concepts and principles. Technical Report; Organisation for Economic Cooperation and Development: 1993.
- Codex . Guideline for the conduct of food safety assessment of foods derived from recombinant-DNA plants CAC/GL45-2003; 2003.
- Herman R. A.; Price W. D. Unintended compositional changes in genetically modified (GM) crops: 20 years of research. J. Agric. Food Chem. 2013, 61, 11695–701. 10.1021/jf400135r. [DOI] [PubMed] [Google Scholar]
- Harrigan G. G.; Stork L. G.; Riordan S. G.; Reynolds T. L.; Ridley W. P.; Masucci J. D.; MacIsaac S.; Halls S. C.; Orth R.; Smith R. G.; Wen L.; Brown W. E.; Welsch M.; Riley R.; McFarland D.; Pandravada A.; Glenn K. C. Impact of genetics and environment on nutritional and metabolite components of maize grain. J. Agric. Food Chem. 2007, 55, 6177–6185. 10.1021/jf070494k. [DOI] [PubMed] [Google Scholar]
- Ricroch A. E. Assessment of GE food safety using ’-omics’ techniques and long-term animal feeding studies. New Biotechnol. 2013, 30, 349–354. 10.1016/j.nbt.2012.12.001. [DOI] [PubMed] [Google Scholar]
- Jiao Z.; Si X.X.; Li G. K.; Zhang Z. M.; Xu X. P. Unintended Compositional Changes in Transgenic Rice Seeds (Oryza sativa L.) Studied by Spectral and Chromatographic Analysis Coupled with Chemometrics Methods. J. Agric. Food Chem. 2010, 58, 1746–1754. 10.1021/jf902676y. [DOI] [PubMed] [Google Scholar]
- OECD . Revised consensus document on compositional considerations for new varieties of rice (Oryza sativa): key food and feed nutrients, anti-nutrients and other constituents. Technical Report; Organization for Economic Cooperation and Development: Paris, France, 2016.
- AOAC . Ash of flour. Method 923.03. In Horowitz W. (Ed.), Official Methods of Analysis of AOAC International. Association of Official Analytical Chemists International, Gaithersburg, MD. (17th ed.). 2000. b. [Google Scholar]
- Protein determination. In Kjeltec 8400 Analyzer Unit User Manual; FOSS Analytical: Ḧogan̈as, Sweden, 2010. [Google Scholar]
- AOCS . Rapid determination of oil/fat utilizing high temperature solvent extraction. Method Am 5-04. In Official Methods and Recommended Practices of the American Oil Chemists’ Society, 6th ed.; Firestone D., Ed.; American Oil Chemists Society: Champaign, IL, 2009. [Google Scholar]
- Ankom Technology . ANKOMXT15 Extraction System Operator’s Manual; Ankom Technology: Macedon, NY. 2008. b. [Google Scholar]
- Ankom Technology . Crude fiber analysis. In ANKOM2000 Fiber Analyzer Operator’s Manual; Ankom Technology: Macedon, NY. 2011; pp 23–29. [Google Scholar]
- Ankom Technology . Neutral detergent fiber in feeds filters bag technique. In ANKOM200 Fiber Analyzer Operator’s Manual; Ankom Technology: Macedon, NY, 2010. c, pp 27–28. [Google Scholar]
- Ankom Technology . Acid detergent fiber in feeds filters bag technique. In ANKOM200 Fiber Analyzer Operator’s Manual. Ankom Technology: Macedon, NY, 2010a; pp 21–22. [Google Scholar]
- Ankom Technology . TDF analysis. In ANKOM Dietary Fiber Analyzer Operator’s Manual; Ankom Technology: Macedon, NY, 2012; pp 31–45. [Google Scholar]
- USDA . Energy value of foods. In Agricultural Handbook; United States Department of Agriculture: Washington, DC, 1973; Vol. 74, pp 2–11. [Google Scholar]
- CEM . Operation Manual; CEM Corporation: Matthews, NC, 2004. [Google Scholar]
- AOAC . Determination of lead, cadmium, copper, iron and zinc in foods. Method 999.11. In Official Methods of Analysis of AOAC International, 17th ed.; Horowitz W., Ed.; Association of Official Analytical Chemists International: Gaithersburg, MD, 2000. c. [Google Scholar]
- AOAC . Starch (Total) in Cereal Products. Method 996.11. In Official Methods of Analysis of AOAC International, 17th ed.; Horowitz W., Ed.; Association of Official Analytical Chemists International: Gaithersburg, MD, 2000i. [Google Scholar]
- Megazyme . Amylose/Amylopectin Assay Procedure (K-AMYL 07/11). Megazyme: Bray Business Park, Bray, CO, 2011.
- Hong J. L. Determination of amino acids by pre column derivatization with 6-aminoquinolyl-N-hydroxysuccinimidyl carbamate and high-performance liquid chromatography with ultraviolet detection. J. Chromatogr. A 1994, 670, 59–66. 10.1016/0021-9673(94)80280-7. [DOI] [Google Scholar]
- AOAC . Amino acids in feeds. Method 994.12. In Official Methods of Analysis of AOAC International, 17th ed.; Horowitz W., Ed.; Association of Official Analytical Chemists International: Gaithersburg, MD, 2000. a. [Google Scholar]
- Rogers S.; Pesti G. Determination of tryptophan from feedstuffs using reverse phase high-performance liquid chromatography. J. Micronutr. Anal. 1990, 7, 27–35. [Google Scholar]
- AOAC . Fat acidity-grains. Method 939.05. In Official Methods of Analysis of AOAC International, 17th ed.; Horowitz W., Ed.; Association of Official Analytical Chemists International: Gaithersburg, MD, 2000. d. [Google Scholar]
- AOAC . Ash of flour. Method 923.03. In Official Methods of Analysis of AOAC International, 17th ed.; Horowitz W., Ed.; Association of Official Analytical Chemists International: Gaithersburg, MD, 2000. b. [Google Scholar]
- AACC . Niacin-microbiological method. Method 86–51. In Approved Methods of the American Association of Cereal Chemists, 10th ed.; American Association of Cereal Chemists, St. Paul, MN, 2000. a. [Google Scholar]
- AOAC . Pantothenic acid in vitamin preparations. Method 945.74. In Official Methods of Analys of AOAC International, 17th ed.; Horowitz W., Ed.; Association of Official Analytical Chemists International: Gaithersburg, MD. 2000. f. [Google Scholar]
- AACC . Vitamin B6 complex-microbiological method. Method 86-31. In Approved Methods of the American Association of Cereal Chemists, 10th ed.; American Association of Cereal Chemists: St. Paul, MN, 2000. d. [Google Scholar]
- AACC . Total folate in cereal products-microbiological assay using trienzyme extraction. Method 86-47. In Approved Methods of the American Association of Cereal Chemists, 10th ed.; American Association of Cereal Chemists: St. Paul, MN, 2000. c. [Google Scholar]
- Amaral J. Simultaneous determination of tocopherols and tocotrienols in hazelnuts by a normal phase liquid chromatographic method. Anal. Sci. 2005, 21, 1545–1548. 10.2116/analsci.21.1545. [DOI] [PubMed] [Google Scholar]
- Gemmecker S.; Schaub P.; Koschmieder J.; Brausemann A.; Drepper F.; Rodriguez-Franco M.; Ghisla S.; Warscheid B.; Einsle O.; Beyer P. Phytoene desaturase from Oryza sativa: oligomeric assembly, membrane association and preliminary 3D-analysis. PLoS One 2015, 10, e0131717 10.1371/journal.pone.0131717. [DOI] [PMC free article] [PubMed] [Google Scholar]
- AOAC . Phytate in foods. Method 986.11. In Official Methods of Analysis of AOAC international, 17th ed.; Horowitz W., Ed.; Association of Official Analytical Chemists International: Gaithersburg, MD, 2000. g. [Google Scholar]
- AOCS . Trypsin inhibitor activity. Method Ba 12–75. In Official Methods and Recommended Practices of the American Oil Chemists’ Society, 5th ed.; Firestone D., Ed.; American Oil Chemists Society: Champaign, IL, 1997. [Google Scholar]
- R Core Team . R: A language and environment for statistical computing. Technical Report; R Foundation for Statistical Computing: Vienna, Austria. 2015. URL: http://www.r-project.org/.
- Bates D.; Maechler M.; Bolker B.; Walker S.. lme4: Linear mixed-effects models using Eigen and S4. R package version 1.0-6. 2014. URL: http://cran.r-project.org/package=lme4.
- ILSI . Crop Composition Database, Version 7.0. 2019. URL: http://www.cropcomposition.org.
- Hathcock J. N.; Hattan D. G.; Jenkins M. Y.; McDonald J. T.; Sundaresan P. R.; Wilkening V. L. Evaluation of vitamin A toxicity. Am. J. Clin. Nutr. 1990, 52, 183–202. 10.1093/ajcn/52.2.183. [DOI] [PubMed] [Google Scholar]
- Scientific Opinion on the re-evaluation of mixed carotenes (E 160a (i)) and beta-carotene (E 160a (ii)) as a foodadditive. EFSA Journal 2012, 10, 2593. 10.2903/j.efsa.2012.2593. [DOI] [Google Scholar]
- Koushik A.; Hunter D. J.; Spiegelman D.; Anderson K. E.; Buring J. E.; Freudenheim J. L.; Goldbohm R. A.; Hankinson S. E.; Larsson S. C.; Leitzmann M.; Marshall J. R.; McCullough M.; Miller A. B.; Rodriguez C.; Rohan T. E.; Ross J. A.; Schatzkin A.; Schouten L. J.; Willett W. C.; Wolk A.; Zhang S. M.; Smith-Warner S. A. Intake of the major carotenoids and the risk of epithelial ovarian cancer in a pooled analysis of 10 cohort studies. Int. J. Cancer 2006, 119, 2148–2154. 10.1002/ijc.22076. [DOI] [PubMed] [Google Scholar]
- Tang G. Bioconversion of dietary provitamin A carotenoids to vitamin A in humans. Am. J. Clin. Nutr. 2010, 91, 1468S–1473S. 10.3945/ajcn.2010.28674G. [DOI] [PMC free article] [PubMed] [Google Scholar]
- Tang G.; Tang G.; Qin J.; Dolnikowski G. G.; Russell R. M.; Grusak M. A. Golden rice is an effective source of vitamin A. Am. J. Clin. Nutr. 2009, 89 (6), 1776–1783. 10.3945/ajcn.2008.27119. [DOI] [PMC free article] [PubMed] [Google Scholar]
- Tang G.; Hu Y.; Yin S.; Wang Y.; Dallal G. E.; Grusak M. A.; Russell R. M. β-carotene in Golden Rice is as good as β-carotene in oil at providing vitamin A to children. Am. J. Clin. Nutr. 2012, 96, 658–664. 10.3945/ajcn.111.030775. [DOI] [PMC free article] [PubMed] [Google Scholar] [Retracted]
- La Frano M. R.; Woodhouse L. R.; Burnett D. J.; Burri B. J. Biofortified cassava increases β-carotene and vitamin A concentrations in the TAG-rich plasma layer of American women. Br. J. Nutr. 2013, 110 (2), 310–20. 10.1017/S0007114512005004. [DOI] [PubMed] [Google Scholar]
- Muzhingi T.; Gadaga T. H.; Siwela A. H.; Grusak M. A.; Russell R. M.; Tang G. Yellow maize with high beta-carotene is an effective source of vitamin A in healthy Zimbabwean men. Am. J. Clin. Nutr. 2011, 94 (2), 510–519. 10.3945/ajcn.110.006486. [DOI] [PMC free article] [PubMed] [Google Scholar]
- Van Loo-Bouwman C. A.; Naber T. H. J.; Schaafsma G. A review of vitamin A equivalency of β-carotene in various food matrices for human consumption. Br. J. Nutr. 2014, 111 (12), 2153–2166. 10.1017/S0007114514000166. [DOI] [PubMed] [Google Scholar]
- Leyvraz M.; Laillou A.; Rahman S.; Ahmed T.; Rahman A. S.; Alam N.; Ireen S.; Panagides D. An assessment of the potential impact of fortification of staples and condiments on micronutrient intake of young children and women of reproductive age in Bangladesh. Nutrients 2016, 8, 541. 10.3390/nu8090541. [DOI] [PMC free article] [PubMed] [Google Scholar]